
The Daily Shot: 28-May-24
• The United States
• Canada
• The United Kingdom
• The Eurozone
• Europe
• Japan
• China
• Emerging Markets
• Cryptocurrency
• Commodities
• Equities
• Credit
• Global Developments
• Food for Thought
The United States
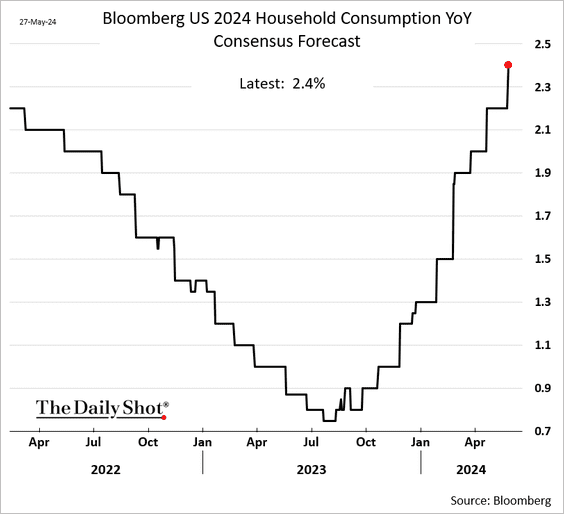
1. Let’s begin with Bloomberg’s latest US economic survey results for 2024.
• Economists are increasingly bullish on consumer spending growth this year.
• Business investment projections are also getting upgraded.

• The average monthly job gains estimates for this year are nearing 180k.

• Estimates for growth in imports and exports have diverged.
 Source: @TheTerminal, Bloomberg Finance L.P.
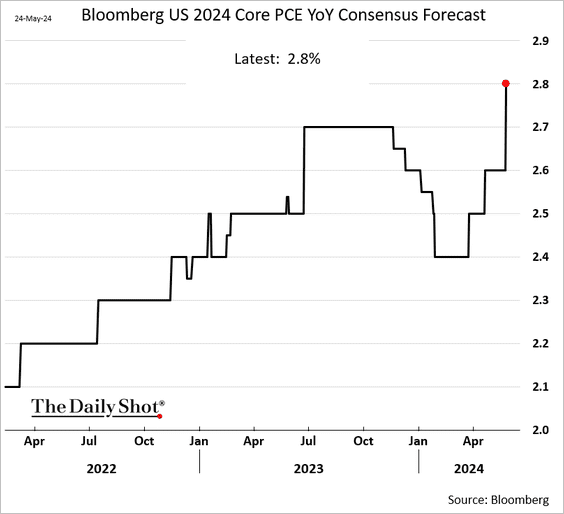
• Economists keep increasing their projections for this year’s core PCE inflation.
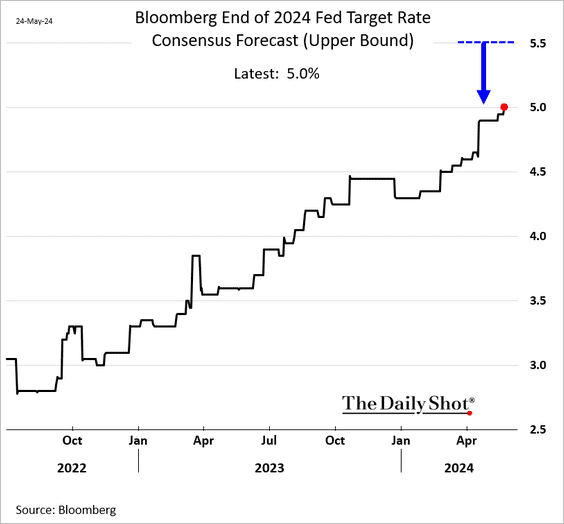
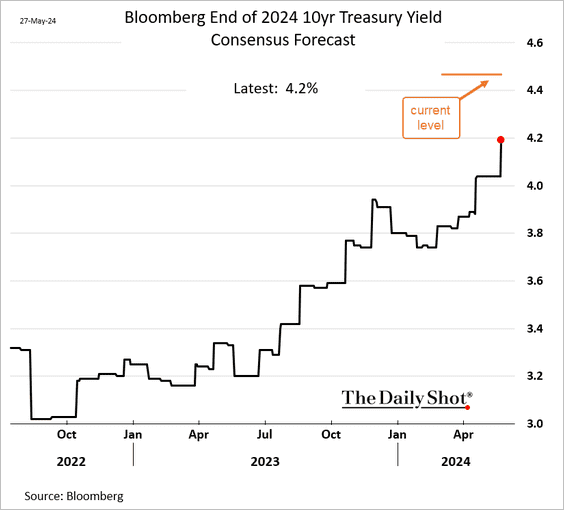
• Forecasters now see only two Fed rate cuts this year, …
… and they continue to move up their projections for the 10-year Treasury yield.
——————–
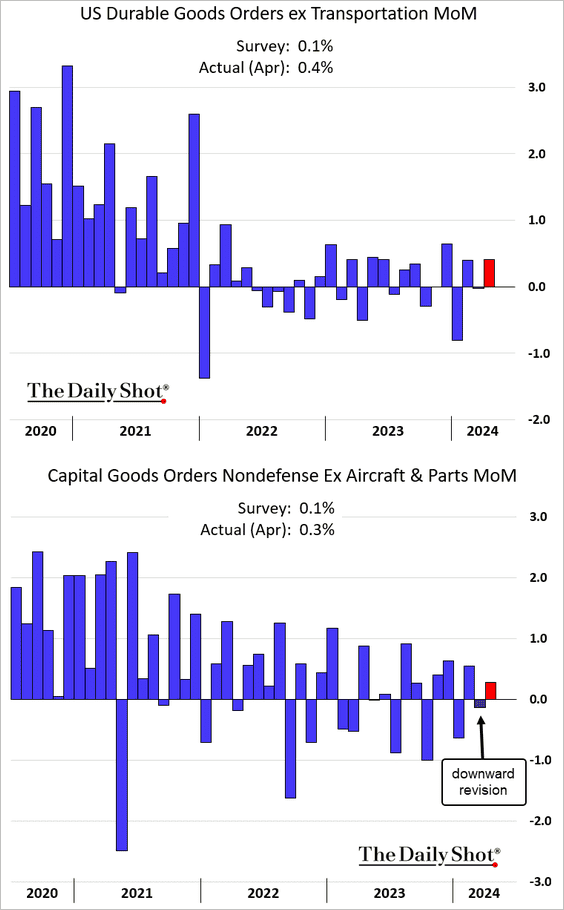
2. Durable goods orders increased last month, but the March figures were revised lower.
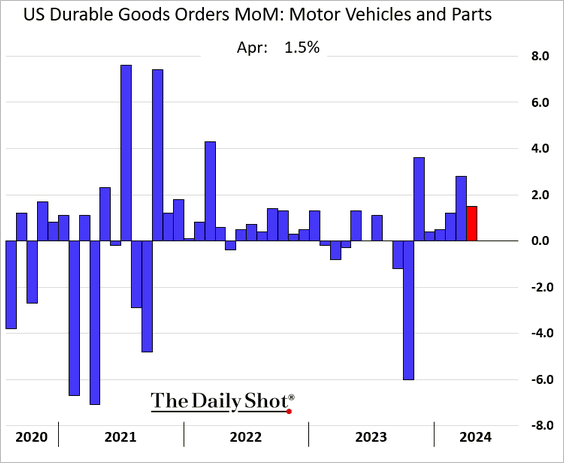
• Wholesale vehicle orders have been up for six months in a row.
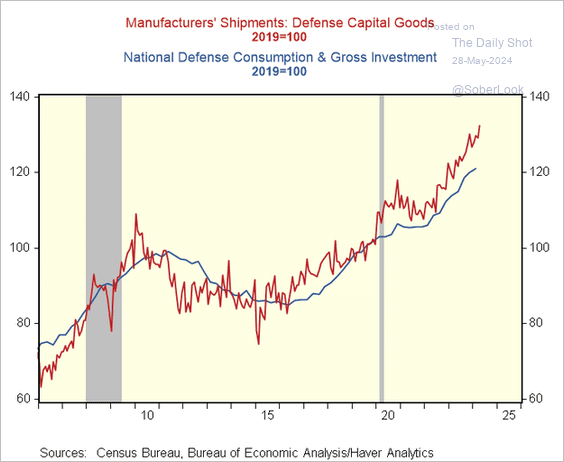
• Defense capital goods shipments have been rising.
 Source: @RenMacLLC
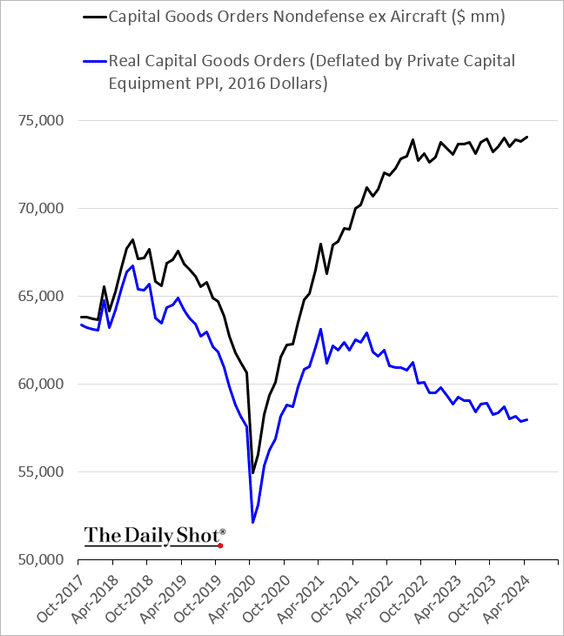
• Are real capital goods orders bottoming?
——————–
3. The updated U. Michigan sentiment index shows a smaller decline in May compared to an earlier estimate.

• Inflation expectations eased relative to the previous estimate amid a pullback in gasoline prices.

——————–
4. The recent boost in government consumption and investment is starting to slow.
 Source: MRB Partners
Back to Index
Canada
1. Economists have started to upgrade their estimates for Canada’s consumer spending growth this year.
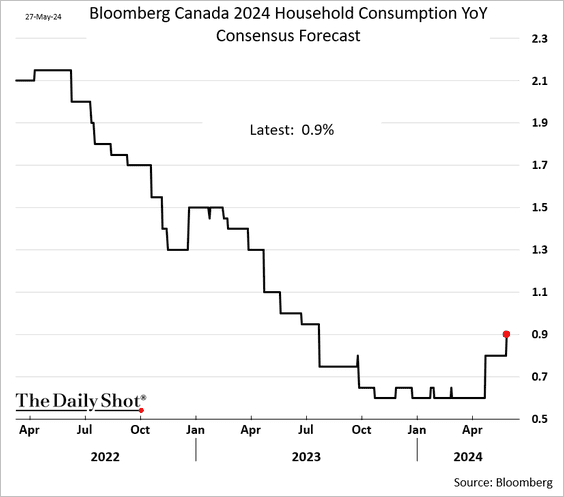
• There is more optimism about housing starts in 2024.

——————–
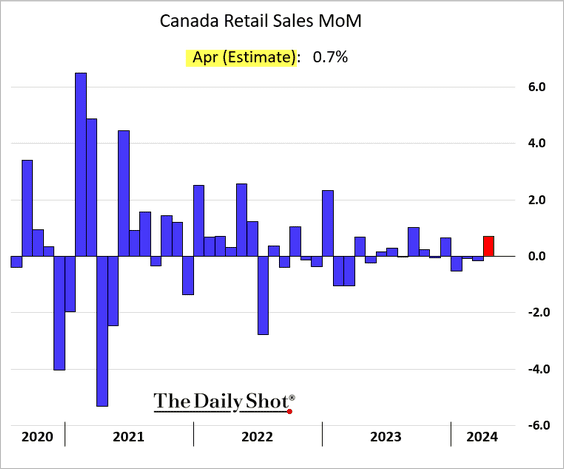
2. Retail sales declined in March, …
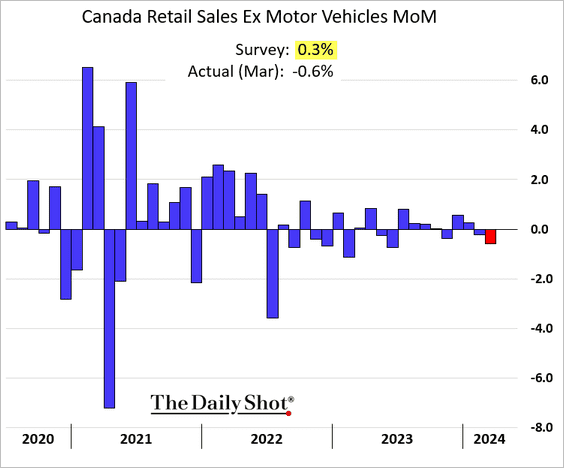
… but estimates suggest a bounce in April.
——————–
3. Hedge funds haven’t been this bearish on the loonie since 2017.

Back to Index
The United Kingdom
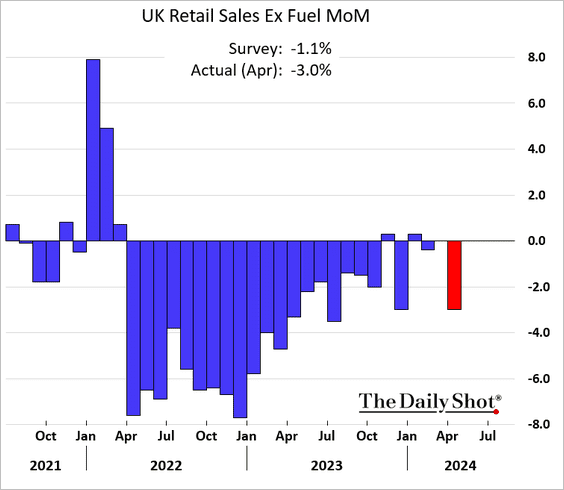
1. Retail sales declined more than expected last month.
 Source: Reuters Read full article
——————–
2. Shop price inflation continues to moderate.

• Was the April hot CPI report a fluke?
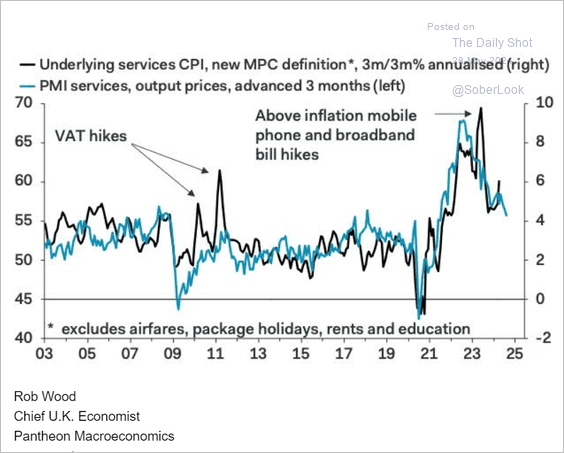 Source: Pantheon Macroeconomics
• PMI indices show further moderation in price pressures.
 Source: Capital Economics
Back to Index
The Eurozone
1. Germany’s Ifo expectations index edged higher this month.

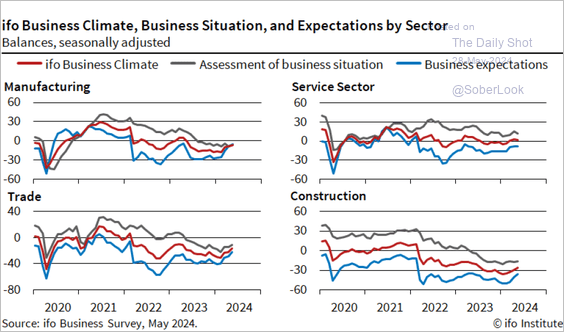 Source: ifo Institute
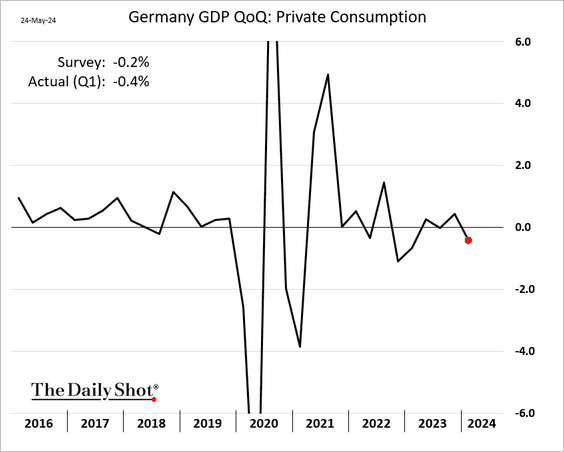
• The decline in Q1 consumption was more severe than initially estimated.
——————–
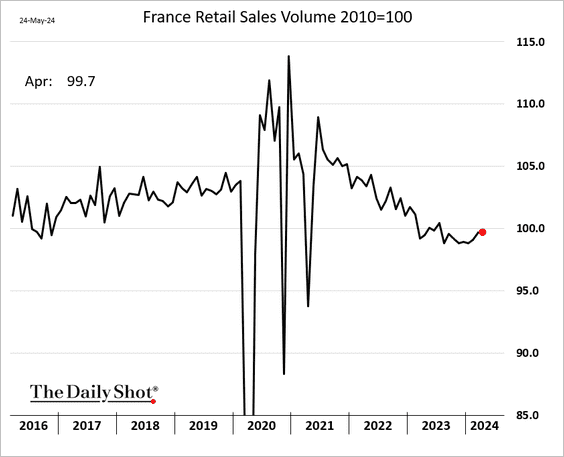
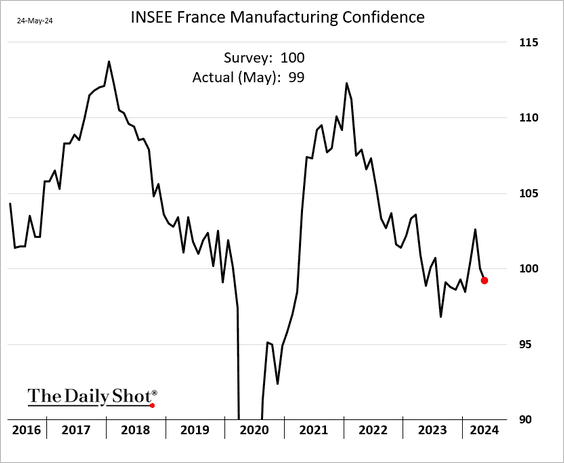
2. French retail sales were unchanged last month.
• Manufacturing sentiment declined further.
——————–
3. Wage pressures are easing.
 Source: Nordea Markets
4. Implied volatility in the rates markets has been trending lower.
 Source: @TheTerminal, Bloomberg Finance L.P.
Back to Index
Europe
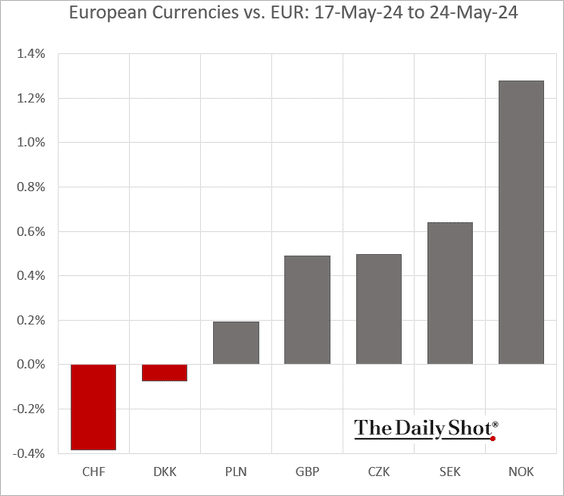
1. Norway’s unemployment keeps trending higher.

• The Norwegian krone outperformed last week.
——————–
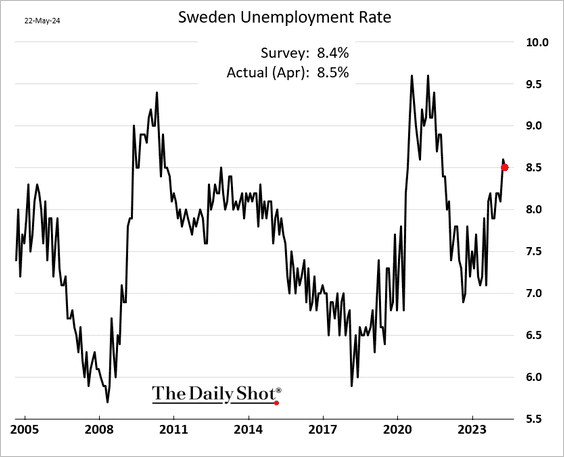
2. Sweden’s unemployment rate remains elevated.
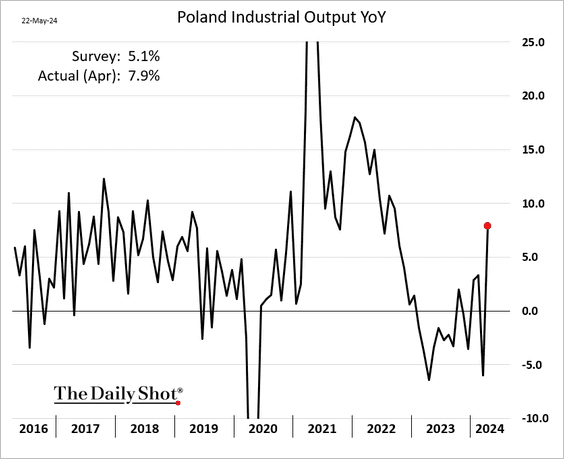
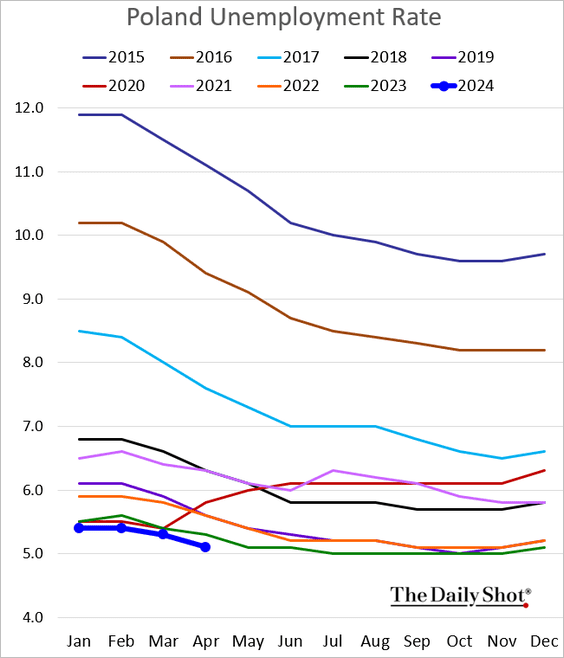
3. Next, we have some updates on Poland.
• Industrial production (a sharp rebound):
• Retail sales (a pullback):
 Source: ING
• Employment (down on a year-over-year basis):

– The unemployment rate (multi-year lows):
——————–
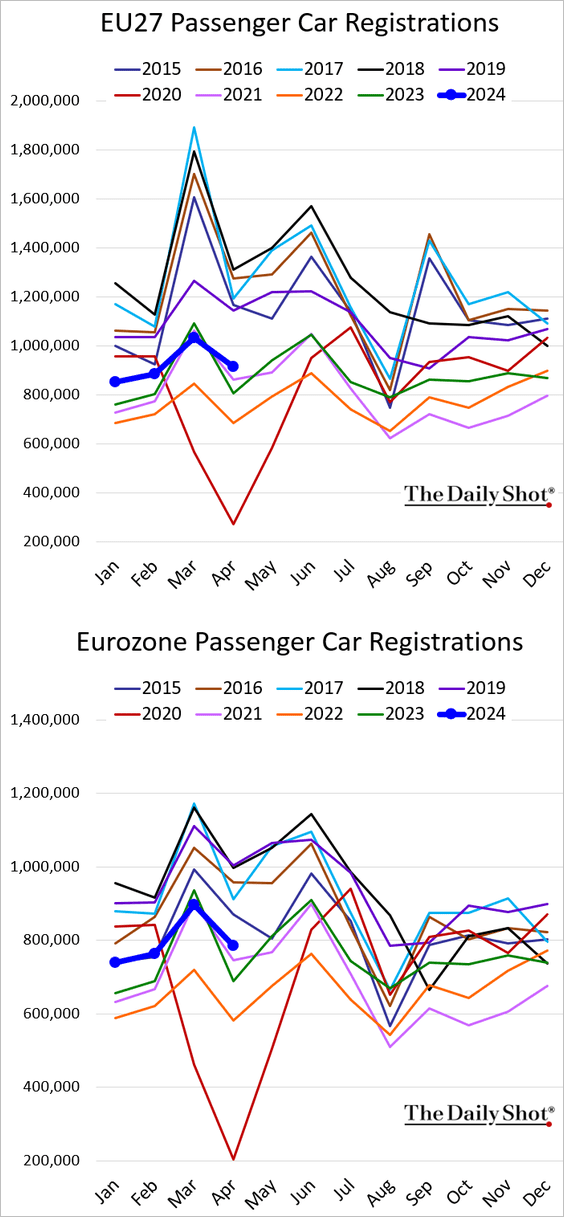
4. EU new vehicle registrations were well above last year’s levels in April.
5. Here is a look at the impact of the pandemic on employment due to illness or disability in the EU.
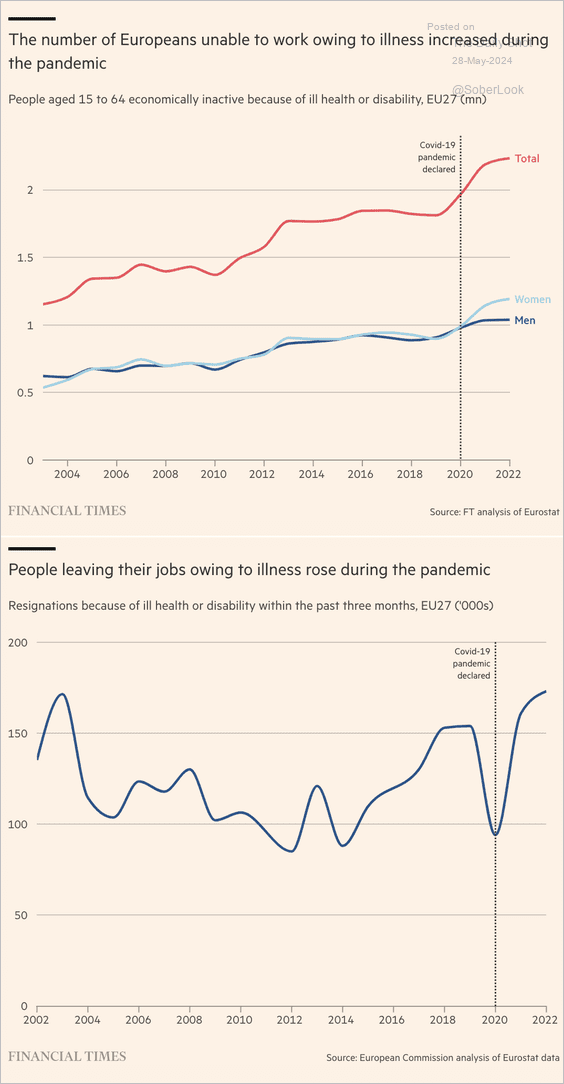 Source: @financialtimes Read full article
Back to Index
Japan
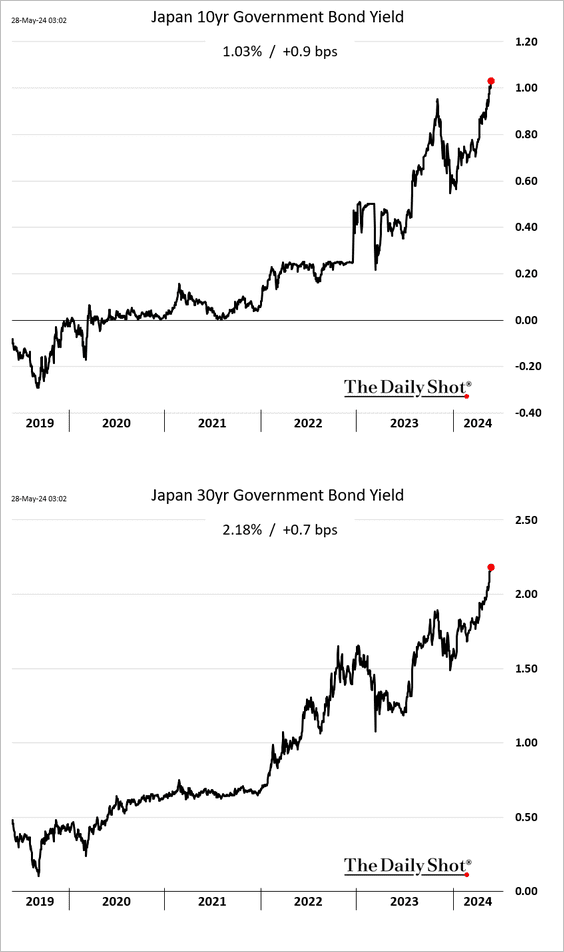
1. JGB yields continue to climb.
2. Wholesale services inflation is still rising.

Back to Index
China
1. Industrial profits were back above 2024 levels in April.

2. Utilized foreign direct investment is at multi-year lows.

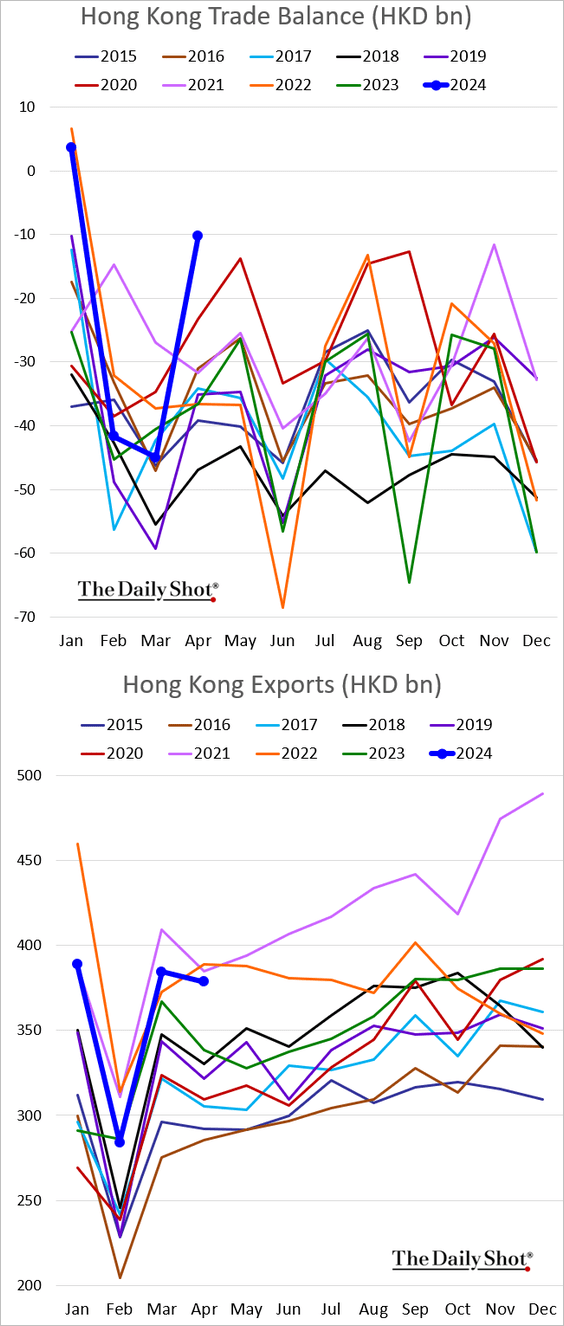
3. Next, we have some updates on Hong Kong.
• The trade balance (multi-year highs):
• Government land sales:
 Source: @financialtimes Read full article
• Office availability:
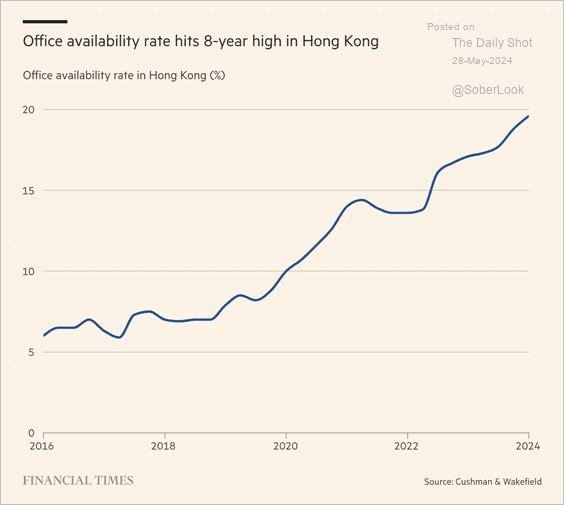 Source: @financialtimes Read full article
Back to Index
Emerging Markets
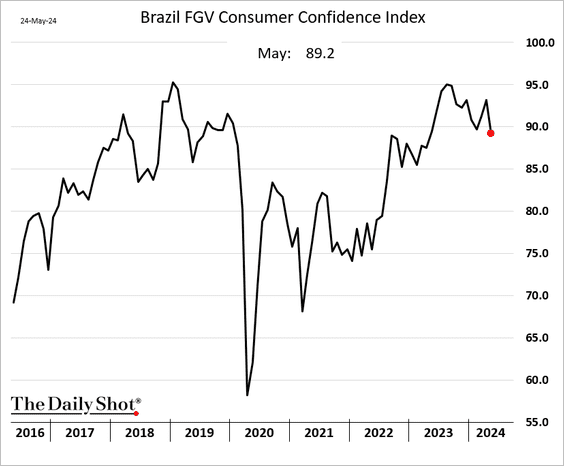
1. Economists are boosting their forecasts for Brazil’s GDP growth this year, …

… and lowering projections for the nation’s unemployment.
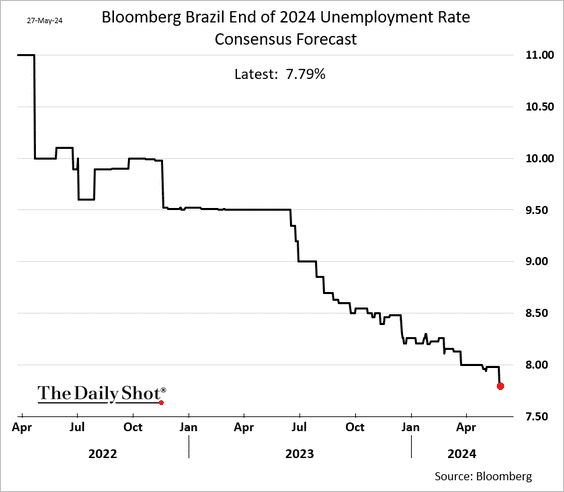
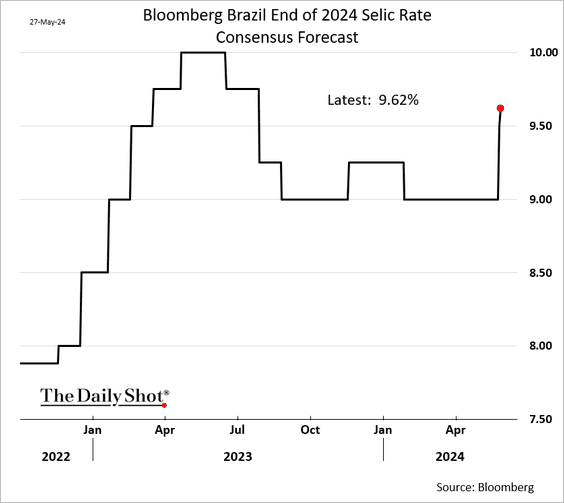
– Forecasters now see 88 bps of rate cuts before the end of the year (average projection).
• Brazil’s consumer confidence eased this month.
——————–
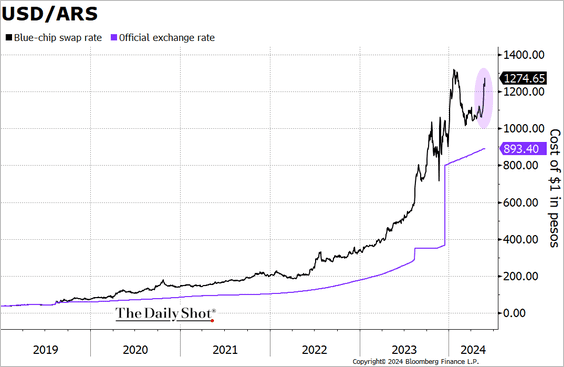
2. Last week, the Argentine peso took a hit in the unofficial market.
 Source: @TheTerminal, Bloomberg Finance L.P.
 Source: @financialtimes Read full article
——————–
3. The Vietnamese dong has been under pressure.

 Source: @markets Read full article
——————–
4. The difference in equity risk premia between EM and DM has grown to its widest level in four years, reflecting cheaper relative EM valuations.
 Source: BlackRock Investment Institute
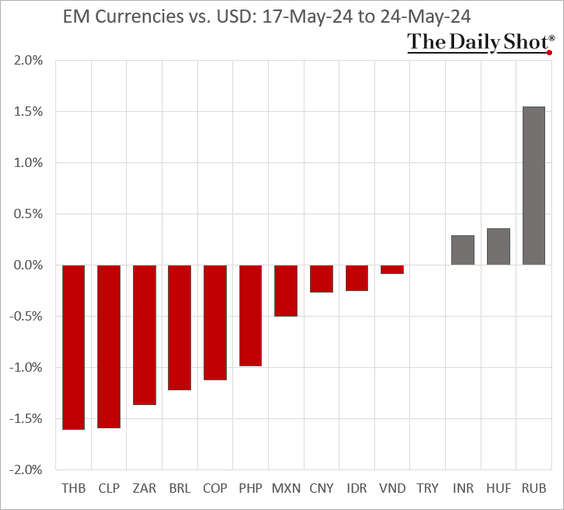
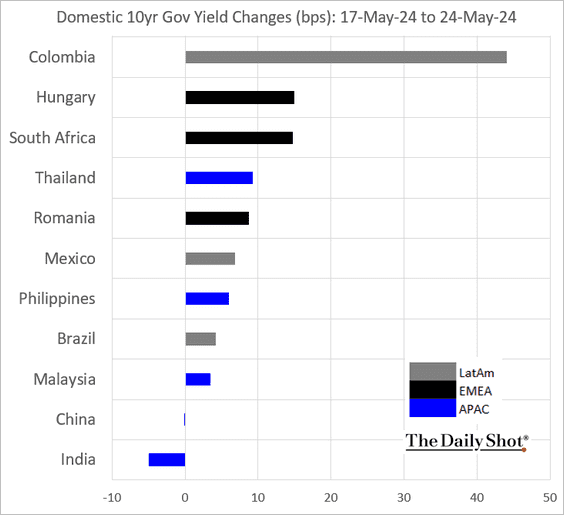
5. Next, we have some performance data from last week.
• Currencies:
• Bond yields:
• Equity ETFs:

Back to Index
Cryptocurrency
1. Blockchain activity within the Ethereum ecosystem continues to rise.
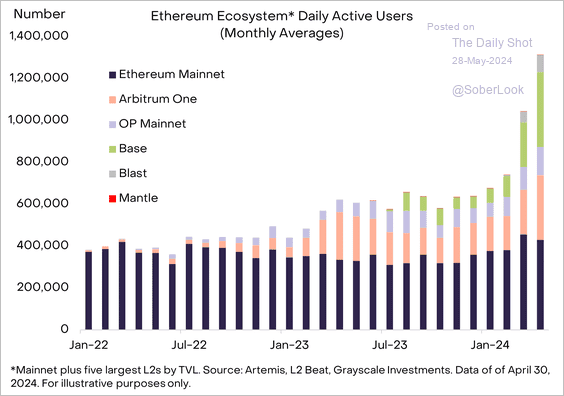 Source: Grayscale Read full article
2. Ether open interest surged last week on hopes of a spot-ETF approval. Funding rates also flipped positive from yearly lows, reflecting bullish sentiment.
 Source: @KaikoData
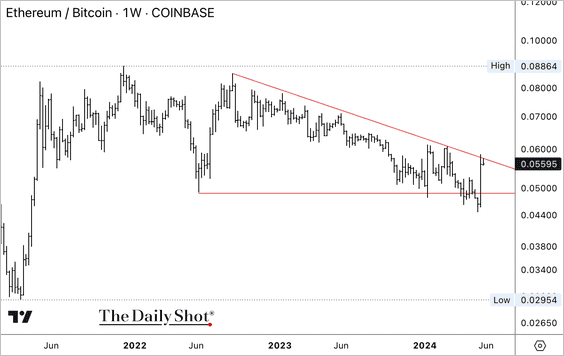
3. ETH/USD and ETH/BTC are testing initial resistance. (2 charts)

——————–
4. The Bitcoin/S&P 500 price ratio is also approaching resistance with slowing momentum.

Back to Index
Commodities
1. Speculative accounts continue to boost their bets on copper.

• Major copper miners have been steadily increasing CapEx, albeit at a modest pace relative to previous cycles.
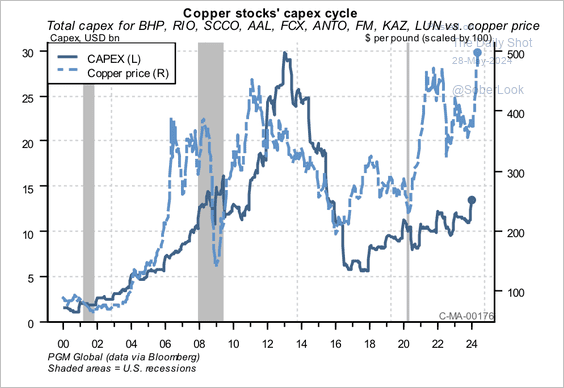 Source: PGM Global
– There is a growing divergence in the performance of copper mining equities and the spot price.
 Source: PGM Global
——————–
2. Speculative gold positioning continues to rise in the futures market.

• More gold mining stocks are reaching new one-year price highs.
 Source: SentimenTrader
——————–
3. US wheat futures continue to climb.

• Here are Bloomberg’s agriculture and grains indices.

——————–
4. Hedge funds have almost flattened their futures bets on sugar.

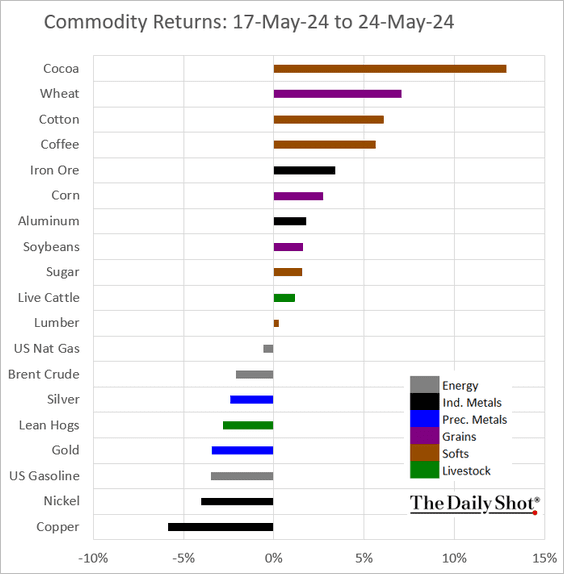
5. Finally, we have last week’s performance data.
Back to Index
Equities
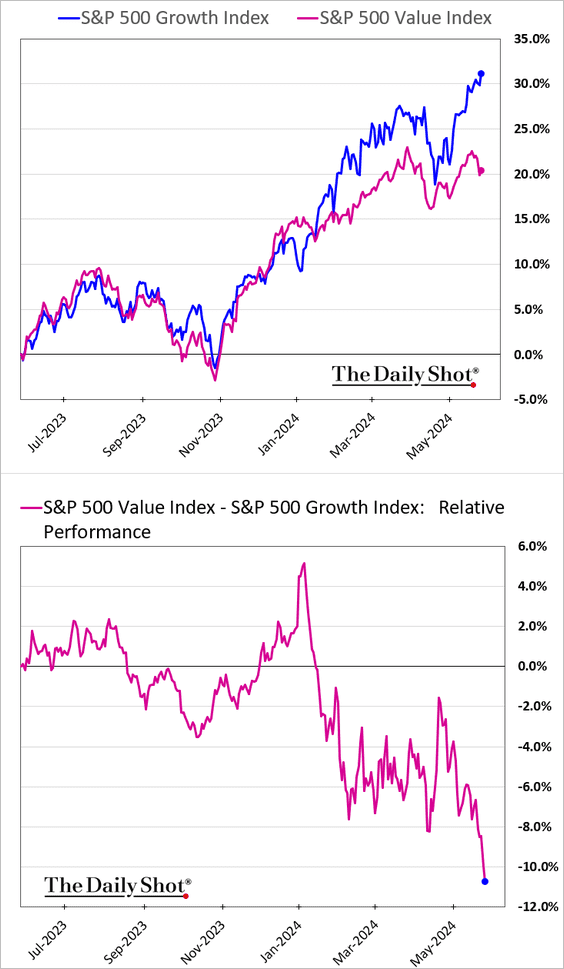
1. The rally is increasingly dominated by tech/growth stocks, with the rest of the market lagging.
• Last week’s performance by sector:

• The equal-weight index:

• Small caps:

• Growth vs. value:
——————–
2. Cyclicals’ relative performance hit the highest level since early 2022.
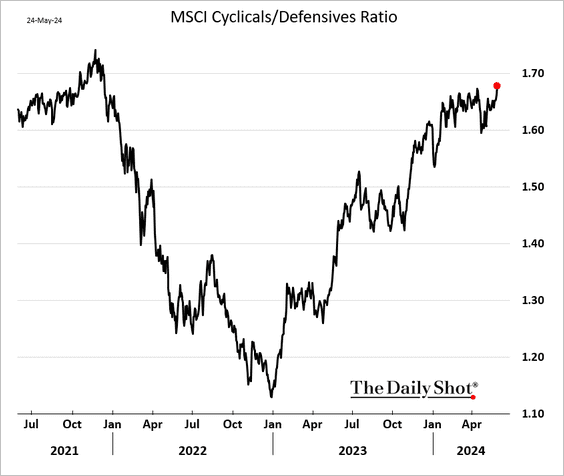
But hedge funds have been cautious on cyclicals vs. defensives.
 Source: BofA Global Research; @dailychartbook
——————–
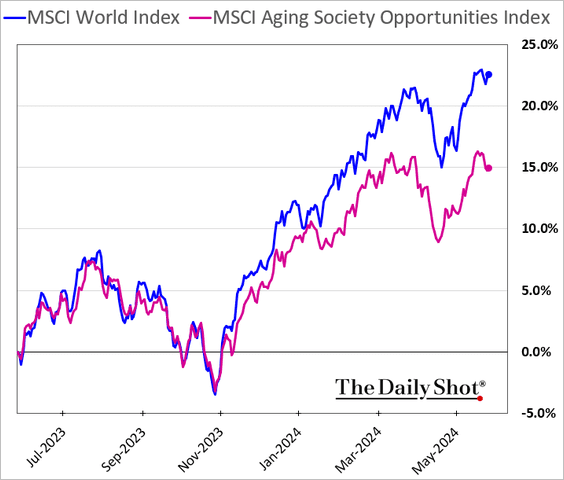
3. The Economist reports that the anticipated spending surge from retiring baby boomers is yet to materialize. The index tracking stocks expected to benefit from this boomer splurge has underperformed.
 Source: The Economist Further reading
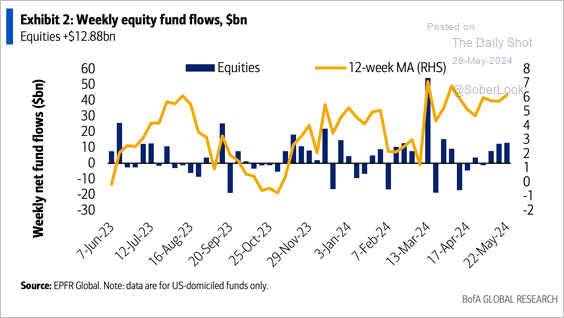
4. Equity fund flows are holding up.
 Source: BofA Global Research; @dailychartbook
5. Developed market equity breadth is improving and not yet stretched.
 Source: Longview Economics
6. The volume of single-stock call options is not extreme.
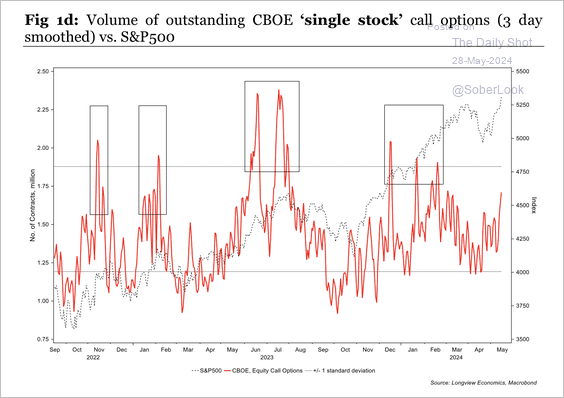 Source: Longview Economics
7. Transport stocks have not yet confirmed the breakout in the Dow Industrial Average.
![]() Source: Aazan Habib, Paradigm Capital
Source: Aazan Habib, Paradigm Capital
8. Tight credit spreads and low equity volatility have supported a risk-on environment.
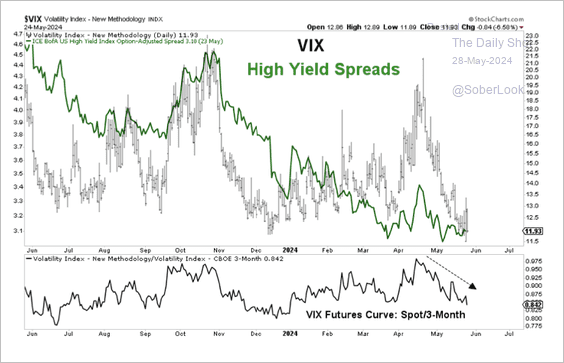 Source: Aazan Habib, Paradigm Capital
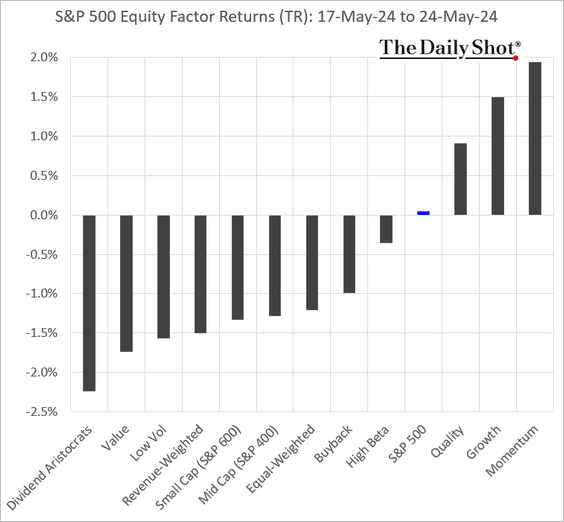
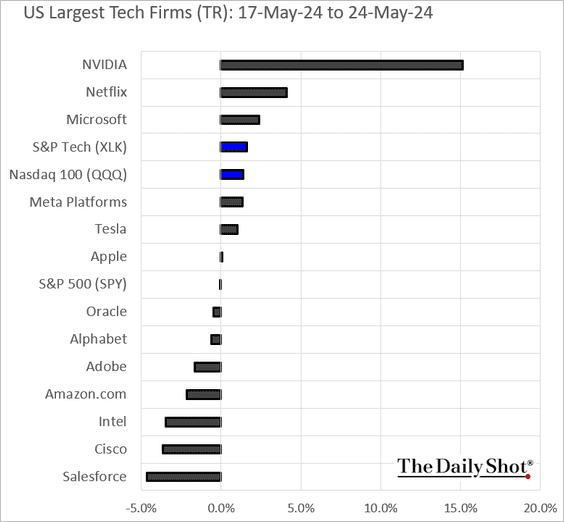
9. Finally, we have some performance data from last week.
• Equity factors/styles:
• Macro basket pairs’ relative performance:

• Thematic ETFs:

• The largest US tech firms:
Back to Index
Credit
1. For the first time since the financial crisis, a AAA-rated tranche of a commercial mortgage-backed security experienced a credit loss.
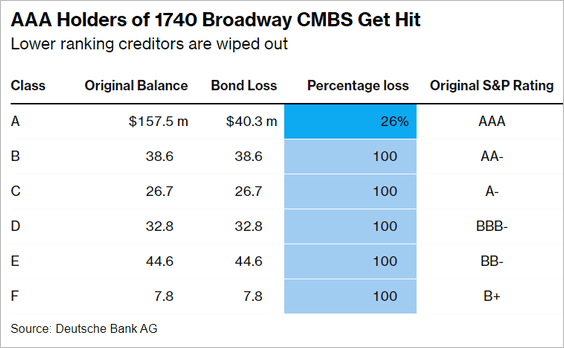 Source: @markets Read full article
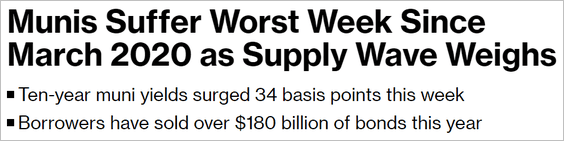
2. Munis sold off sharply last week, driven by a surge in supply, as issuers brought over $180 billion in long-term municipal bonds to market this year.

 Source: @markets Read full article
——————–
3. Here is last week’s performance data for select credit asset classes.

Back to Index
Global Developments
1. Currency market carry trades have been very lucrative.
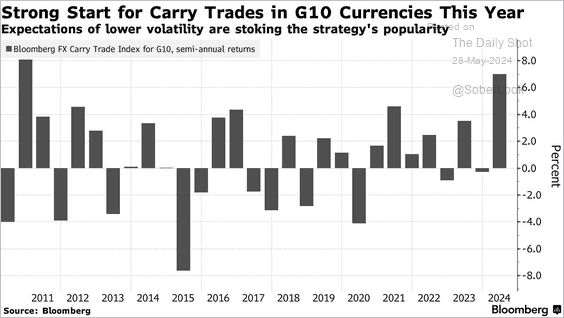 Source: @markets Read full article
2. This chart shows projected government gross debt by 2040 if policies remain unchanged.
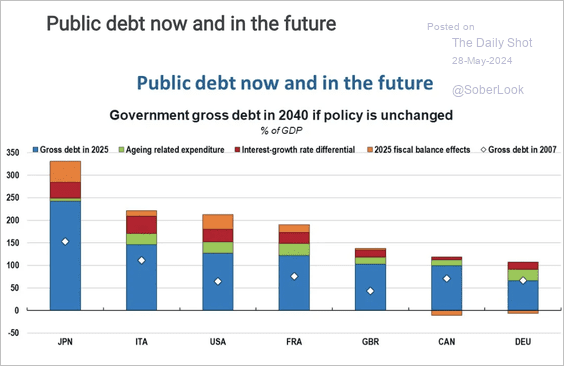 Source: OECD Read full article
3. Finally, we have some performance data from last week.
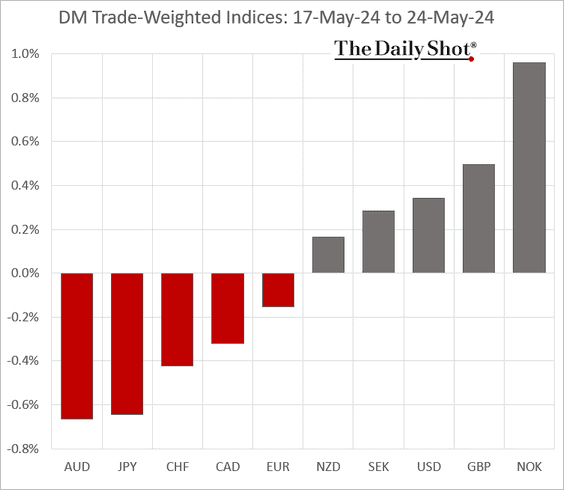
• Currencies:
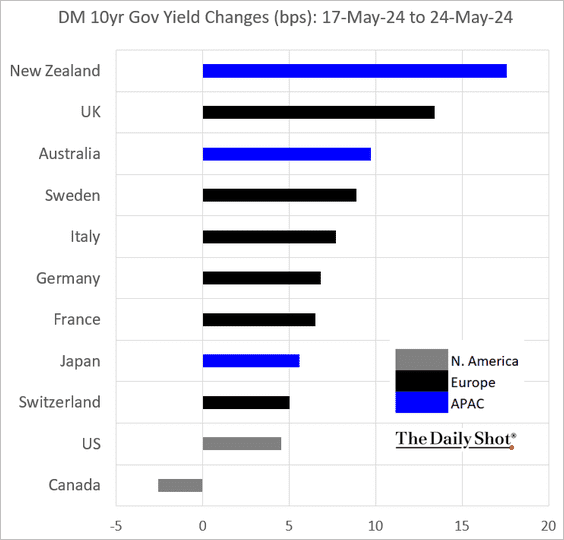
• Bond yields:
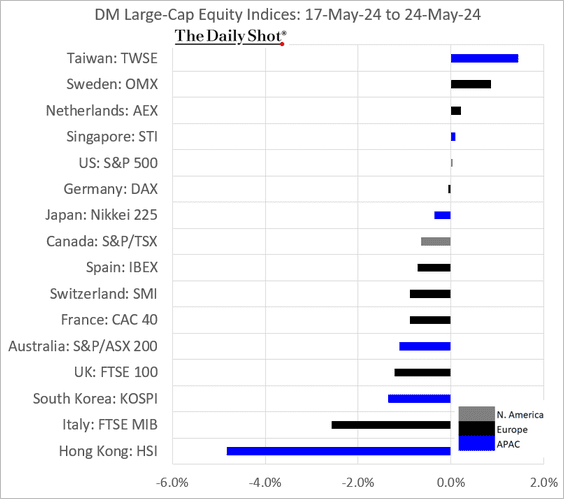
• Equities:
——————–
Food for Thought
1. Value of investments in pandemic winners in the post-pandemic world:
 Source: Statista
2. Billionaires:
 Source: Visual Capitalist Read full article
3. Public companies with the highest gaming revenues:
 Source: Statista
4. Concentration of secondary teachers and doctors per 100,000 population by country:
 Source: Codera Analytics
5. Cross-state migration:
 Source: Bank of America Institute
6. Effective tax rates of the richest Americans and bottom half of income earners:
 Source: The New York Times Read full article
7. Marital trends by state:
 Source: Schmidt & Clark; US Census Bureau
——————–
Back to Index