
The Daily Shot: 03-Jun-24
• The United States
• Canada
• The United Kingdom
• The Eurozone
• Europe
• Japan
• Asia-Pacific
• China
• Emerging Markets
• Commodities
• Energy
• Equities
• Credit
• Global Developments
• Food for Thought
The United States
1. Real consumer spending unexpectedly fell in April, indicating a slowdown in US economic activity.
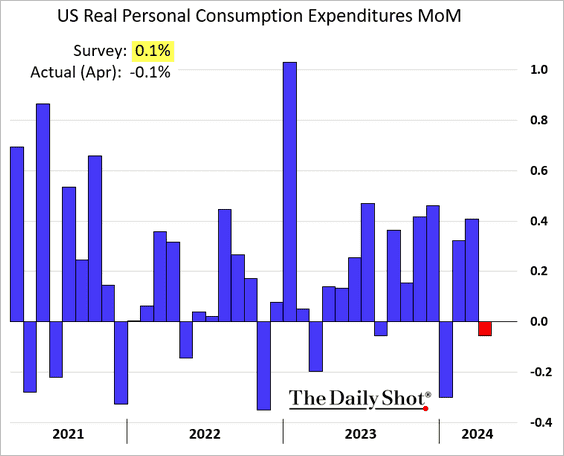
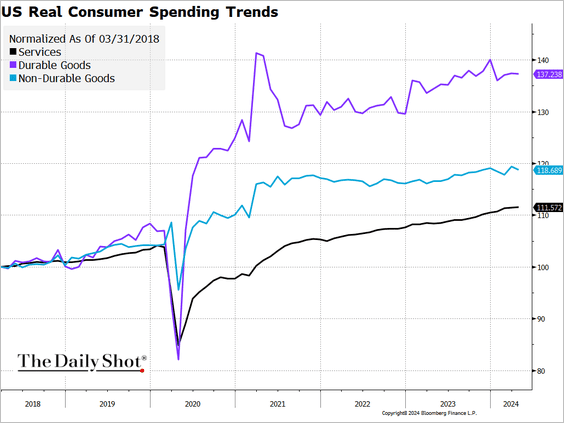
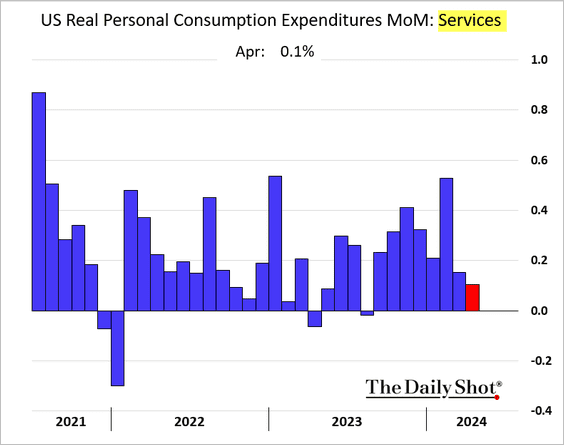
– Spending on goods declined, whereas gains in expenditure on services continued to slow.
 Source: @TheTerminal, Bloomberg Finance L.P.
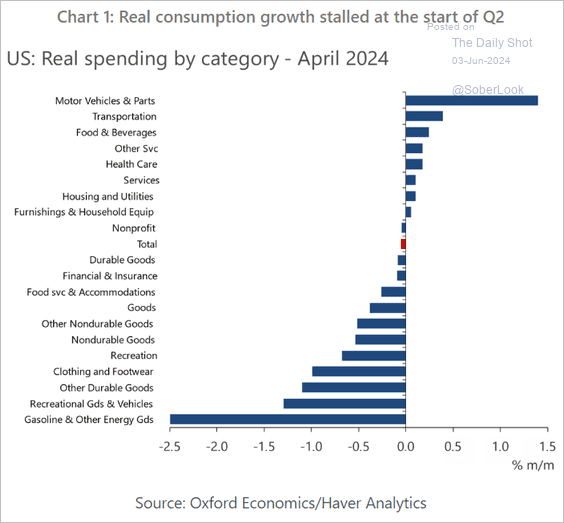
– Here are the spending changes by sector.
 Source: Oxford Economics
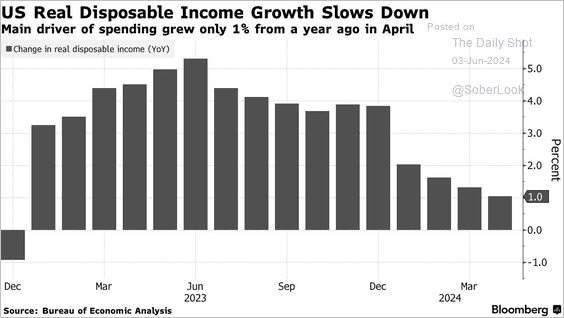
• Personal income, excluding government checks, was roughly unchanged.
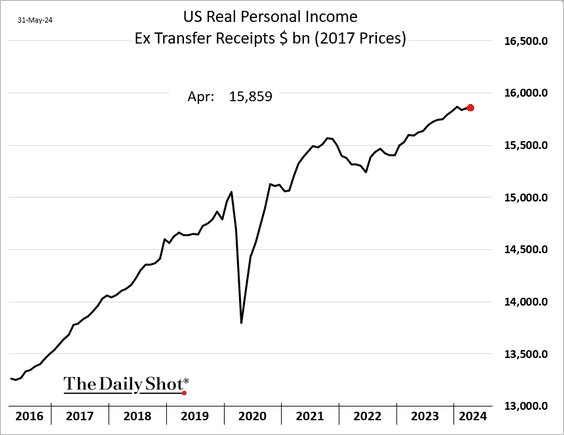
The slowdown in disposable income growth could signal further weakening in consumer spending going forward.
 Source: @economics Read full article
• This chart displays the trends in disposable personal income and consumer spending (levels).
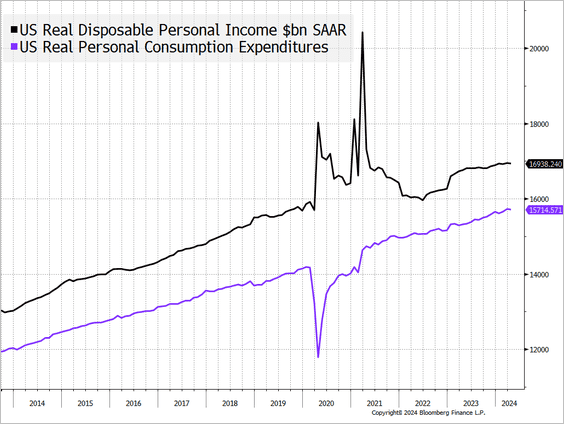 Source: @TheTerminal, Bloomberg Finance L.P.
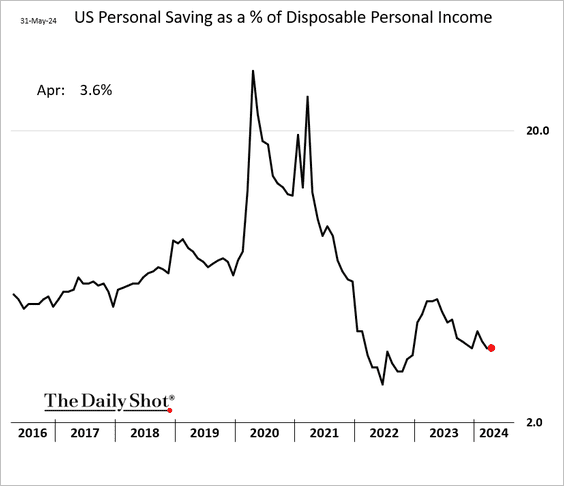
The following chart represents personal saving as a percentage of disposable personal income.
——————–
2. The weakness in consumer spending has led to a reduction in the Atlanta Fed’s GDPNow estimate for the current quarter’s growth.
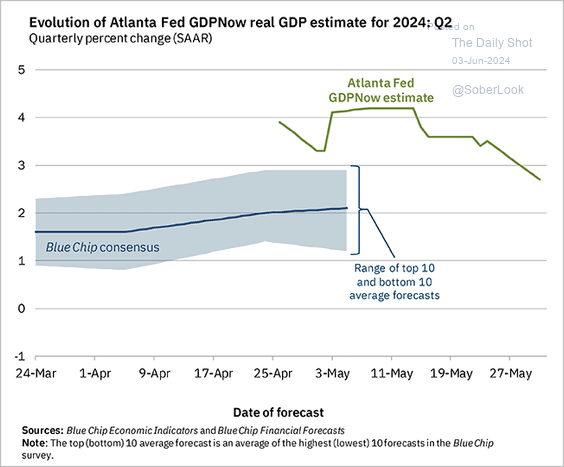 Source: Federal Reserve Bank of Atlanta
The NY Fed’s Nowcast measure also showed a pullback.
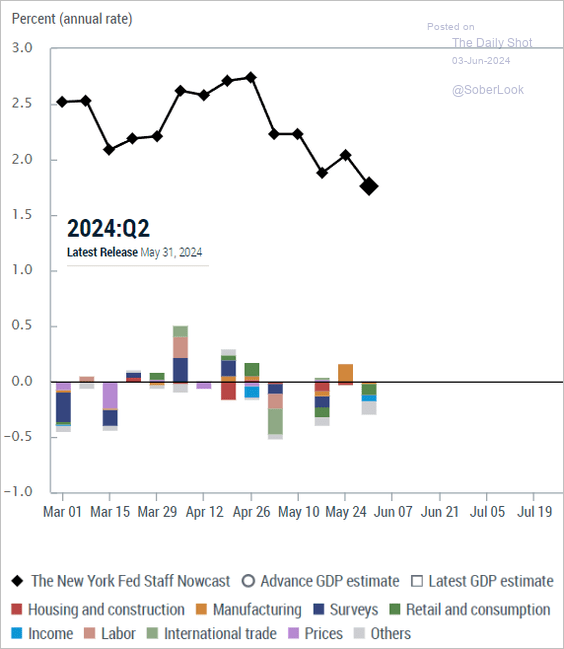 Source: Federal Reserve Bank of New York
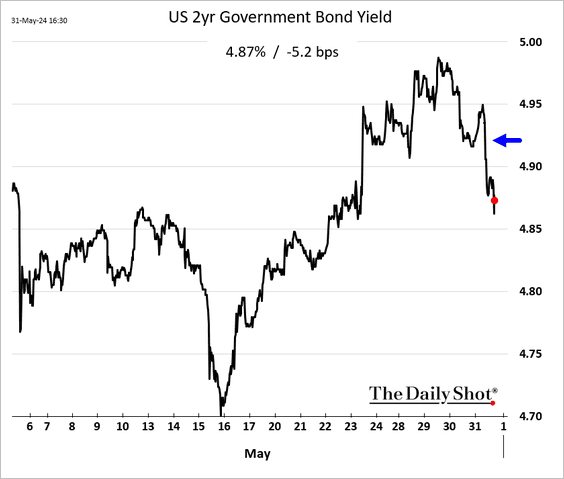
• Treasury yields declined.
——————–
3. The April core PCE inflation was in line with forecasts.
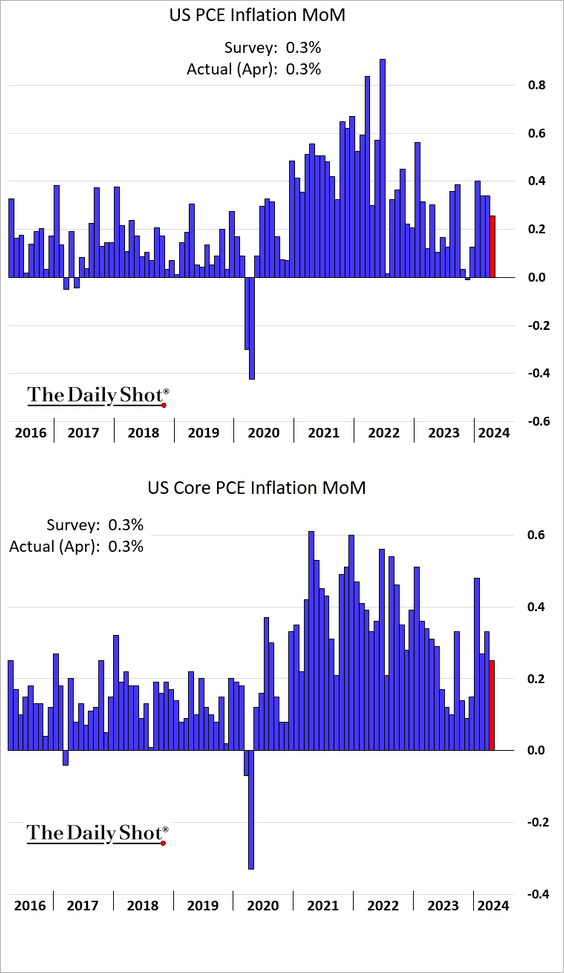
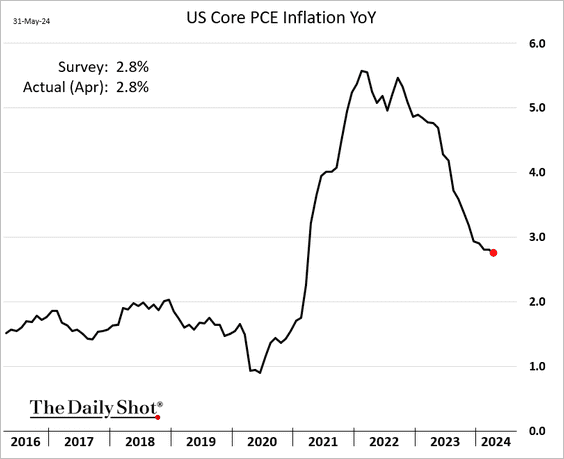
Supercore PCE inflation slowed, …
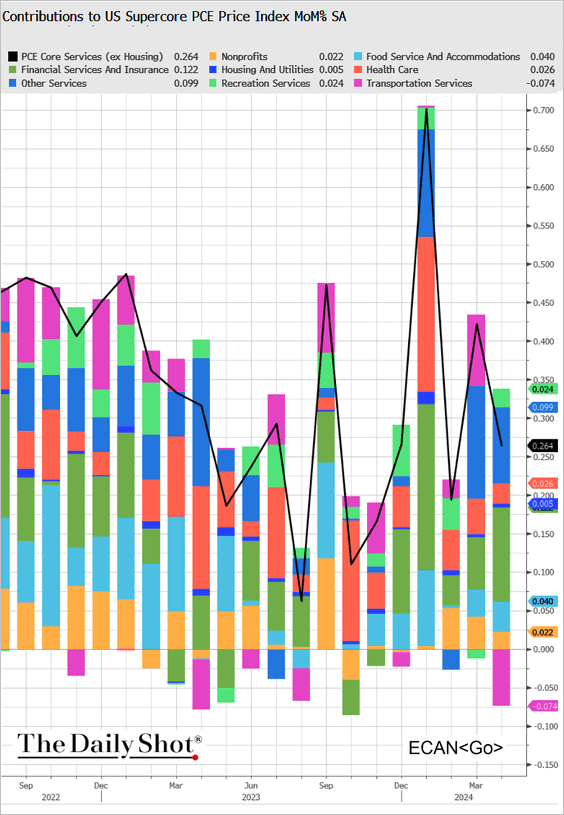 Source: @TheTerminal, Bloomberg Finance L.P.
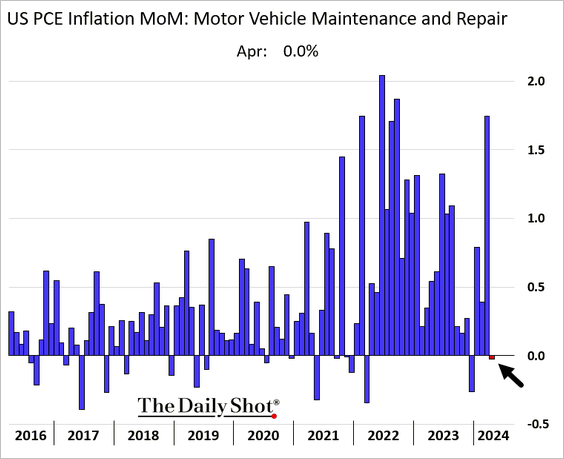
… helped by a pause in vehicle repair inflation.
——————–
4. The Chicago PMI showed further deterioration. What’s driving this massive decline is not entirely clear.
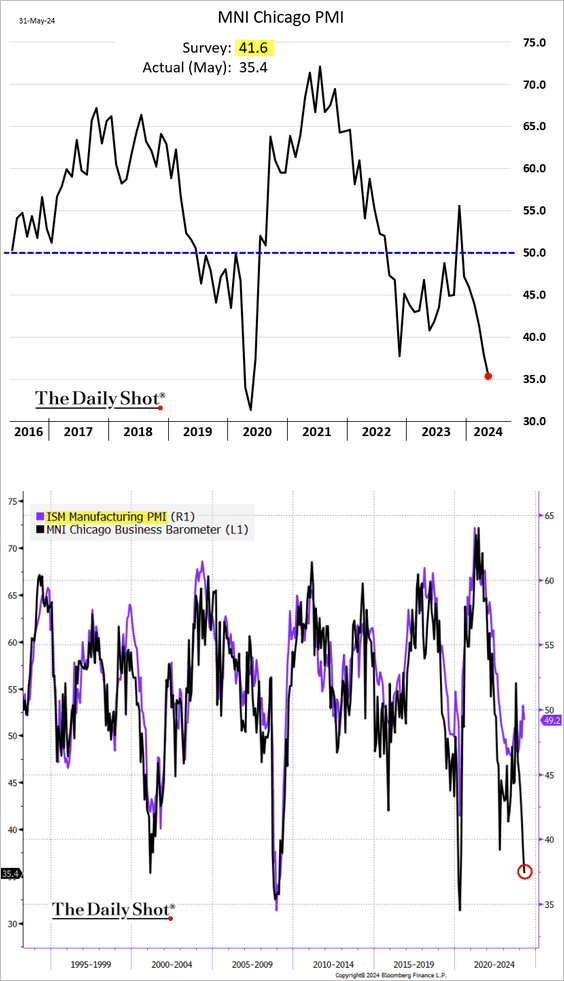 Source: @TheTerminal, Bloomberg Finance L.P.
 Source: MarketWatch Read full article
——————–
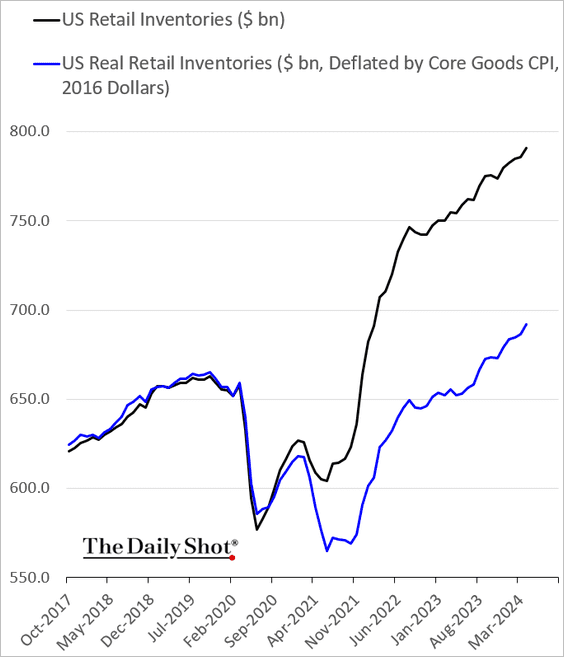
5. Retail inventories continue to climb.
6. Indicators of financial stress have been moving lower.
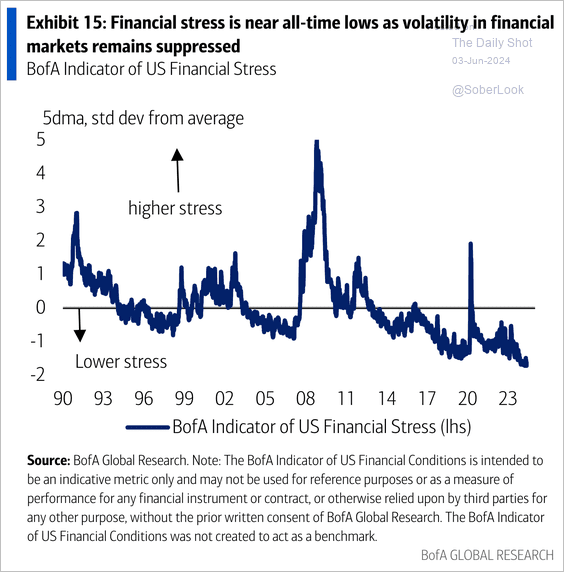 Source: BofA Global Research; @dailychartbook
Back to Index
Canada
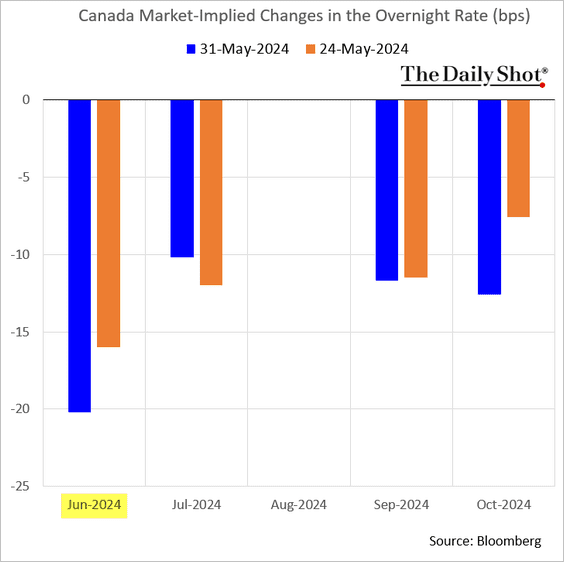
1. The first-quarter GDP growth report surprised to the downside, …
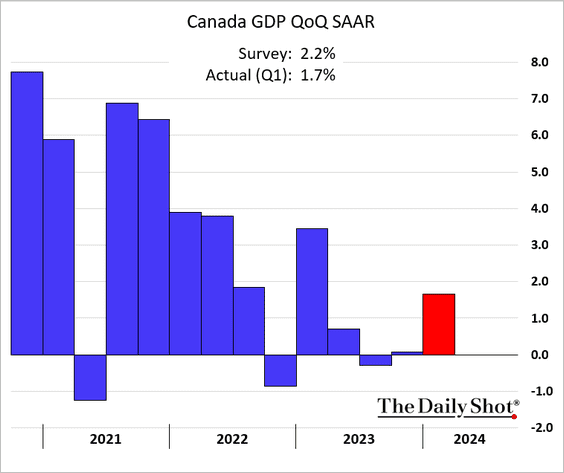
 Source: Reuters Read full article
… sending bond yields lower.
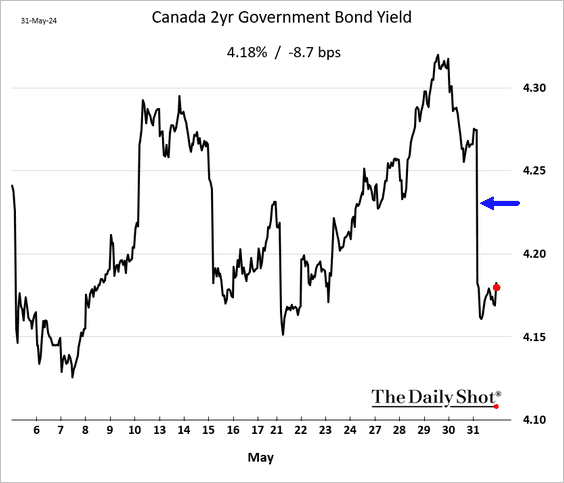
A BoC rate cut this month looks increasingly likely.
• However, domestic final demand growth was quite strong.
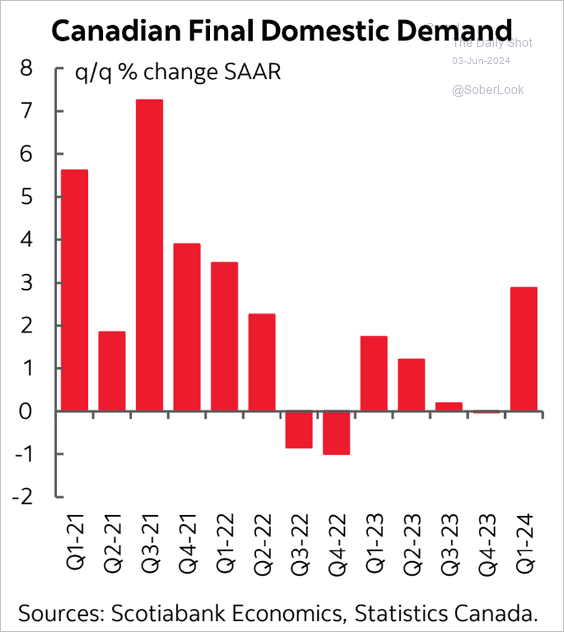 Source: Scotiabank Economics
• Scotiabank’s Q2 growth tracker indicates a projected growth rate of 1.5% for this quarter.
![]() Source: Scotiabank Economics
Source: Scotiabank Economics
——————–
2. Job openings have been trending lower.
 Source: Capital Economics
Back to Index
The United Kingdom
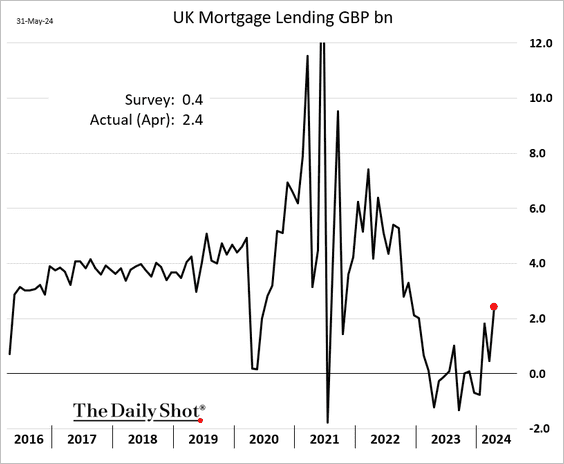
1. Consumer credit growth slowed sharply in April, …

… but mortgage lending increased.
• Mortgage approvals (count) edged lower.

• The broad money supply continues to show modest growth.

——————–
2. Home prices climbed in May, according to Nationwide.

Back to Index
The Eurozone
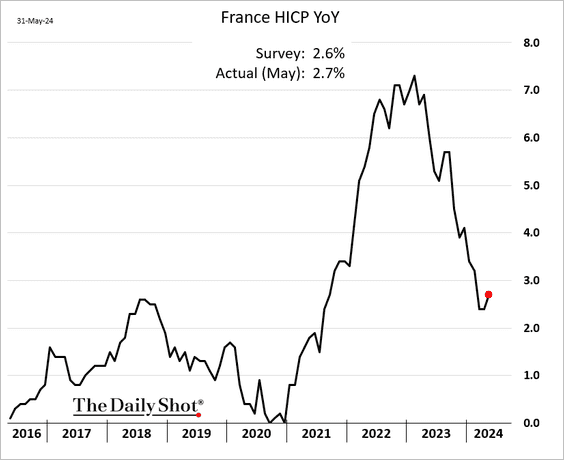
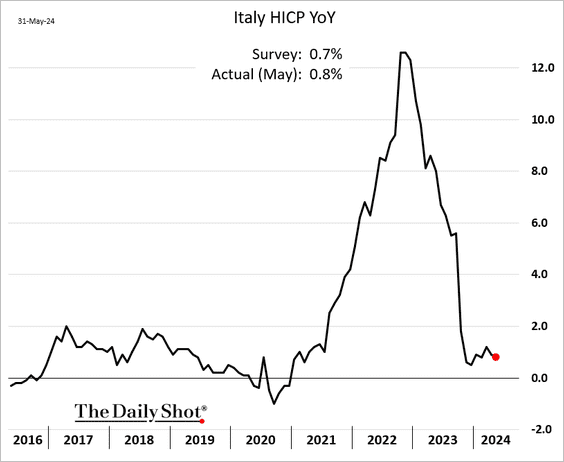
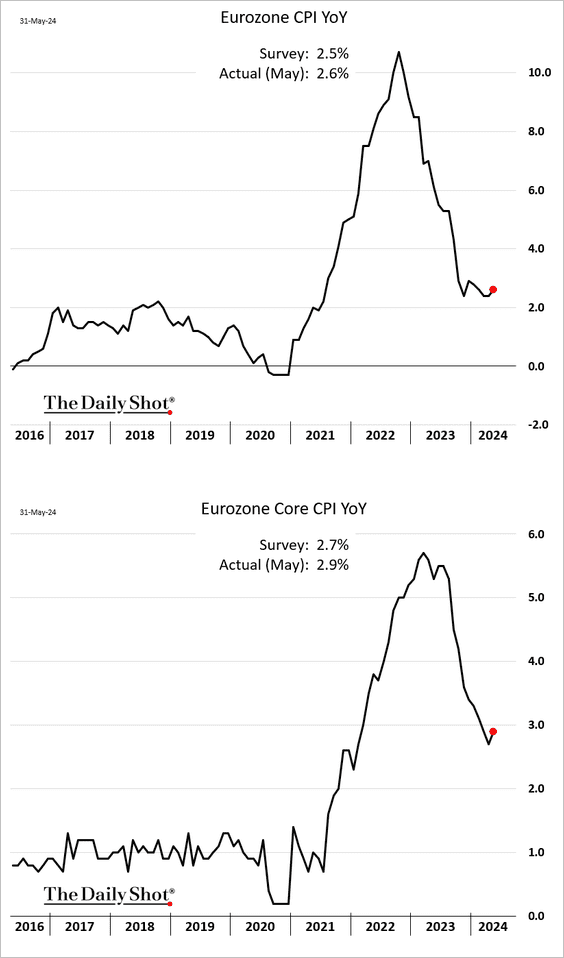
1. Inflation in May was stronger than anticipated across the Eurozone.
• France:
• Italy:
• The Netherlands:

• Euro area:
Services inflation remains sticky.
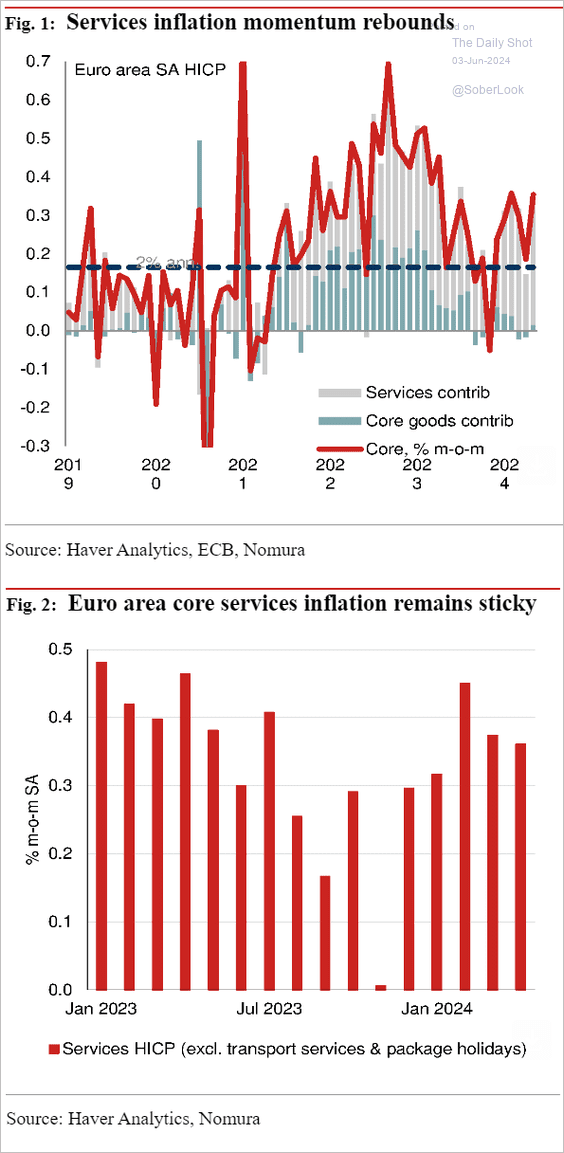 Source: Nomura Securities
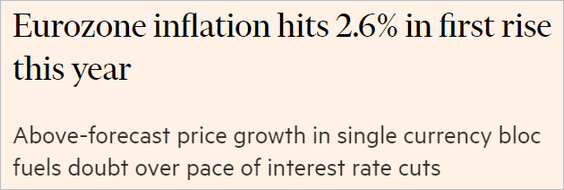 Source: @financialtimes Read full article
——————–
2. The market-based ECB rate trajectory has shifted higher.

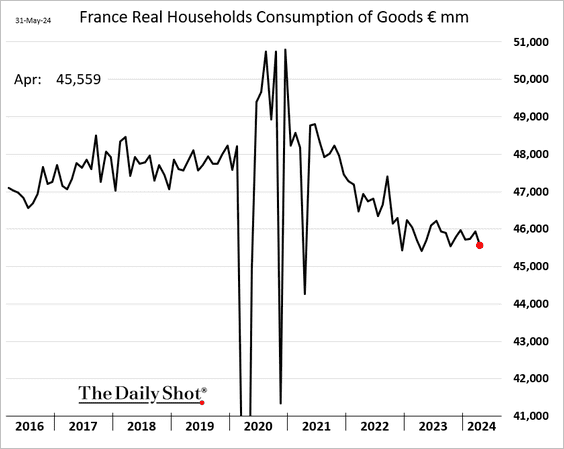
3. Consumer spending slowed in April.
• Germany retail sales:

• France consumer spending on goods:
——————–
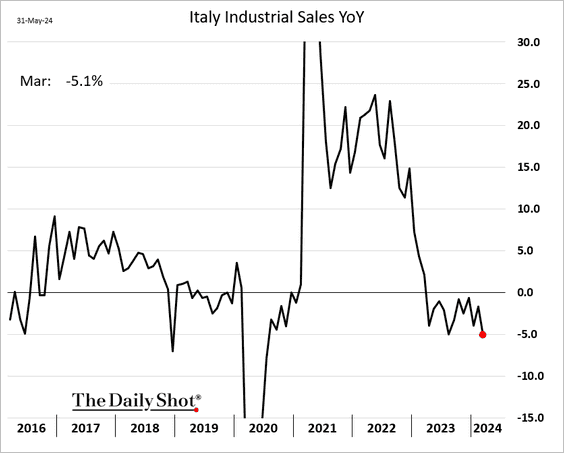
4. Italian industrial sales have been soft.
Back to Index
Europe
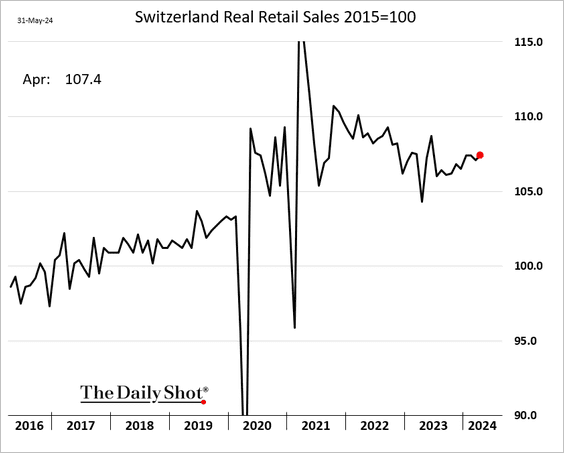
1. Swiss retail sales are trending higher.
2. Iceland’s economy is contracting.

3. Here is a look at the final energy consumption in the EU’s industrial sector.
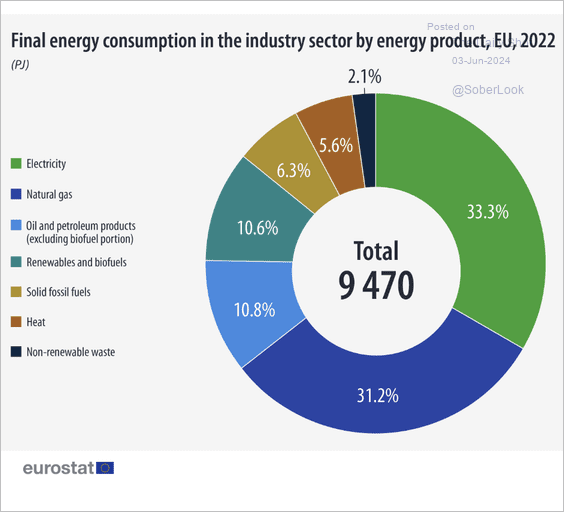 Source: Eurostat Read full article
Back to Index
Japan
1. Housing starts rebounded in April.

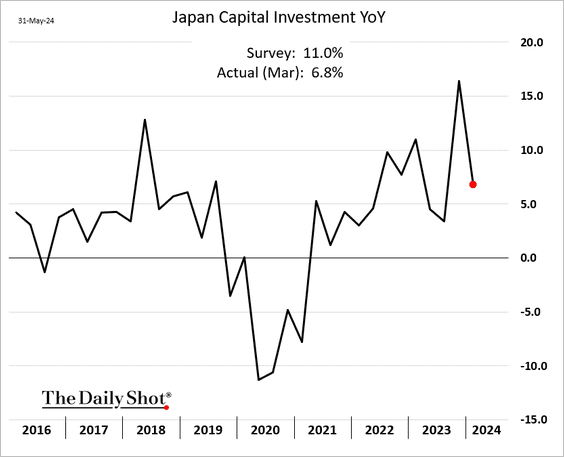
2. CapEx slowed in March.
3. This chart shows the contributions to Japan’s current account balance.
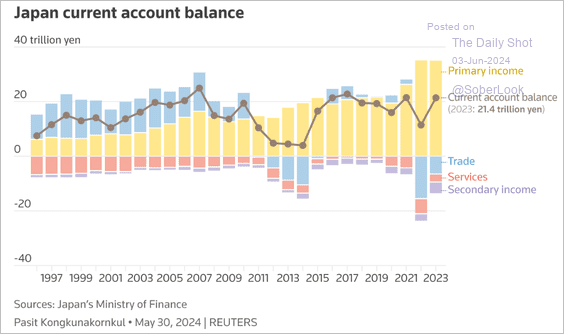 Source: Reuters Read full article
Back to Index
Asia-Pacific
1. South Korea’s factory activity returned to growth in May.
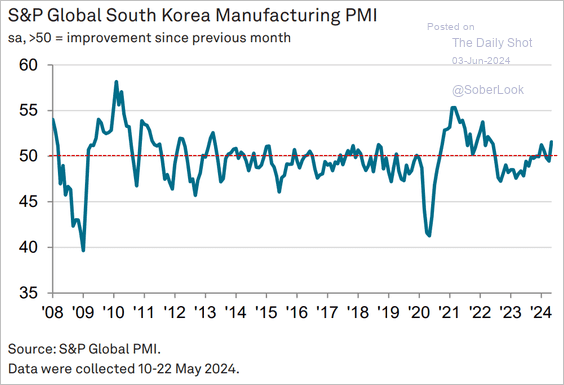 Source: S&P Global PMI
• The trade surplus climbed, …
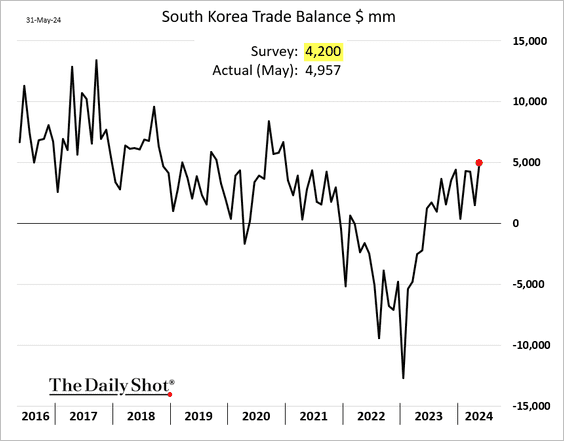
… boosted by chip exports.
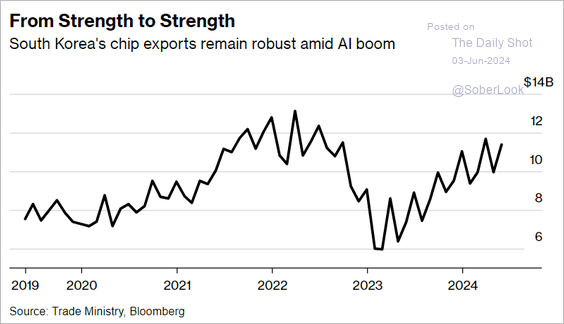 Source: @economics Read full article
——————–
2. According to the latest PMI data from S&P Global, Taiwan’s manufacturing sector has returned to growth.
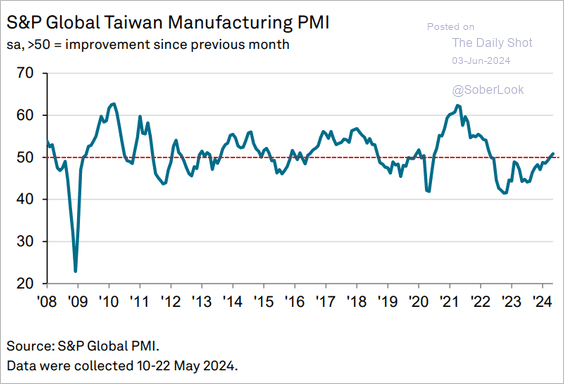 Source: S&P Global PMI
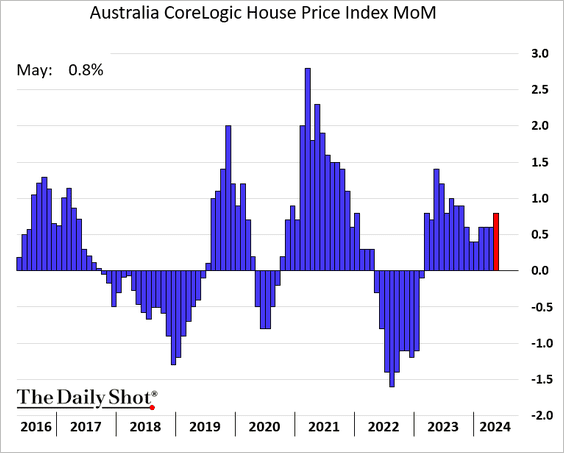
3. Australia’s inflation tracker shows price gains moderating.
![]()
• Home prices have been up for 15 months in a row.
Back to Index
China
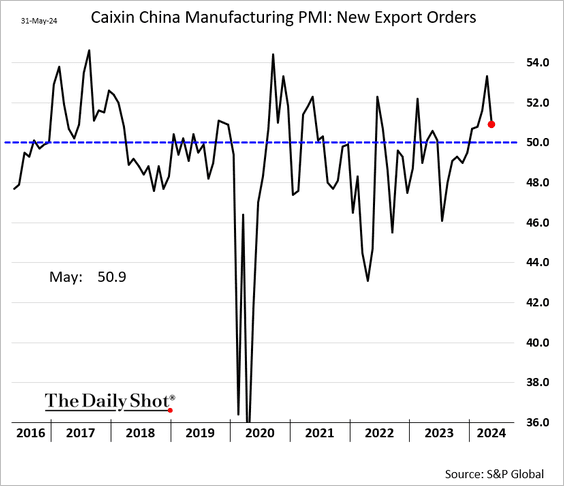
1. The PMI report from S&P Global indicates that China’s manufacturing expansion is accelerating.
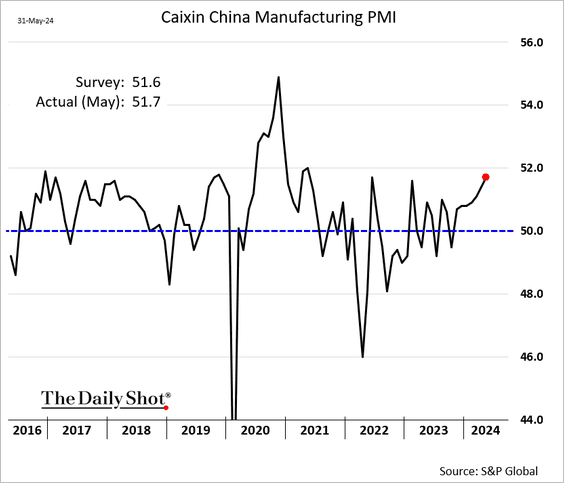
Growth in export orders slowed.
——————–
2. China-focused ETFs saw outflows in May.
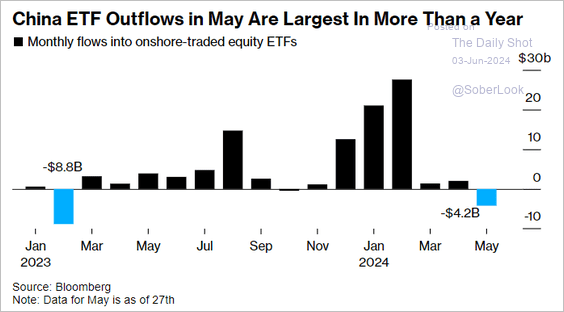 Source: @markets Read full article
3. Here is a look at China’s overseas investment and construction trends.
 Source: Reuters Read full article
4. Hong Kong’s retail sales have been slowing.

Back to Index
Emerging Markets
1. Let’s run through Asian PMI data.
• The Philippines (holding up well):
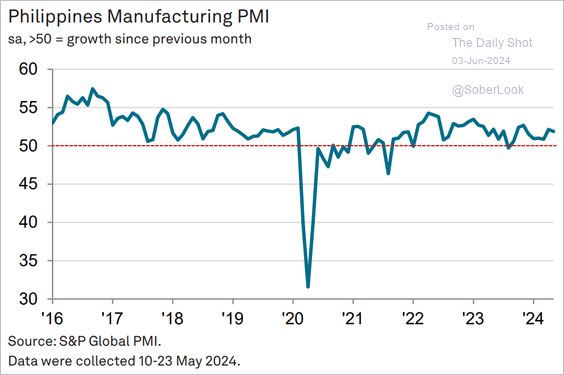 Source: S&P Global PMI
• Indonesia (still growing):
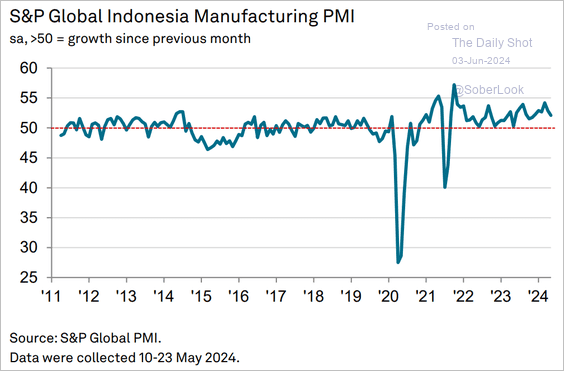 Source: S&P Global PMI
• Vietnam (treading water):
 Source: S&P Global PMI
——————–
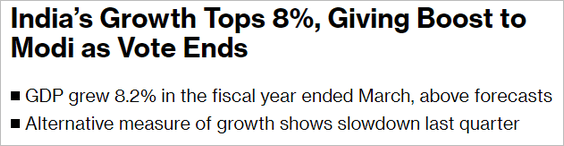
2. India’s GDP topped expectations.
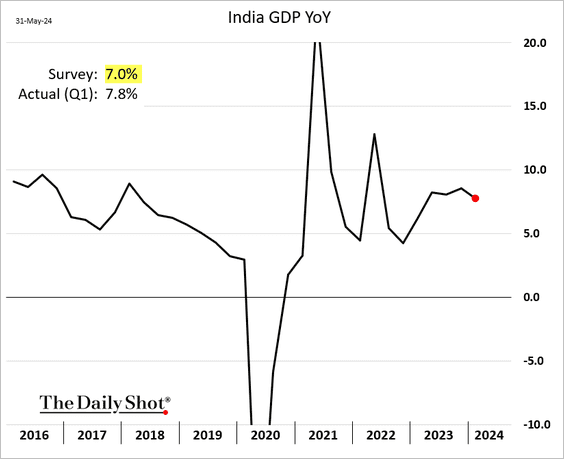
Here is the annual GDP growth.
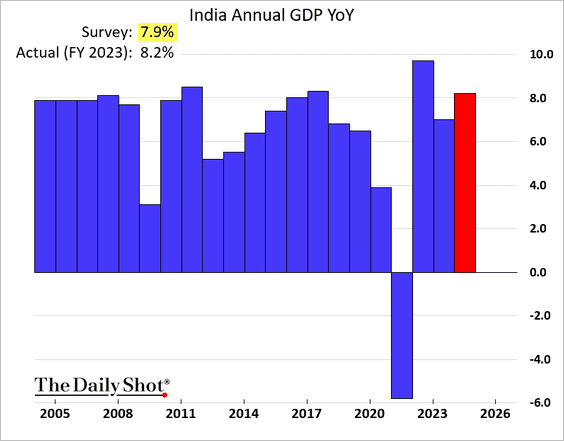
 Source: @economics Read full article
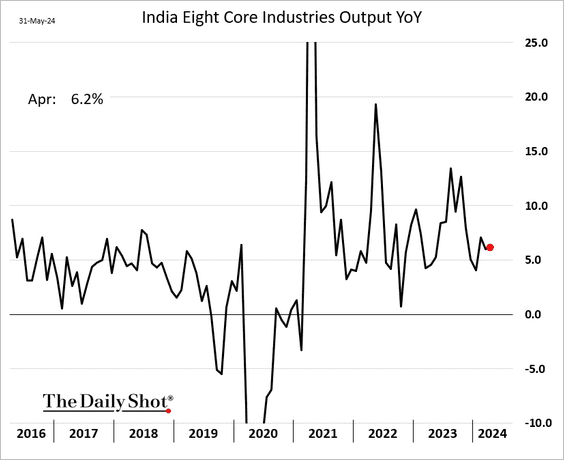
• The eight core industries’ growth has been strong.
——————–
3. Economic expansion in Turkey continues to be robust.

4. The Mexican peso took a hit following the election outcome.
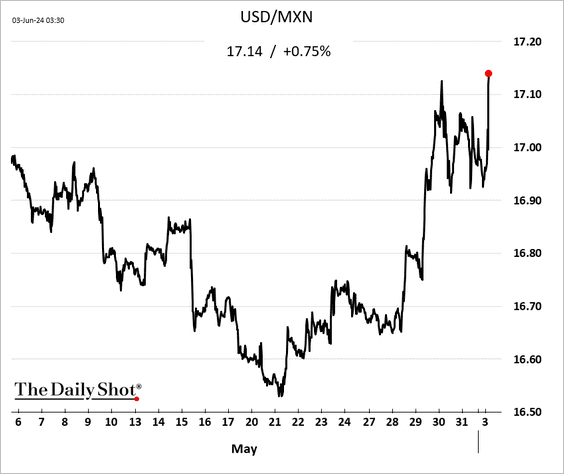
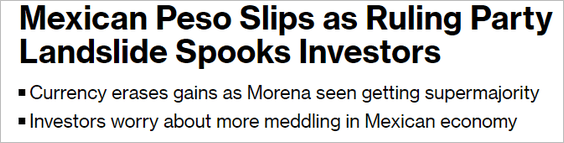 Source: @markets Read full article
——————–
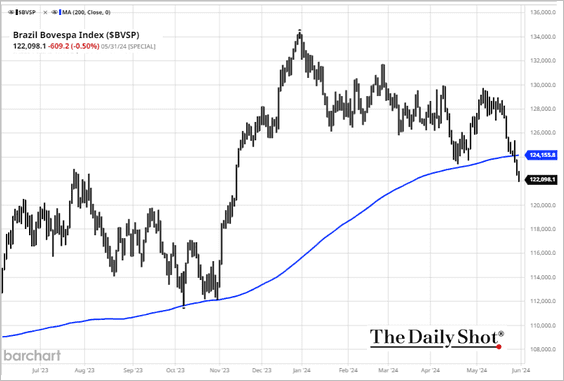
5. Brazil’s stocks have been under pressure.
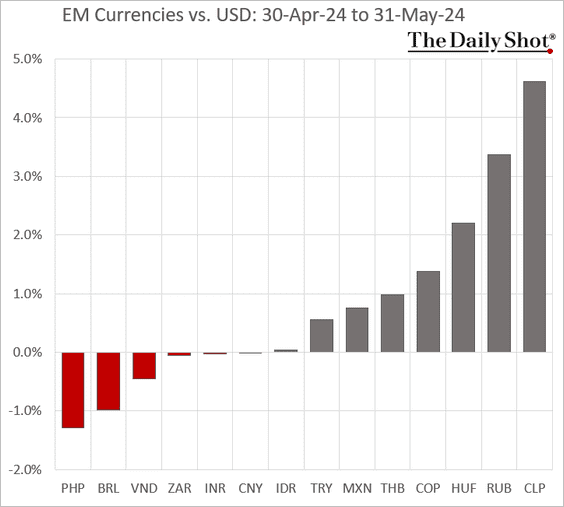
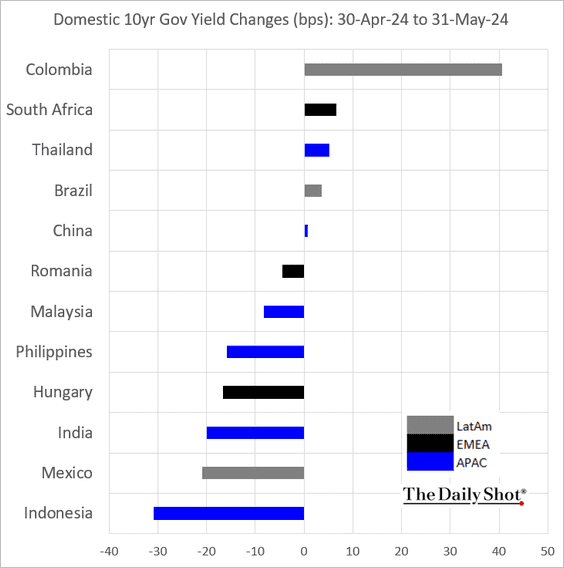
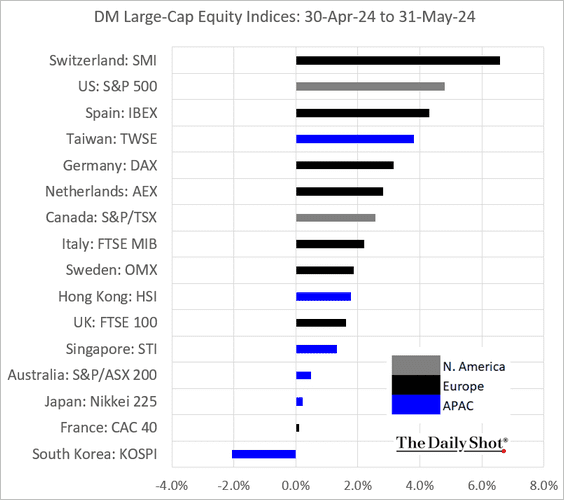
6. Next, we have some performance data for May.
• Currencies:
• Bond yields
• Equity ETFs:

Back to Index
Commodities
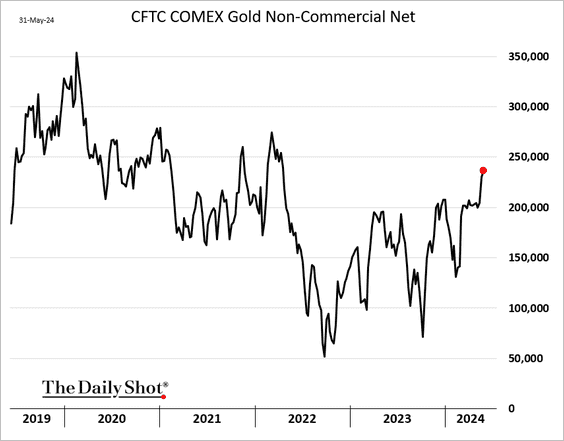
1. Speculative accounts continue to boost their bets on gold futures.
2. Robusta coffee volatility has been surging.
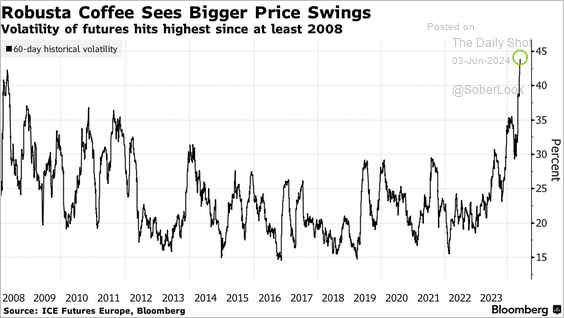 Source: @markets Read full article
3. Here is the performance data for May.

Back to Index
Energy
1. European natural gas futures are higher …

… amid Norwegian output outages.
 Source: @markets Read full article
Speculative accounts have been building long positions on European natural gas.
 Source: @markets Read full article
——————–
2. Here is a look at the US natural gas consumption.
 Source: @EIAgov
Back to Index
Equities
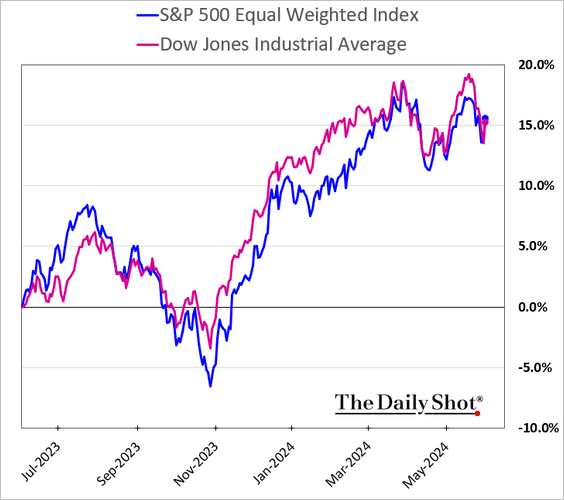
1. The divergence between the S&P 500 and the Dow has been widening, primarily driven by tech megacaps.
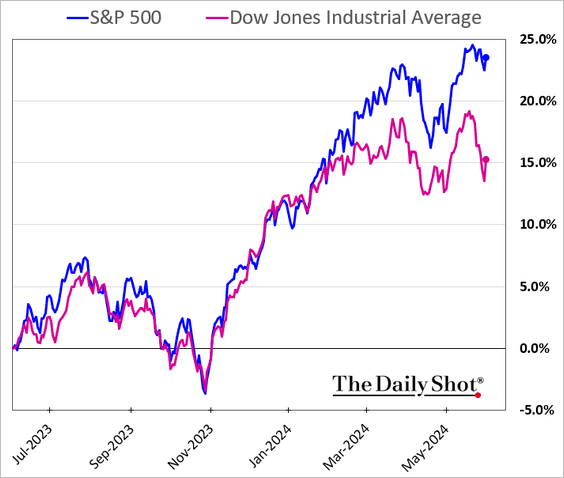
In contrast, the S&P 500 equal-weight index and the Dow have remained much more closely aligned.
——————–
2. Fewer stocks are outperforming the S&P 500, reflecting weakening breadth.
 Source: SentimenTrader
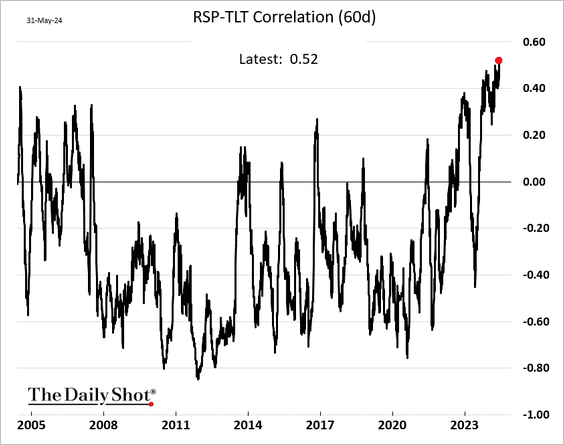
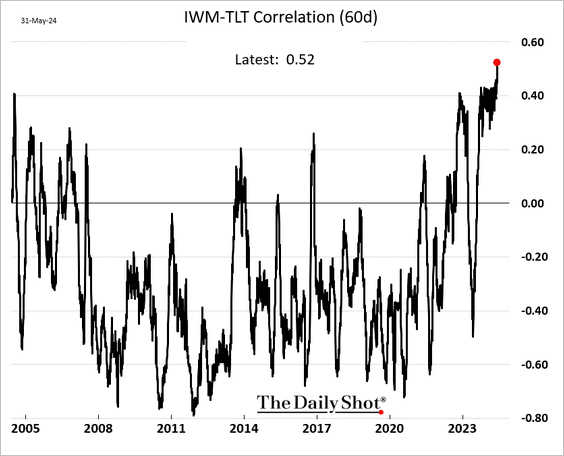
3. The stock-bond correlations have been surging.
– S&P 500 equal-weight index vs. long-term Treasuries:
– Small caps vs. long-term Treasuries:
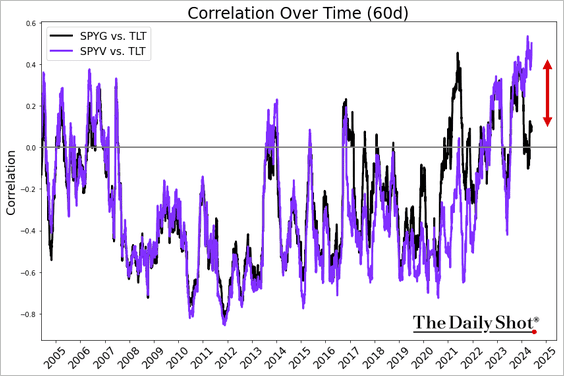
• S&P 500 value stocks are more correlated to Treasuries than growth stocks.
——————–
4. The stock/bond and stock/commodity price ratios remain in uptrends, while commodities are starting to breakout relative to long-term Treasuries.
 Source: Aazan Habib, Paradigm Capital
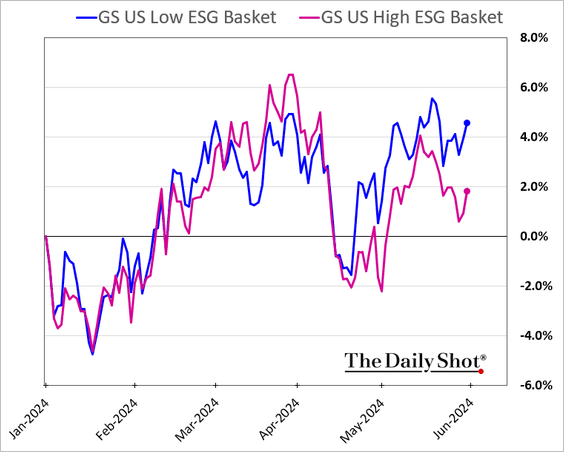
5. Companies with a strong focus on ESG have been underperforming lately.
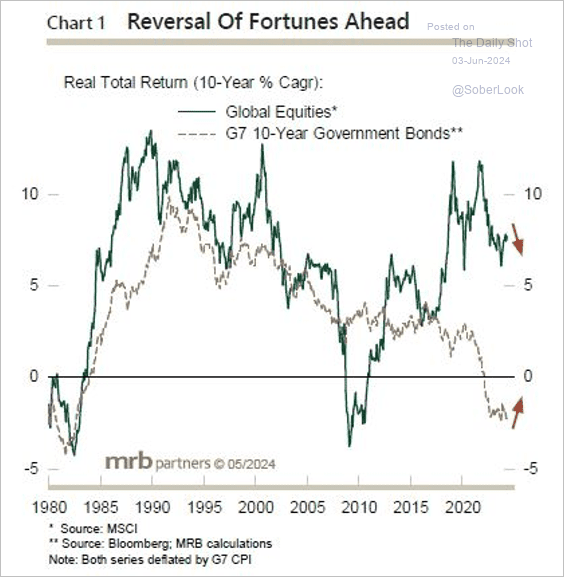
6. In real terms, G7 equity returns have moderated from high levels, while government bond returns could improve as inflation and yields decline.
 Source: MRB Partners
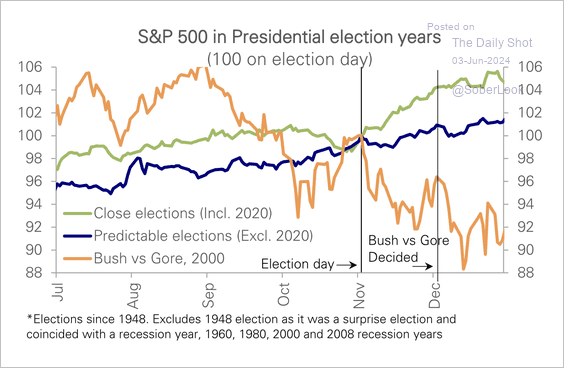
7. The S&P 500 typically performs best after predictable/close election results, while hung elections could be a headwind.
 Source: Deutsche Bank Research
8. Here is a look at the quarterly performance attribution for the S&P 500 and S&P 600 (small caps).

9. The momentum of global earnings revision ex-China returned to positive levels for the first time since March 2022.
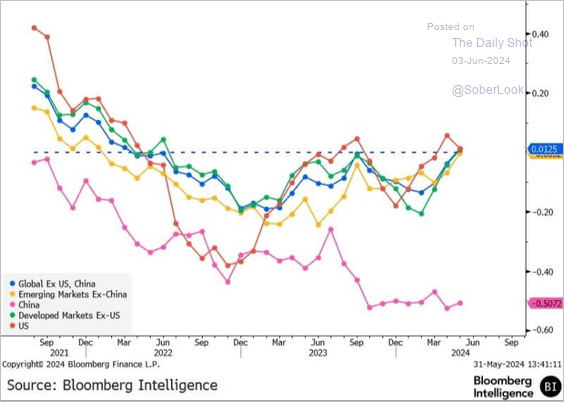 Source: @ginamartinadams
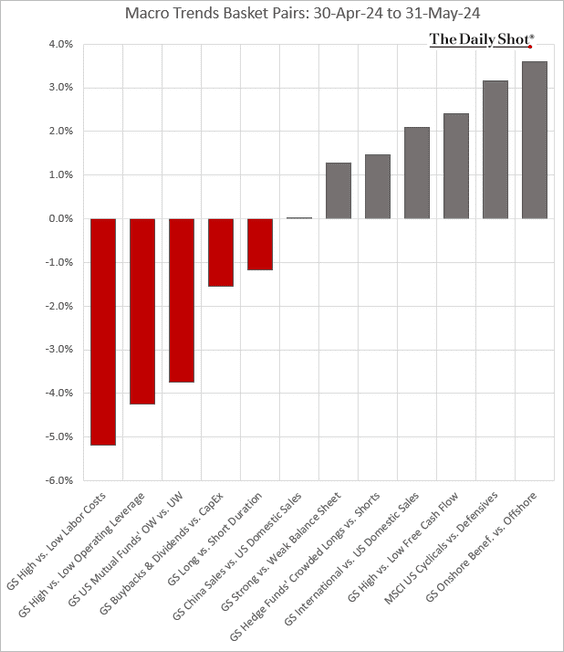
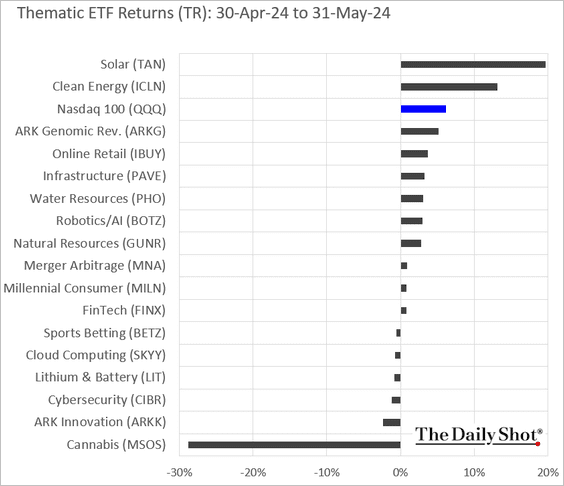
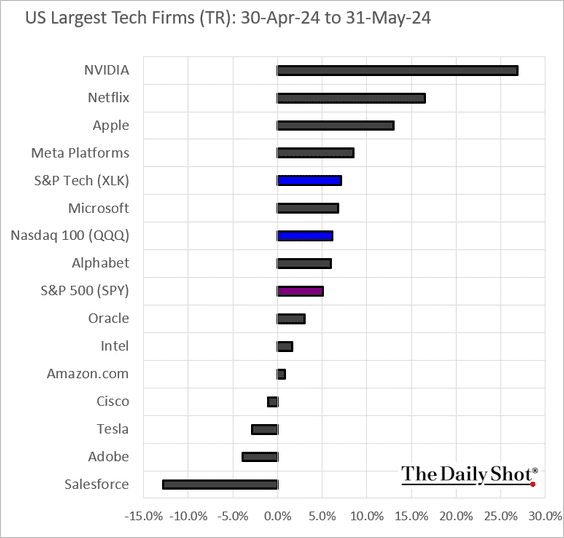
10. Finally, we have some performance data for May.
• Sectors:

• Equity factors:

• Macro basket pairs’ relative performance:
• Thematic ETFs:
• Largest US tech firms:
Back to Index
Credit
1. The leveraged loan distress ratio and default rate have eased over the past year.
 Source: PitchBook
• There was an uptick in US leveraged loan downgrades vs. upgrades in April, although the trend has been improving over the past year.
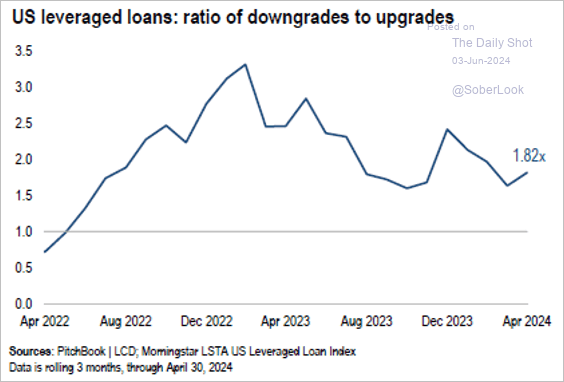 Source: PitchBook
• Demand for leveraged loans remains robust.
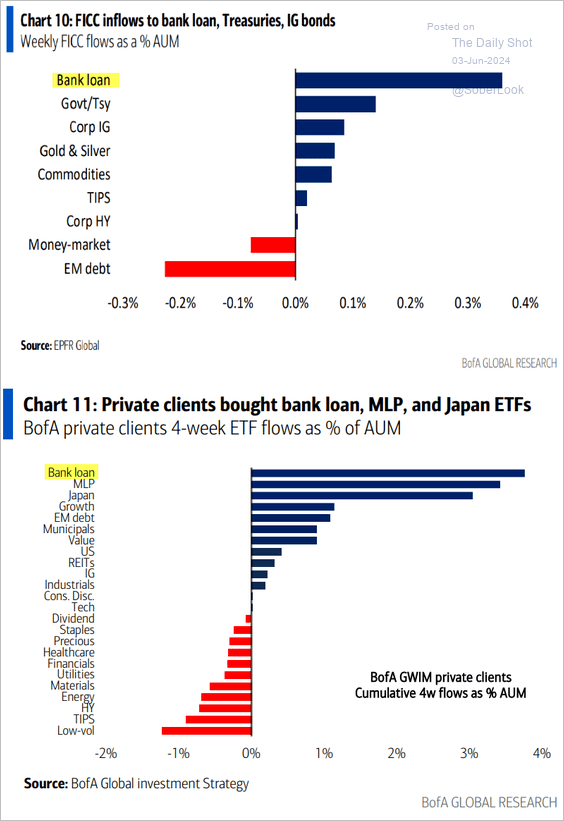 Source: BofA Global Research
——————–
2. There is still room for spread compression for non-agency CMBS.
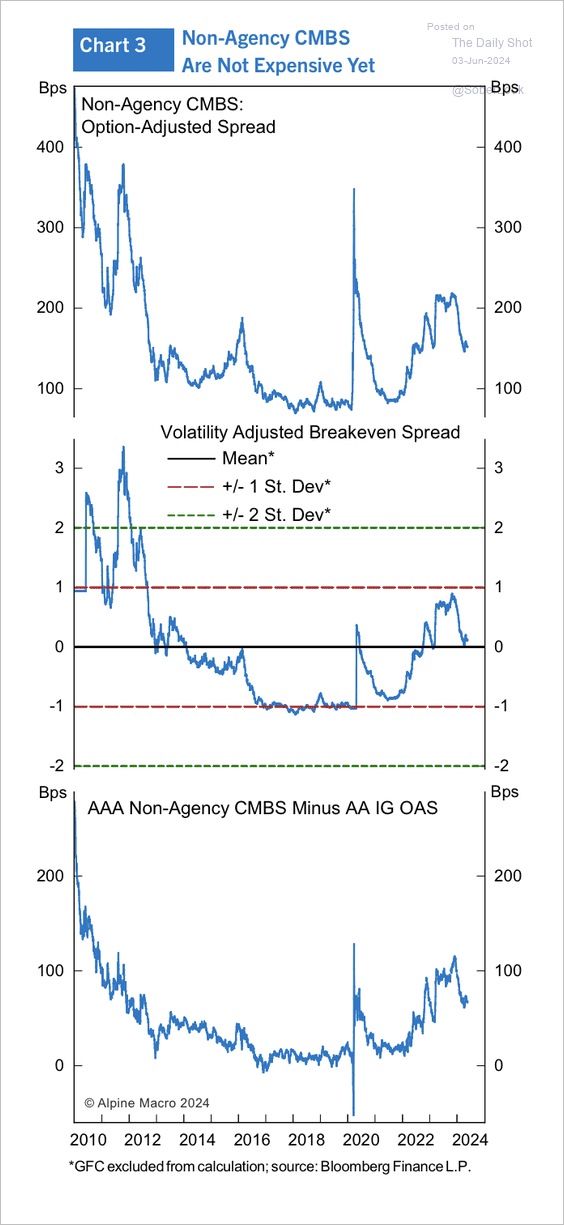 Source: Alpine Macro
3. Here is some performance data for May.

Back to Index
Global Developments
1. The US dollar index (DXY) continues to test the uptrend support.

2. This chart shows the number of homes built per 1000 people over the past decade.
 Source: @financialtimes Read full article
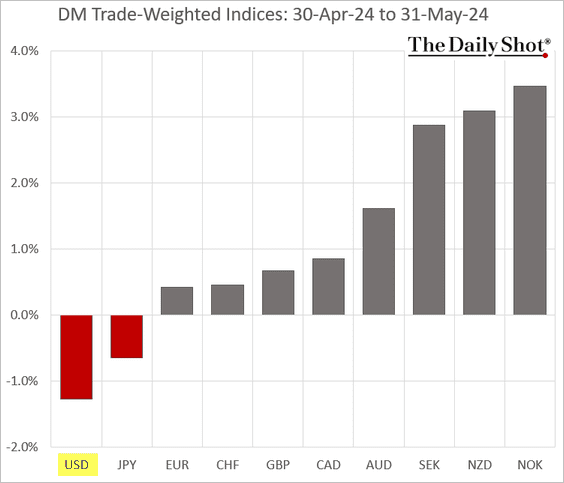
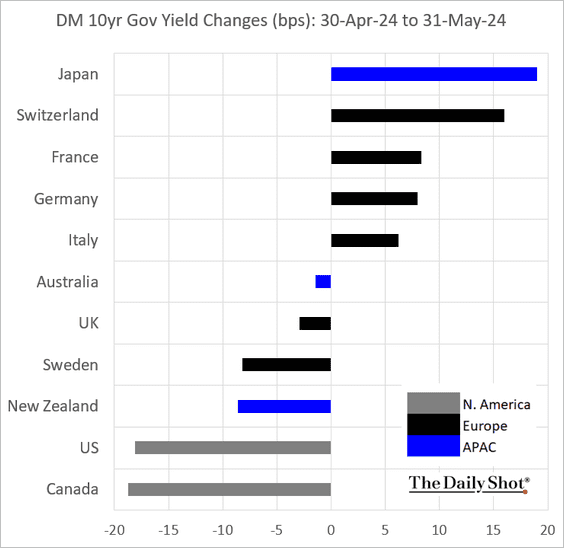
3. Finally, we have some performance data for May.
• Currencies:
• Bond yields:
• Equities:
——————–
Food for Thought
1. Nvidia’s income statement:
 Source: @WallStreetOasis
2. Percentage of hand-to-mouth households in the US:
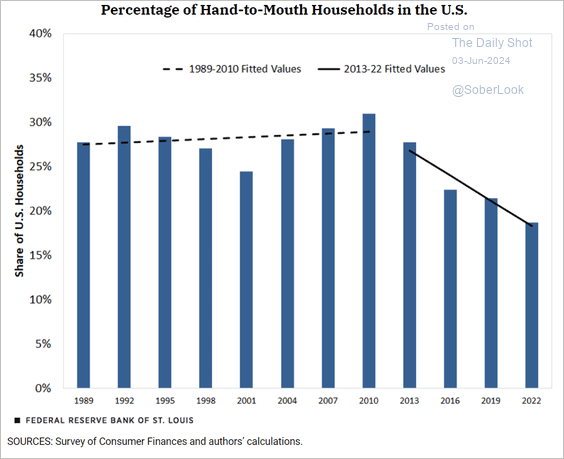 Source: St. Louis Fed Read full article
3. Generational values differences between Baby Boomers and Gen Z:
 Source: NewsNation video
4. Old-age population living in poverty:
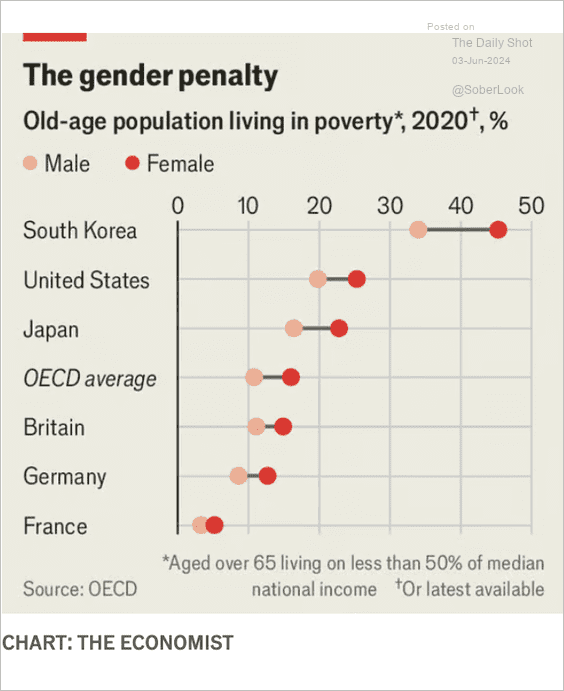 Source: The Economist Read full article
5. Ukraine’s exports:
 Source: @financialtimes Read full article
6. Military personnel in selected Middle Eastern countries:
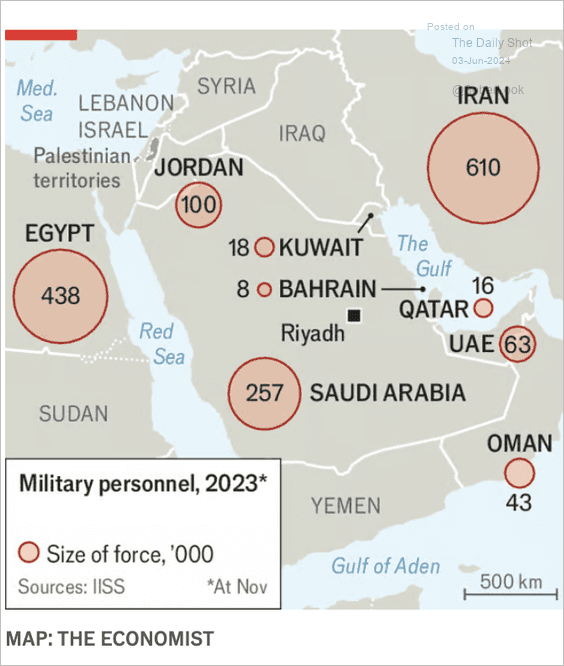 Source: The Economist Read full article
7. Who drinks tea?
 Source: Statista
——————–
Back to Index