
The Daily Shot: 04-Jun-24
• The United States
• Canada
• The Eurozone
• Europe
• Asia-Pacific
• Emerging Markets
• Cryptocurrency
• Commodities
• Energy
• Equities
• Credit
• Food for Thought
The United States
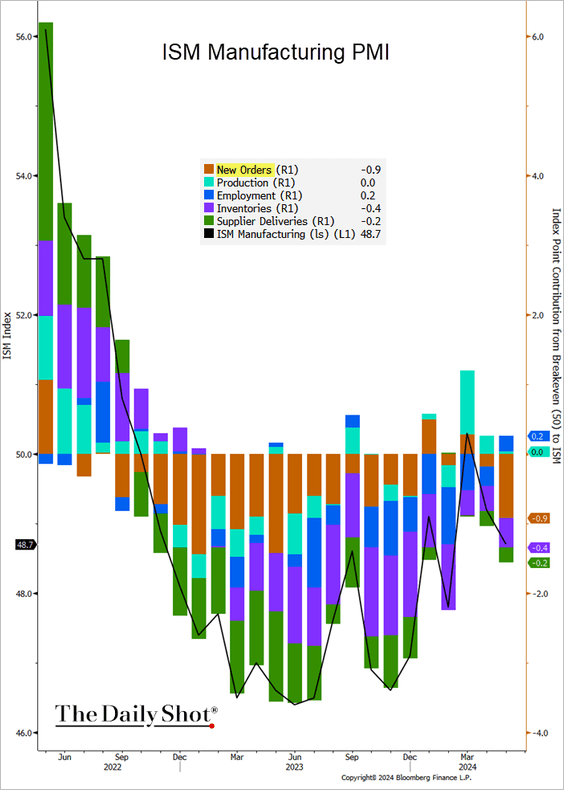
1. The ISM Manufacturing PMI moved deeper into contraction territory in May as demand softened.

 Source: @TheTerminal, Bloomberg Finance L.P.
 Source: MarketWatch Read full article
• The spread between indices of orders and inventories points to further weakness ahead.
 Source: @TheTerminal, Bloomberg Finance L.P.
• However, factories are hiring again.

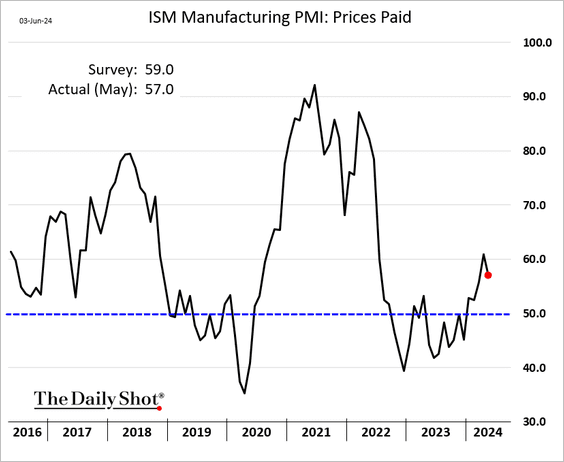
• Price pressures eased.
• The ISM PMI diverged from S&P Global’s US PMI indicator, which showed a modest expansion in factory activity last month.
 Source: @TheTerminal, Bloomberg Finance L.P.
• Will improving global liquidity boost factory activity?
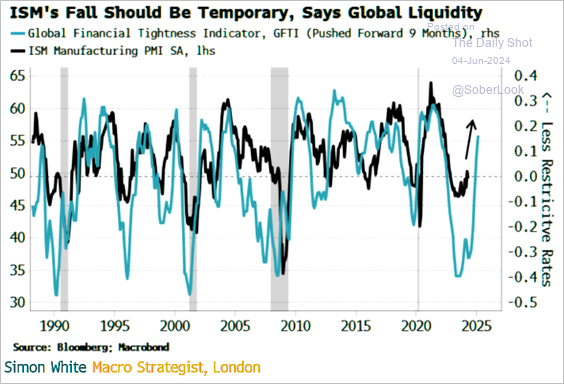 Source: Simon White, Bloomberg Markets Live Blog
——————–
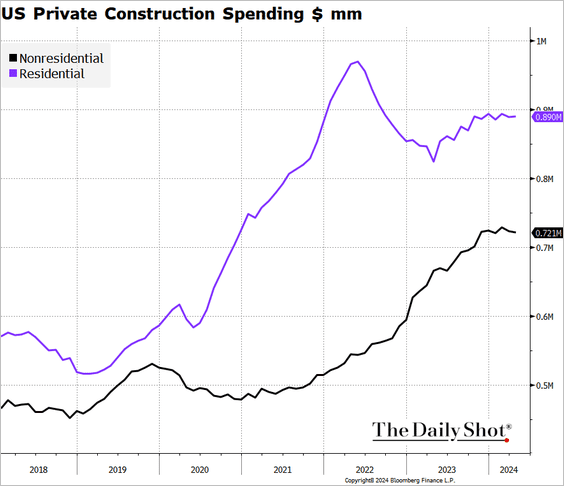
2. US construction spending was down for the second month in a row in April.
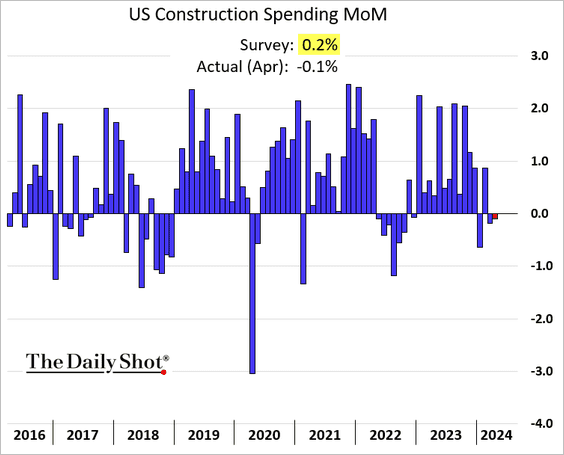
• Private residential spending edged higher, but nonresidential expenditures declined again.
 Source: @TheTerminal, Bloomberg Finance L.P.
– Here are the components of private residential spending (% of total).
 Source: Wells Fargo Securities
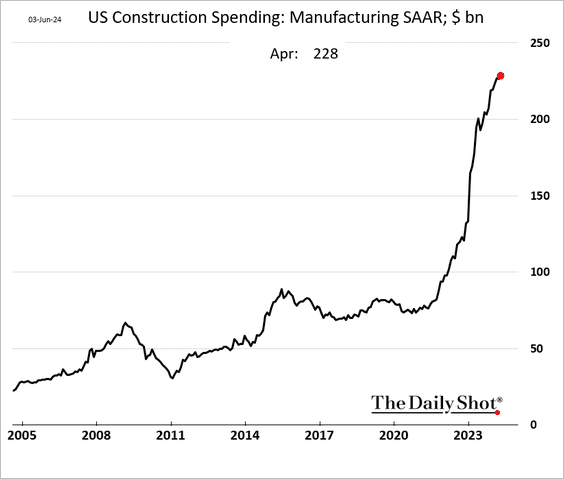
• Construction spending in manufacturing hit another record high, driven by investment in semiconductor facilities.
• Separately, office construction starts have been trending lower.
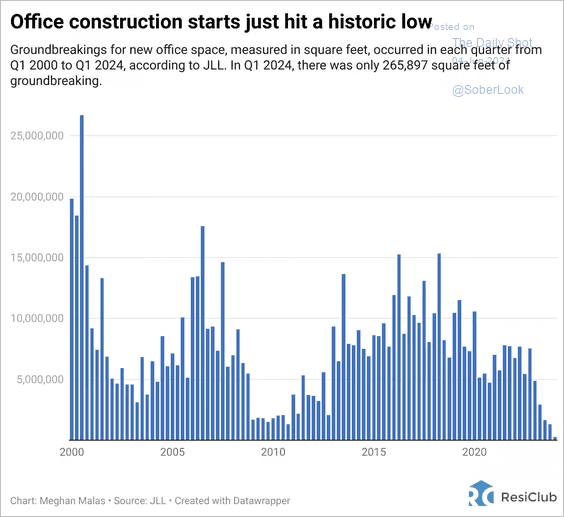 Source: ResiClub Read full article
——————–
3. Weaker construction spending, combined with softer consumer spending on goods, pulled the Atlanta Fed’s GDP tracker further down (lowering the “fixed investment” component). The indicator is now below 2% (annualized).
 Source: Federal Reserve Bank of Atlanta
 Source: @TheTerminal, Bloomberg Finance L.P.
——————–
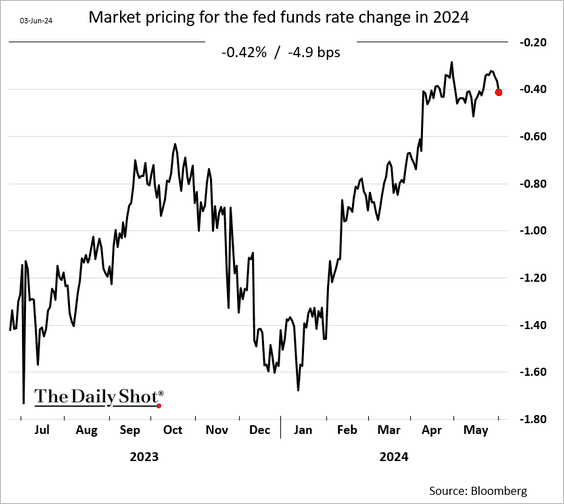
4. Bloomberg’s economic surprise index is near the lowest level since 2019.
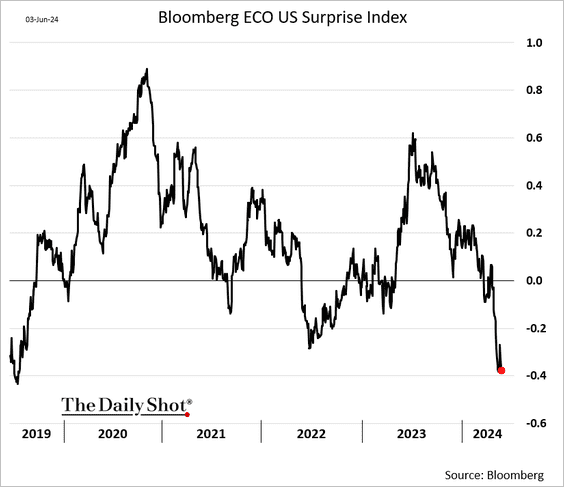
• The market pricing for Fed rate cuts in 2024 moved to 42 bps.
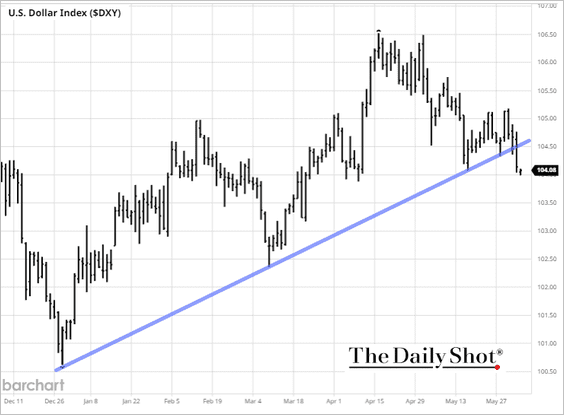
• Softer economic data is pressuring the US dollar.
——————–
5. Vehicle sales edged higher in May.

• Wholesale used vehicle prices increased in May for the first time in eight months.

——————–
6. Labor productivity at the largest US firms has been increasing.
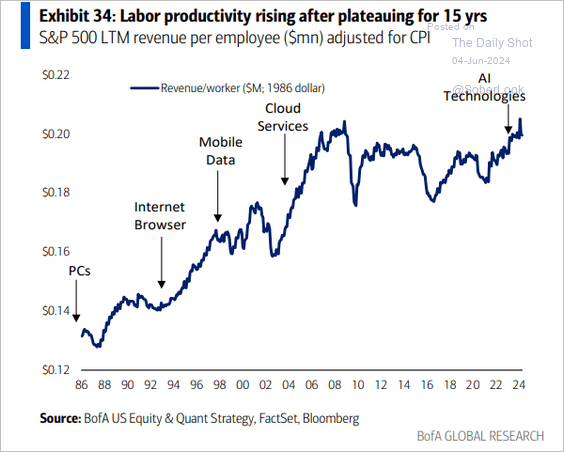 Source: BofA Global Research; @MikeZaccardi
Back to Index
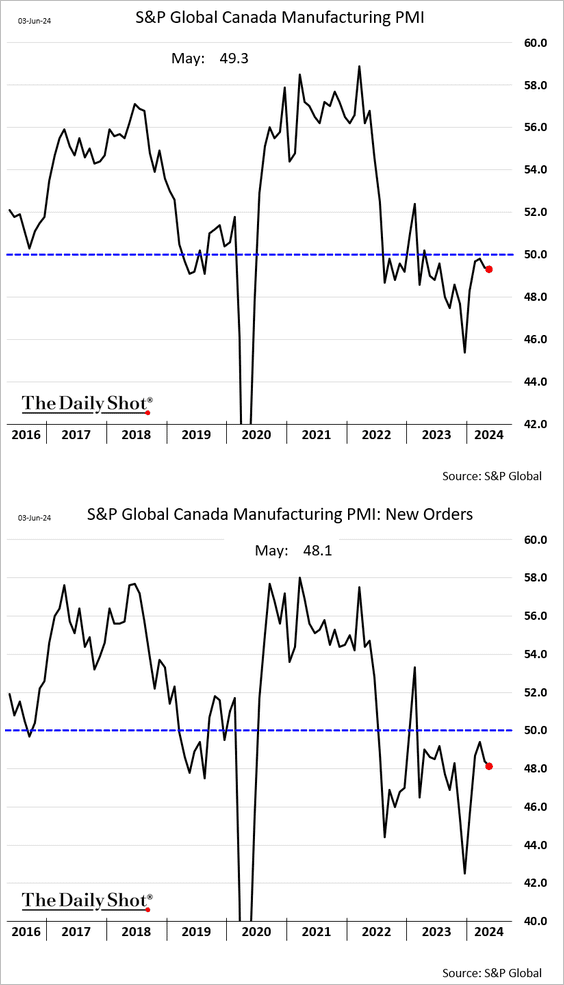
Canada
1. Factory activity continues to contract amid softer demand.
2. Consumer confidence is rebounding.

Back to Index
The Eurozone
1. The May manufacturing PMIs have been mixed, with strong results from the Netherlands and Spain, …
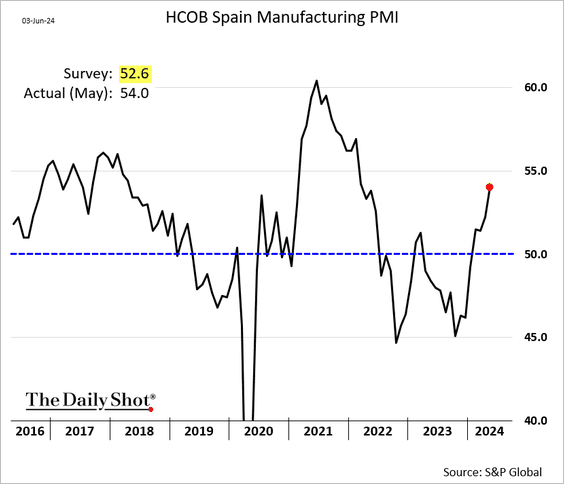
 Source: S&P Global PMI
… but more weakness in Italy.
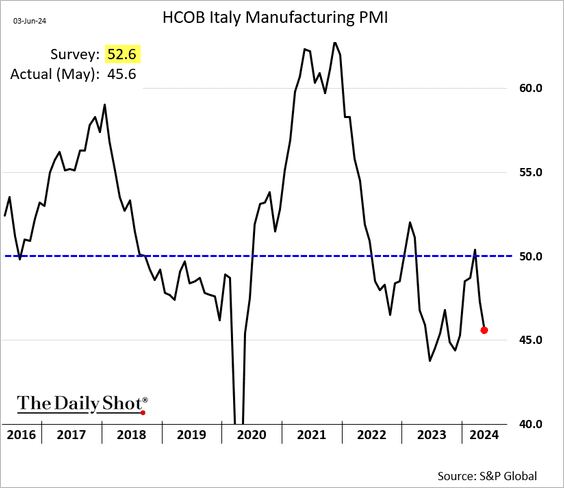
The contraction in manufacturing activity at the Eurozone level has been slowing.

——————–
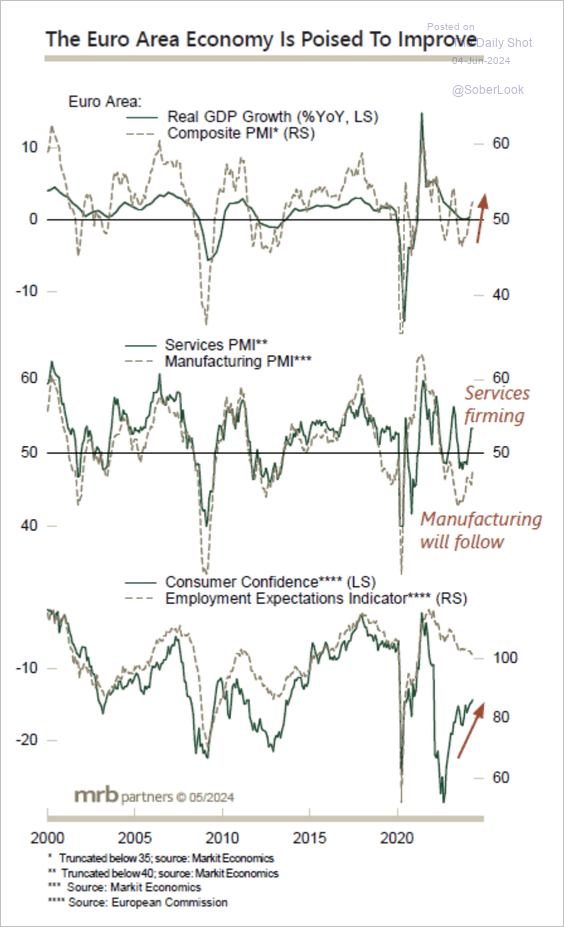
2. The euro area’s economic outlook is improving, which could support equities. (2 charts)
 Source: MRB Partners
 Source: MRB Partners
Back to Index
Europe
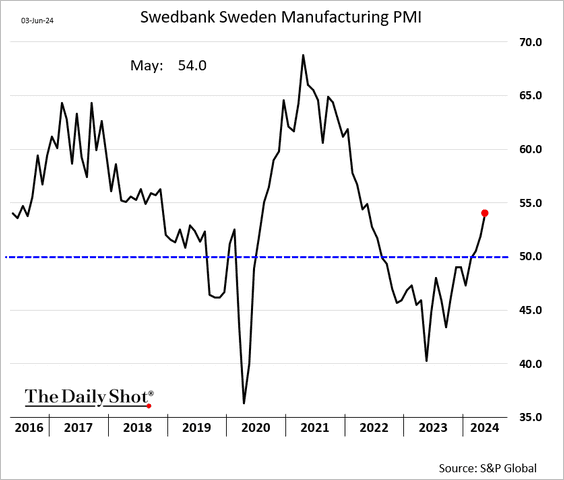
1. Sweden’s factory activity is accelerating.
2. Manufacturing activity in Central Europe continues to contract.

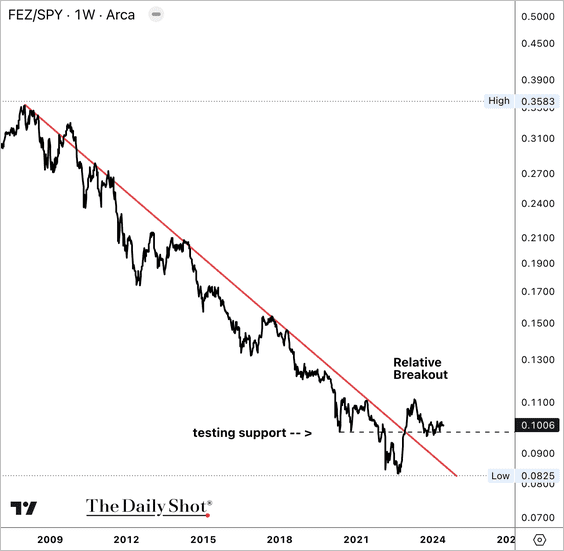
3. The SPDR Euro Stoxx 50 ETF (FEZ) is holding support vs. the S&P 500 ETF (SPY) after breaking above a long-term relative downtrend.
4. Here is a look at the EU’s goods trade with China.
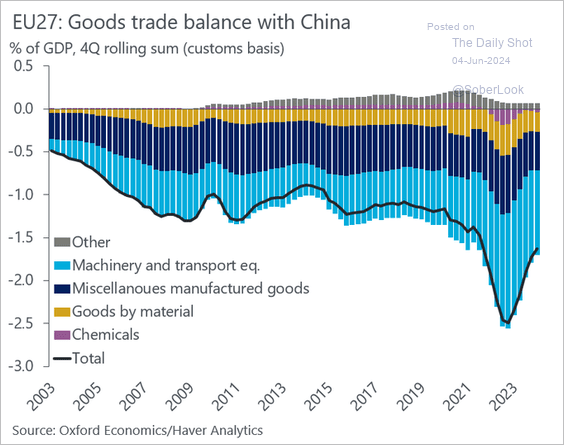 Source: @DanielKral1, @OxfordEconomics
Back to Index
Asia-Pacific
1. South Korea’s inflation continues to ease.

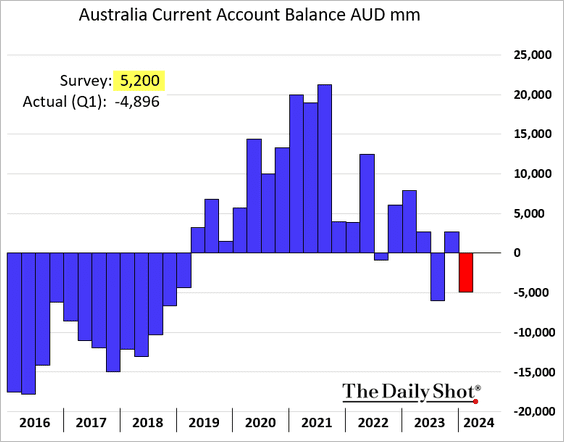
2. Australia’s current account unexpectedly swung into deficit last quarter.
Back to Index
Emerging Markets
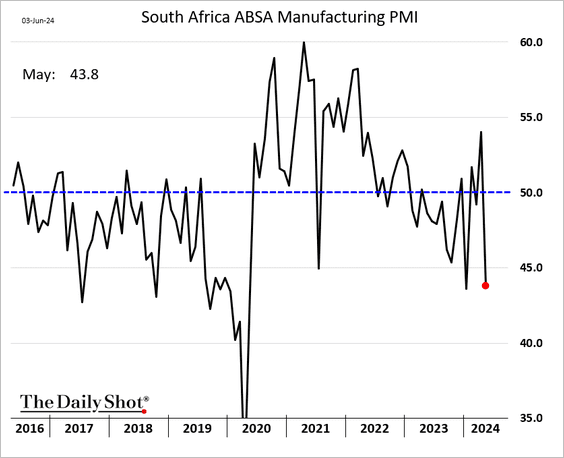
1. Let’s continue with May’s manufacturing PMI data.
• ASEAN (accelerating):
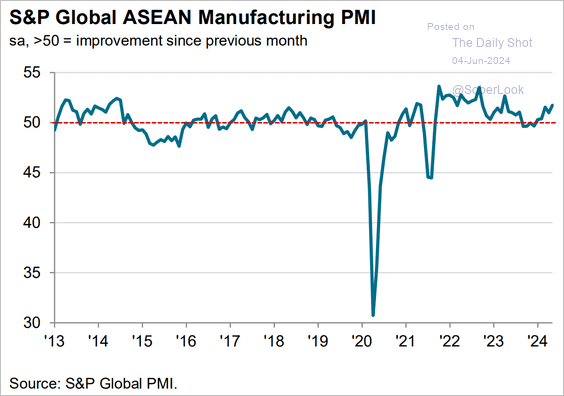 Source: S&P Global PMI
• Turkey (deeper contraction):

• South Africa (a sudden pullback):
• Brazil (slower growth):

• Mexico (steady):

——————–
2. The Mexican peso experienced the worst decline since the COVID shock in 2020.
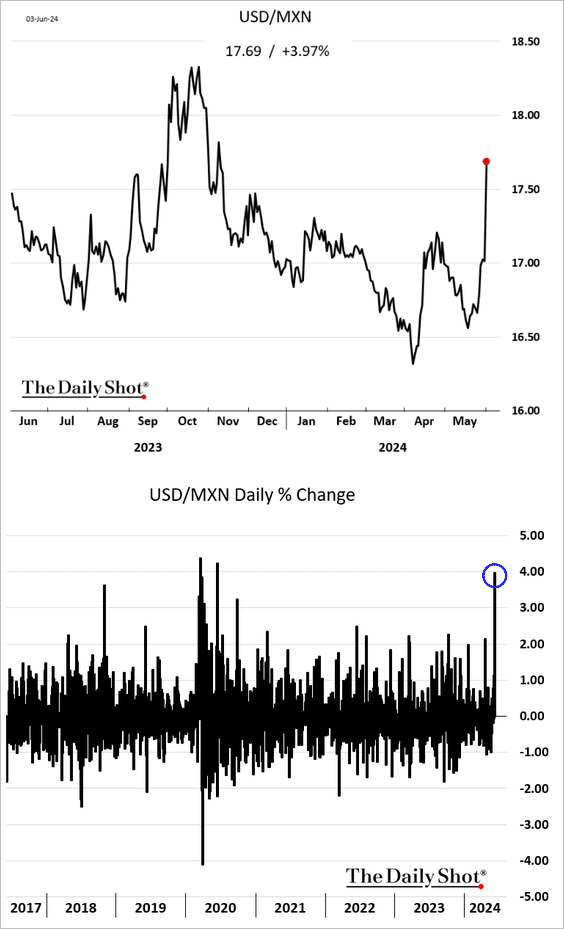
– Implied volatility jumped.

– The largest Mexican equity ETF (EWW) was down over 10% on Monday.
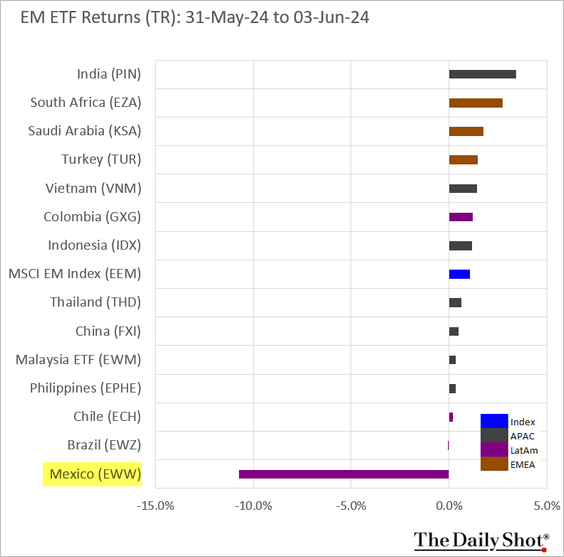
 Source: Reuters Read full article
• Mexico’s loan growth is holding above 10% per year.

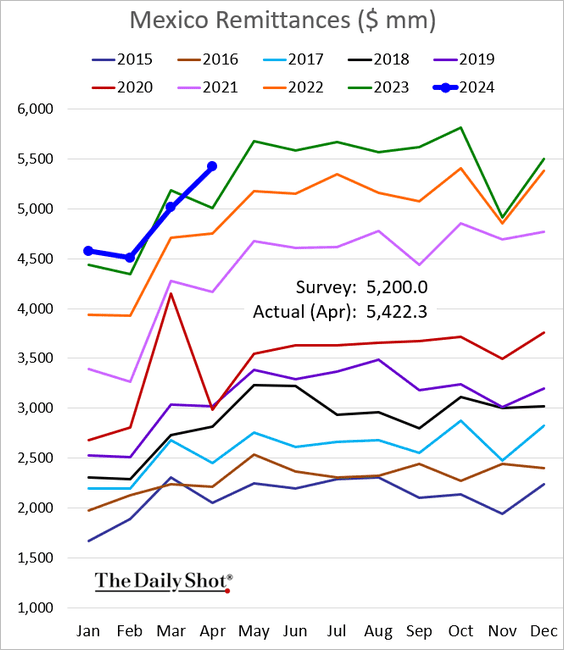
• Remittances hit a record high, topping expectations.
——————–
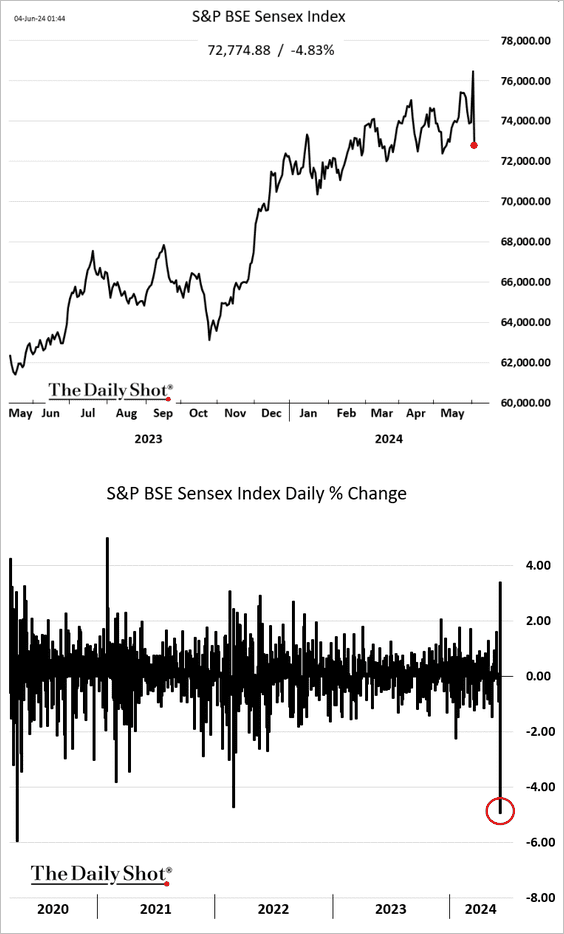
3. Indian stocks tumbled almost 5% after hitting a record high as the vote count continues.
4. Turkey’s core inflation remains near 75%.

5. EM equities have been underperforming.

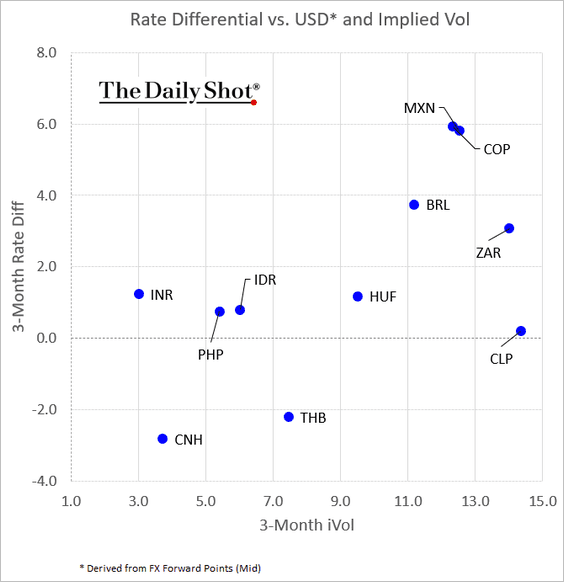
6. This scatterplot shows EM currency rate differentials vs. USD and implied volatility.
Back to Index
Cryptocurrency
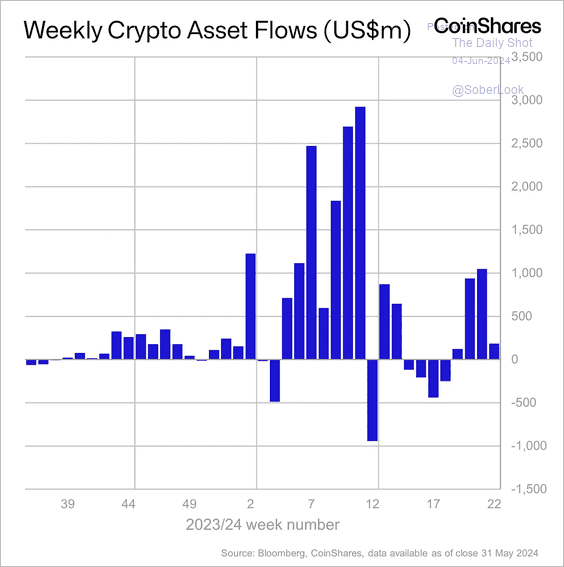
1. Crypto funds saw minor inflows last week led by long-Bitcoin and Ethereum-focused products. Investors exited short-bitcoin funds. (2 charts)
 Source: CoinShares Read full article
 Source: CoinShares Read full article
——————–
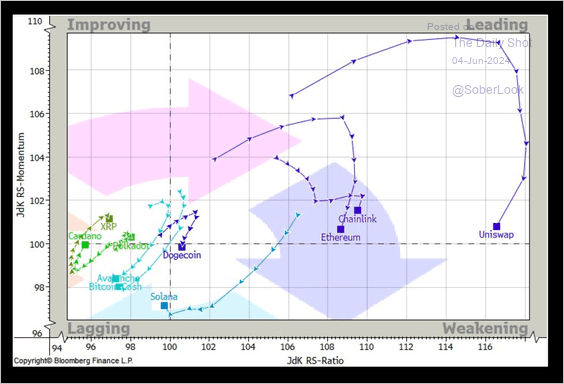
2. Top altcoins have displayed weakening relative strength and momentum vs. bitcoin over the past 10 days.
 Source: @StocktonKatie
Back to Index
Commodities
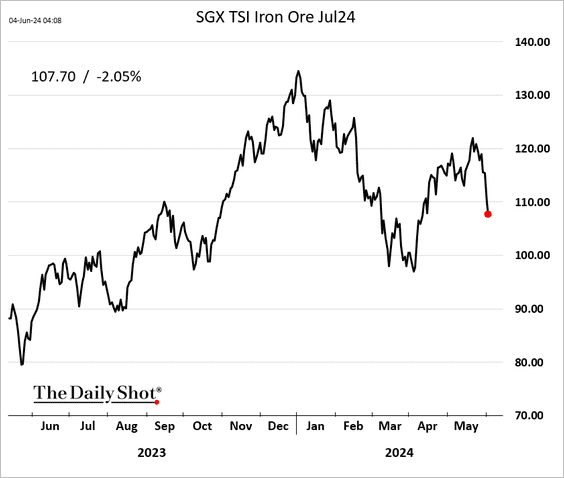
1. Iron ore futures are rolling over.
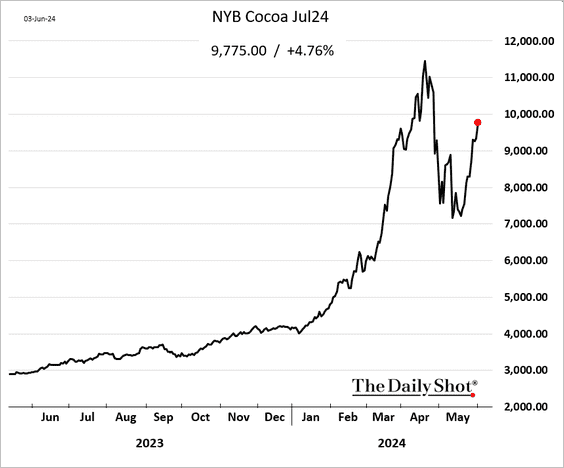
2. Cocoa futures are surging again.
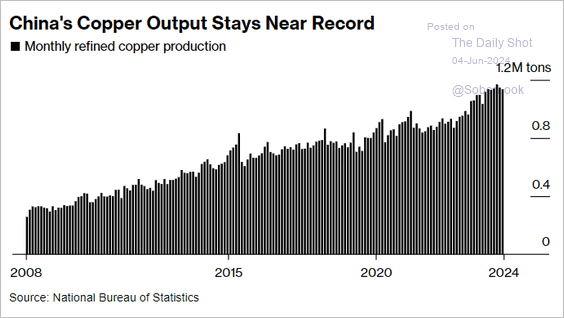
3. Here is a look at China’s copper output.
 Source: @markets Read full article
Back to Index
Energy
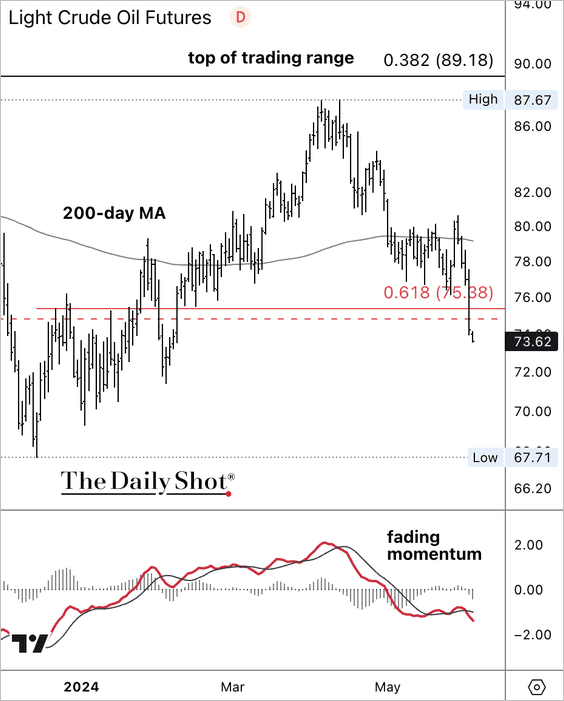
1. Crude oil is sharply lower this week after the OPEC+ meeting as the market appears to be well supplied.
 Source: @markets Read full article
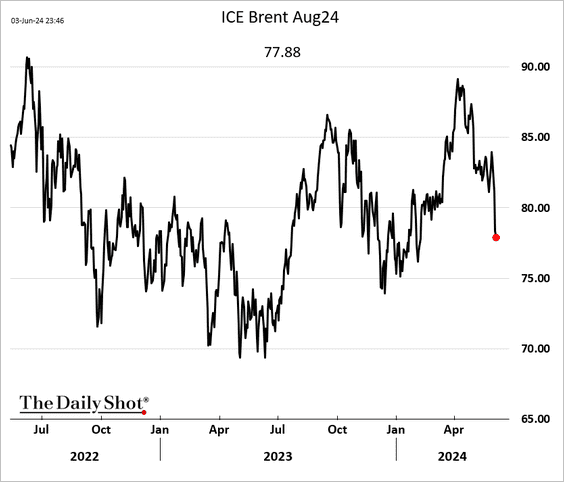
• WTI crude oil broke below support at $75/bbl, near the midpoint of its wide trading range.
– The news from South Korea didn’t help.
 Source: Reuters Read full article
• Here is the Brent curve.

• Could we see Brent futures below $60/bbl? The options market assigns a 5.5% probability of such an outcome by the end of July and an 8.2% probability by the end of August.

——————–
2. The US government is gradually rebuilding the Strategic Petroleum Reserve (at lower prices).
 Source: Reuters Read full article
 Source: @TheTerminal, Bloomberg Finance L.P.
——————–
3. US gasoline prices at the pump are heading lower.
 Source: @TheTerminal, Bloomberg Finance L.P.
Back to Index
Equities
1. June often starts with a rally in US stocks, only to fizzle out by month’s end.

2. Here is a look at the S&P 500 performance across the presidential election cycle.
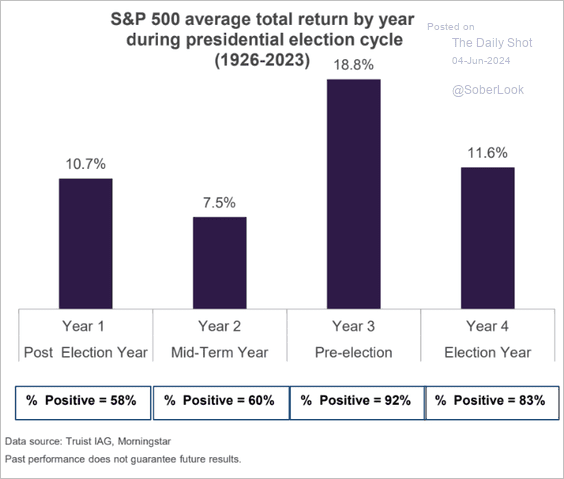 Source: Truist Advisory Services
3. Pump and dump activity is alive and well.
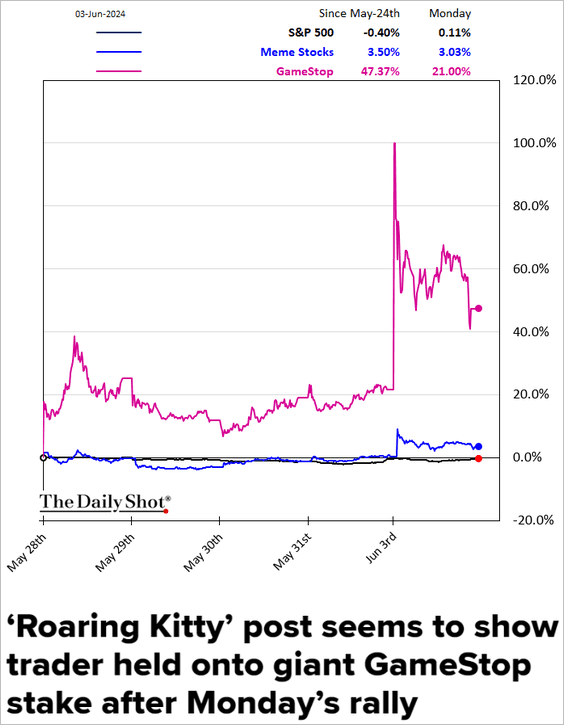 Source: CNBC Read full article
4. The S&P 500 concentration has been intensifying.
• Capitalization:
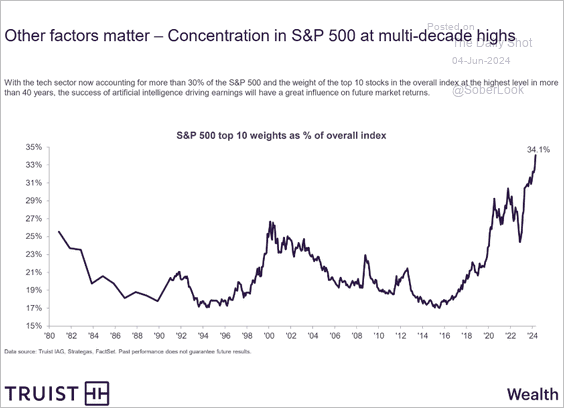 Source: Truist Advisory Services
• Performance:
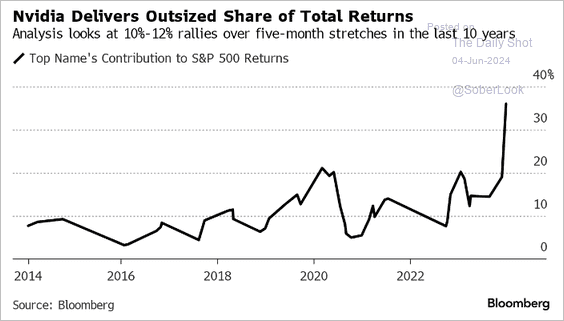 Source: Heather Burke, @TheTerminal, Bloomberg Finance L.P.
——————–
5. Hedge funds have been rotating out of software into semiconductors.
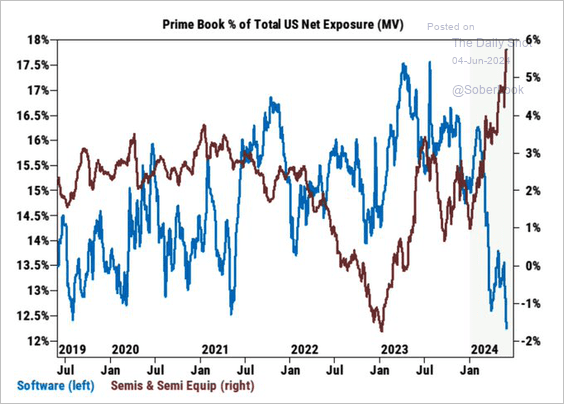 Source: Goldman Sachs; @WallStJesus
6. The S&P 500 liquidity has been improving.
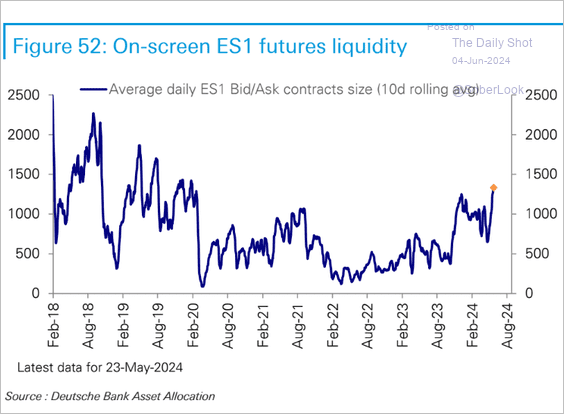 Source: Deutsche Bank Research
7. Short interest in S&P 500 stocks has been rising.
 Source: Goldman Sachs; @MikeZaccardi
8. Margins continue to improve.
 Source: @markets Read full article
9. Here is a look at valuations relative to the 10-year average across equity factors/styles.

Back to Index
Credit
1. The commercial real estate maturity wall is sizable, and a large portion of CRE-related debt has been extended rather than refinanced after the pandemic, according to Alpine Macro.
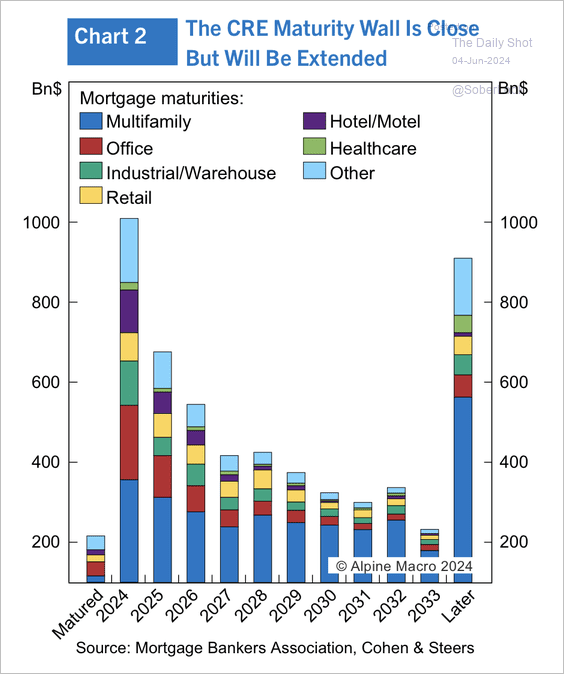 Source: Alpine Macro
• Small banks have been increasing CRE exposure.
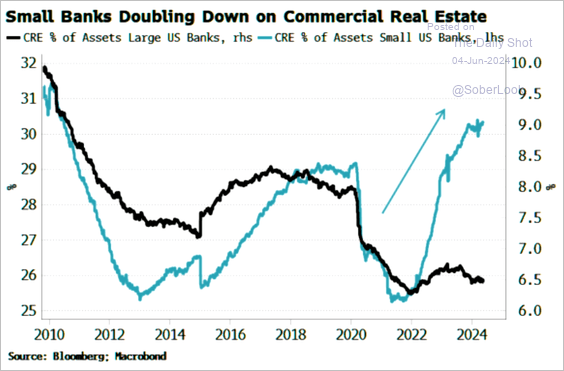 Source: Simon White, Bloomberg Markets Live Blog
• Non-agency CMBS has been a bright spot this year.
 Source: Alpine Macro
——————–
2. US investment-grade corporate bonds saw an increase in net upgrades in May.
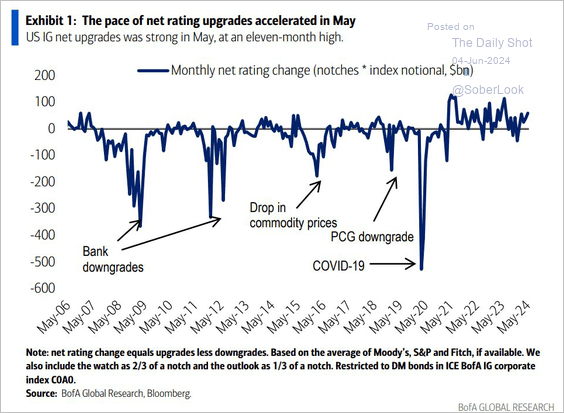 Source: BofA Global Research; @MikeZaccardi
3. This scatterplot shows yields vs. implied volatility (expected returns vs. perceived risk).

——————–
Food for Thought
1. Shift in fitness visits by time of day and its impact on fitness growth:
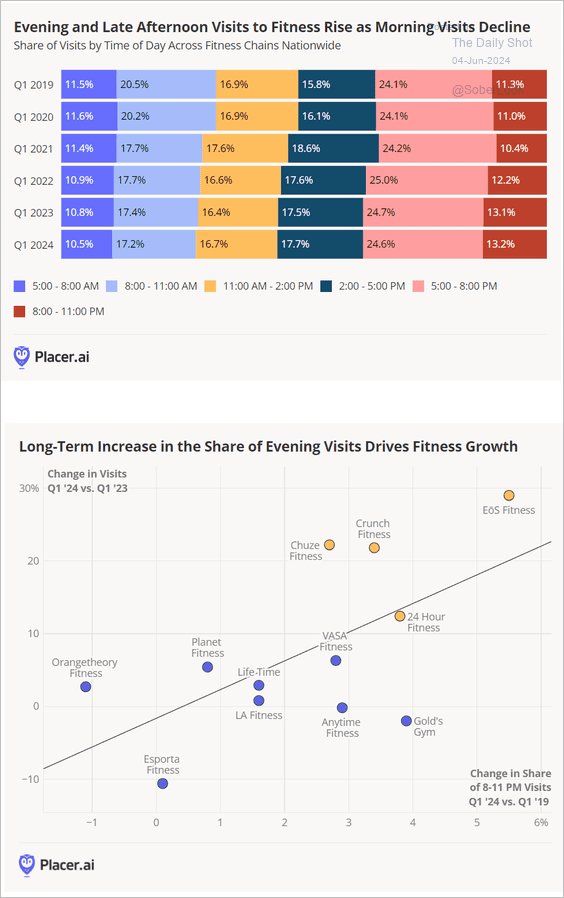 Source: Placer.ai
2. The top startup cities:
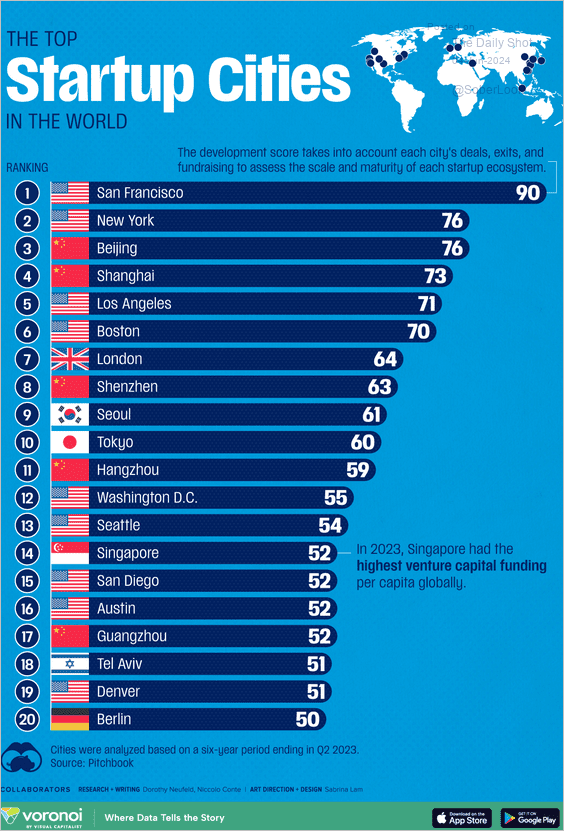 Source: Visual Capitalist Read full article
3. Change in US public school enrollment and number of schools by area type:
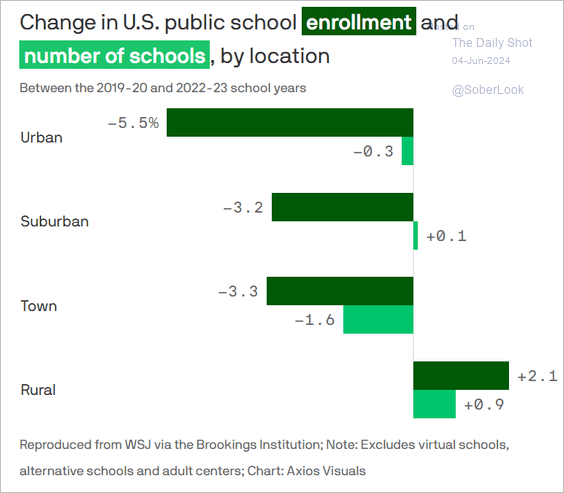 Source: @axios Read full article
4. Ex-USSR republics’ views on Russia:
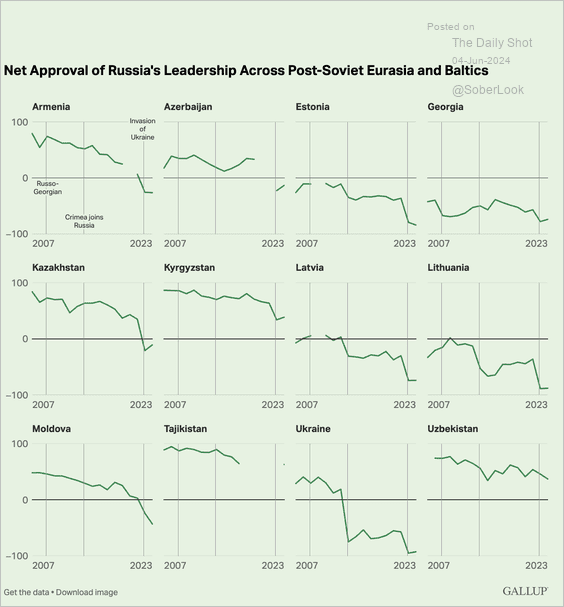 Source: Gallup Read full article
5. California’s average daily energy generation mix in April 2021 and April 2024:
 Source: The New York Times Read full article
6. Tech employment:
 Source: Torsten Slok, Apollo
7. Crocs:
 Source: @chartrdaily
——————–
Back to Index