
The Daily Shot: 05-Jun-24
• The United States
• Canada
• The Eurozone
• Europe
• Japan
• Asia-Pacific
• China
• Emerging Markets
• Commodities
• Energy
• Equities
• Credit
• Global Developments
• Food for Thought
The United States
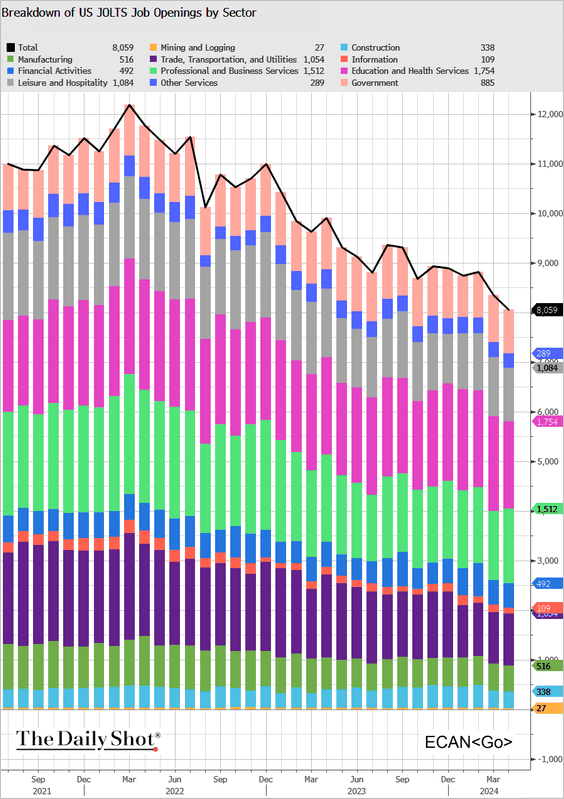
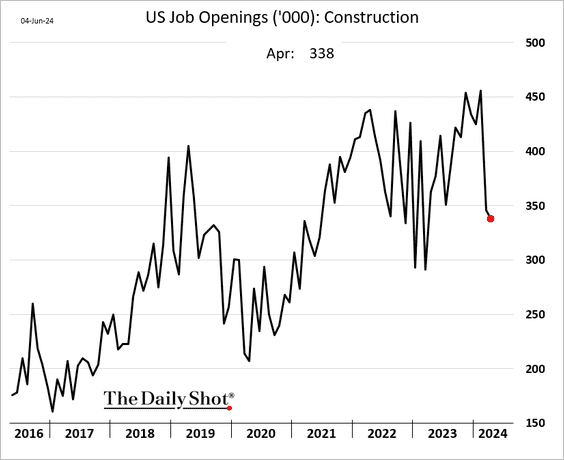
1. Job openings declined significantly in March and April, suggesting an easing of labor market imbalances. The April figure was below forecasts.

 Source: @TheTerminal, Bloomberg Finance L.P.
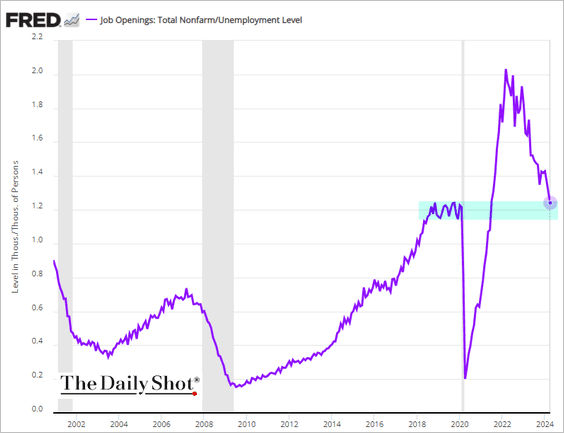
• The ratio of job openings to unemployed persons is near pre-COVID levels.
Here is the Beveridge Curve.
 Source: @TheTerminal, Bloomberg Finance L.P.
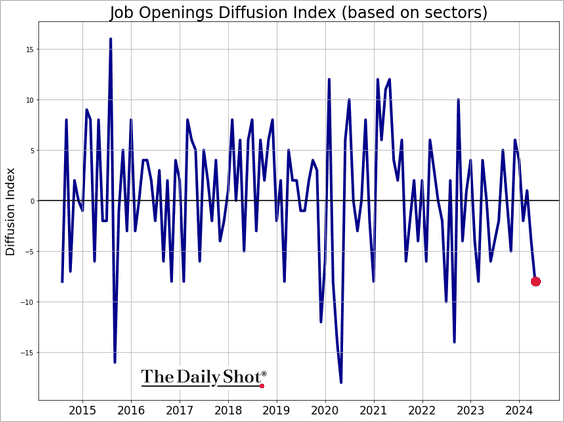
• The contraction in vacancies has been broadening.
• Business services registered an increase in openings, …
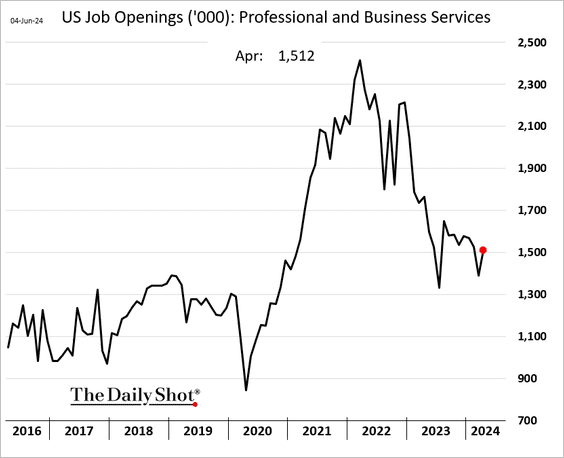
… but a number of other sectors continue to see declines (3 charts).


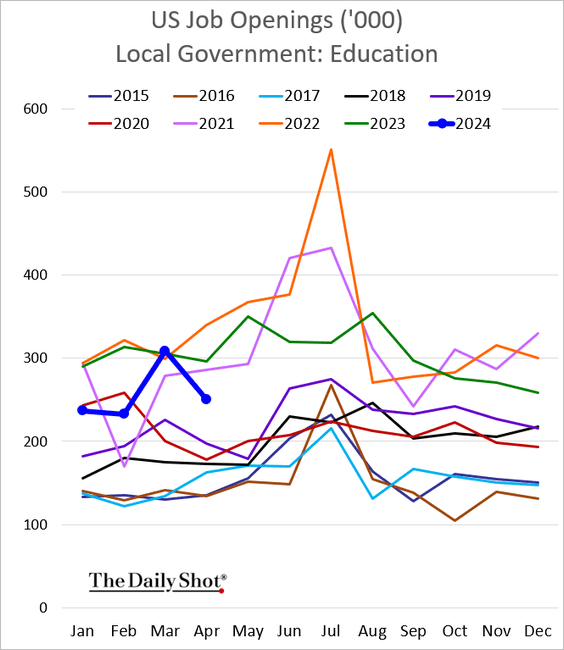
Vacancies for public school teachers are well below last year’s levels.
• The rate of layoffs remains below pre-pandemic levels.
 Source: @TheTerminal, Bloomberg Finance L.P.
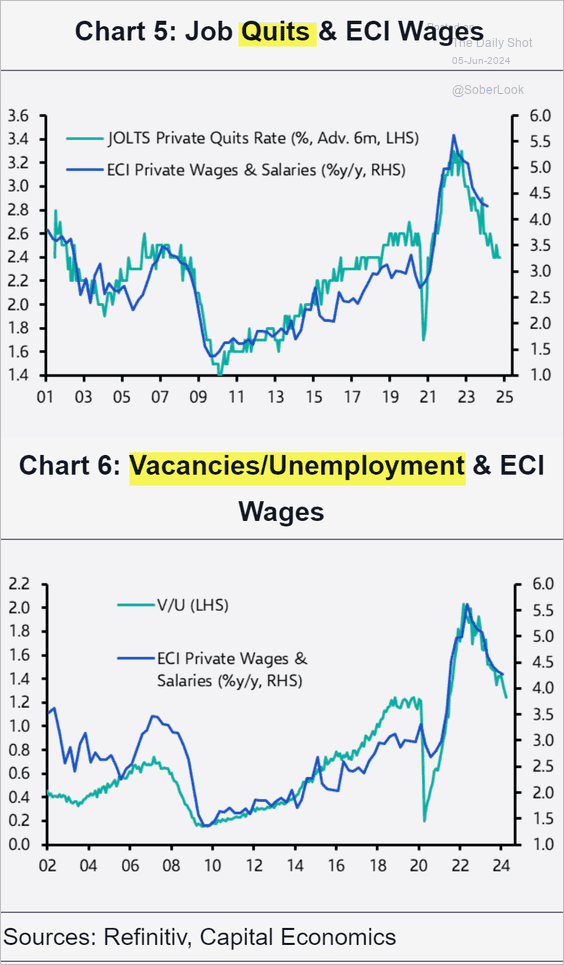
• Quits and the ratio of vacancies to unemployed persons signal slower wage growth ahead.
 Source: Capital Economics
——————–
2. Bloomberg’s economic surprise index hit its lowest level since 2019. The index of growth indicators is in contraction territory.

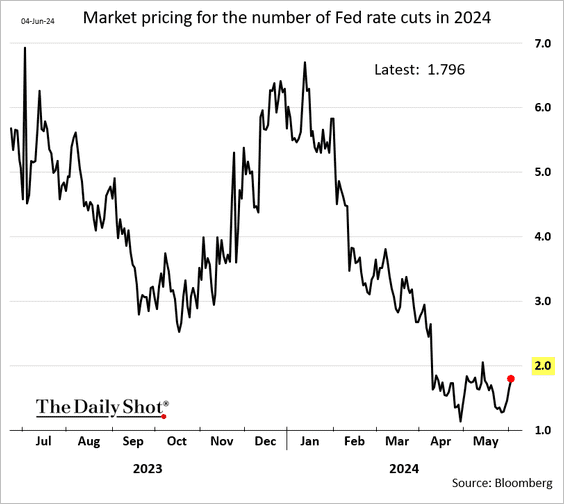
• The odds of two Fed rate cuts this year have been rising in recent days.
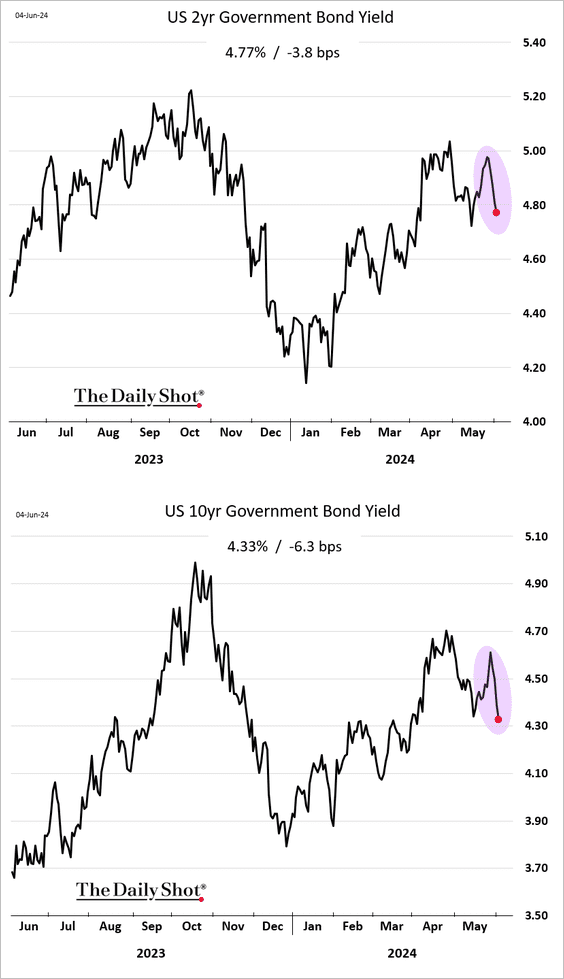
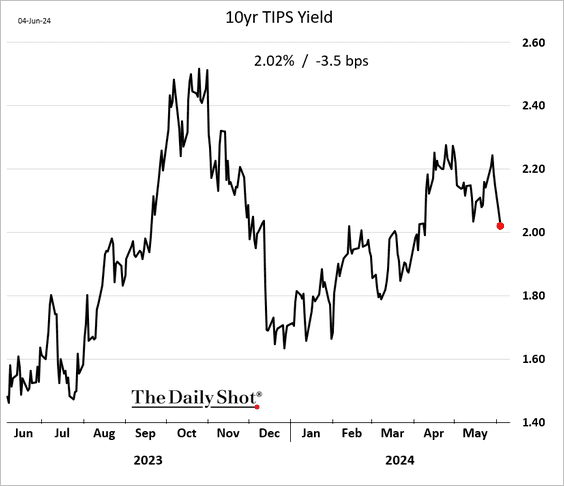
• Treasury yields fell again on Tuesday.
——————–
3. The Phillips Curve is nearing pre-pandemic levels.
 Source: BofA Global Research
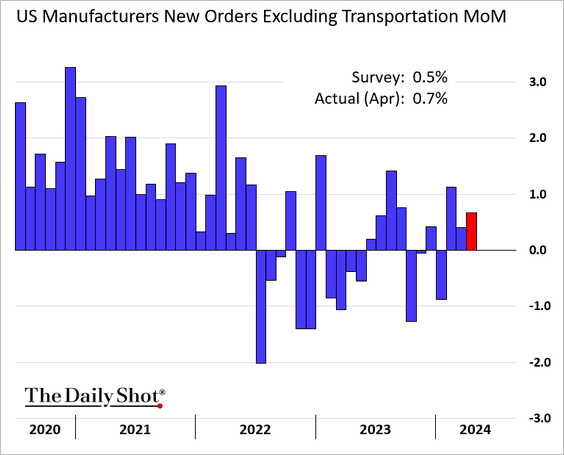
4. Factory orders were up for the third month in a row in April.
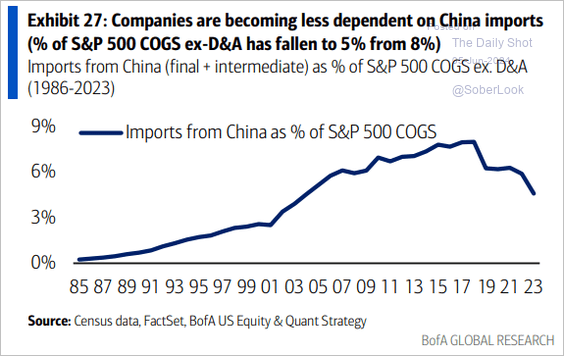
5. S&P 500 companies are becoming less dependent on imports from China.
 Source: BofA Global Research; @MikeZaccardi
6. Real household net wealth has returned to its long-term trend.
 Source: BCA Research
Back to Index
Canada
1. Bias-adjusted core inflation measures are now well inside the BoC’s target range.
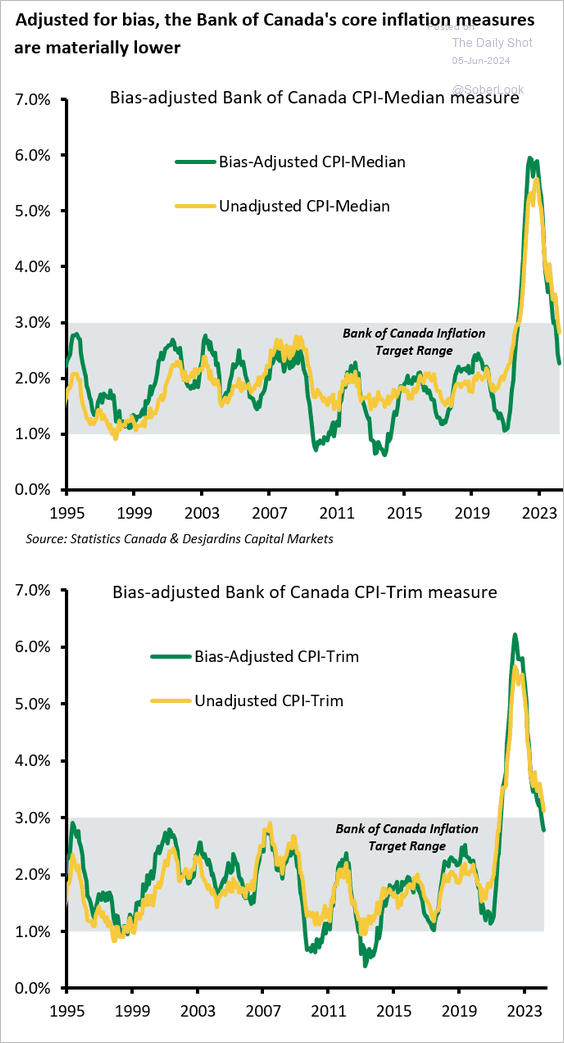 Source: Desjardins
2. Higher commodity prices should be a tailwind for Canadian stocks.
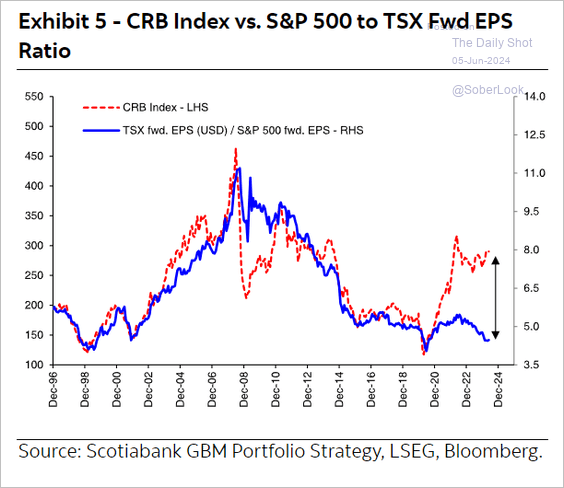 Source: Hugo Ste-Marie, Portfolio & Quantitative Strategy Global Equity Research, Scotia Capital
Back to Index
The Eurozone
1. The number of unemployed individuals in Germany continues to increase.
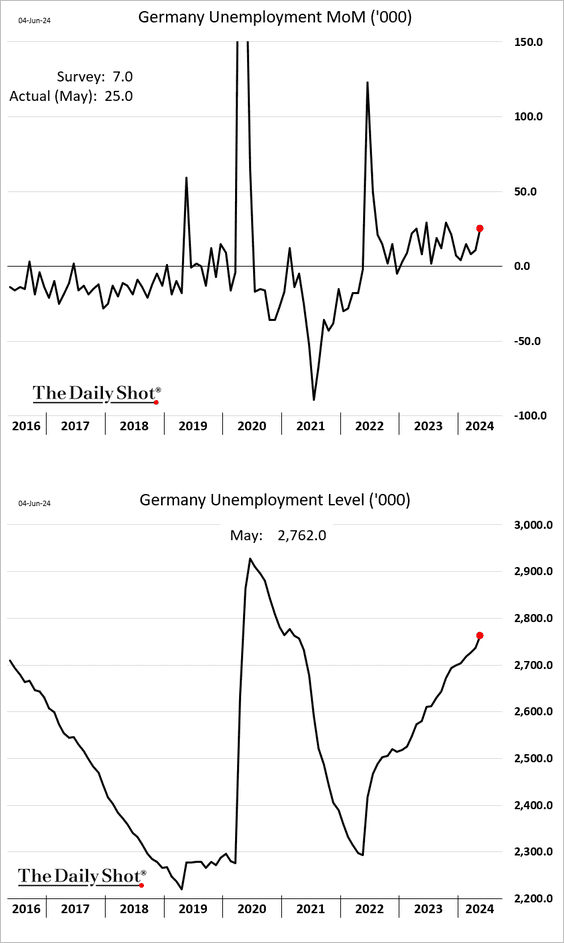
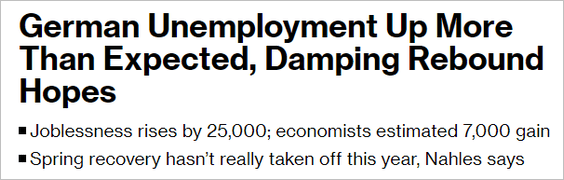 Source: @economics Read full article
——————–
2. This chart shows total employment trends in the largest euro-area economies.
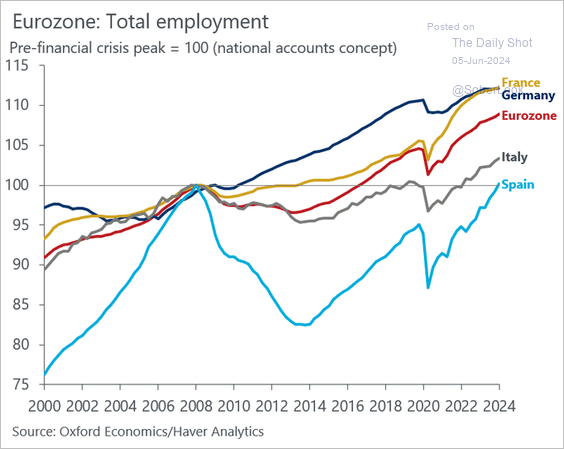 Source: @DanielKral1, @OxfordEconomics
3. Here is the Eurozone’s trade balance by product.
 Source: Eurostat Read full article
4. Euro-area bank valuations generally remain below those of international peers.
 Source: ECB
5. Low volatility can lead to a substantial compression in risk premia.
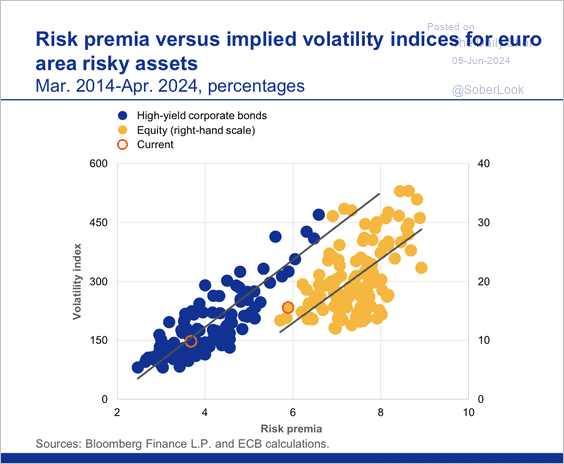 Source: ECB
Back to Index
Europe
1. Container shipping costs continue to climb.
 Source: @TheTerminal, Bloomberg Finance L.P.
2. The average European stock is now outperforming US counterparts.
 Source: @johnauthers, @opinion Read full article
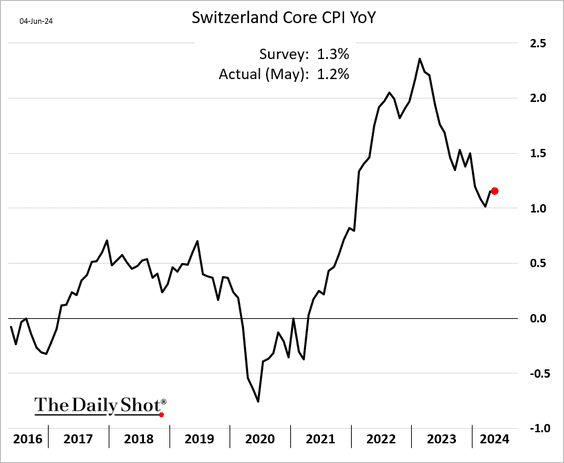
3. Swiss core inflation was slightly below forecasts.
4. Here is a look at the European Union’s trade in raw materials.
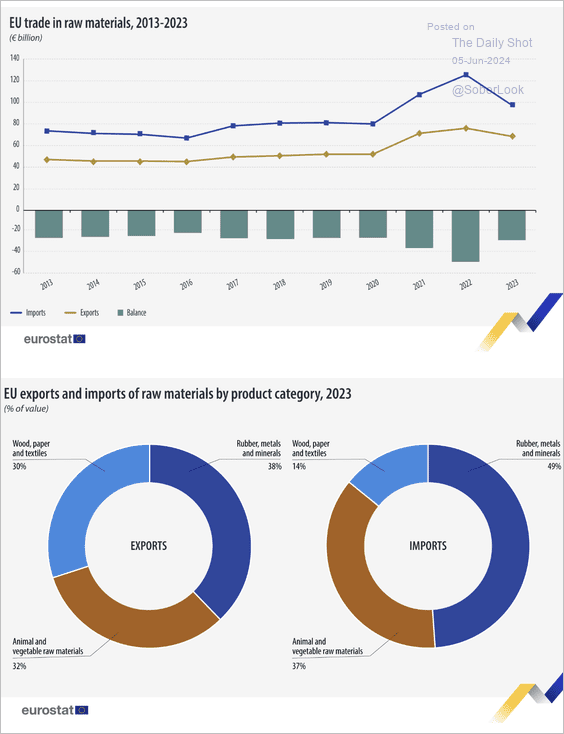 Source: Eurostat Read full article
Back to Index
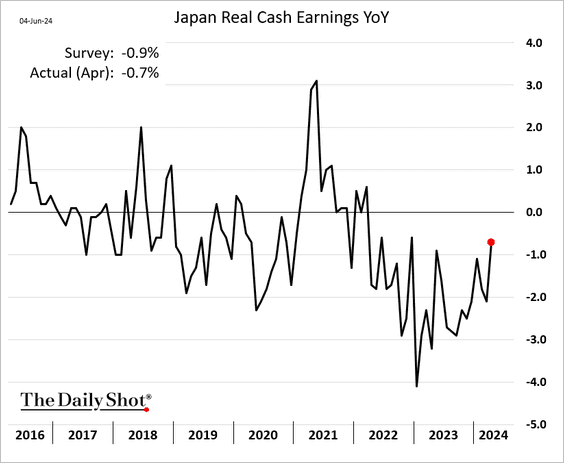
Japan
1. Real wages are showing signs of stabilization.
2. The Japanese “permanent portfolio” (25% gold, stocks, government bonds, cash) had relatively steady performance in real terms versus individual assets. (2 charts)
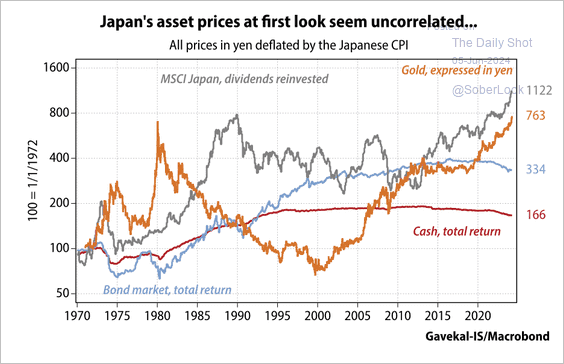 Source: Gavekal Research
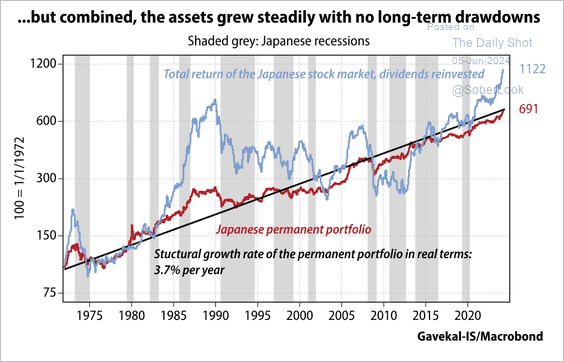 Source: Gavekal Research
Back to Index
Asia-Pacific
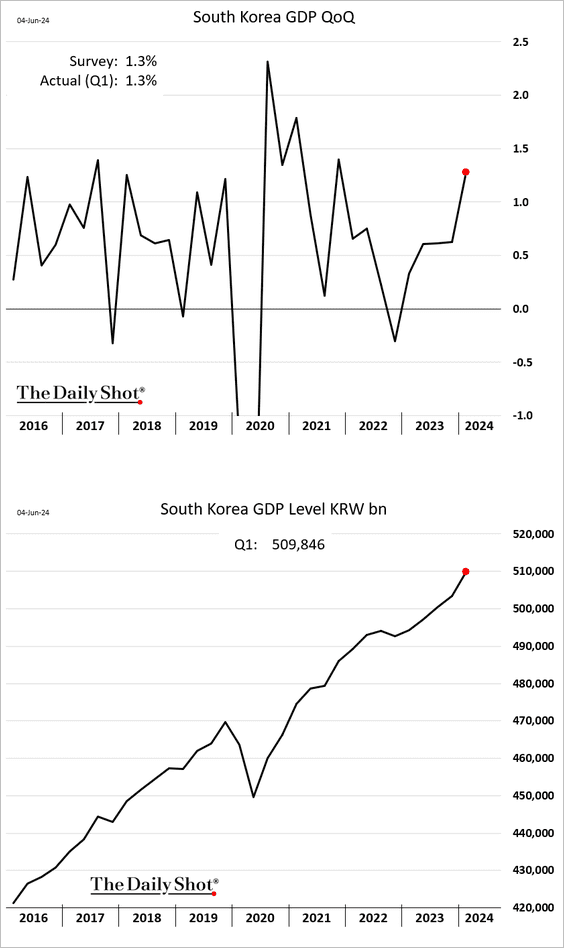
1. South Korea’s GDP growth picked up momentum last quarter.
2. Singapore’s business activity continues to expand.

3. Australia’s GDP growth slowed further in the first quarter.

 Source: Nikkei Asia Read full article
Back to Index
China
1. Services activity accelerated in May, boosted by stronger demand.

Companies are hiring again, …
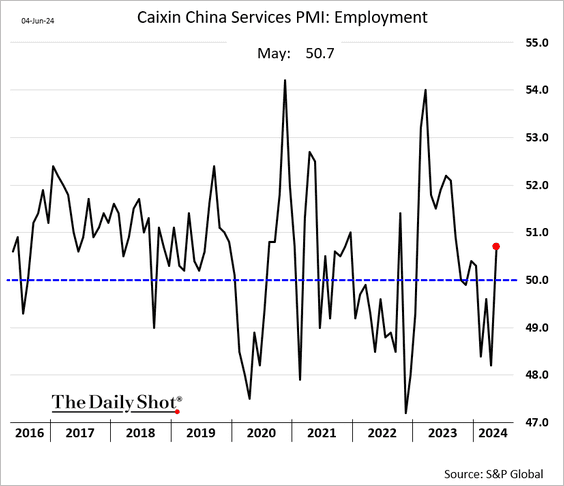
… and boosting prices. Are China’s deflationary pressures ebbing.

 Source: South China Morning Post Read full article
——————–
2. Hedge funds have been dumping Chinese stocks.
 Source: Goldman Sachs; @WallStJesus
3. GDP per capita varies significantly across different regions in China.
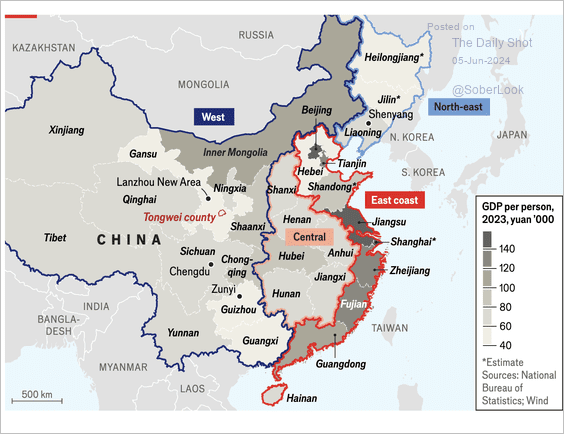 Source: The Economist Read full article
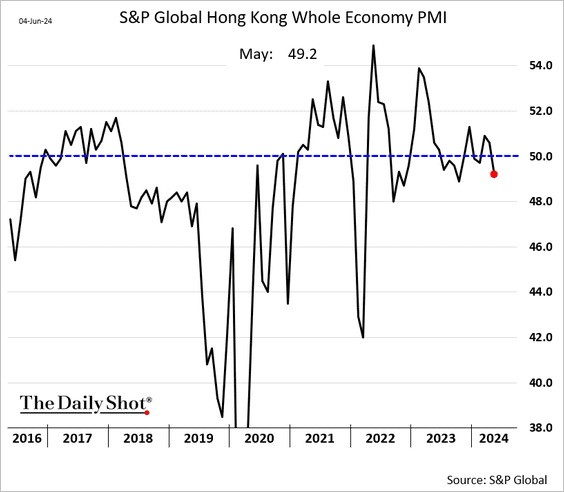
4. Hong Kong’s business activity is back in contraction territory.
Back to Index
Emerging Markets
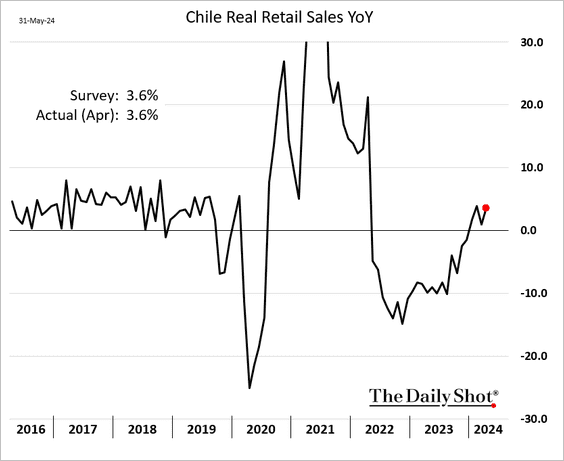
1. Let’s begin with Chile.
• Economic activity was firmer in April but below forecasts.

• Industrial production was below expectations.

• Copper production hit a multi-year low.

• Retail sales are rebounding.
• Vehicle sales were below last year’s levels in May.

——————–
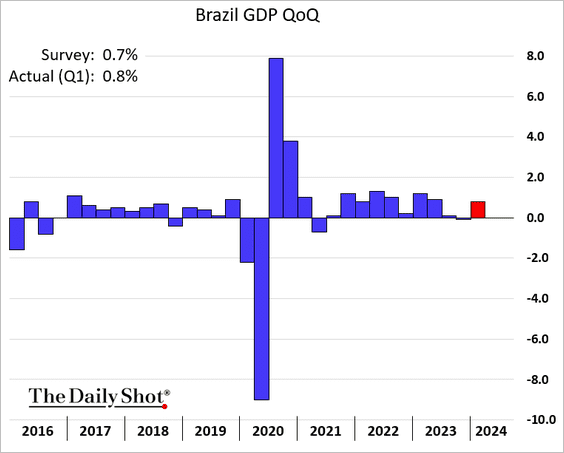
2. Next, we have some updates on Brazil.
• The economy returned to growth last quarter.
 Source: Reuters Read full article
• Vehicle sales slowed in May.

• The Brazilian real has been weakening vs. the US dollar.

——————–
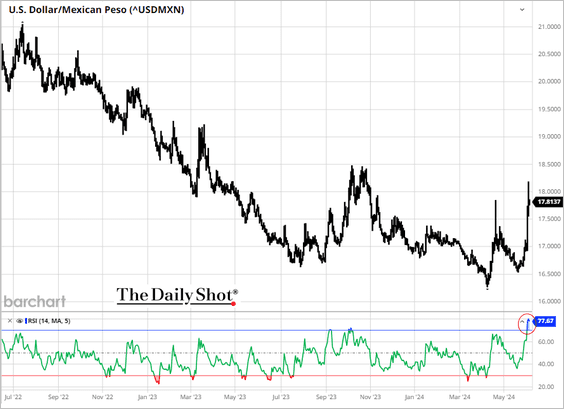
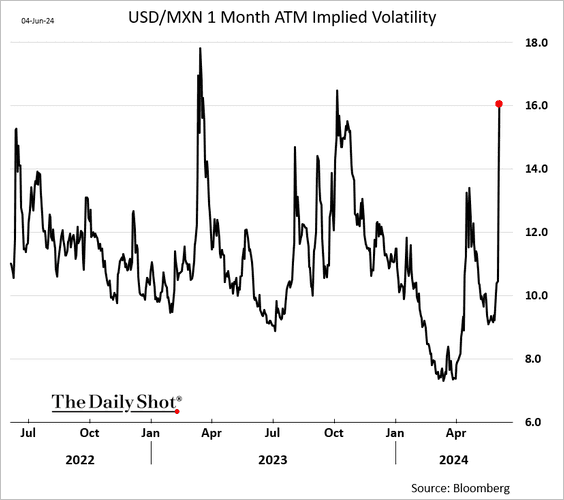
3. The Mexican peso appears to be oversold.
Implied volatility for the peso surged following the election results.
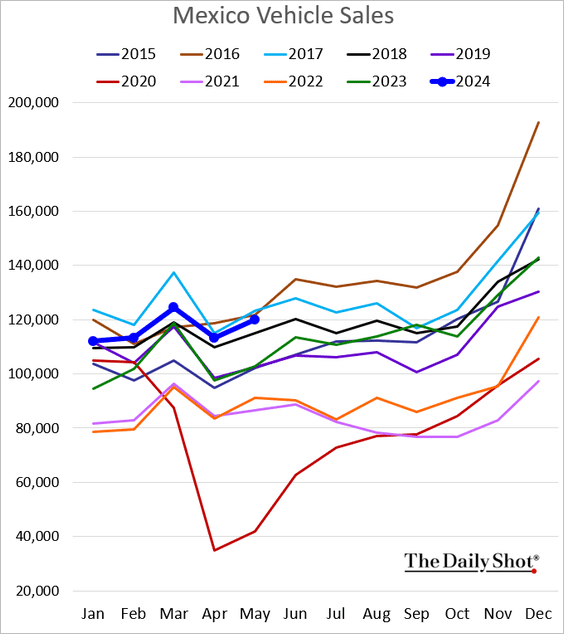
• Vehicle sales are running well above last year’s levels.
——————–
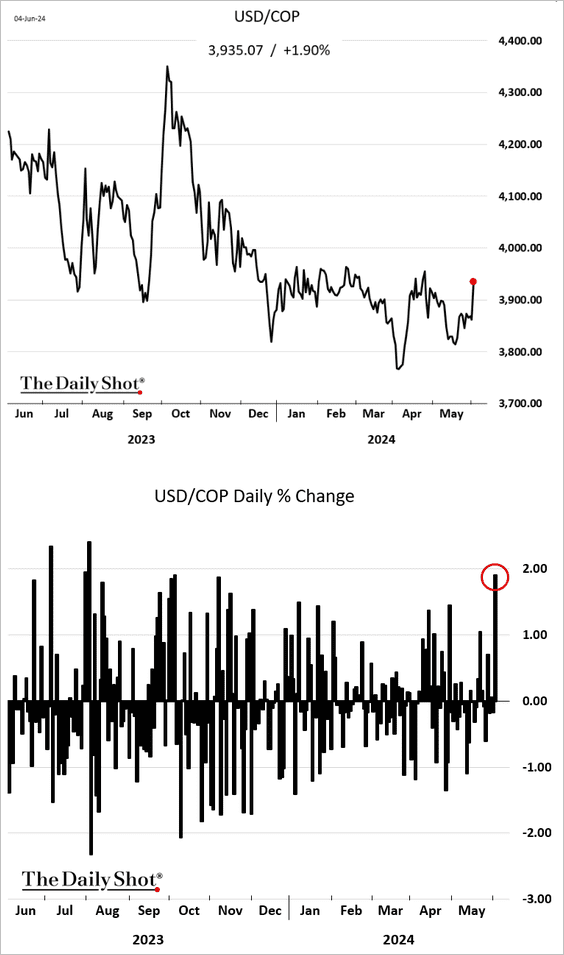
4. The Colombian peso took a hit on Tuesday amid soft crude oil prices.
5. Implied volatility in India’s stock market surged following the election results.

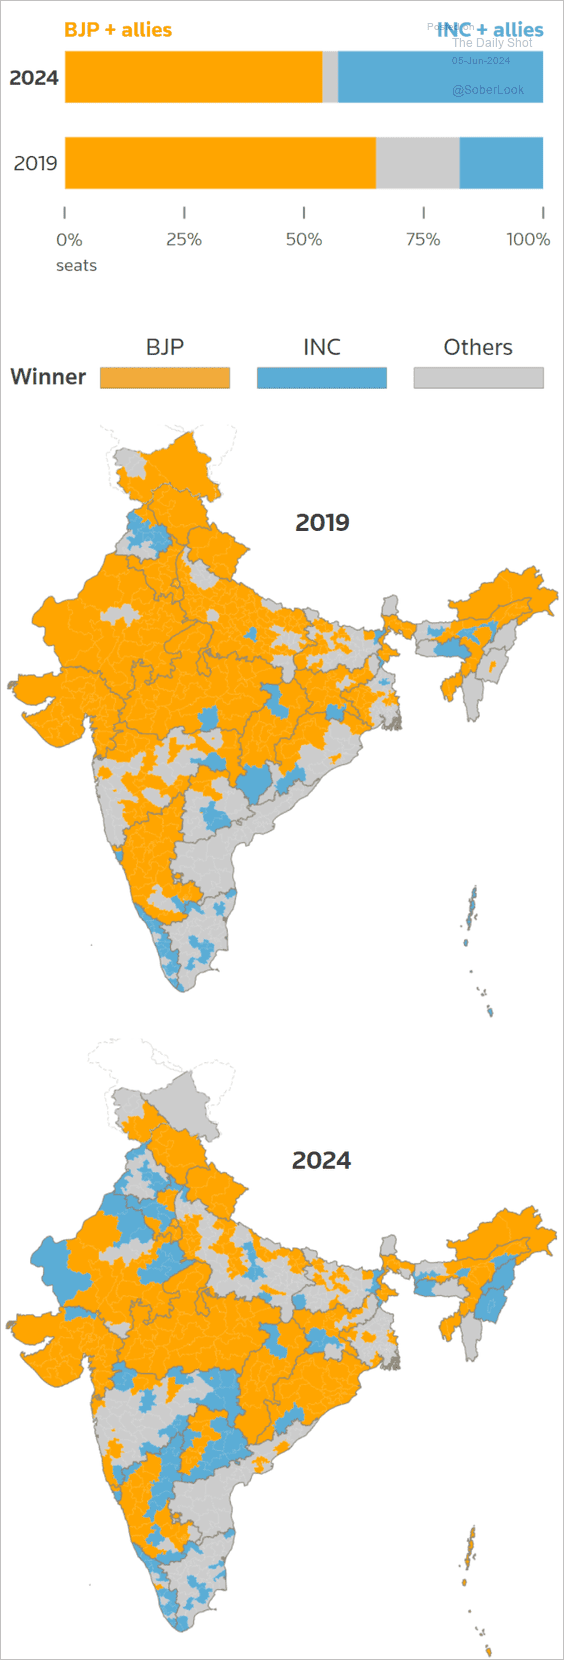 Source: Reuters Read full article
——————–
6. The relative returns of growth versus value stocks have diverged between EM and DM.
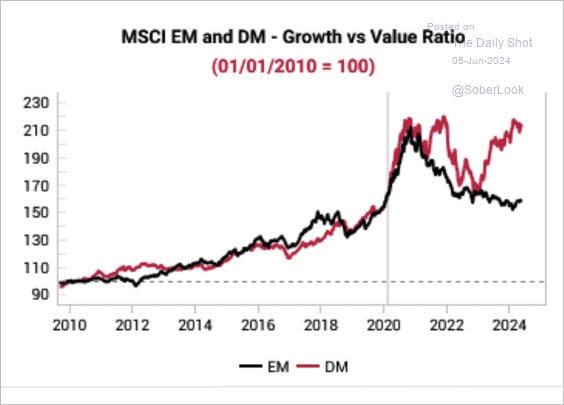 Source: Variant Perception
Back to Index
Commodities
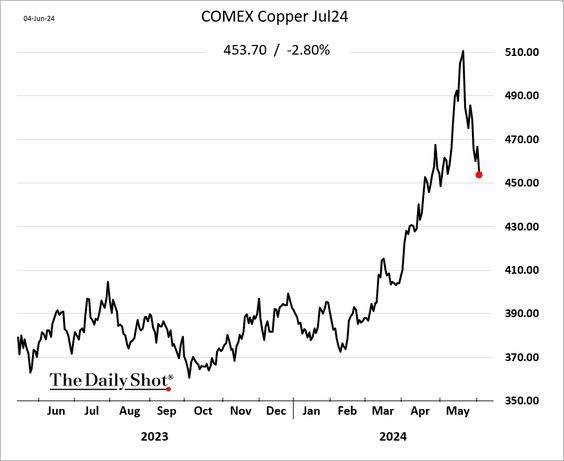
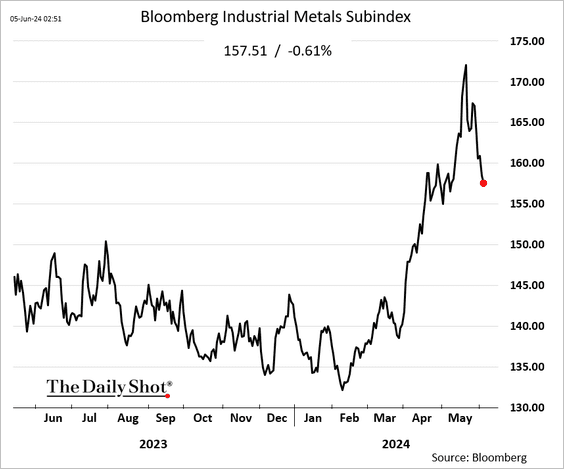
1. The rally in industrial commodities is fading.
• Copper:
• Iron ore:

• Bloomberg’s metals index:
——————–
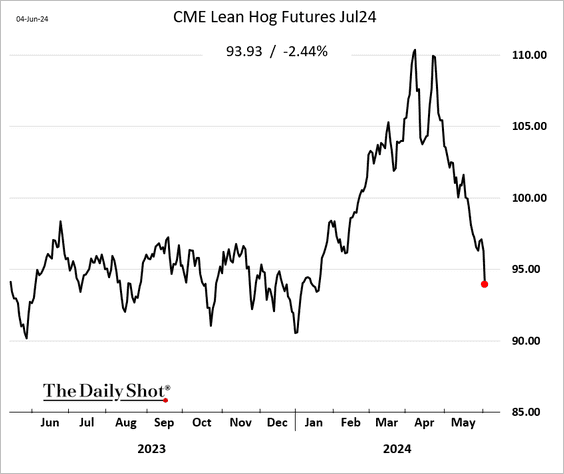
2. Chicago lean hog futures are under pressure amid concerns about sustained domestic demand.
3. Broad commodity prices have been improving and do not appear overbought.
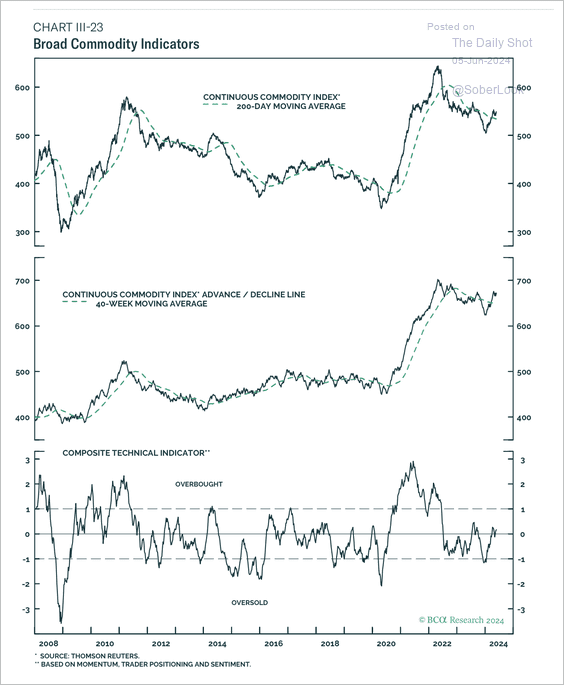 Source: BCA Research
Back to Index
Energy
1. Brent crude dropped below $78/bbl, …
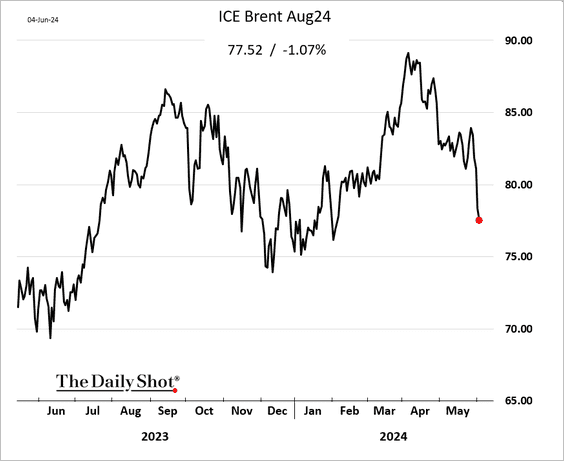
… with energy shares widening their underperformance.

——————–
2. Here is Bloomberg’s model illustrating the drivers of crude oil prices.
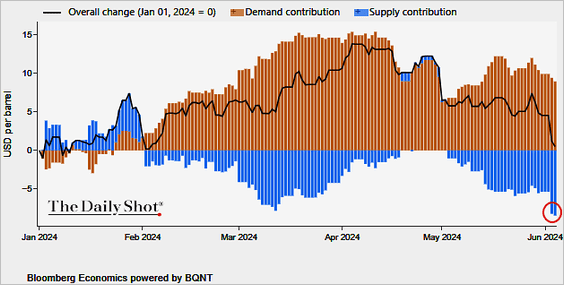 Source: @TheTerminal, Bloomberg Finance L.P.
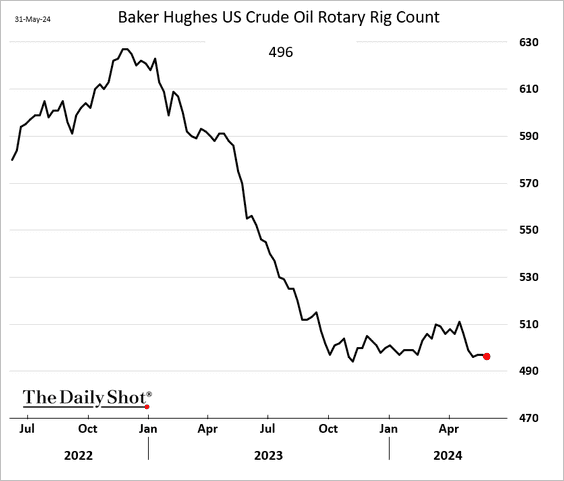
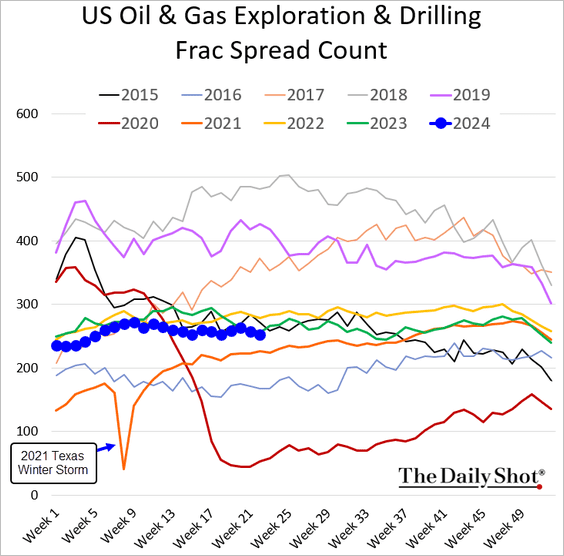
3. US drilling activity remains subdued.
• Rig count:
• Frac spread count:
Back to Index
Equities
1. Tech funds are seeing outflows (2 charts).
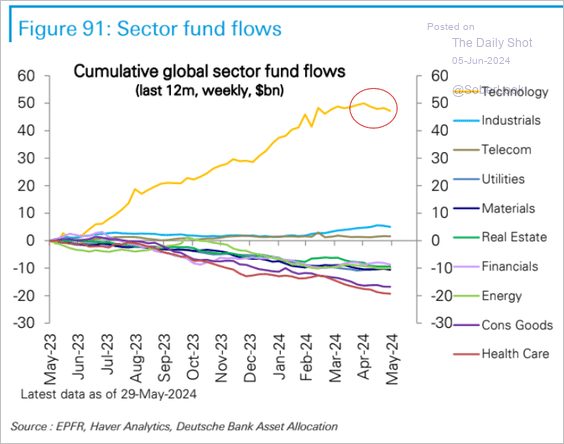 Source: Deutsche Bank Research
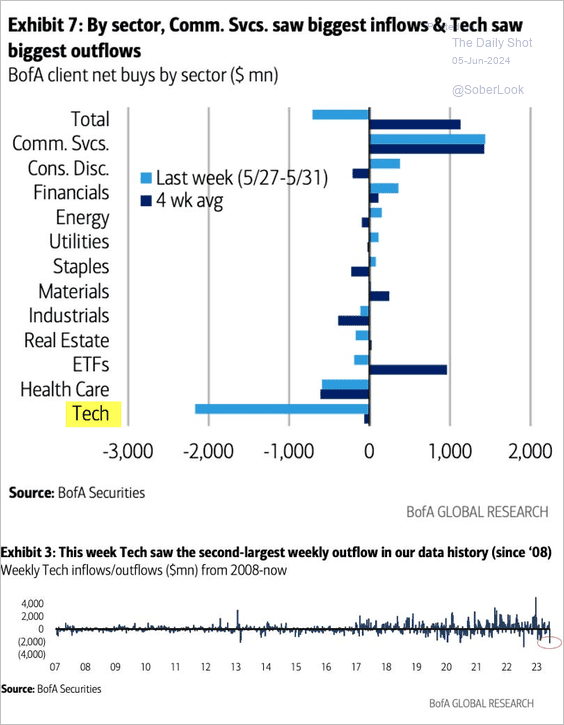 Source: BofA Global Research; @dailychartbook
——————–
2. The market continues to reward companies that pursue onshoring strategies.
 Source: Goldman Sachs
3. How correlated are S&P 500 sectors to the index?
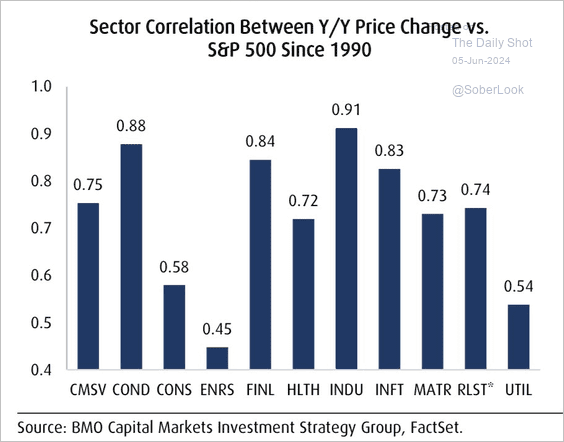 Source: BMO Capital Markets; @carlquintanilla
4. Here’s what the options market tells us about the likelihood of a 10% gain or drop in the S&P 500 by late September and by the end of the year.

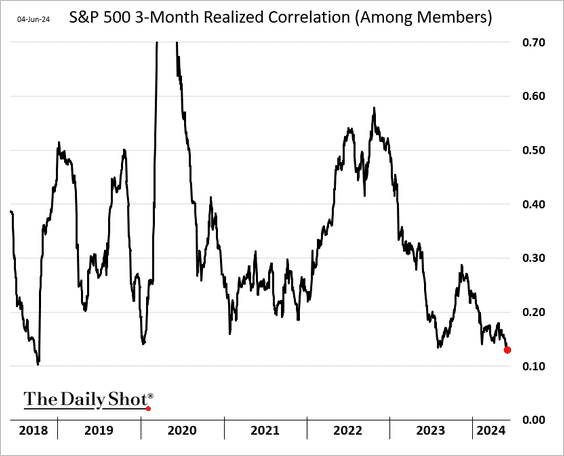
5. Correlations among S&P 500 stocks have reached multi-year lows. A stock picker’s paradise?
6. Penny stock trading surged over the past couple of years.
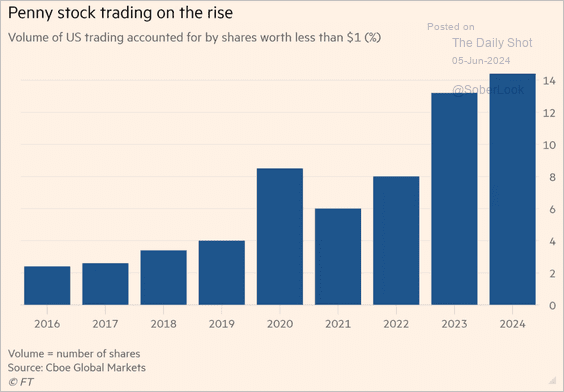 Source: @financialtimes Read full article
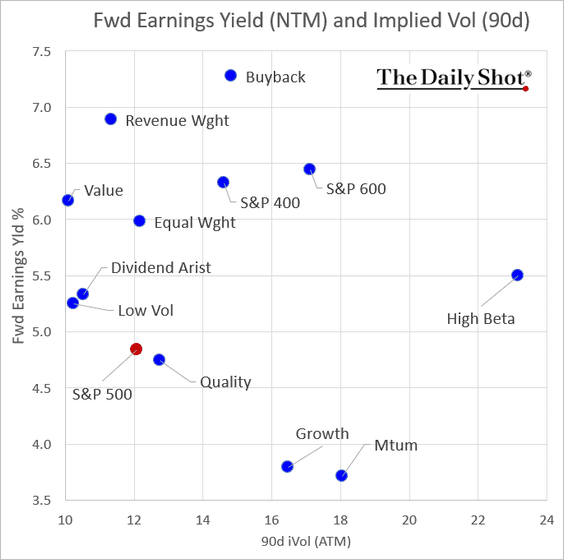
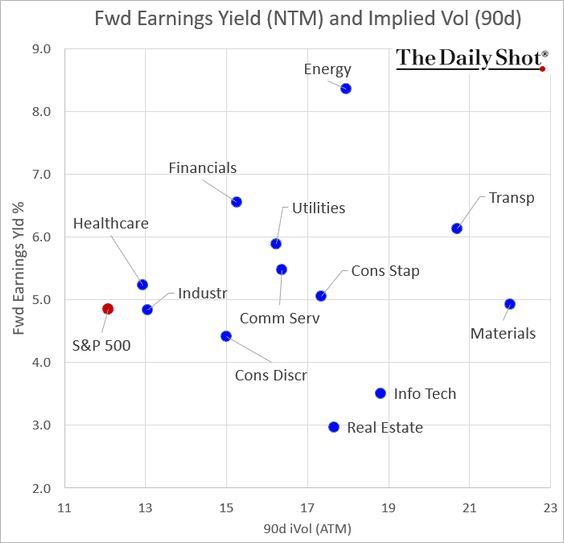
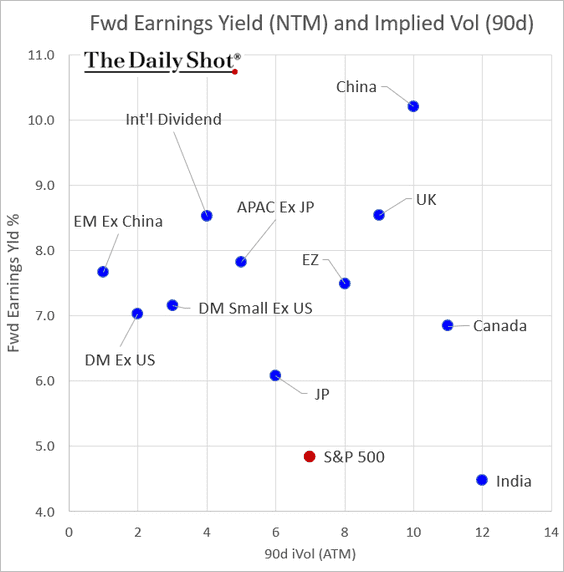
7. Next, let’s take a look at forward earnings yields vs. implied volatility (expected performance vs. perceived risk).
• Factors/styles:
• S&P 500 sectors:
• International markets:
Back to Index
Credit
1. US private sector credit growth has been slowing.
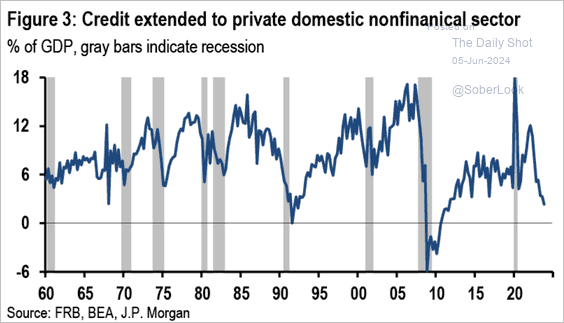 Source: JP Morgan Research; @economics Read full article
2. Small banks have reduced their bond holdings …
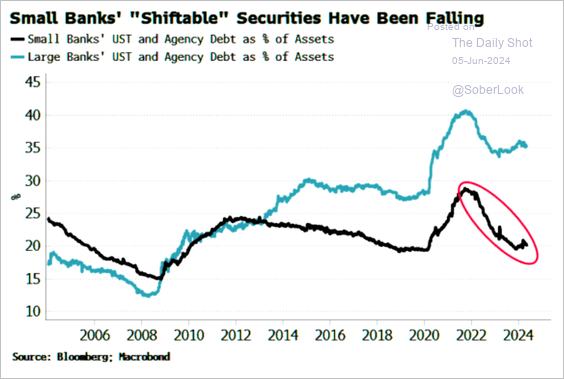 Source: Simon White, Bloomberg Markets Live Blog
… and are rebuilding their deposit base.
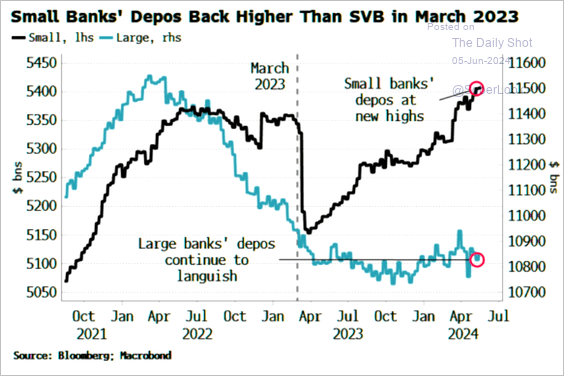 Source: Simon White, Bloomberg Markets Live Blog
Back to Index
Global Developments
1. The ECB and the BoC are set to cut rates this month. The Fed and the BoE will take longer to get there.
 Source: @JeffreyKleintop
2. Tanker prices have been surging.

3. The disinflation trend is continuing outside of the US.
 Source: BofA Global Research
4. Here is a look at output loss after GFC and COVID.
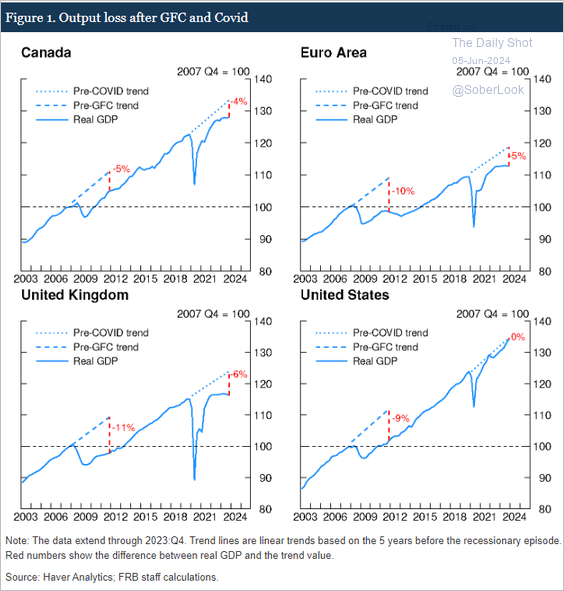 Source: Federal Reserve Board
——————–
Food for Thought
1. 401-k millionaires at Fidelity:
 Source: @wealth Read full article
2. Lowest 10 states by real GDP growth in 2023:
 Source: Visual Capitalist Read full article
3. Electricity from renewable sources (global):
 Source: Our World in Data Read full article
4. Media coverage of gasoline prices by price per gallon:
 Source: @financialtimes Read full article
5. Companies mentioning AI on earnings calls:
 Source: Goldman Sachs
6. Return-to-office rates:
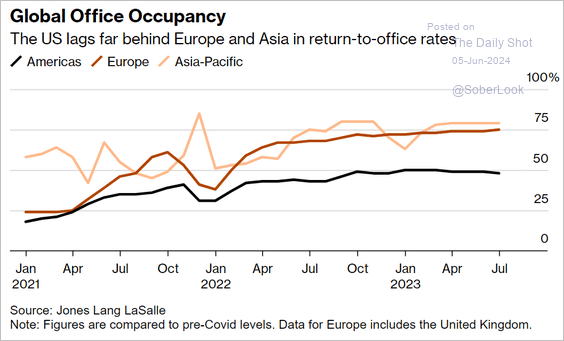 Source: @thefuture Read full article
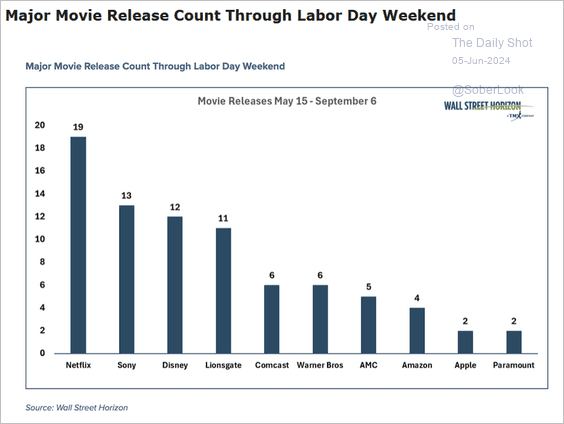
7. Major movie release count this summer:
 Source: See It Market Read full article
——————–
Back to Index