
The Daily Shot: 06-Jun-24
• The United States
• Canada
• The Eurozone
• Japan
• China
• Emerging Markets
• Commodities
• Energy
• Equities
• Credit
• Global Developments
• Food for Thought
Apologies for the delay this morning; we had some technical issues.
The United States
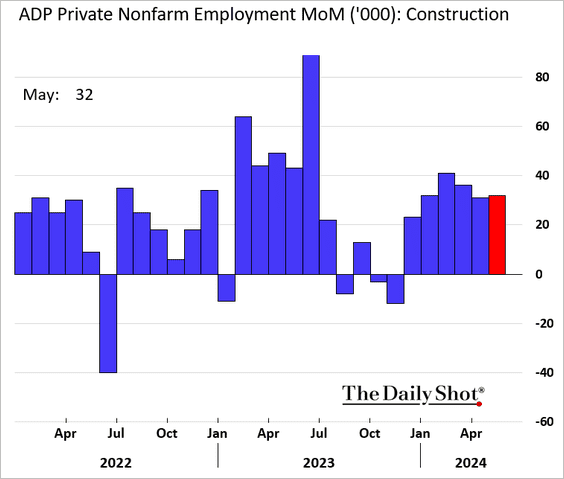
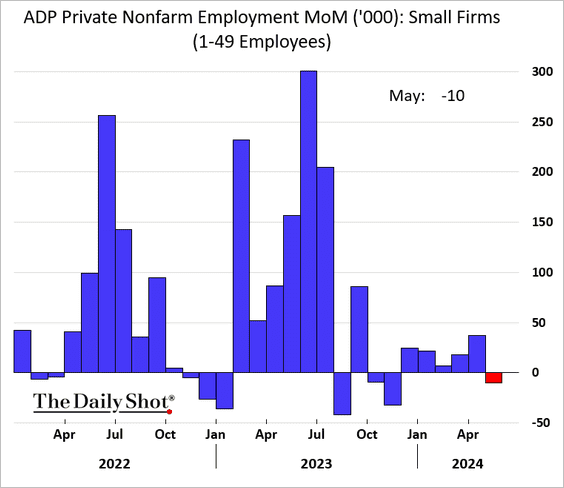
1. The May ADP private payrolls report was softer than expected.
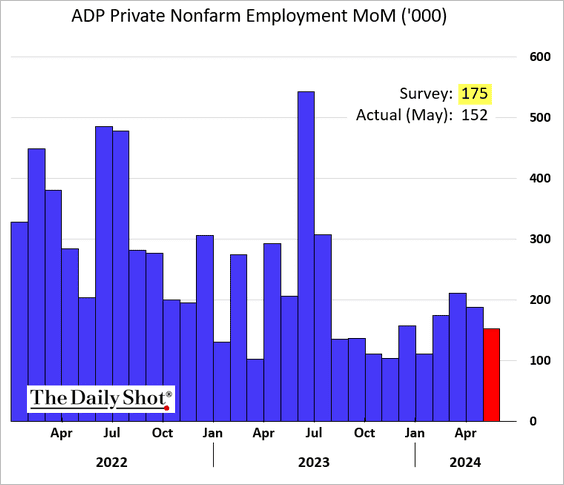
 Source: @economics Read full article
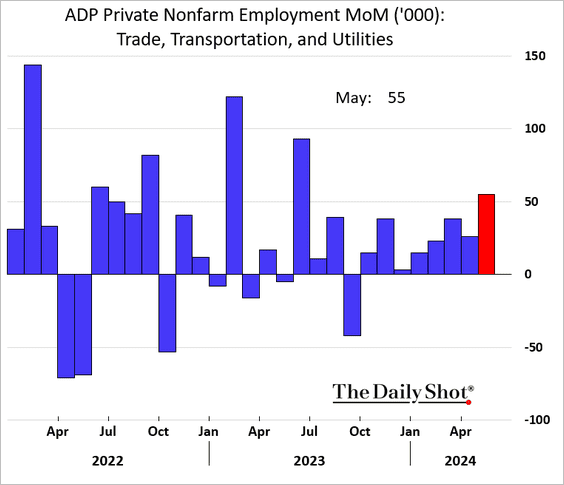
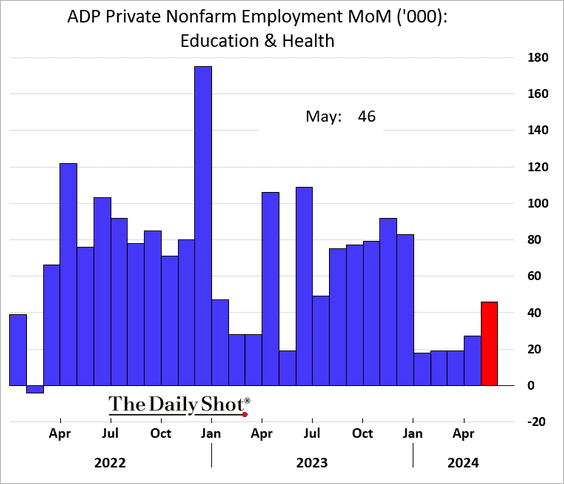
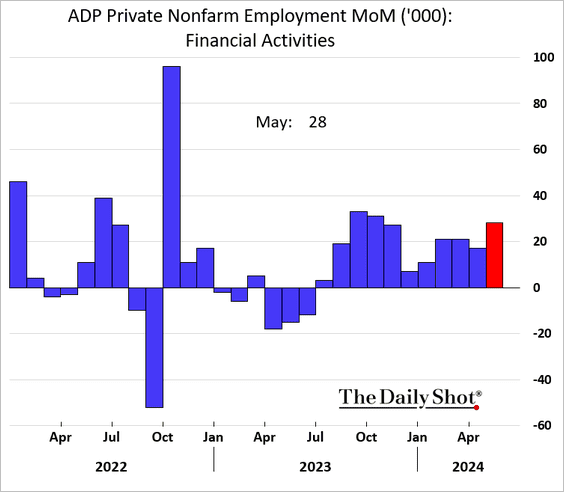
• The following sectors continued to see robust job gains.
– Retail and logistics:
– Healthcare:
– Financial services:
– Construction:
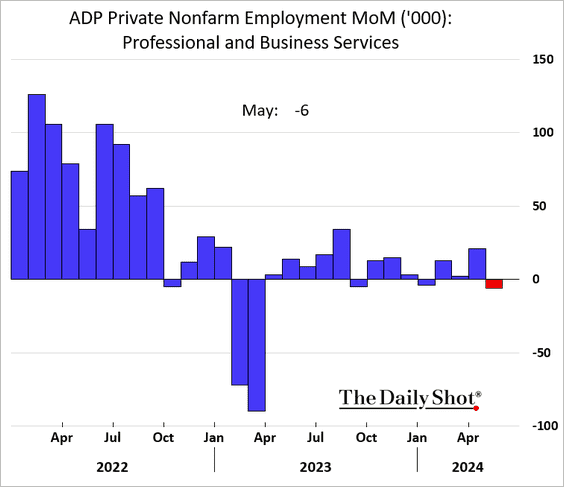
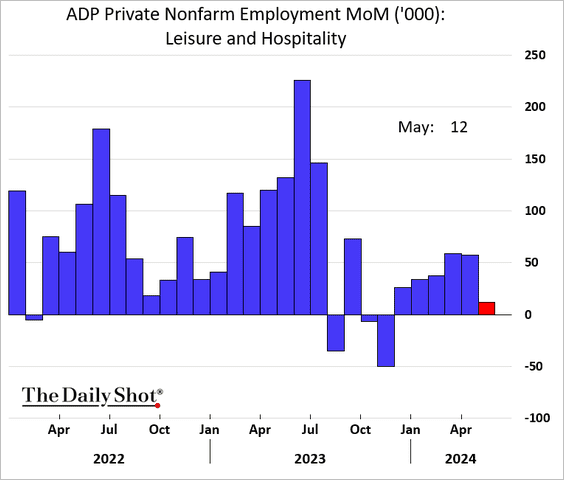
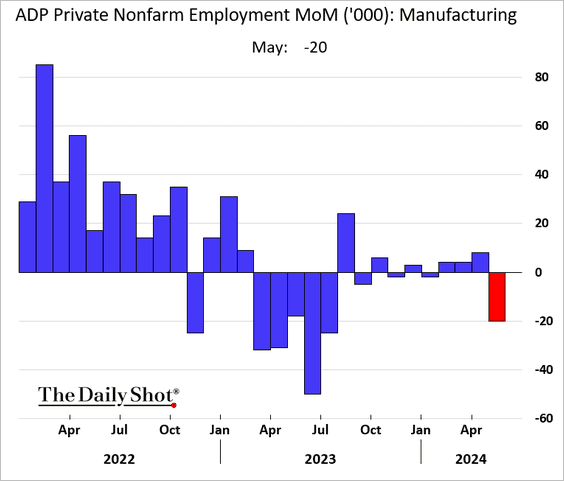
• But there was notable weakness in several other areas.
– Business services:
– Hotels and restaurants (much slower gains):
– Manufacturing:
• Small businesses saw staff reductions in May.
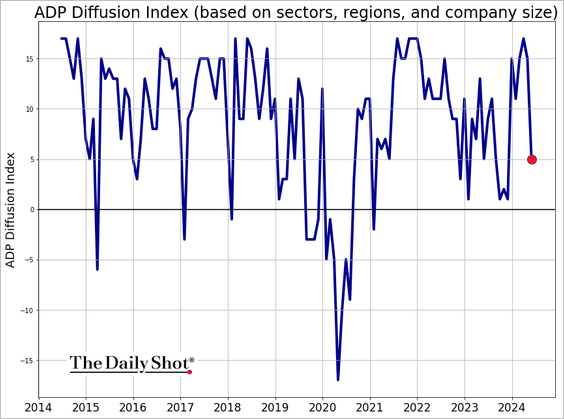
• Here is the ADP diffusion index.
2. Wage growth among job leavers has moderated, while it remained steady among those who stayed at their jobs.
 Source: @TheTerminal, Bloomberg Finance L.P.
——————–
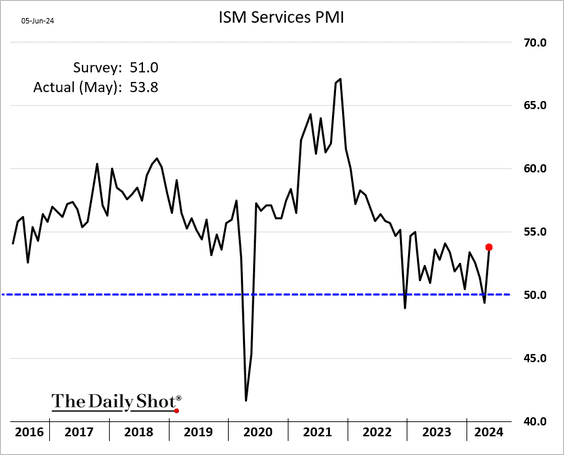
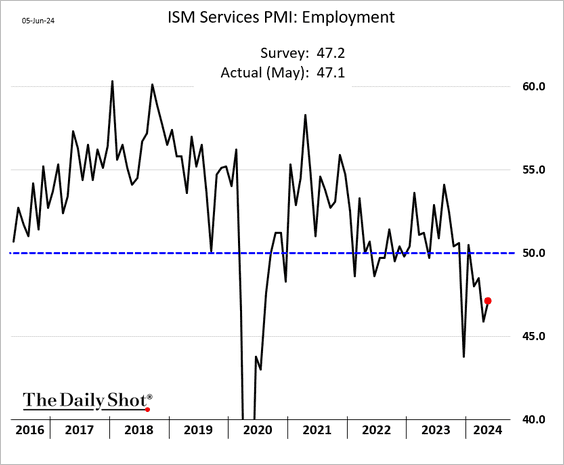
3. The ISM services PMI jumped last month, signaling stronger business activity.
 Source: Reuters Read full article
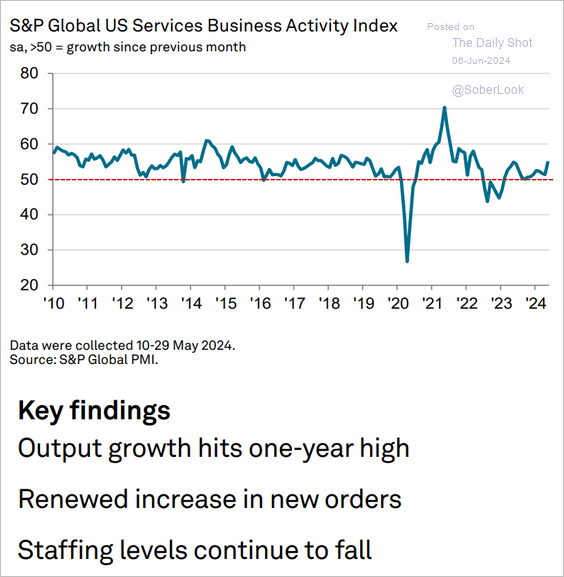
• This acceleration is consistent with the PMI indicators published by S&P Global (2 charts).
 Source: S&P Global PMI
 Source: Arcano Economics
• The ISM employment indicator remains soft.
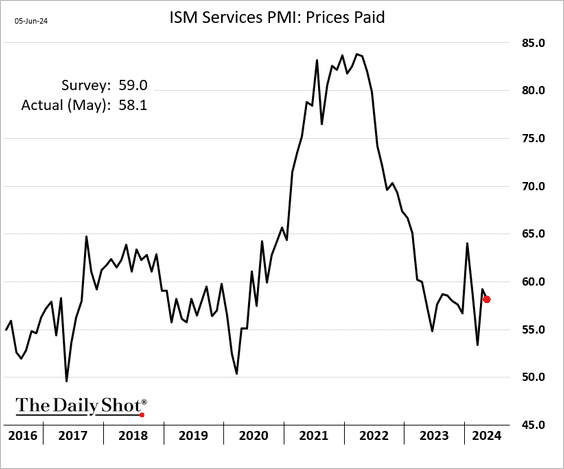
• Price gains eased slightly in May.
——————–
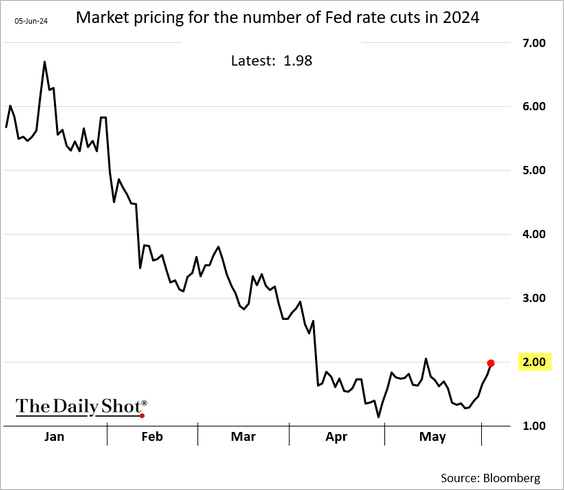
4. The market is settling on two Fed rate cuts this year.
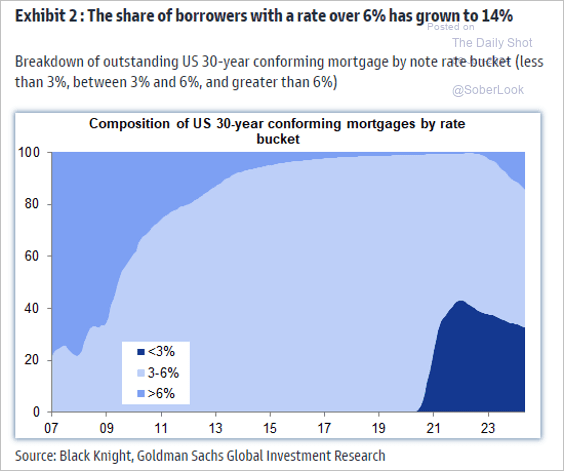
5. Mortgage applications remain at multi-year lows.

• The proportion of mortgages carrying interest rates above 6% has been increasing.
 Source: Goldman Sachs; @MikeZaccardi
——————–
6. Some argue that household excess savings have been depleted, …
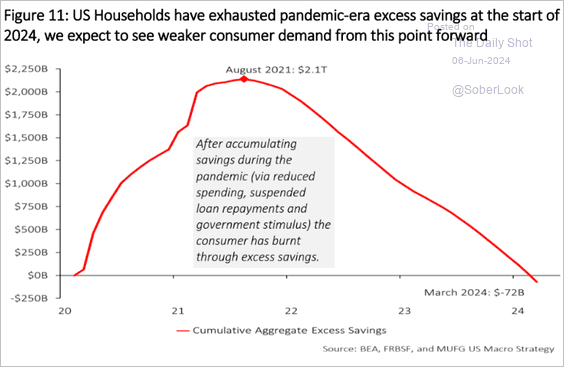 Source: MUFG Securities
… while others believe there remains significant spending capacity.
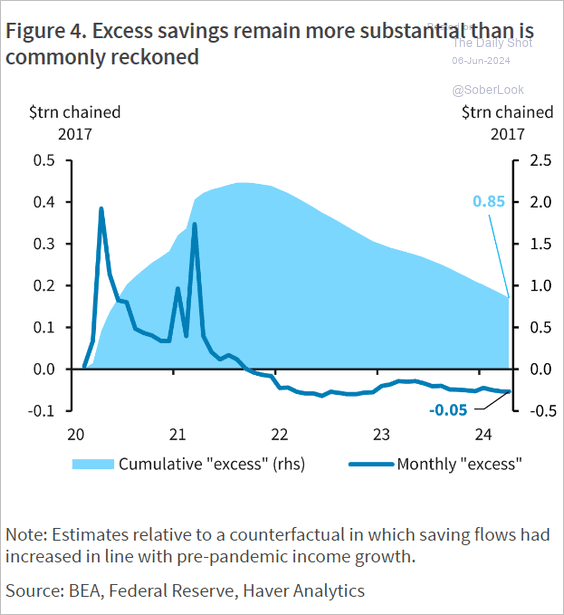 Source: Barclays Research
The outcome depends on the assumptions about the pre-COVID trend.
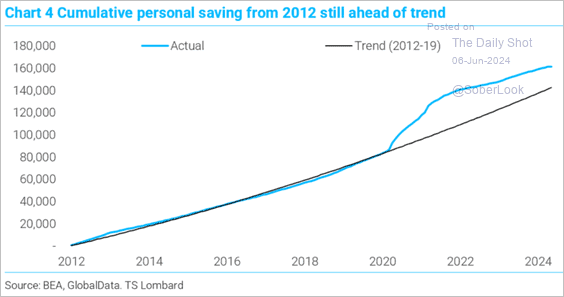 Source: TS Lombard
Back to Index
Canada
1. The Bank of Canada has initiated a cycle of monetary easing.
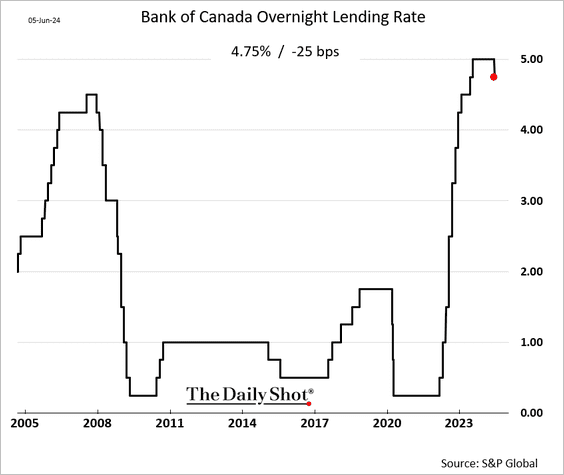
 Source: Reuters Read full article
Another rate cut in July looks increasingly likely.

——————–
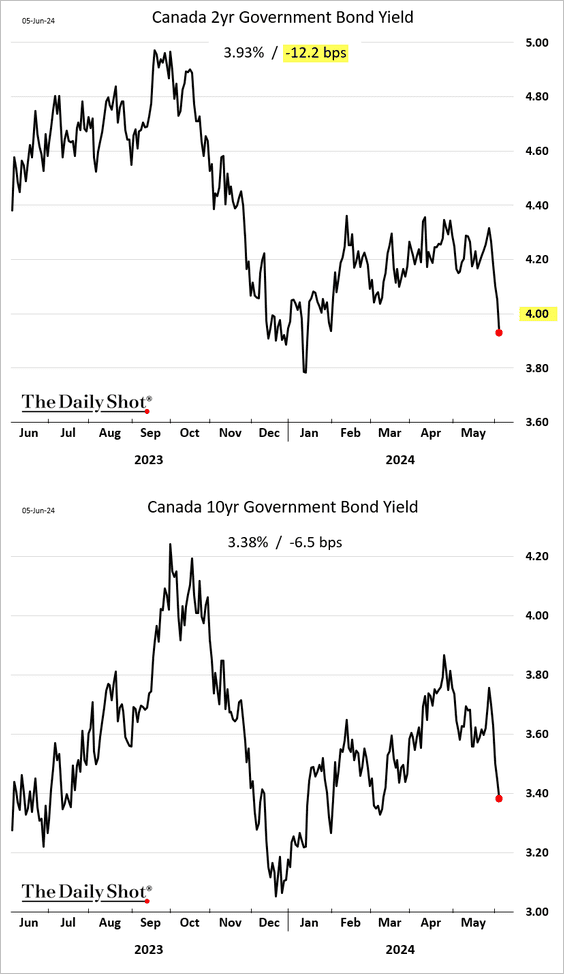
2. The loonie dropped after the rate cut announcement but rebounded shortly after.
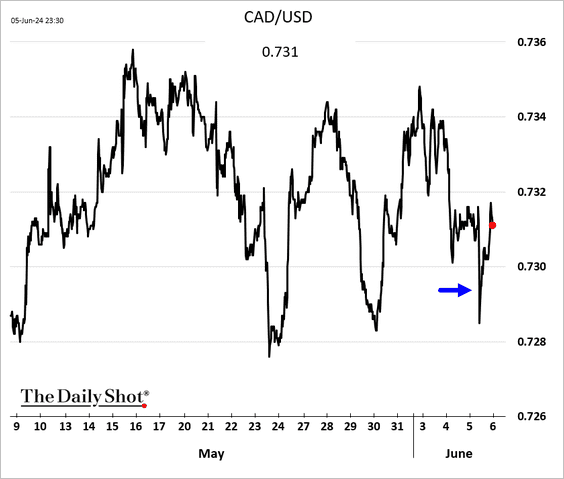
Bond yields are sharply lower, with the 2-year rate dipping below 4%.
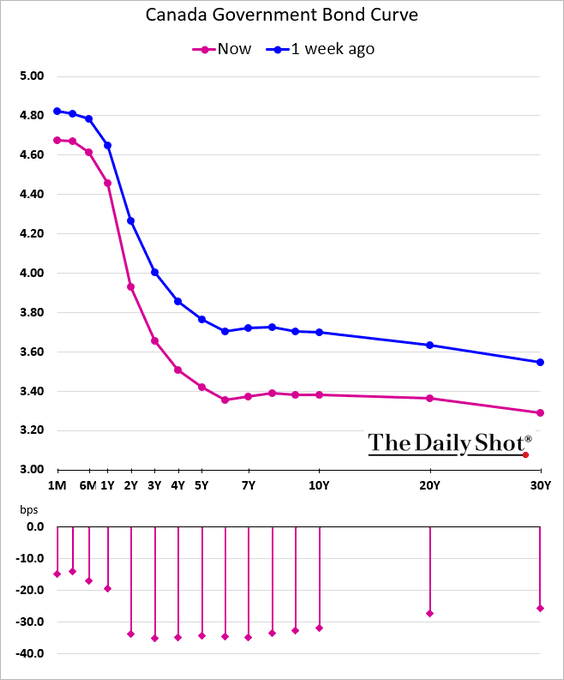
Here is the yield curve.
——————–
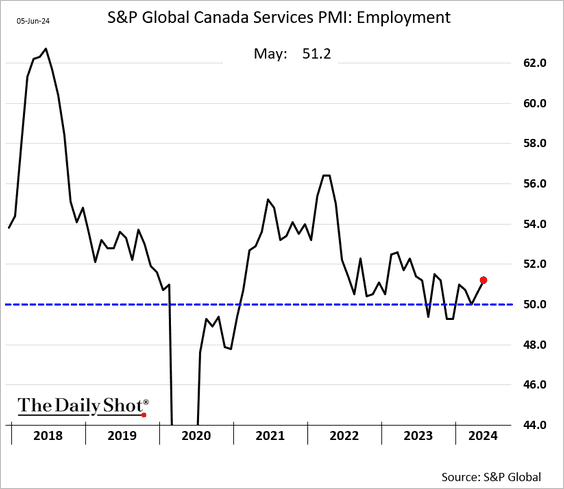
3. Canada’s services PMI is back in growth territory.

Service firms increased their hiring last month.
——————–
4. Labor productivity declined more than expected in the first quarter.

Back to Index
The Eurozone
1. Services PMIs indicated robust growth in Germany, Italy, and Spain last month, …


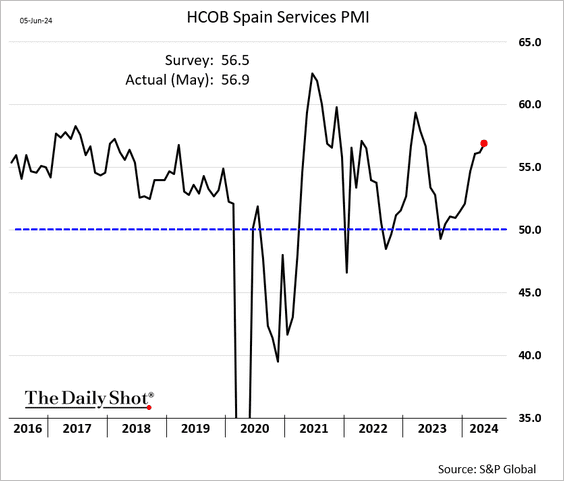
… with France being the exception.

——————–
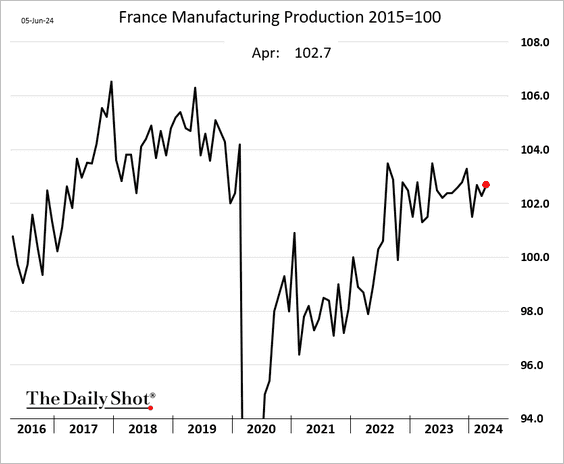
2. French manufacturing output increased in April.
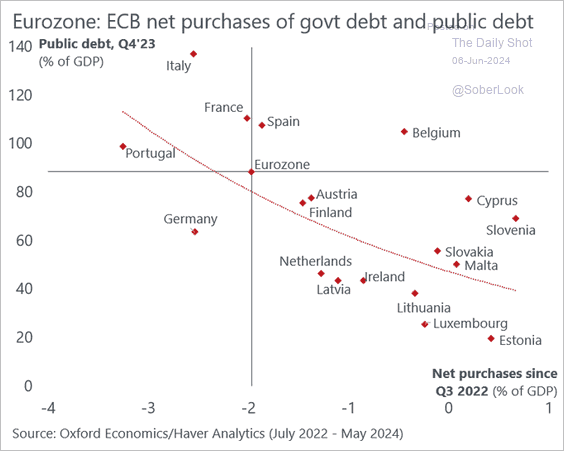
3. The ECB’s debt roll-off is generally proportional to the public debt levels of Eurozone member states.
 Source: @DanielKral1
 Source: @DanielKral1
——————–
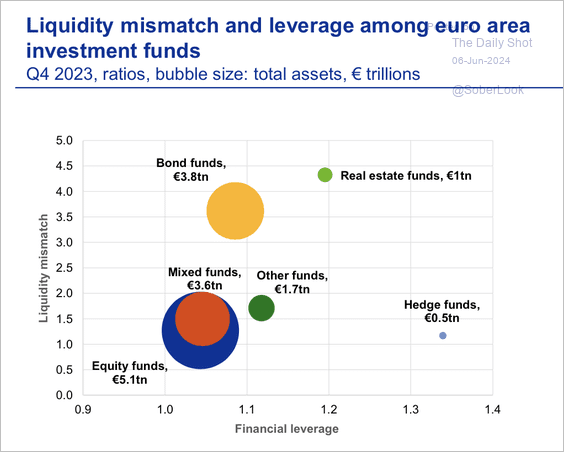
4. Real estate funds with unrealized losses face liquidity mismatches. According to the ECB, rising redemptions could lead to forced sales and wider financial stress.
 Source: ECB
Back to Index
Japan
1. Import prices point to further easing in Japan’s core goods CPI.
 Source: Capital Economics
2. Nominal base pay gains have accelerated.
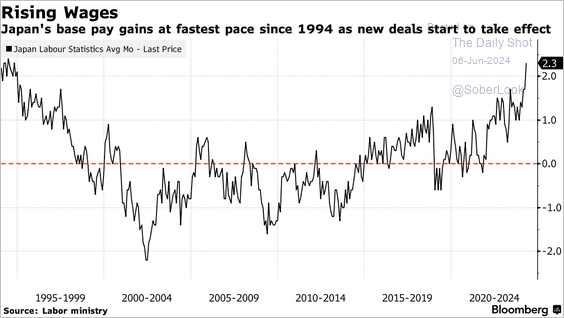 Source: @economics Read full article
Back to Index
China
1. Sales revenue has improved in manufacturing and real estate (especially construction), while other sectors remain weak. (2 charts)
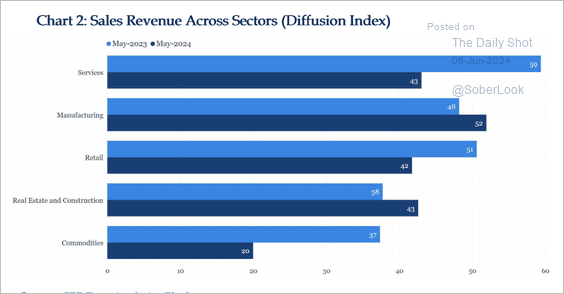 Source: China Beige Book
 Source: China Beige Book
——————–
2. The A-shares/H-shares premium is testing support. A reversal is possible if authorities become more inclined to support the onshore stock market.
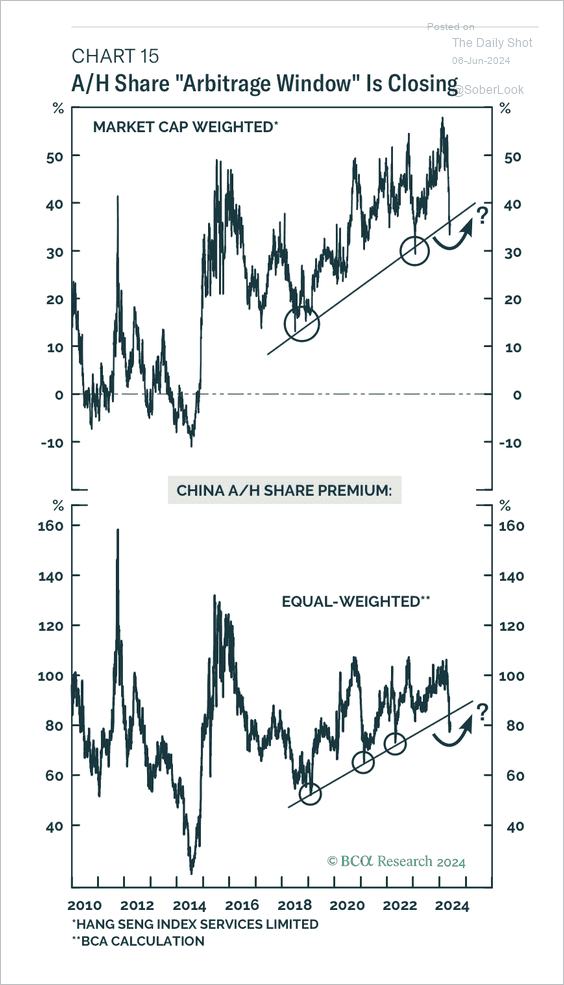 Source: BCA Research
3. So far, China’s steep decline in housing starts has been similar to Spain’s property crisis.
 Source: Reuters Read full article
Back to Index
Emerging Markets
1. Brazil’s industrial production declined in April.

• The services PMI shows accelerating growth in May.

——————–
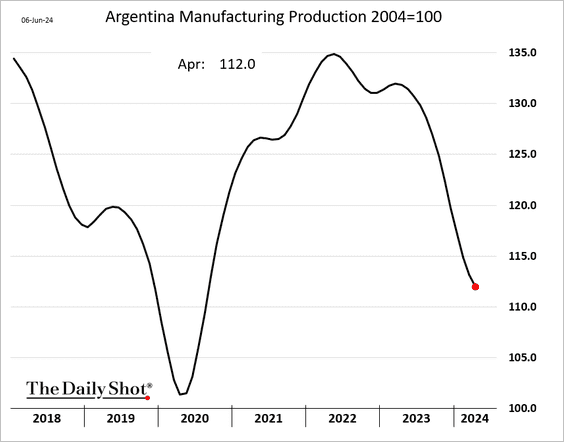
2. Argentina’s economic downturn has been severe.
• Manufacturing production:
• Construction activity:

——————–
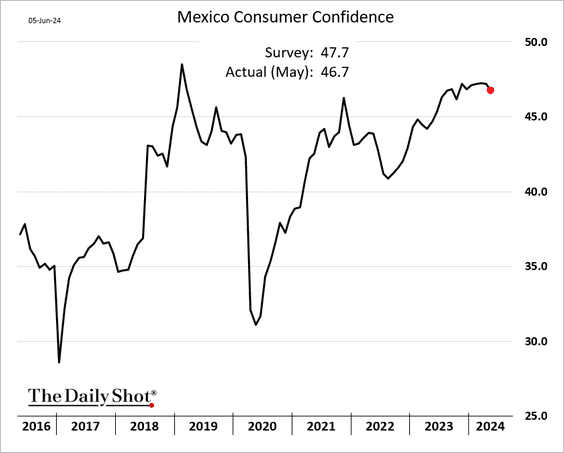
3. Mexico’s formal job creation turned negative last month.

• Consumer confidence eased ahead of the elections.
——————–
4. Next, we have some updates on South Africa.
• The economy unexpectedly contracted in Q1.
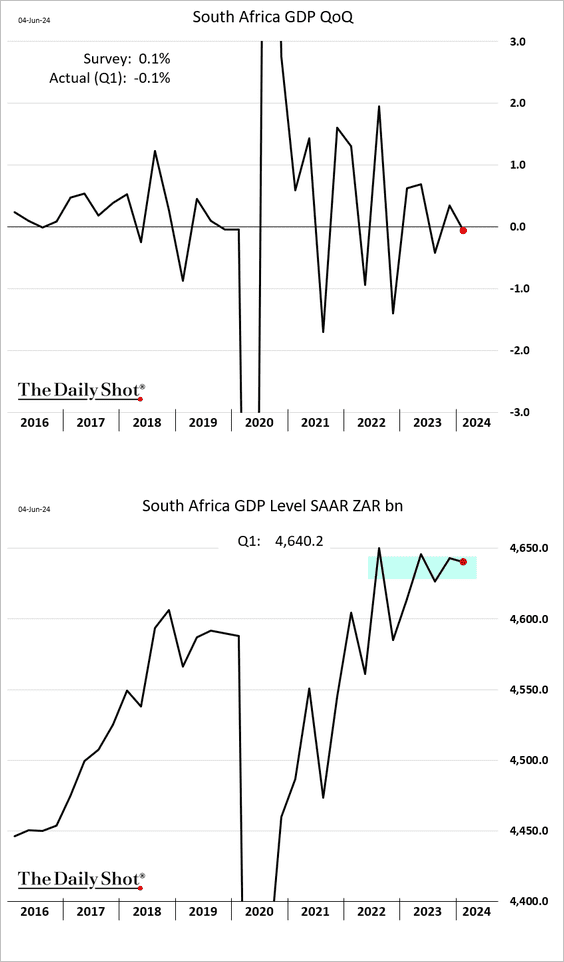
• Business confidence improved this quarter.

• Vehicle sales are down 14% from last year.

——————–
5. Indonesia’s CPI is rising again.

Back to Index
Commodities
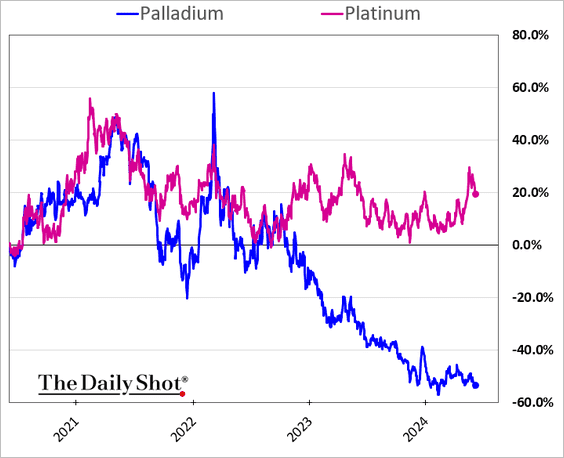
1. Platinum has been outperforming palladium over the past couple of years.
2. Copper inventories have risen alongside the recent rally.
 Source: BCA Research
Back to Index
Energy
1. US crude oil inventories unexpectedly increased last week. Refined product stockpiles were higher as well.

 Source: Reuters Read full article
Here are the inventory levels.

• Refineries have been busy.

But gasoline demand has been lackluster.

This chart compares gasoline demand with refinery runs.
 Source: @TheTerminal, Bloomberg Finance L.P.
——————–
2. Brent oil is trading $10/bbl below fair value, according to Numera Analytics.
 Source: Numera Analytics (@NumeraAnalytics)
3. Here is a look at US oil & gas M&A activity.
 Source: @financialtimes Read full article
Back to Index
Equities
1. Key us indices hit record highs.
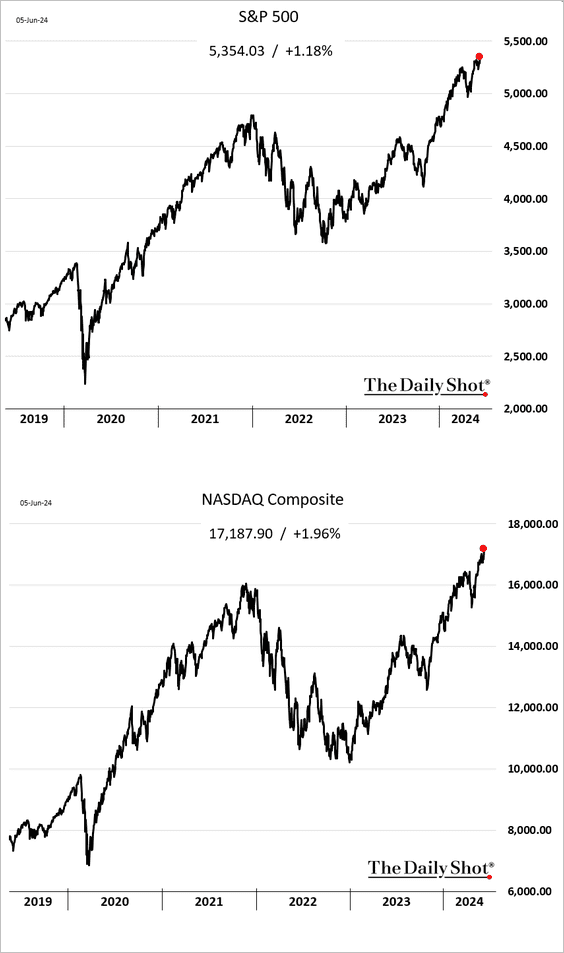
• The Magnificent 7 market capitalization climbed above $15 trillion, …
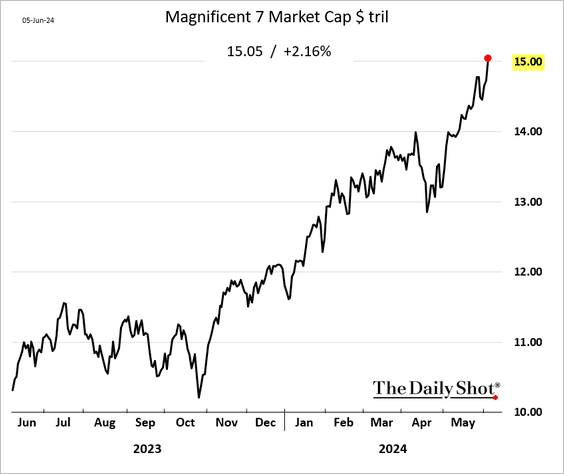
… boosted by Nvidia.
 Source: @markets Read full article
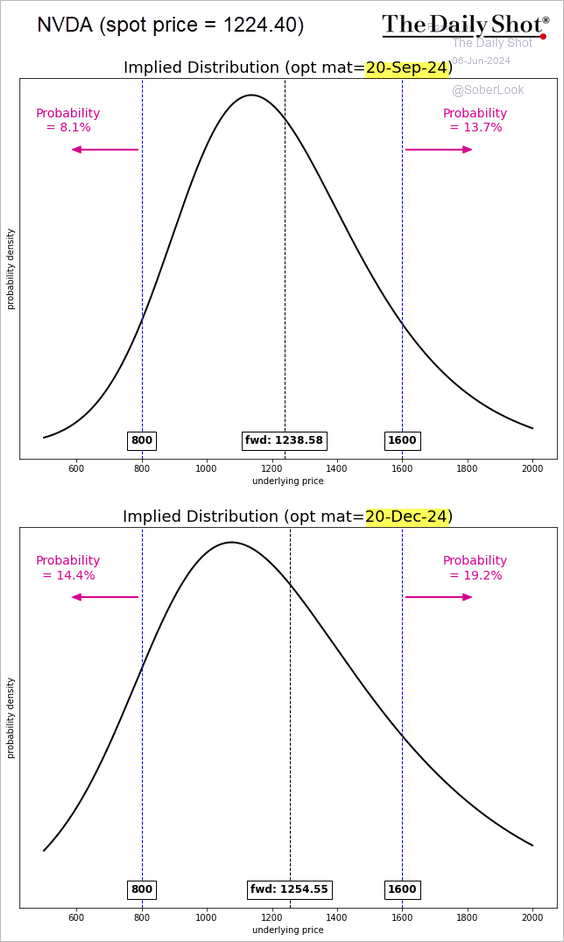
Will Nvidia’s rally continue? The options market sees a 14% probability of the share price exceeding $1600 by late September and 19% by the end of the year (current price is $1224).
 Source: @MadsEberhardt
——————–
2. The S&P 500 equal-weight index continues to widen its underperformance.

• Mid-cap and small-cap shares continue to lag.
 Source: @TheTerminal, Bloomberg Finance L.P.
——————–
3. The equal-weight index discount to the S&P 500 keeps widening.
 Source: @TheTerminal, Bloomberg Finance L.P.
• Larger firms consistently trade at a premium to smaller ones.
 Source: @WSJ Read full article
• Here is a look at valuations relative to the last couple of decades.
 Source: @TheTerminal, Bloomberg Finance L.P.
——————–
3. Below are some equity factor trends.
• Growth vs. value:

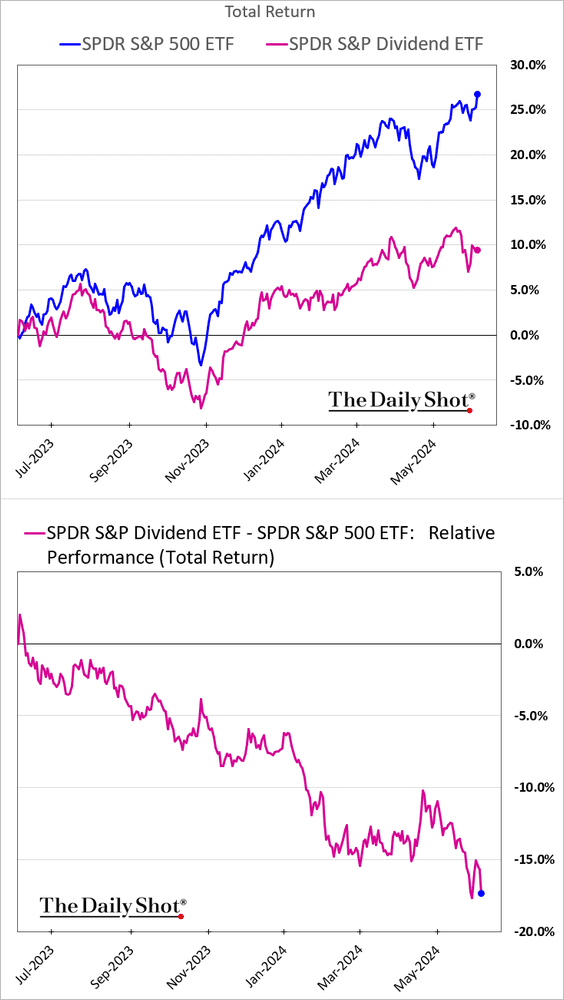
• High-dividend shares:
• Quality:

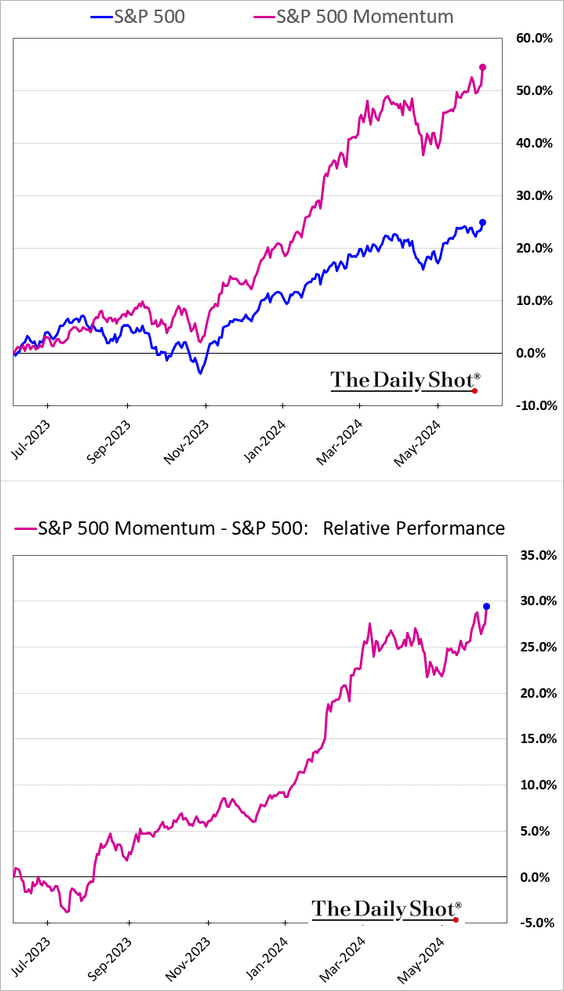
• Momentum:
——————–
4. The overall retail sentiment (based on buying activity) remains subdued.
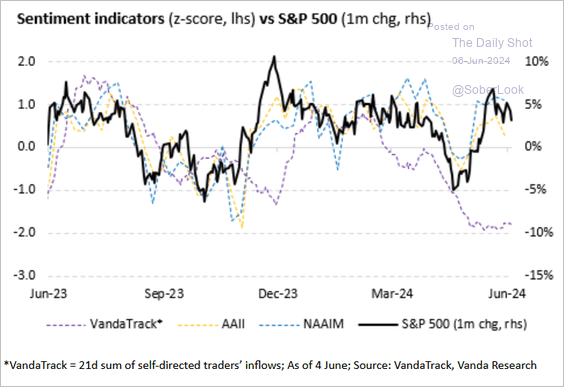 Source: Vanda Research
But retail investors love leveraged single-stock ETFs.
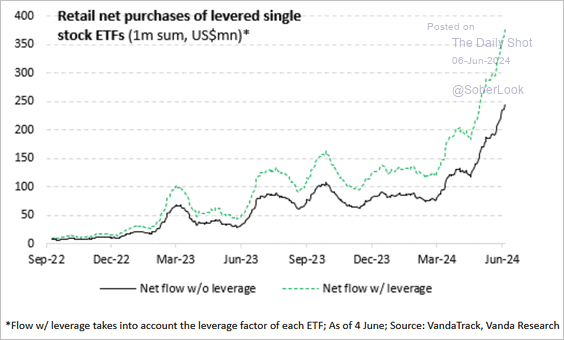 Source: Vanda Research
——————–
5. Market concentration measures continue to rise.
 Source: @TheTerminal, Bloomberg Finance L.P.
• The technology sector’s contribution to the S&P 500’s one-month returns dispersion is near an all-time high and surpasses its peak during the tech bubble. This elevated contribution is primarily driven by increasing market cap concentration within the tech sector, as shown by the higher dispersion in the market cap-weighted index compared to the more moderate rise in the equally weighted index.
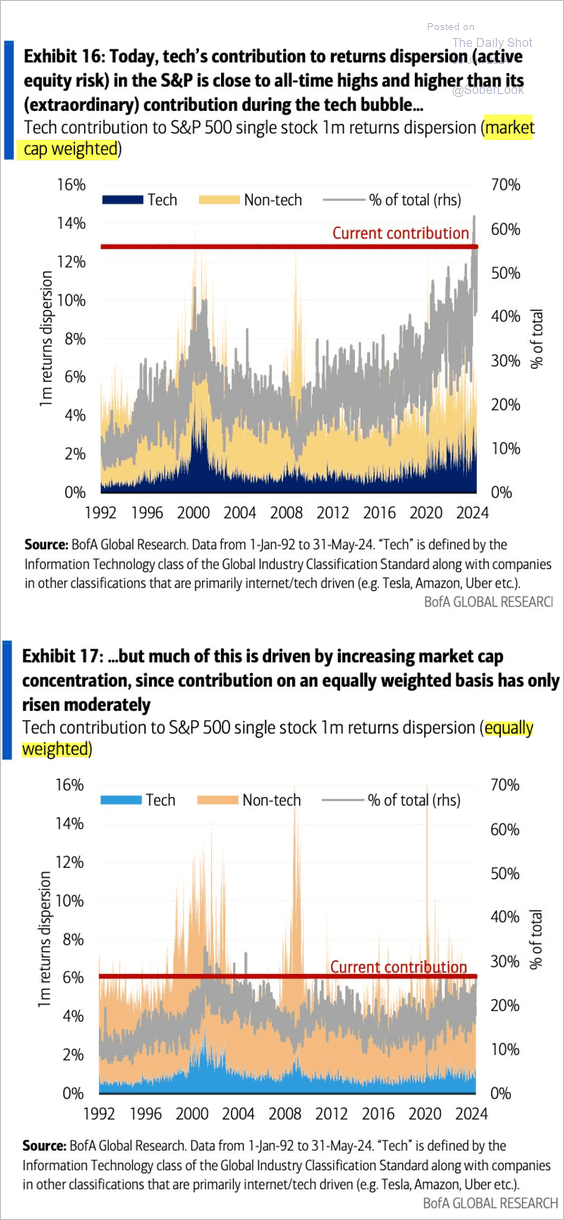 Source: BofA Global Research; @dailychartbook
——————–
6. Global ETF assets have ballooned in recent years with strong growth in active products
 Source: The ETF Shelf
Back to Index
Credit
1. US CLO issuance has been strong this year.
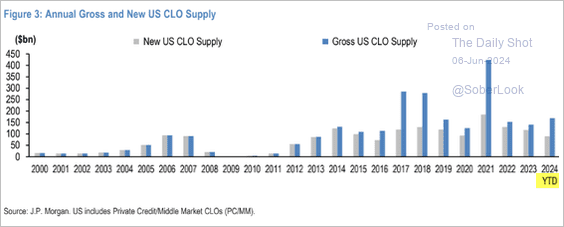 Source: JP Morgan Research; @GunjanJS
• Retail investors now have access to the CLO asset class, and they can’t get enough.
 Source: BofA Global Research; III Capital Management
——————–
2. Munis are trading rich relative to the past decade.
 Source: @TheTerminal, Bloomberg Finance L.P.
Back to Index
Global Developments
1. Central banks stepped up rate cuts in May.
 Source: Truist Advisory Services
2. May was a strong month for precious metals, while equities held up. Sovereign bonds dipped as yields rose and energy narrowed losses.
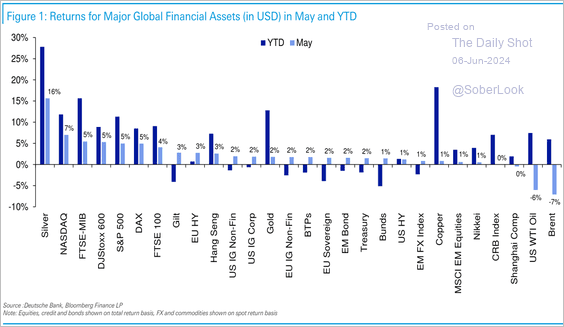 Source: Deutsche Bank Research
3. There has been a rise in global trade restrictions in recent years (2 charts).
 Source: Merrill Lynch
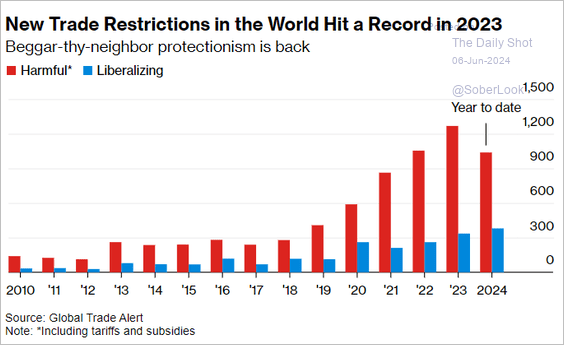 Source: @bpolitics Read full article
——————–
4. Global factory activity strengthened further in May.
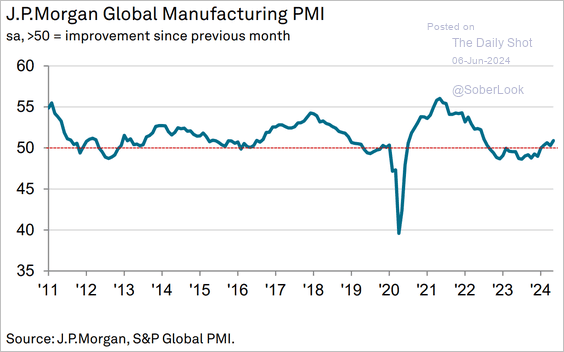 Source: S&P Global PMI
Here are the PMIs by country/region.
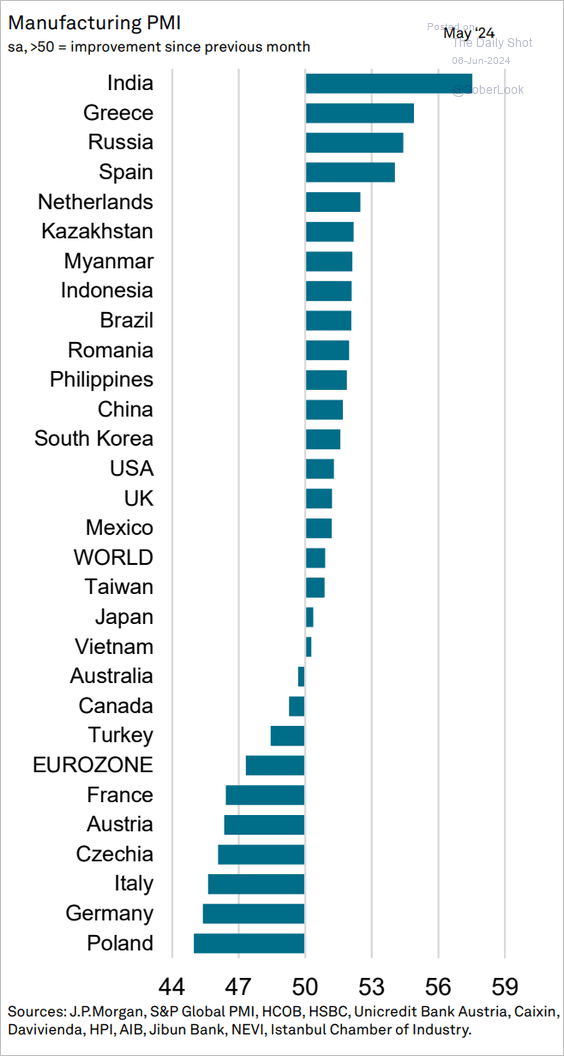 Source: S&P Global PMI
——————–
Food for Thought
1. AI adoption rates:
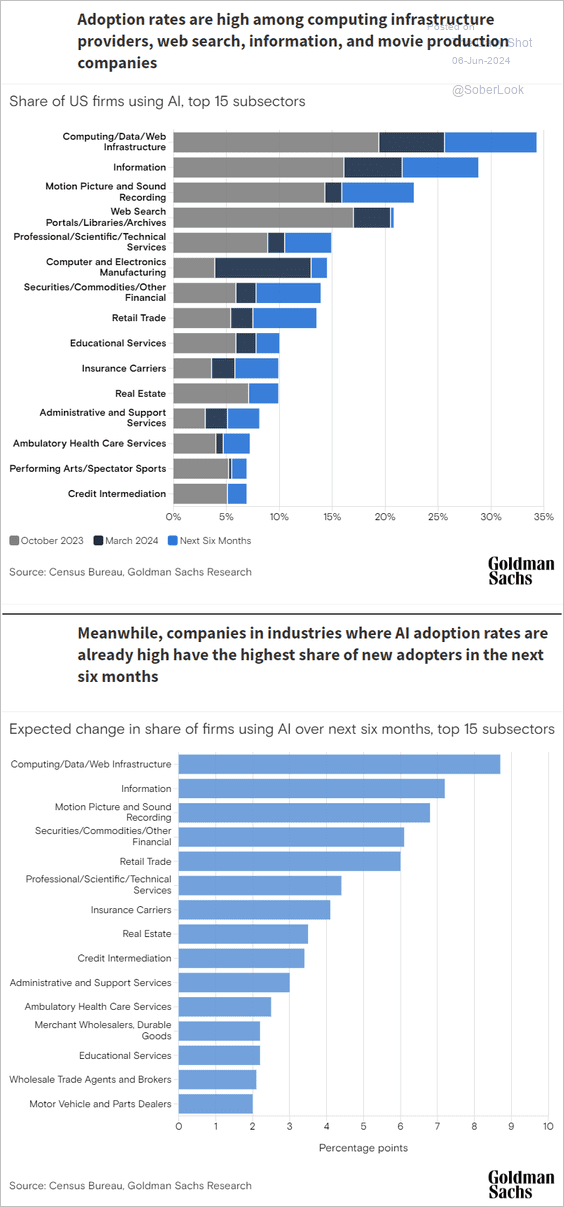 Source: Goldman Sachs
2. The neurotech device market:
 Source: Yahoo Finance Read full article
3. Private-label goods gain market share over national brands.
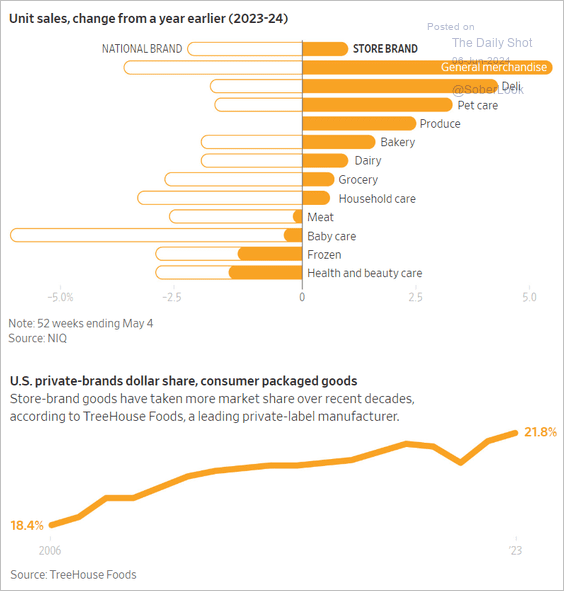 Source: @WSJ Read full article
4. US fetal mortality rates by race and Hispanic origin:
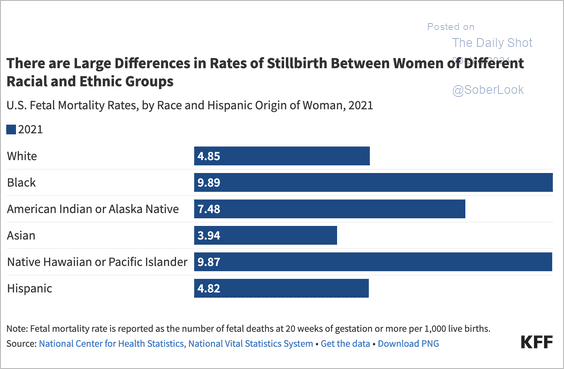 Source: KFF Read full article
5. Types of property crime:
 Source: USAFacts
6. Commercial property insurance inflation in Florida:
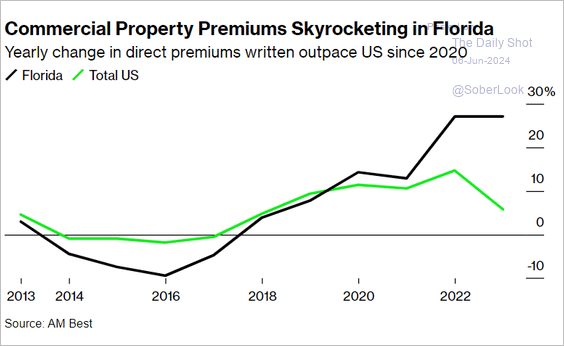 Source: @climate Read full article
7. D-Day invasion forces and equipment overview:
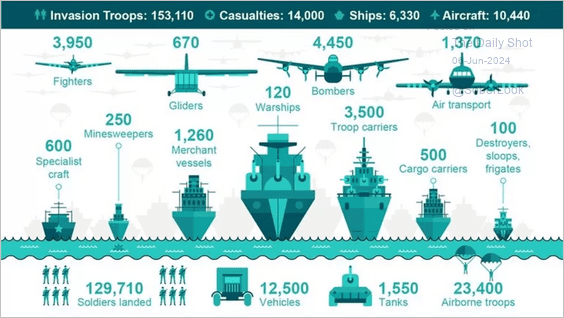 Source: BBC
——————–
Back to Index