The Daily Shot: 07-Jun-24
• The United States
• Canada
• The United Kingdom
• The Eurozone
• Asia-Pacific
• China
• Emerging Markets
• Commodities
• Energy
• Equities
• Global Developments
• Food for Thought
The United States
1. Let’s begin with some updates on the labor market.
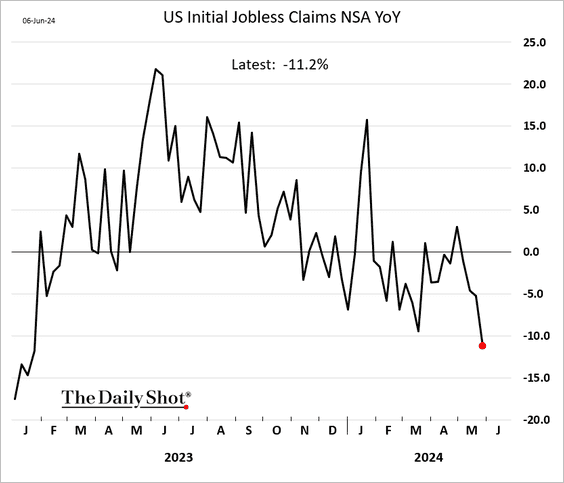
• Initial jobless claims remain near multi-year lows, …
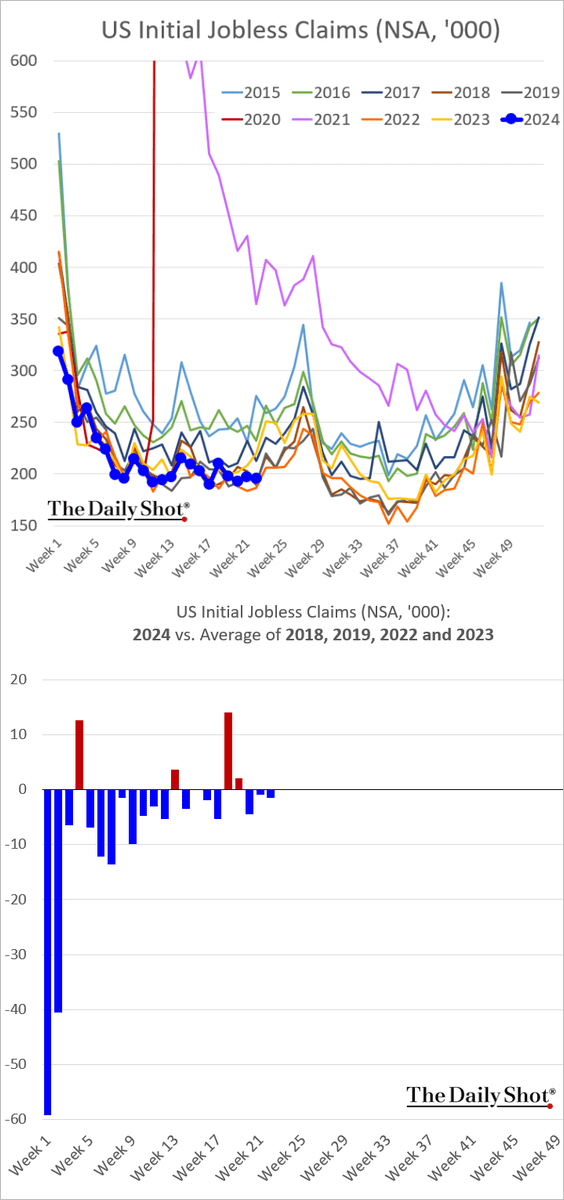
… down 11% from last year’s levels.
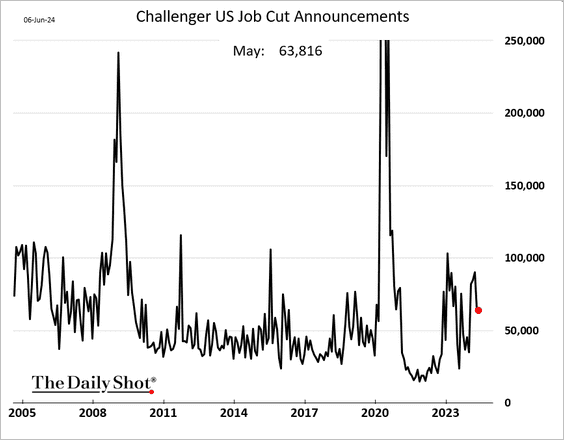
• Job cut announcements were roughly unchanged in May.
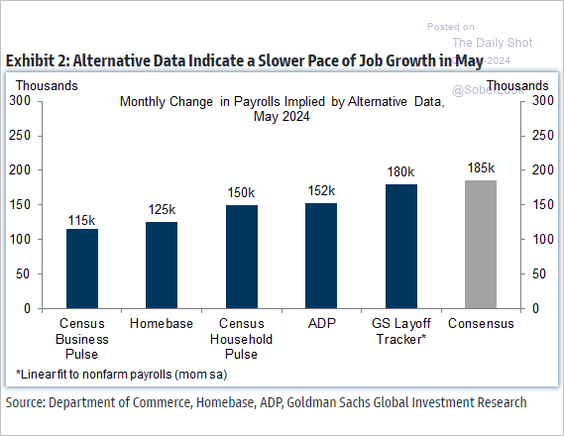
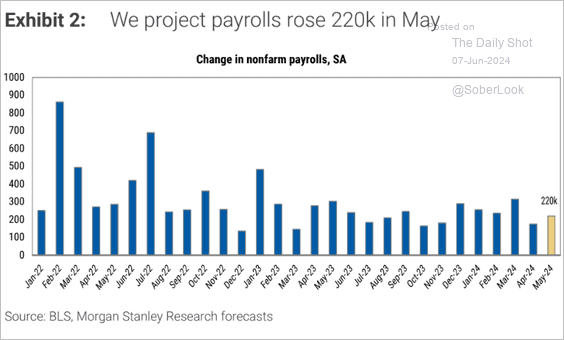
• What should we expect from today’s payrolls report?
– Here are the job gains for May as implied by various leading indicators.
 Source: Goldman Sachs; @MikeZaccardi
– Morgan Stanley’s estimate is 220k, …
 Source: Morgan Stanley Research
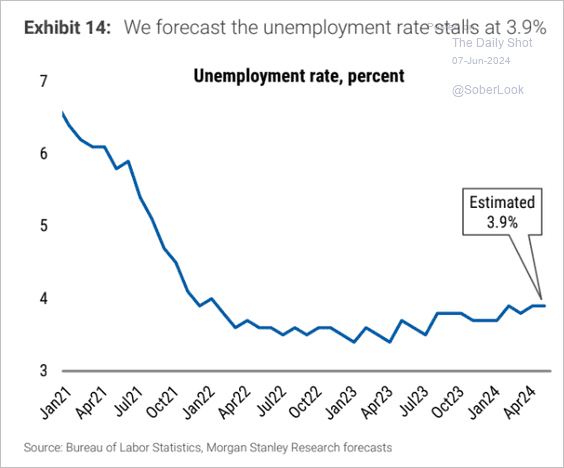
… with the unemployment rate holding steady at 3.9%.
 Source: Morgan Stanley Research
– BofA sees 200k jobs created in May.
 Source: BofA Global Research; @MikeZaccardi
• The NFIB small business survey signals slower job growth ahead.
 Source: Pantheon Macroeconomics
• Payroll growth continues to slow among low-wage sectors.
 Source: Oxford Economics
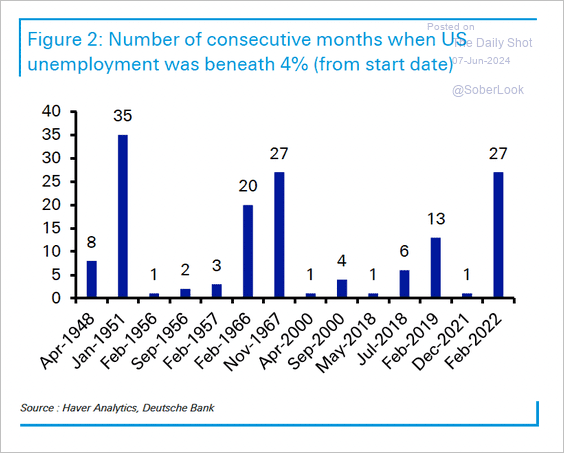
• The unemployment rate has been below 4% for 27 months.
 Source: Deutsche Bank Research
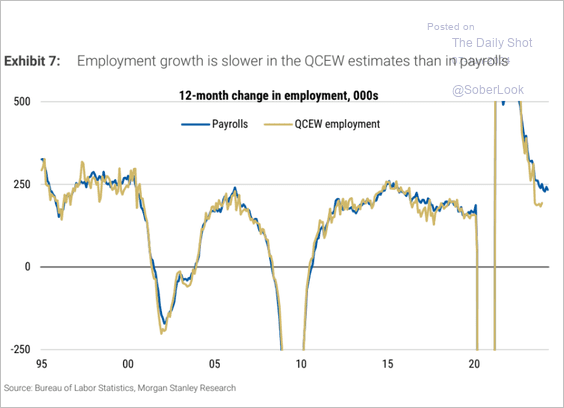
• The Quarterly Census of Employment and Wages suggests that BLS nonfarm payrolls data may be overstating US employment growth (2 charts). Will we see downward revisions?
 Source: Morgan Stanley Research
 Source: Simon White, Bloomberg Markets Live Blog
The Household Survey also suggests an overstatement.
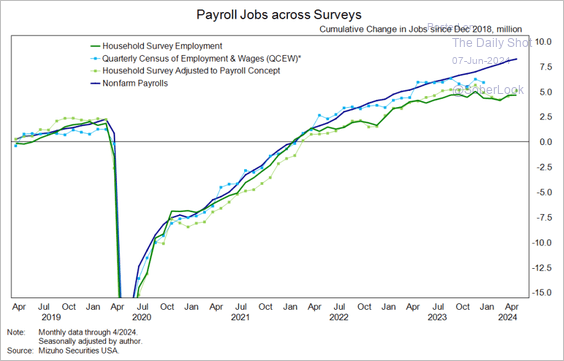 Source: Mizuho Securities USA
——————–
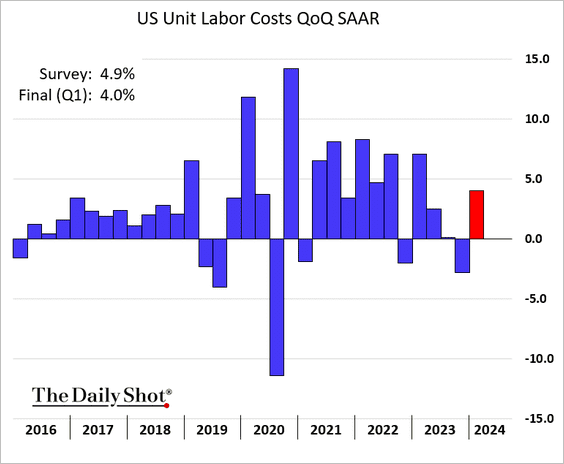
2. The increase in unit labor costs for the first quarter was lower than previously estimated.
On a year-over-year basis, unit labor costs signal slower inflation ahead (2 charts).
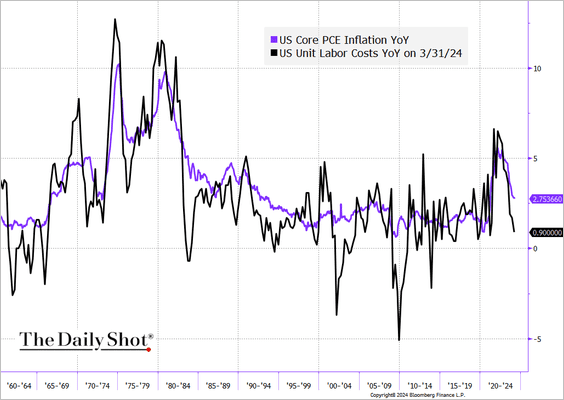 Source: @TheTerminal, Bloomberg Finance L.P.; h/t @KevRGordon
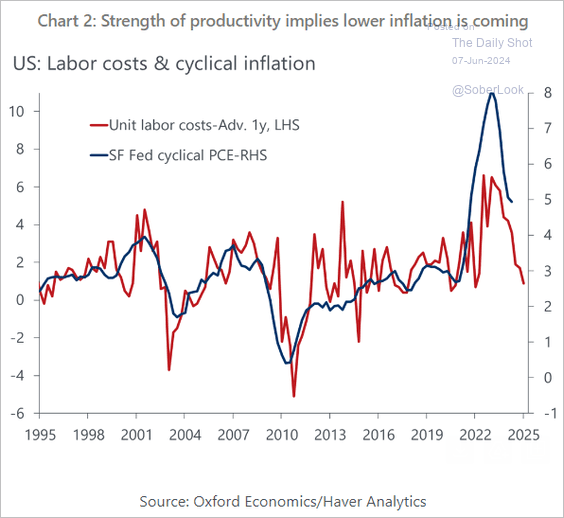 Source: Oxford Economics
——————–
3. Easier financial conditions could support private domestic demand growth.
 Source: Deutsche Bank Research
4. Credit card delinquencies have been rising.
 Source: Federal Reserve Bank of St. Louis Read full article
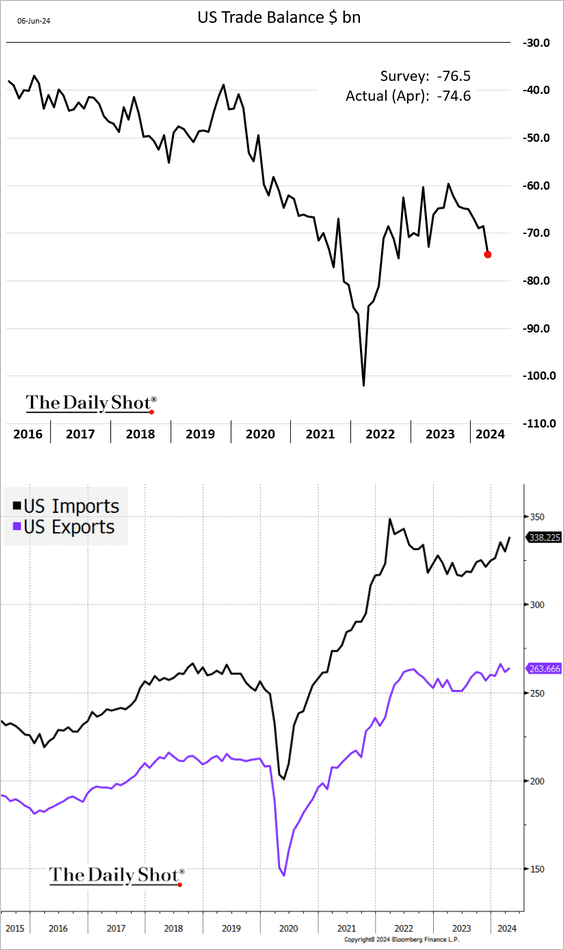
5. The trade deficit (including services) widened less than expected in April.
 Source: @TheTerminal, Bloomberg Finance L.P.
Back to Index
Canada
1. The Ivey PMI, which encompasses both public and private organizations, declined sharply in May but remained in growth territory.

• Hiring remains robust.

• The price index moved up.

——————–
2. The trade balance was in deficit again.

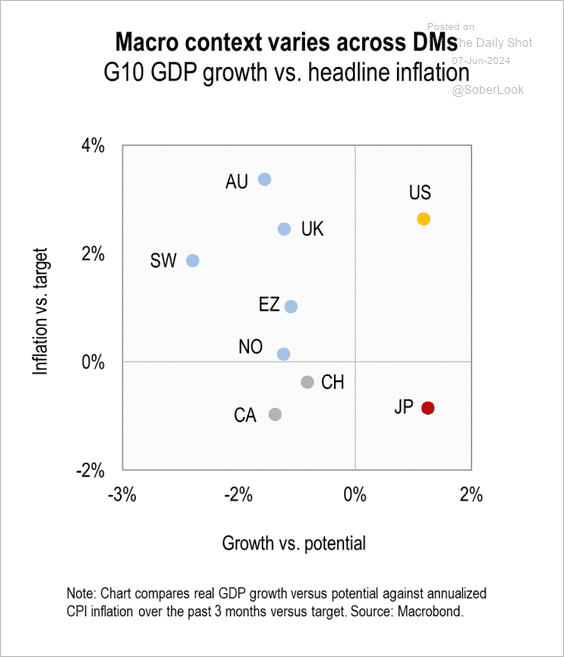
3. Canada is one of the only two G10 countries facing no growth/inflation trade-off from cutting rates.
 Source: Numera Analytics (@NumeraAnalytics)
Back to Index
The United Kingdom
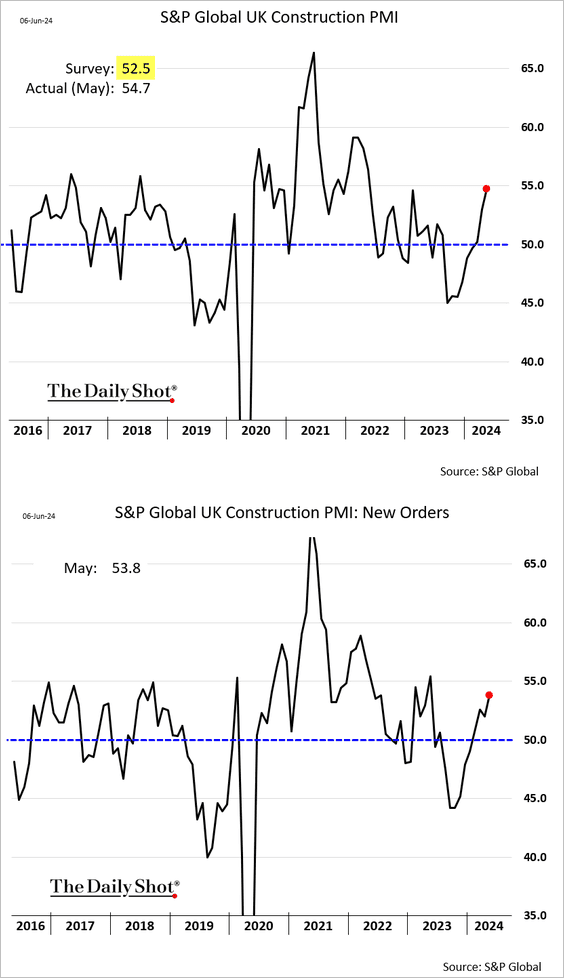
1. Construction activity accelerated in May.
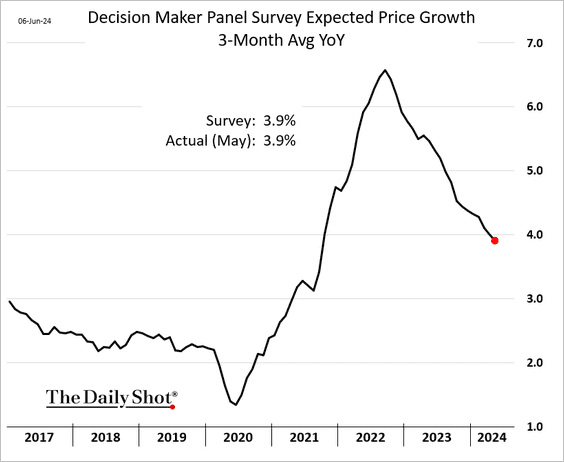
2. British firms anticipate a 3.9% increase in output prices over the next year.
3. Here is a look at UK immigration trends from 2012 to 2023.
 Source: ONS Read full article
Back to Index
The Eurozone
1. The ECB cut rates (as expected).

 Source: MarketWatch Read full article
• The central bank boosted its inflation projections.
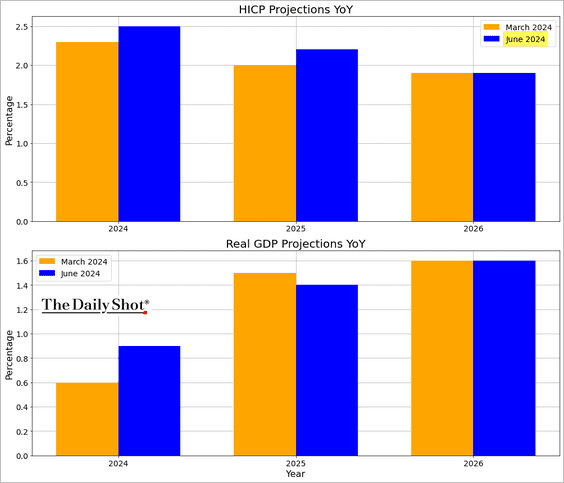
– Here is the attribution of the ECB’s CPI forecast revisions from March.
 Source: ECB
– This ECB chart displays the components of inflation as projected in the quarterly forecast.
 Source: ECB
– Here is a look at the components of GDP growth and the revision attribution.
 Source: ECB
– The ECB has revised its employment growth forecast upward.
 Source: ECB
——————–
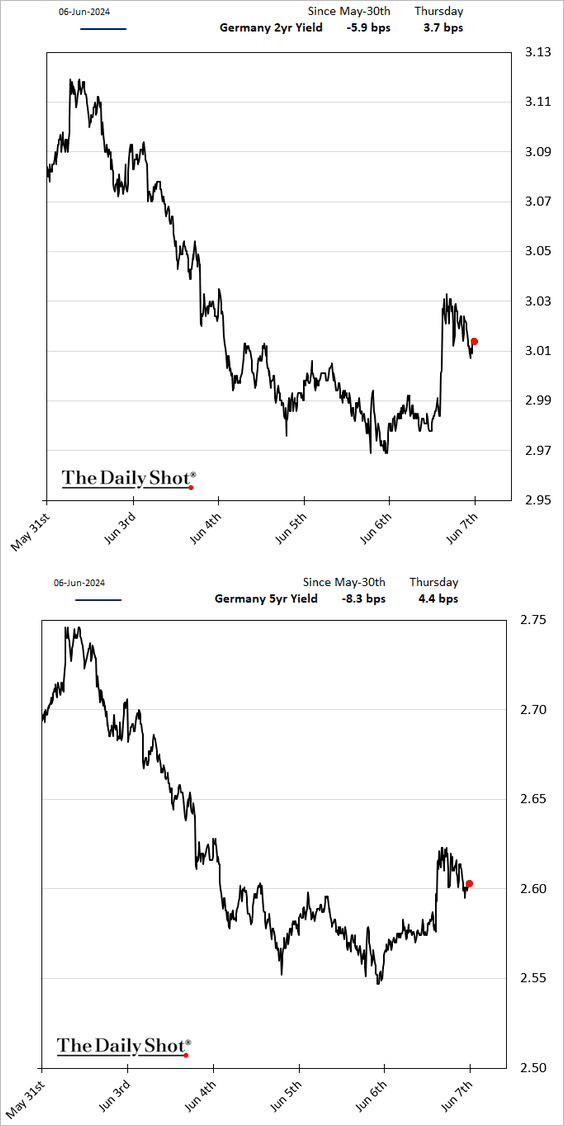
2. The market saw the ECB comments as being a bit on the hawkish side. Bond yields climbed.
 Source: CNBC Read full article
Here is the futures-implied rate trajectory.

——————–
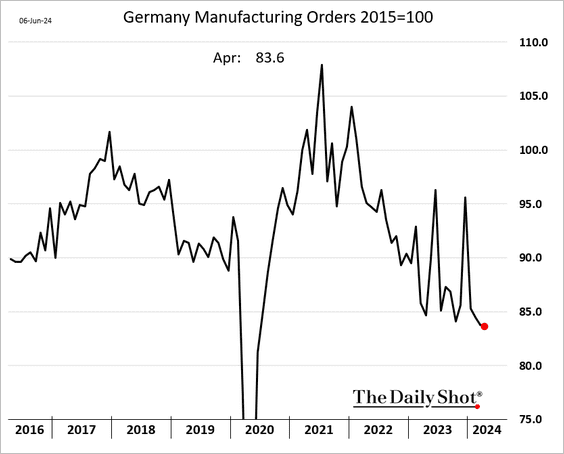
3. Germany’s factory orders edged lower in April.
• Industrial production unexpectedly declined.
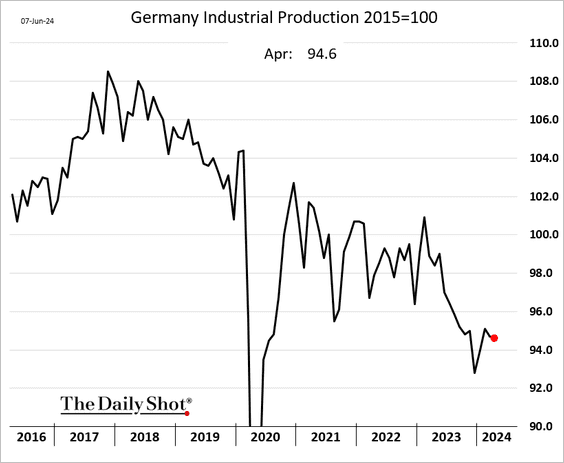
But consumer goods manufacturing improved.

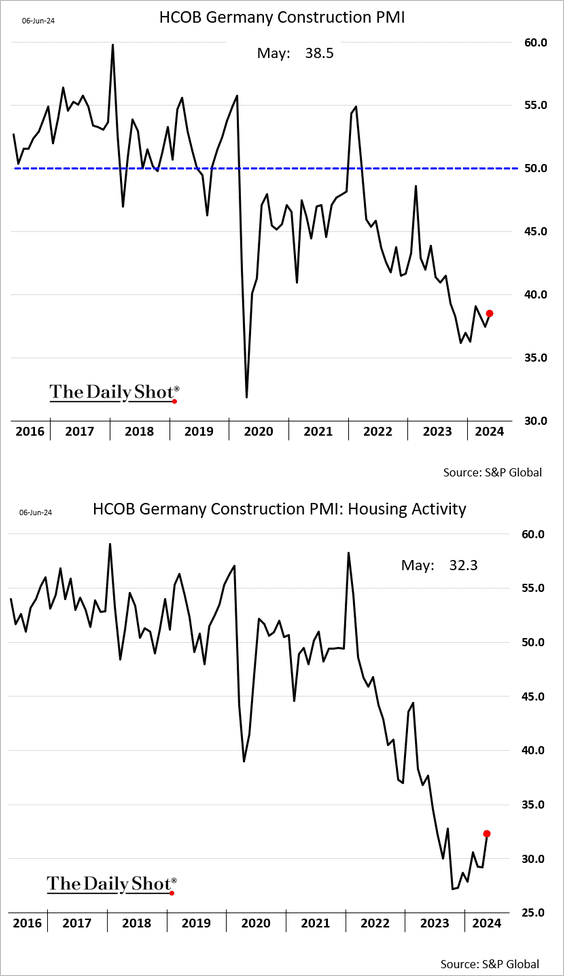
• Germany’s construction activity remains in recession territory.
Back to Index
Asia-Pacific
1. In April, Japan’s household spending increased on a year-over-year basis.

 Source: Reuters Read full article
——————–
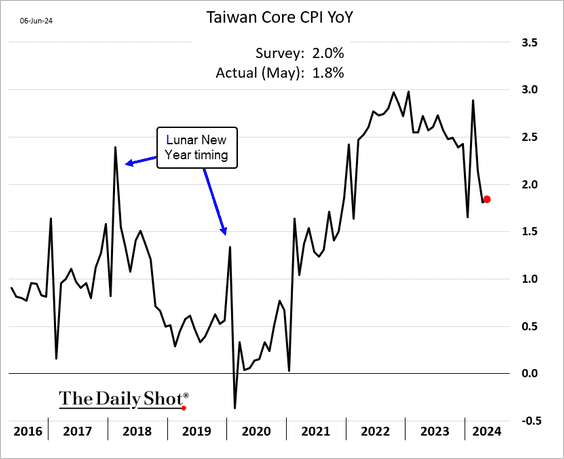
2. Taiwan’s core inflation held below 2% in May.
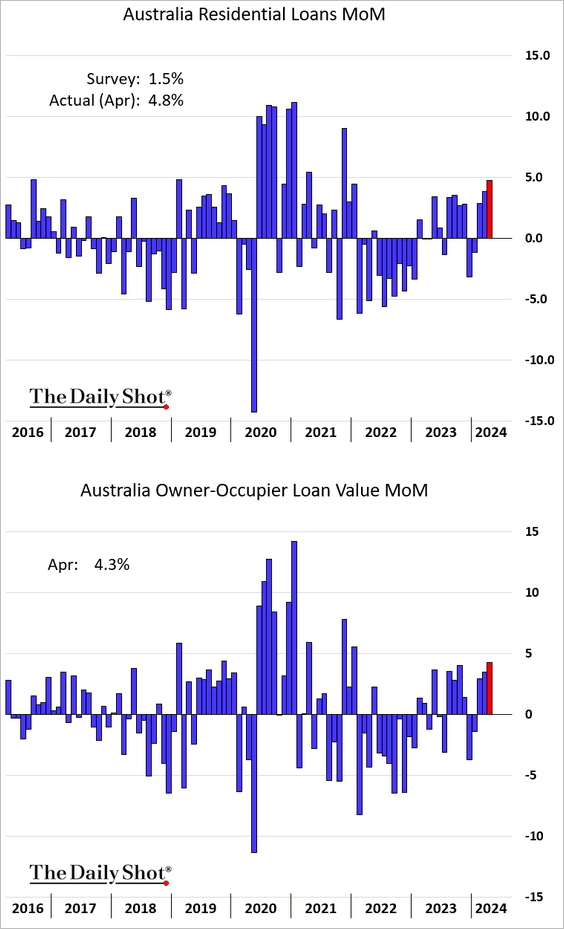
3. Australia’s mortgage lending accelerated in April.
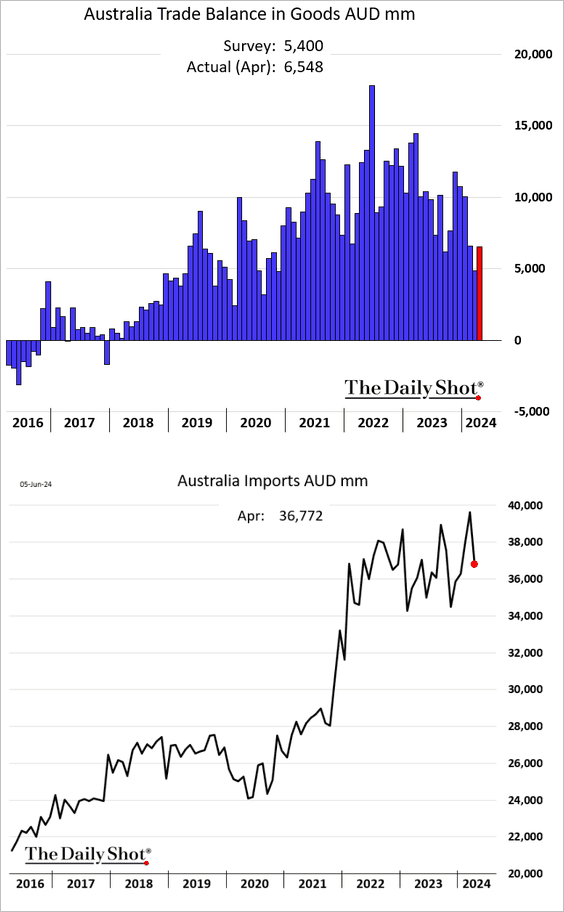
• The trade surplus increased as imports softened.
Back to Index
China
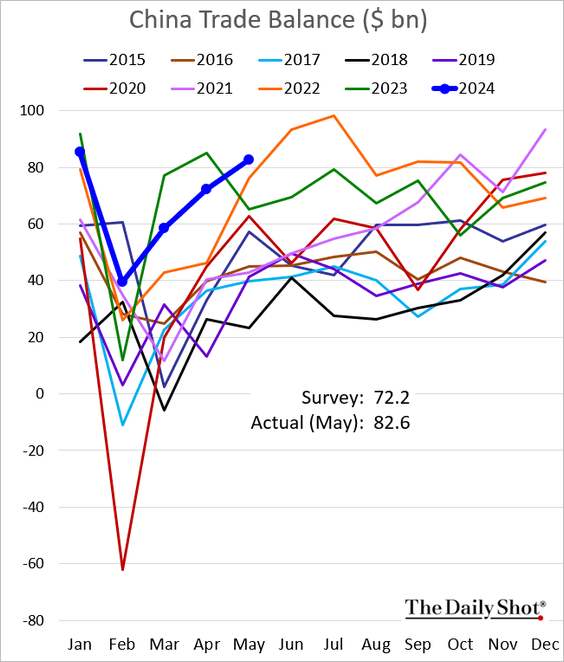
1. Last month’s exports were stronger than expected, …
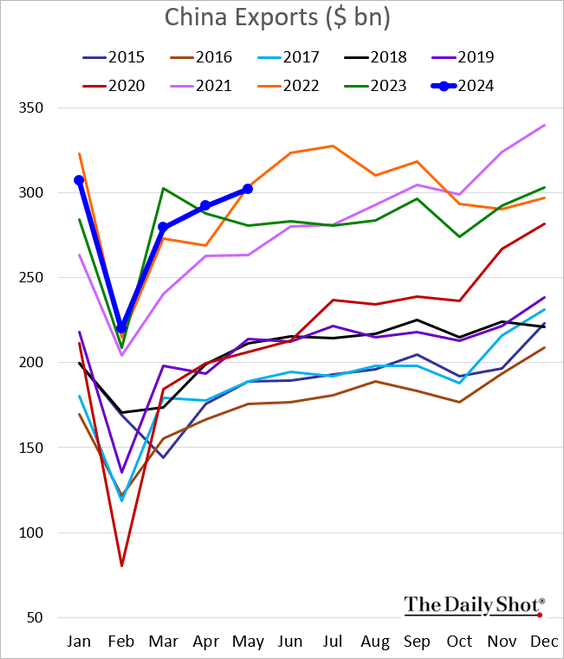
… sending the trade surplus to multi-year highs.
 Source: CNBC Read full article
——————–
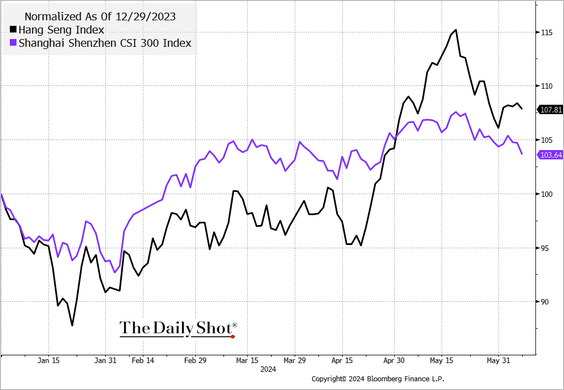
2. The stock market rally has been fading.
 Source: @TheTerminal, Bloomberg Finance L.P.
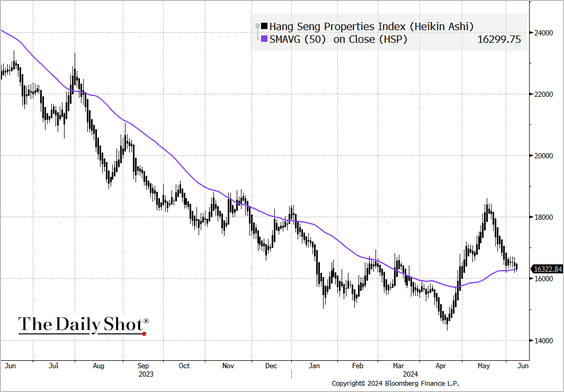
Property stocks in Hong Kong are back at their 50-day moving average.
 Source: @TheTerminal, Bloomberg Finance L.P.
——————–
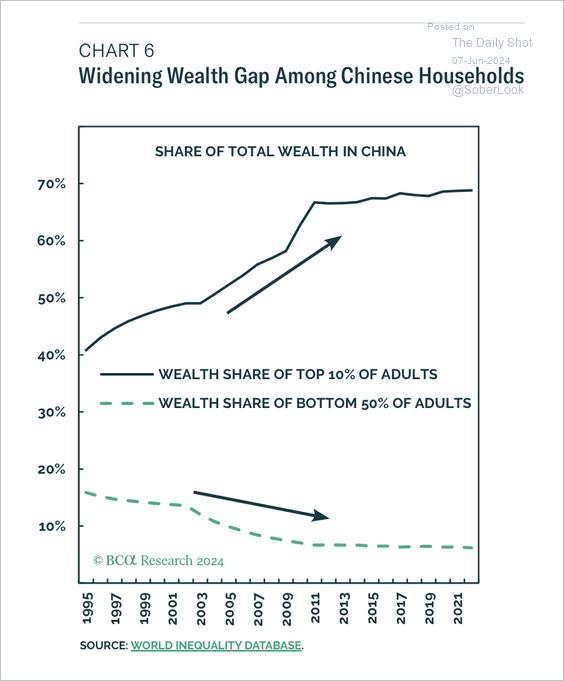
3. The wealth gap has widened.
 Source: BCA Research
Back to Index
Emerging Markets
1. Mexican vehicle production hit a record high for this time of the year.

2. India’s stocks trade at a massive premium to the rest of emerging markets, especially China.
 Source: @TheTerminal, Bloomberg Finance L.P.
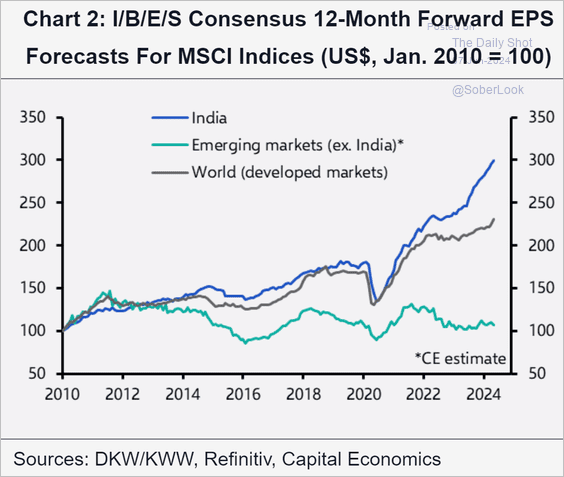
• Spooked by the election outcome and lofty valuations, foreign investors pulled some capital out of Indian equity markets this week.

• The market has been optimistic about India’s corporate earnings growth.
 Source: Capital Economics
——————–
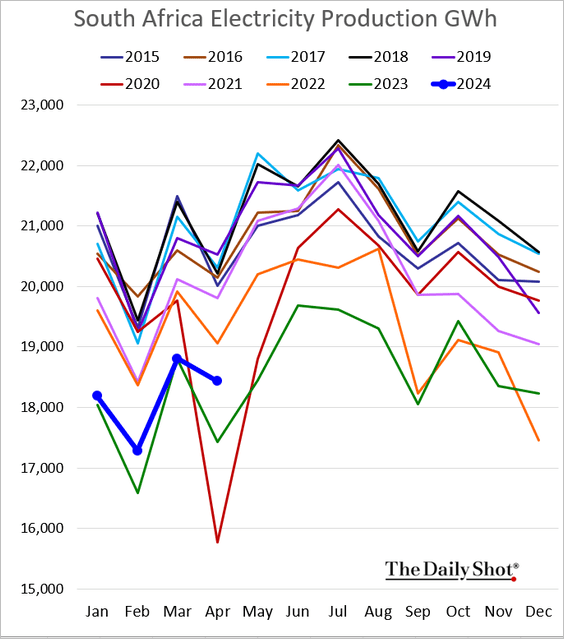
3. In April, South Africa’s electricity production exceeded 2023 levels, although it remains low overall.
Back to Index
Commodities
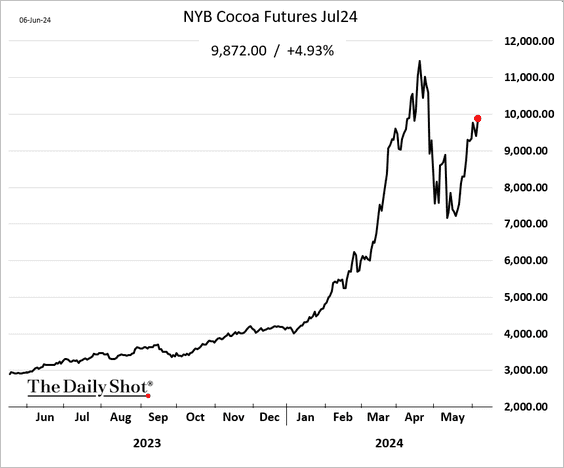
1. Cocoa and coffee futures continue to rally, fueled in part by hedge funds.

——————–
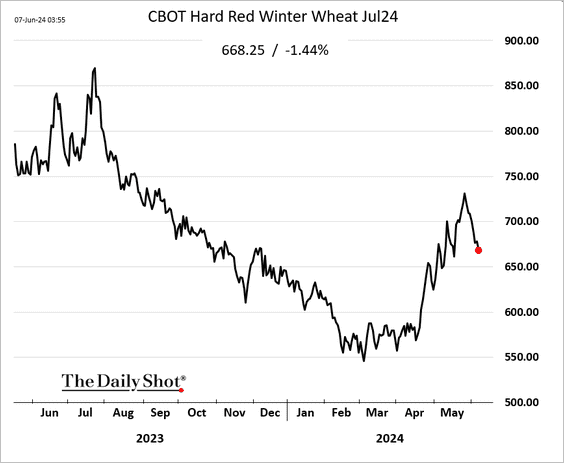
2. The rally in US wheat futures is fading.
Back to Index
Energy
1. Brent crude bounced from this week’s lows but remains below $80/bbl.

 Source: @markets Read full article
——————–
2. Here is a look at the global expansion of solar capacity.
 Source: @markets Read full article
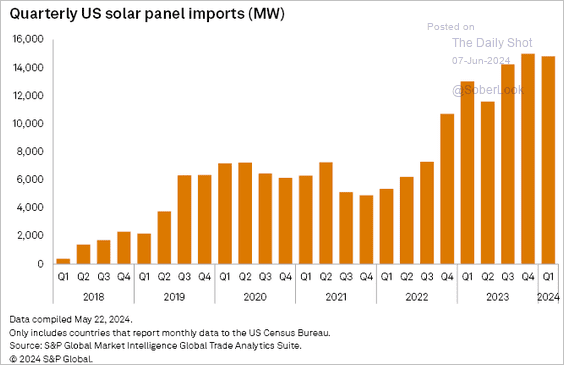
• US solar panel imports remain elevated.
 Source: S&P Global Market Intelligence
——————–
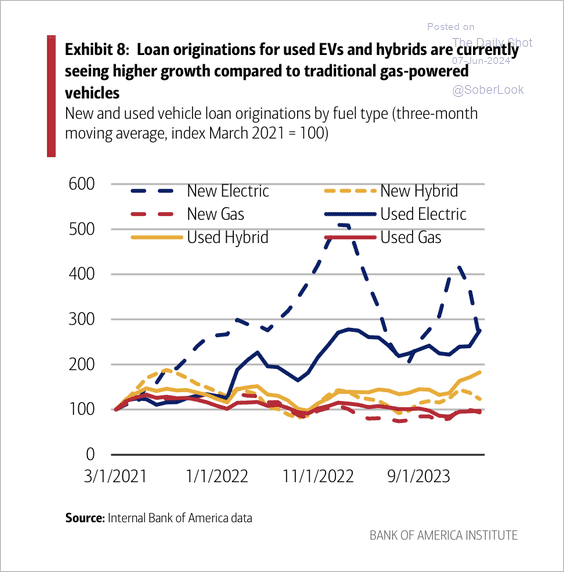
3. US loan originations have increased for new EVs and hybrids.
 Source: Bank of America Institute
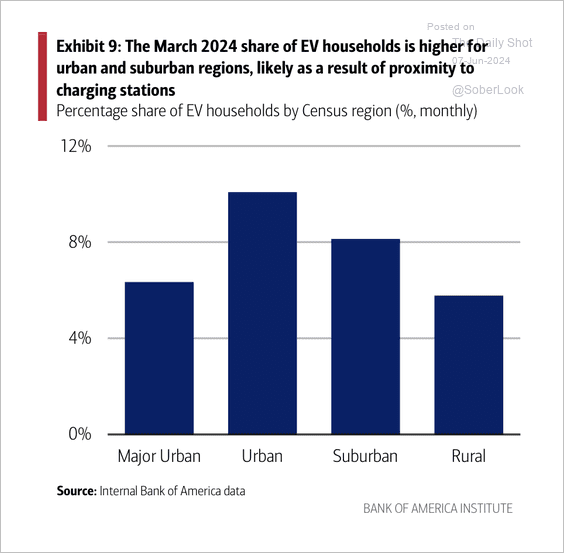
EV adoption is higher in US urban regions than in rural areas.
 Source: Bank of America Institute
Back to Index
Equities
1. Unlike during the dot-com bubble, Nasdaq 100 prices currently align with fundamentals.
 Source: BofA Global Research; @MikeZaccardi
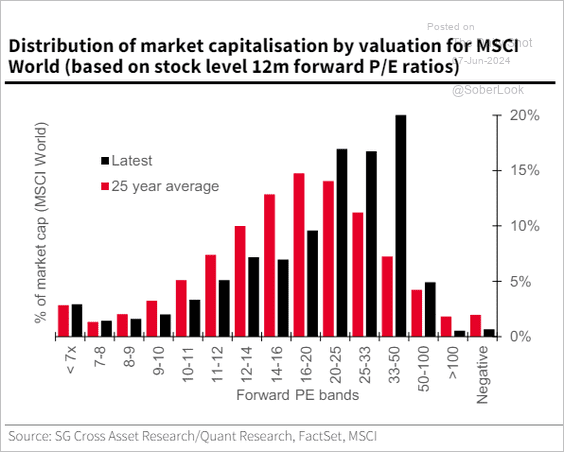
2. The market capitalization distribution by valuation within the MSCI World Index is skewed towards the expensive side compared to its 25-year average.
 Source: SG Cross Asset Research; @johnauthers, @opinion Read full article
3. Small caps’ profits are expected to keep recovering.
 Source: BofA Global Research; @MikeZaccardi
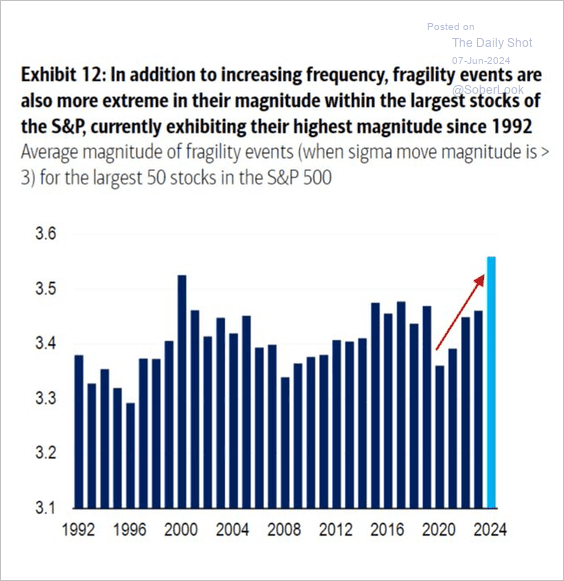
4. The chart shows the average magnitude of fragility events over time, with the highest magnitude recorded in 2024, suggesting that the largest stocks in the S&P 500 are currently experiencing more extreme price movements than at any other time since 1992. A fragility event is characterized by a stock price movement that is more than three standard deviations away from the mean.
 Source: BofA Global Research; @carlquintanilla
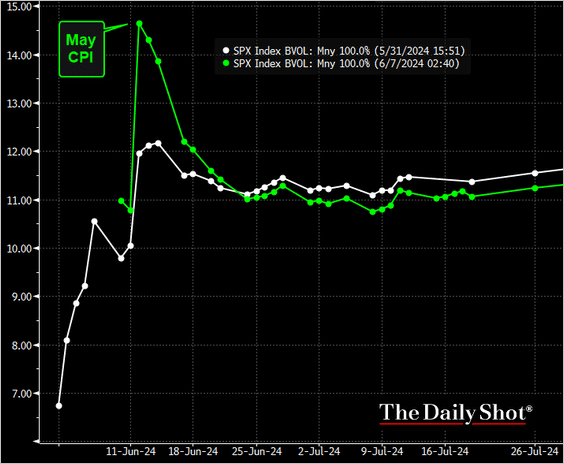
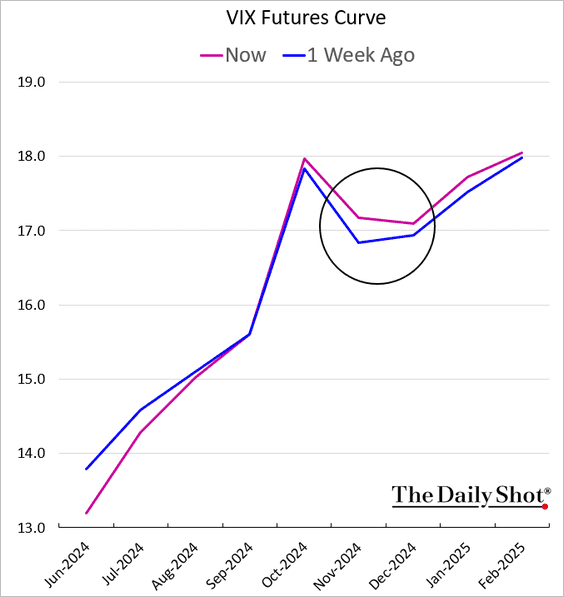
5. Next, we have some updates on the volatility markets.
• The options market is highly attentive to next week’s CPI report.
 Source: @TheTerminal, Bloomberg Finance L.P.
• The VIX futures curve points to some concerns about a hung US presidential election.
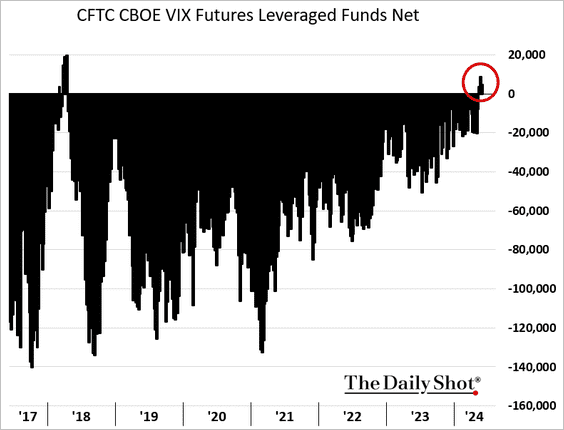
• Leveraged funds are now net long VIX futures.
 h/t Oxford Economics
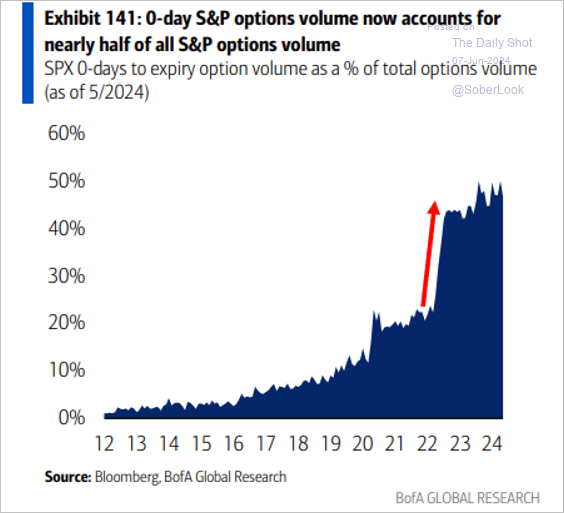
• Zero-day options remain very popular.
 Source: BofA Global Research; @MikeZaccardi
Back to Index
Global Developments
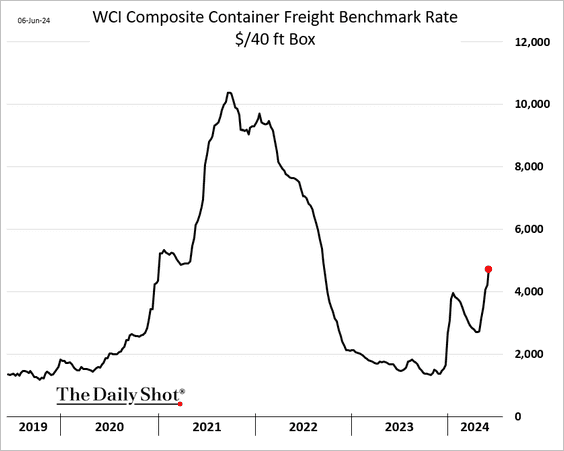
1. Container shipping costs continue to rise.
2. Commercial property sales slowed after central banks hiked rates.
 Source: @wealth Read full article
3. Economists have been upgrading their 2024 GDP growth estimates, except for Japan.
 Source: Truist Advisory Services
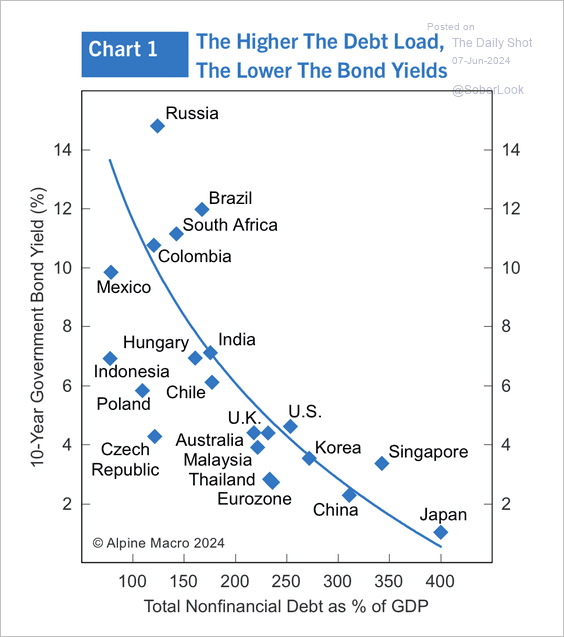
4. Interest rate levels have been negatively correlated with the levels of government debt.
 Source: Alpine Macro
5. Actual individual consumption per capita, reflecting material well-being, may better measure living standards than GDP per capita, which includes imports, exports, investment, and government consumption. According to the International Comparison Program, major economies’ actual individual consumption per capita is 25% to 67% lower than GDP per capita in purchasing power terms, as it excludes non-resident output, investment, and natural resource contributions.
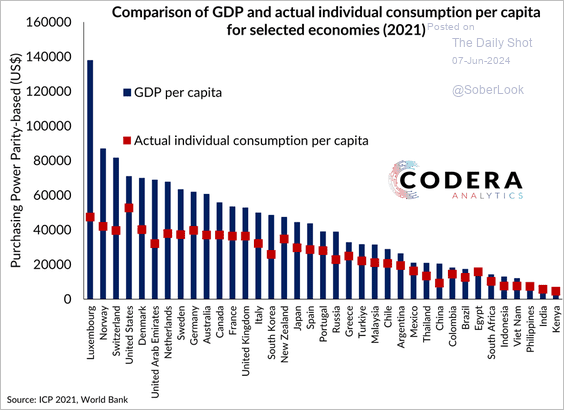 Source: Codera Analytics
——————–
Food for Thought
1. US imported containers by East Coast port:
 Source: Oxford Economics
2. Counterfeiting in e-commerce:
 Source: ECDB Read full article
3. US EV sales forecasts:
 Source: @climate Read full article
4. Why the low groceries inflation feels higher:
 Source: @axios Read full article
5. Armed forces in Europe:
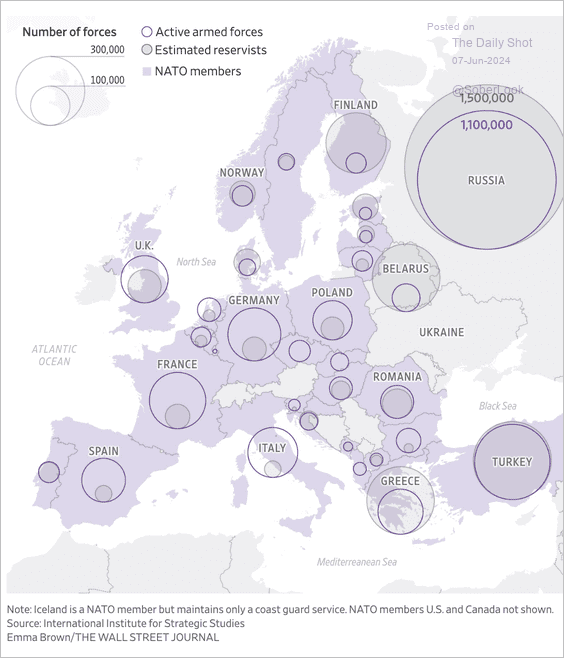 Source: @WSJ Read full article
6. Suicide risks among US teens:
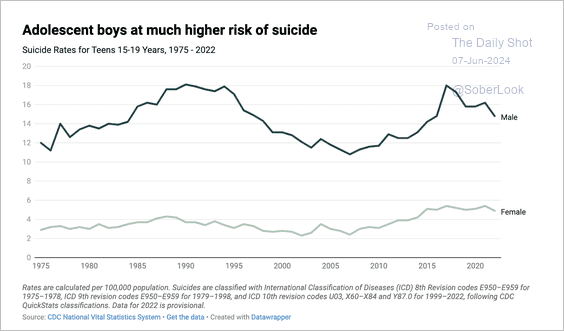 Source: American Institute for Boys and Men Read full article
7. The evolution of beer logos:
 Source: Visual Capitalist Read full article
——————–
Have a great weekend!
Back to Index
