The Daily Shot: 17-Jun-24
• China
• The United States
• The United Kingdom
• The Eurozone
• Europe
• Asia-Pacific
• Emerging Markets
• Commodities
• Equities
• Credit:
• Global Developments
• Food for Thought
China
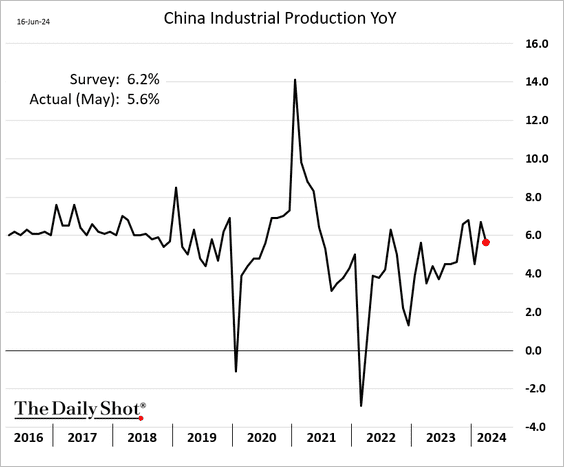
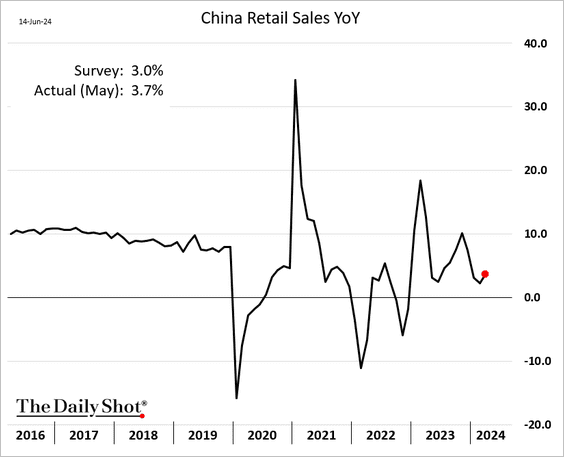
1. Economic activity in May showed mixed results, as industrial output growth slowed, but retail sales exceeded forecasts.
• Industrial production:
• Retail sales:
 Source: @economics Read full article
——————–
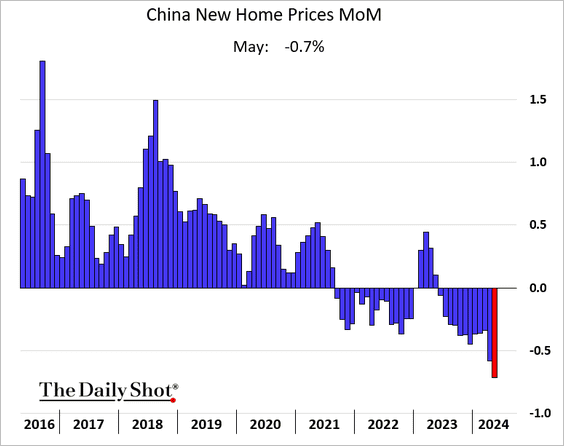
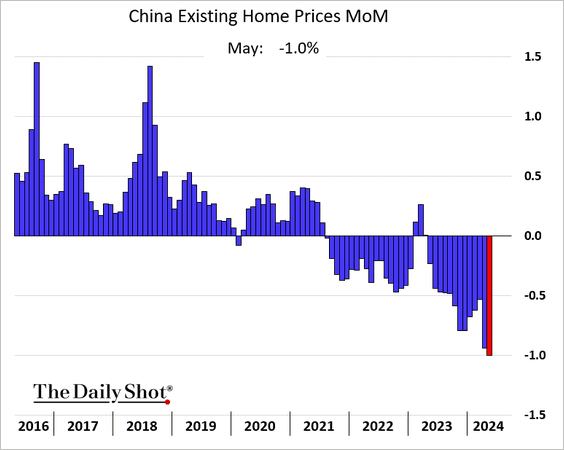
2. China’s housing market slump is deepening, which is putting pressure on industrial metals (see the commodities section).
• New home prices (month-over-month):
• Existing home prices (month-over-month):
• Residential sales:

• Mainland-listed real estate shares:

 Source: @markets Read full article
——————–
3. Bank lending was well below expectations in May amid soft demand.

 Source: Reuters Read full article
Aggregate financing bounced from the April lows, …

… boosted by government bond issuance.

Below are the year-over-year trends.
 Source: @TheTerminal, Bloomberg Finance L.P.
• The slump in China’s equity issuance continues.

• The money supply growth is slowing rapidly, with the M1 measure now in contraction territory.

——————–
4. Bond yields are lower again, …
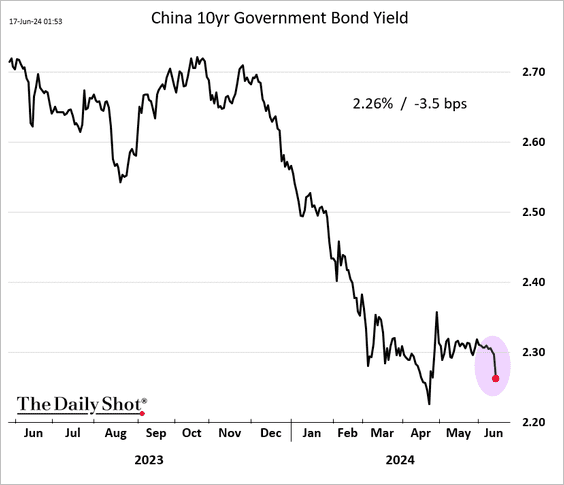
…a development that has been frustrating Beijing.
 Source: @markets Read full article
Short-term rates have been trending down as well.

Back to Index
The United States
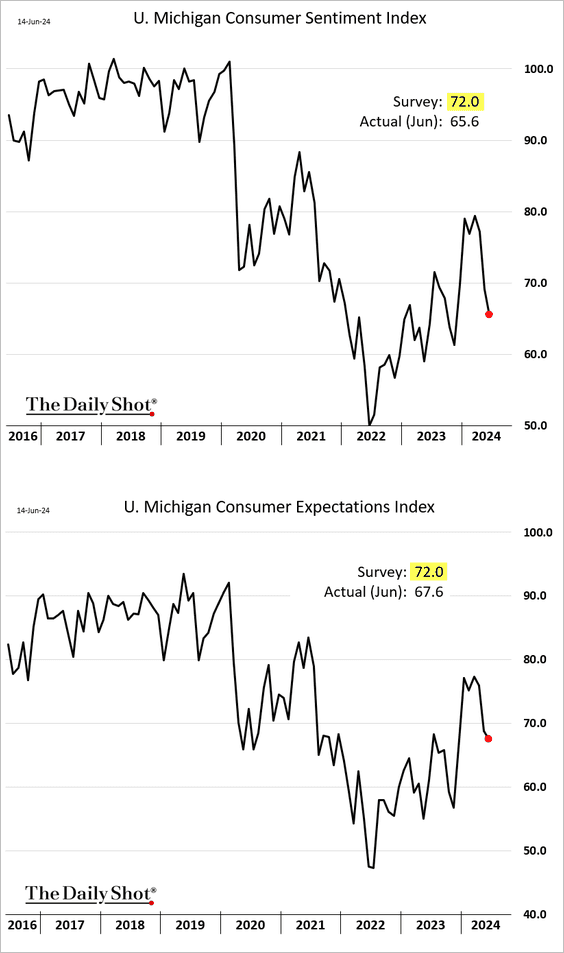
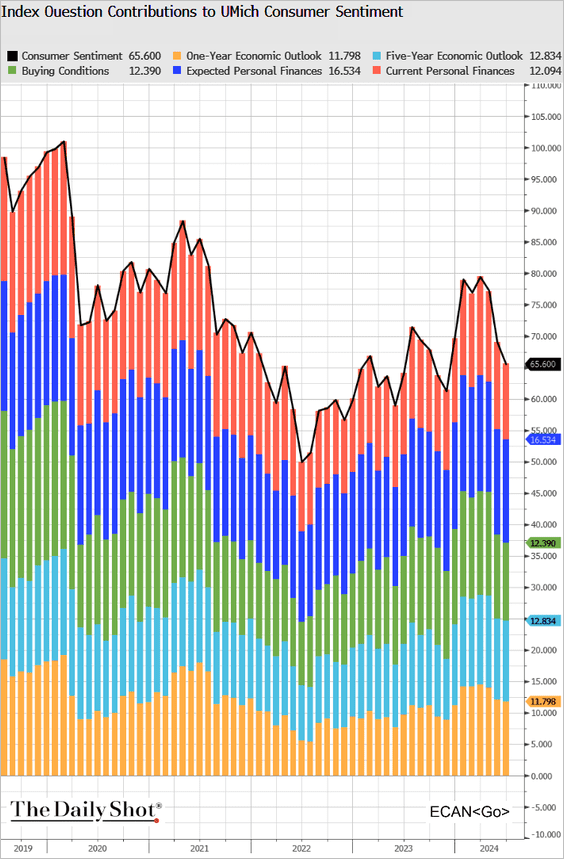
1. The University of Michigan’s consumer sentiment index unexpectedly fell this month.
 Source: @TheTerminal, Bloomberg Finance L.P.
 Source: MarketWatch Read full article
• Households are concerned about deteriorating income levels.

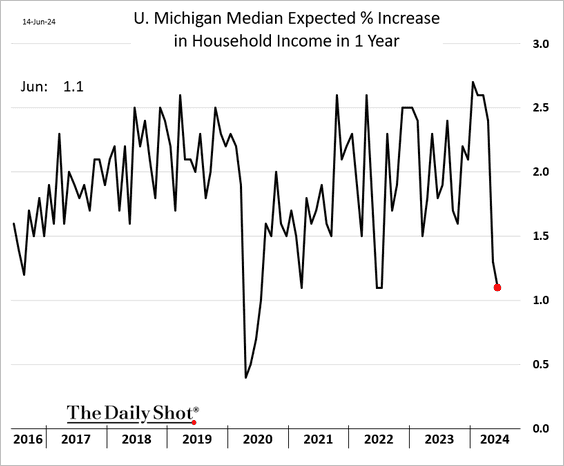
Real income expectations hit the lowest levels in over a decade.

• There is growing concern about potential job losses over the next five years.

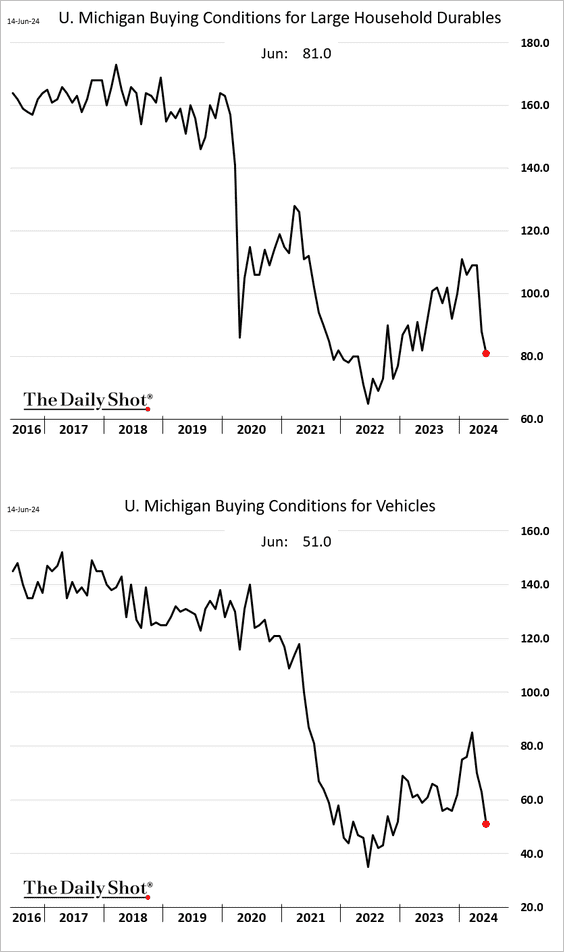
• Buying conditions for durables continue to worsen.
——————–
2. Next, we have some updates on inflation,
• The U. Michigan longer-term inflation expectations climbed this month.
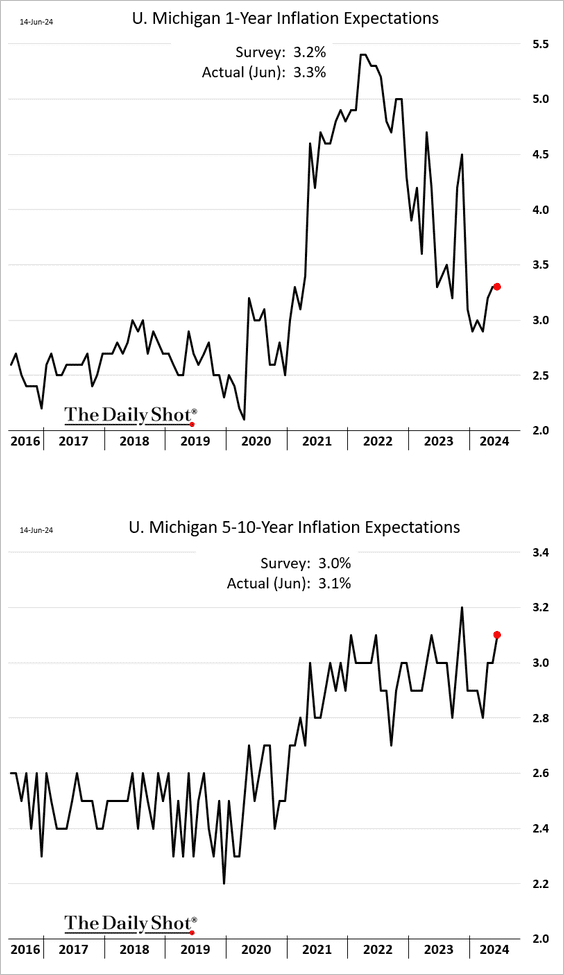
It’s worth noting that the data behind the longer-term inflation expectations index is highly skewed to the upside.

• Import prices dropped last month.

 Source: MarketWatch Read full article
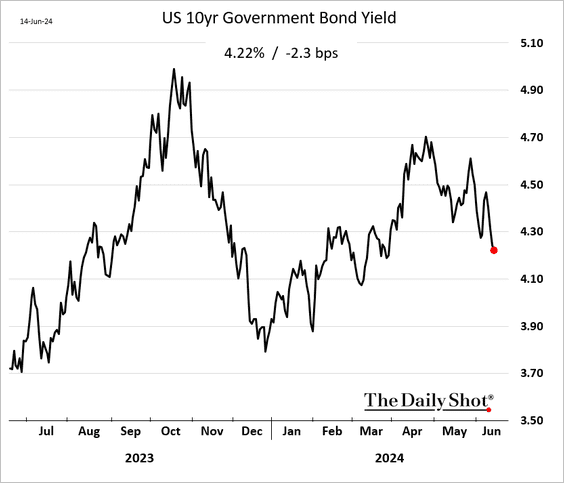
• Market-based inflation expectations declined last week after soft CPI and PPI reports.


The 10-year Treasury yield moved lower.
——————–
3. The labor market will ultimately determine the path of Fed easing.
 Source: Numera Analytics (@NumeraAnalytics)
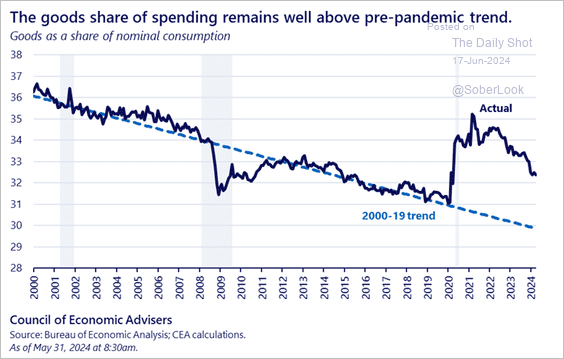
4. The share of household spending on goods remains elevated.
 Source: White House Read full article
Back to Index
The United Kingdom
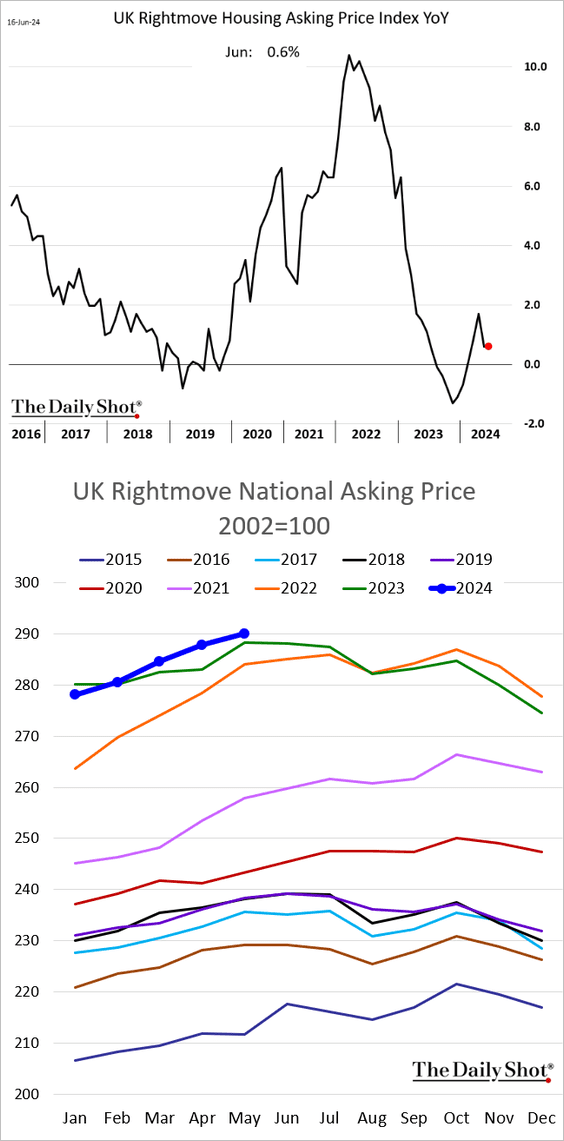
1. UK asking prices for housing remain above the levels seen last year.
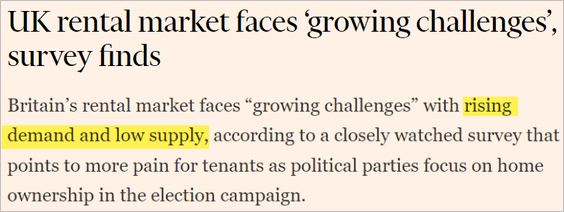
2. Demand for rentals has been rising.
 Source: RICS
 Source: @financialtimes Read full article
——————–
3. Inflation expectations continue to moderate.

Back to Index
The Eurozone
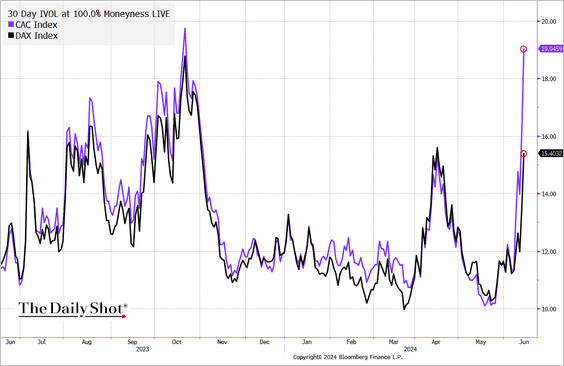
1. The headlines from France continue to spook investors.
 Source: @bpolitics Read full article
 Source: @bpolitics Read full article
 Source: @bpolitics Read full article
• French longer-term yields have risen sharply against the German equivalent.


Below is the yield curve comparison.
 Source: @TheTerminal, Bloomberg Finance L.P.
• The sovereign CDS spread keeps widening.

• Here is the divergence in stock prices, …

… and implied volatility.
 Source: @TheTerminal, Bloomberg Finance L.P.
——————–
2. The EUR/USD risk reversals continue to show increasing downside bias.

3. Euro-area trade surplus topped forecasts.

Back to Index
Europe
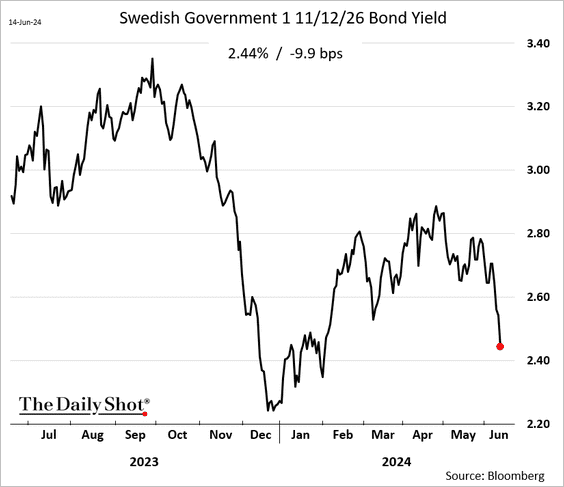
1. Swedish inflation was higher than expected in May.

But bond yields continue to fall.
Here is the swap curve.

——————–
2. The Swiss franc continues to gain vs. the euro amid concerns about the upcoming French elections.


Back to Index
Asia-Pacific
1. Economists are boosting their forecasts for South Korea’s export growth.

Export prices have been strengthening.

——————–
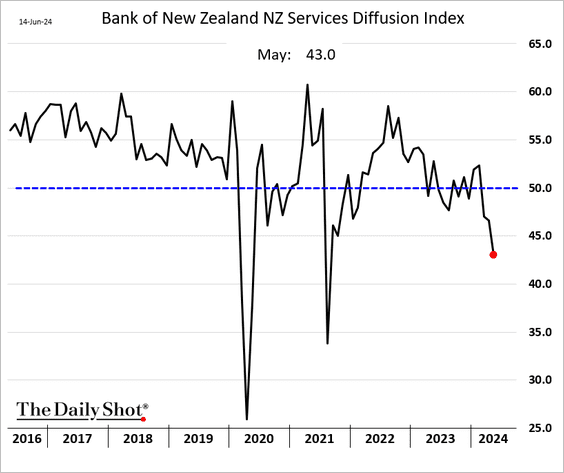
2. New Zealand’s service sector activity is contracting.
3. Australia’s job ads continue to trend lower.

Back to Index
Emerging Markets
1. Brazil’s economic activity was unchanged in April.
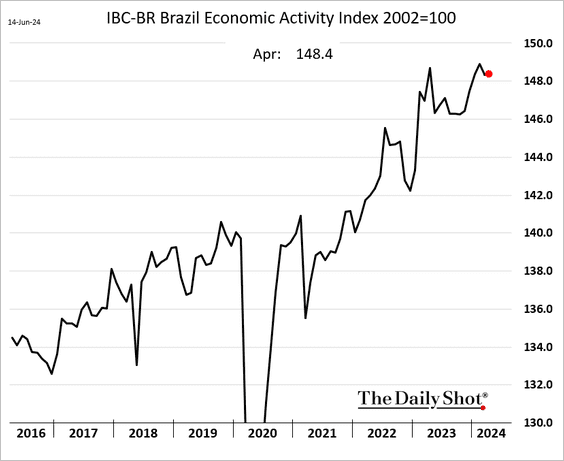
Service sector output rebounded.

——————–
2. India’s wholesale price inflation is climbing again.

• The trade deficit widened in May as imports jumped.

——————–
3. Ukraine’s central bank cut rates last week.

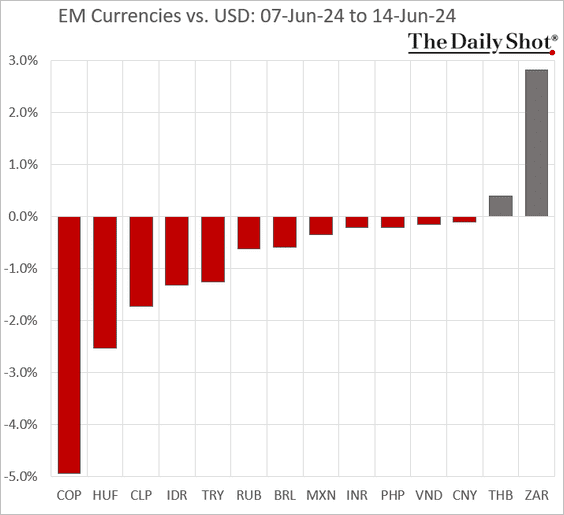
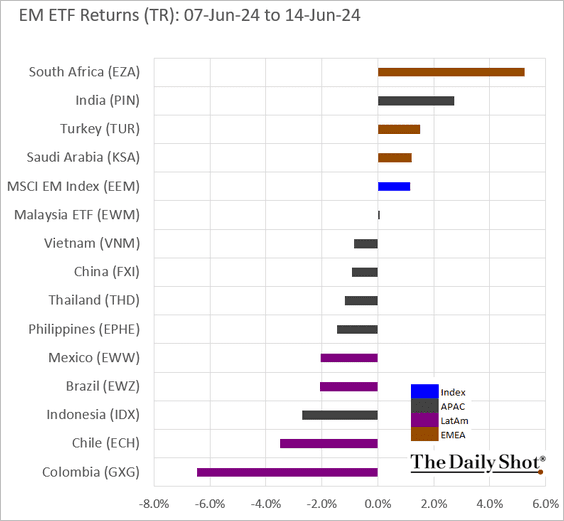
4. Here is a look at last week’s performance.
• Currencies:
• Bond yields:

• Equity ETFs:
Back to Index
Commodities
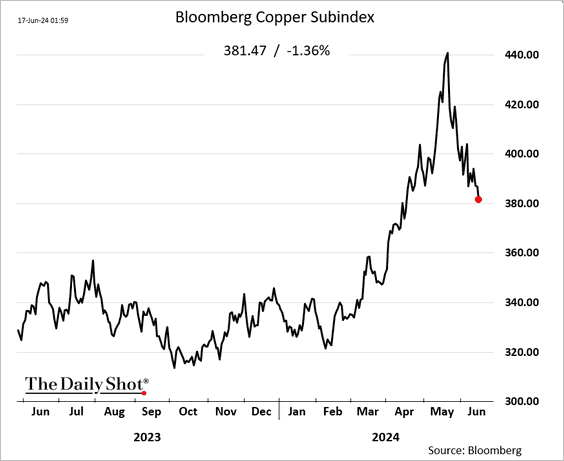
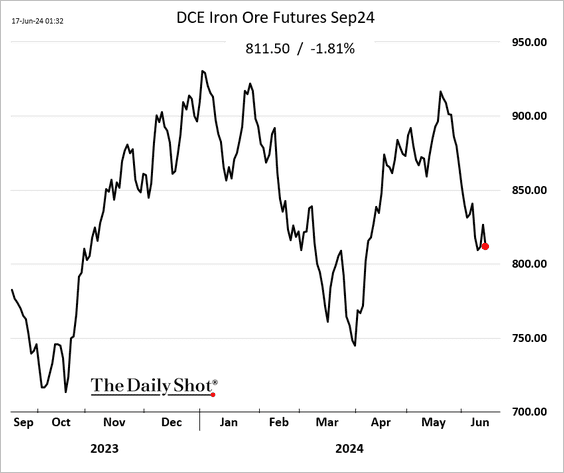
1. Induatrial metals are struggling due to China’s worsening property slump.

 Source: @markets Read full article
– Copper:
– Aluminum:

– Iron ore:
• The SPDR Metals & Mining ETF (XME) broke below long-term support relative to the S&P 500.

——————–
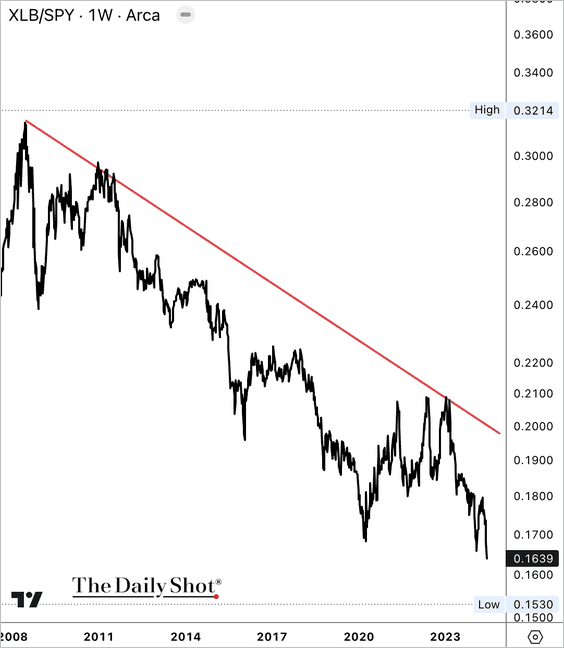
2. The SPDR Materials ETF (XLB) is entering a seasonally weak period.
 Source: @TheTerminal, Bloomberg Finance L.P.
• XLB remains in a long-term downtrend vs. the S&P 500.
——————–
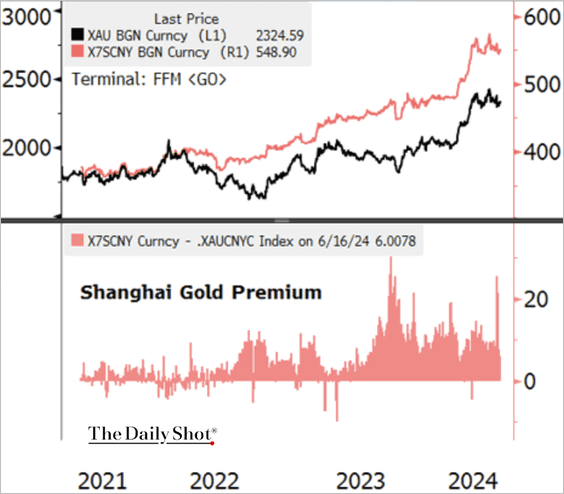
3. Shanghai’s gold premium vs. the international bullion price in yuan remains elevated.
 Source: @TheTerminal, Bloomberg Finance L.P.
4. Speculative accounts continue to boost their bets against palladium futures.

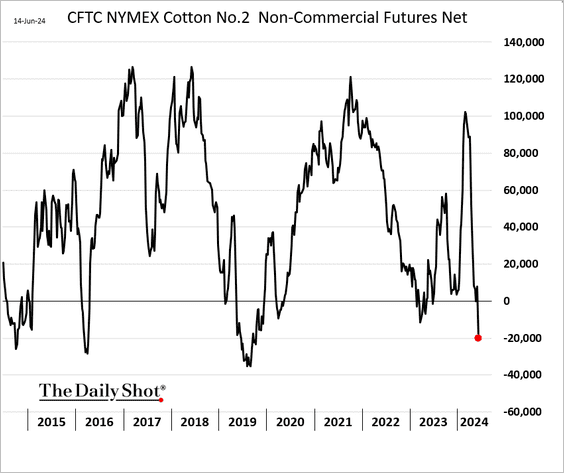
5. Hedge funds are now net short cotton futures.
6. Here is last week’s performance data.

Back to Index
Equities
1. The outperformance of US equities relative to the rest of the world has accelerated.

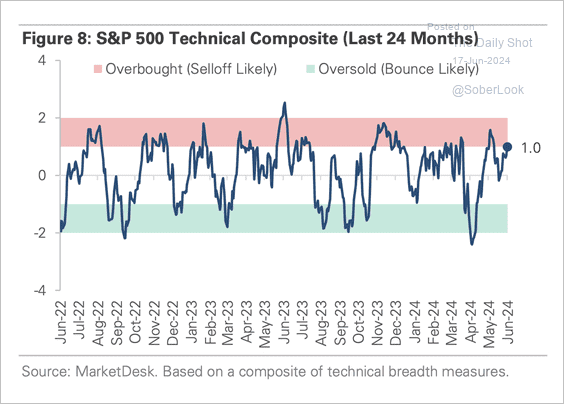
2. The S&P 500 appears overbought.
 Source: MarketDesk Research
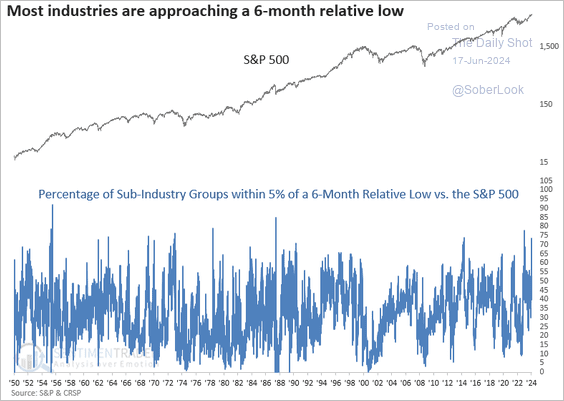
3. Last week, roughly 73% of sub-industry groups closed within 5% of a six-month relative low versus the S&P 500. This reflects weakening short-term breadth.
 Source: SentimenTrader
• The latest rally has been very narrow.
 Source: @5thrule, @TheTerminal, Bloomberg Finance L.P. Read full article
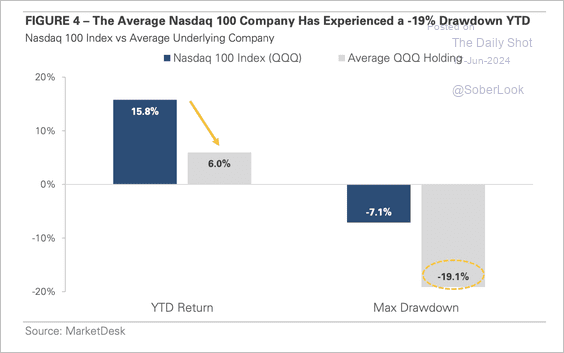
• There has been underlying weakness within the Nasdaq 100.
 Source: MarketDesk Research
——————–
4. Next, we have some equity factor trends.
• Momentum:

• Quality:

• Dividend Aristocrats:

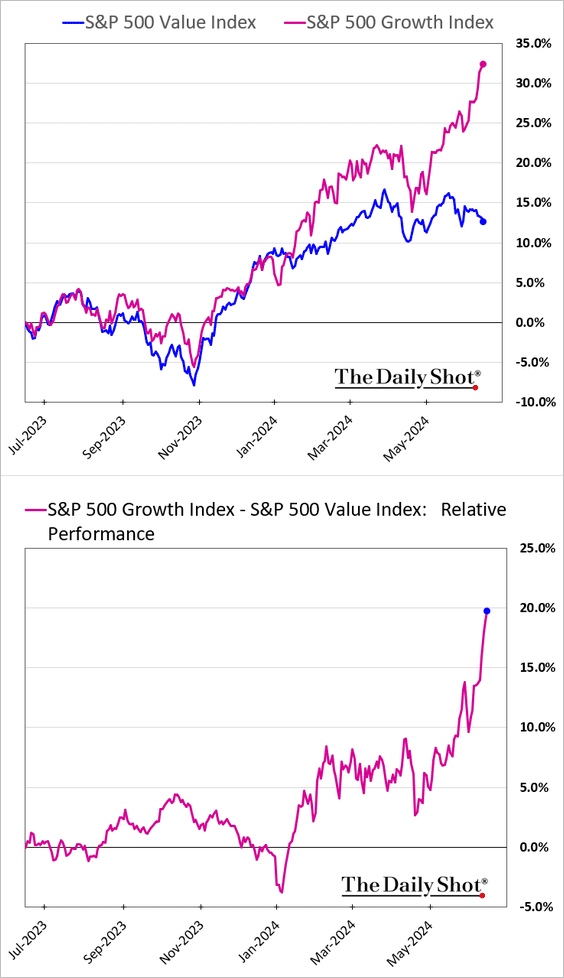
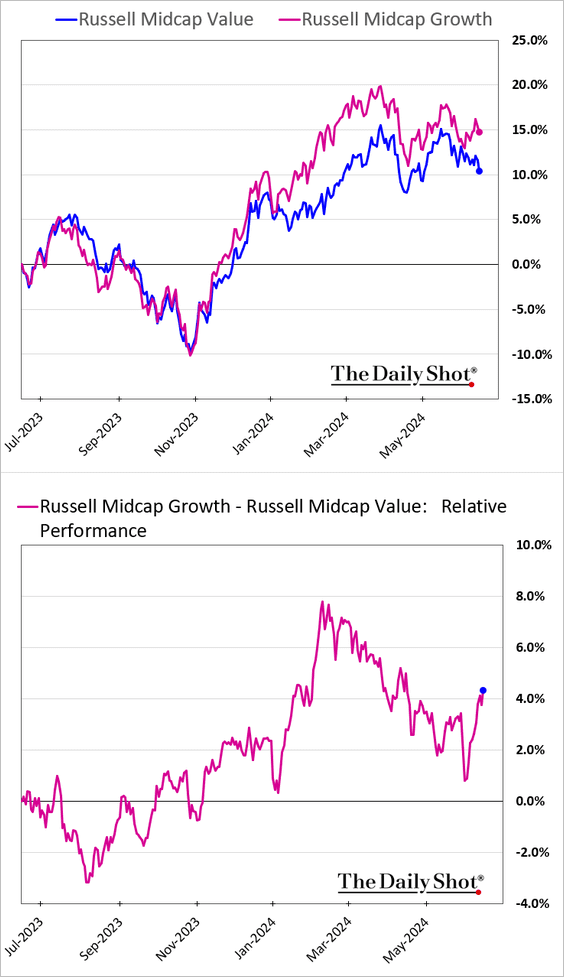
• Growth vs. value:
– Large caps (skewed by tech mega-caps):
– Mid-caps:
– Small-caps:

——————–
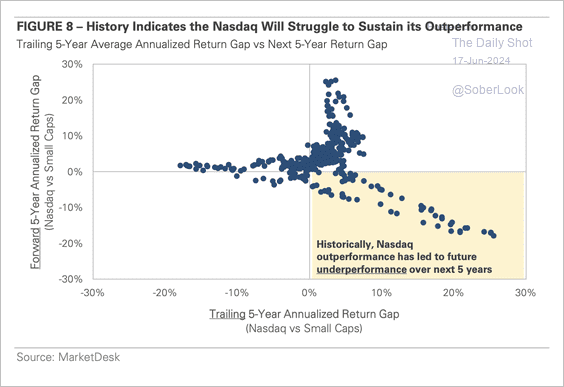
5. The wide performance gap between the Nasdaq 100 Index and Russell 2000 Index (small-caps) points to a period of underperformance for tech stocks.
 Source: MarketDesk Research
• The S&P Small-Cap 600 Index continues to trade at a record discount versus large-caps.
 Source: State Street Global Advisors Read full article
——————–
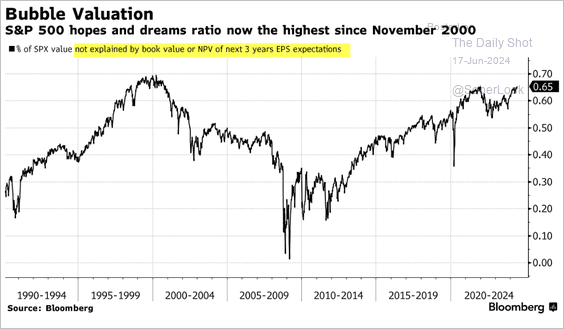
6. According to some measures, the latest rally has been outstripping market fundamentals.
 Source: @5thrule, @TheTerminal, Bloomberg Finance L.P. Read full article
7. Are credit markets signaling higher volatility in equities?
 Source: BofA Global Research; @MikeZaccardi
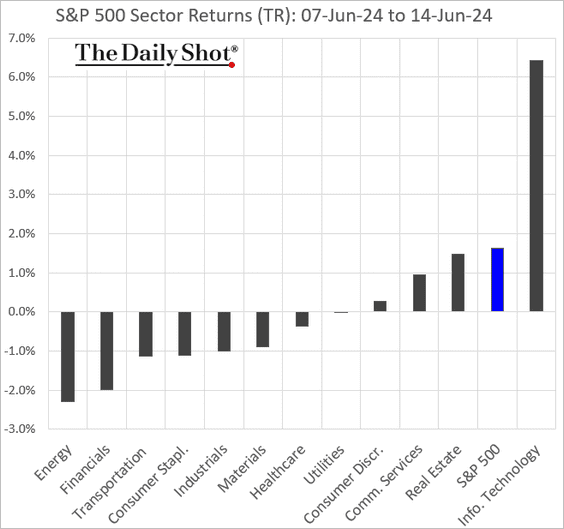
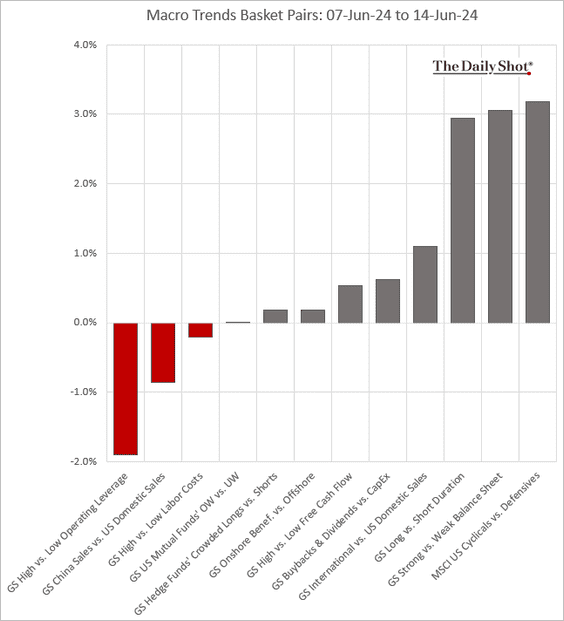
8. Finally, we have some performance data from last week.
• Sectors:
• Equity factors:

• Macro basket pairs’ relative performance:
• Thematic ETFs:

• Largest US tech firms:

Back to Index
Credit:
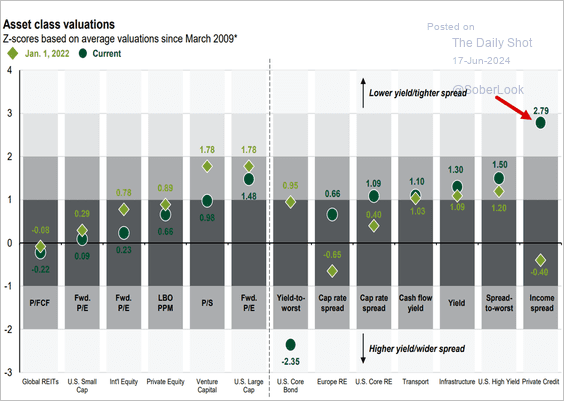
1. Private credit is looking frothy relative to historical levels.
 Source: J.P. Morgan Asset Management
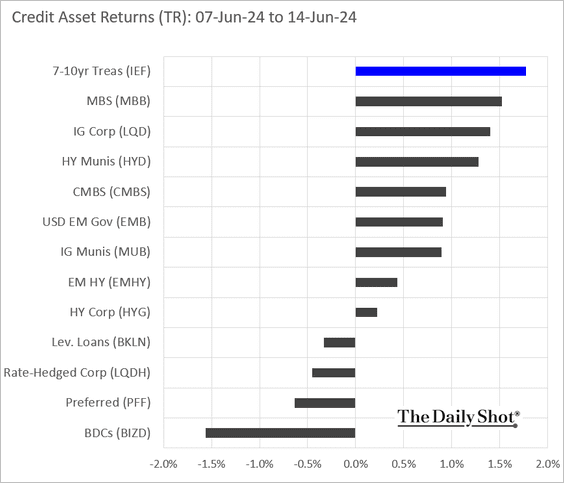
2. Here is last week’s performance across credit asset classes.
Back to Index
Global Developments
1. Rate cuts and improving global economic growth have supported risk-on conditions.
 Source: MRB Partners
2. Here is a look at last week’s performance data.
• Currencies:

• Bond yields:

• Large-cap equities:

——————–
Food for Thought
1. Employment growth by new and existing occupations since 1940:
 Source: Goldman Sachs; @MikeZaccardi
2. Share of web traffic caused by bots:
 Source: Statista
3. Chewy.com sales:
 Source: @chartrdaily
4. Top exports by country in the EU:
 Source: Visual Capitalist Read full article
5. Mexico’s murder rates decline while disappearances increase:
 Source: @financialtimes Read full article
6. The largest armies in the world:
 Source: Visual Capitalist Read full article
7. Father’s Day vs. Mother’s Day spending:
 Source: @TheDailyShot
——————–
Back to Index
