
The Daily Shot: 27-Jun-24
• The United States
• Canada
• The United Kingdom
• The Eurozone
• Japan
• Asia-Pacific
• China
• Emerging Markets
• Energy
• Equities
• Credit
• Rates
• Global Developments
• Food for Thought
The United States
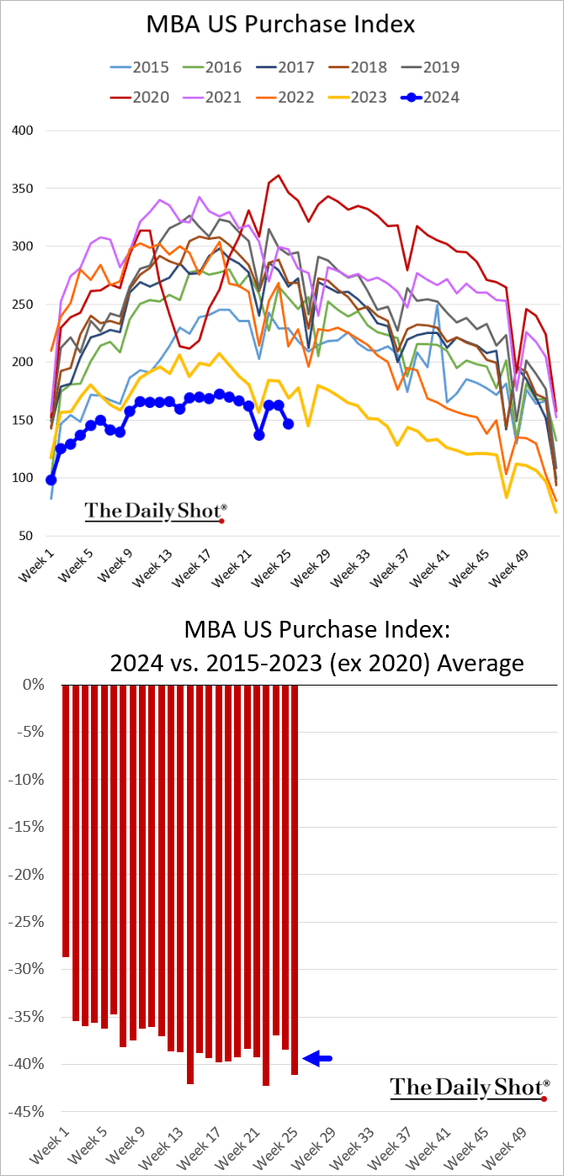
1. Let’s begin with the housing market.
• Mortgage applications softened last week, now running more than 40 % below levels seen in recent years.
Here is the rate lock count.
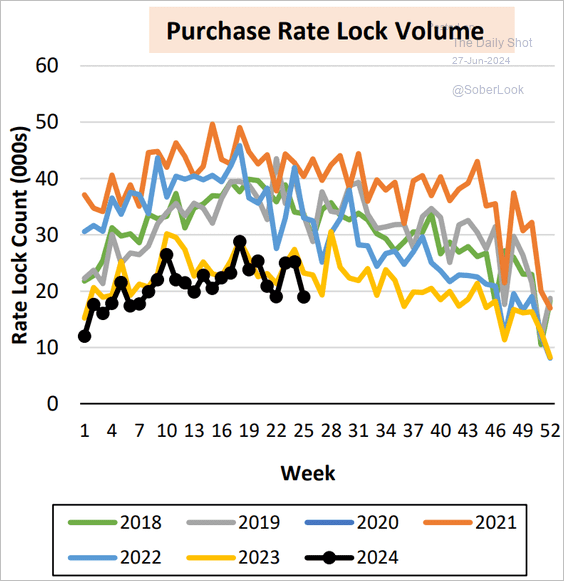 Source: AEI Housing Center
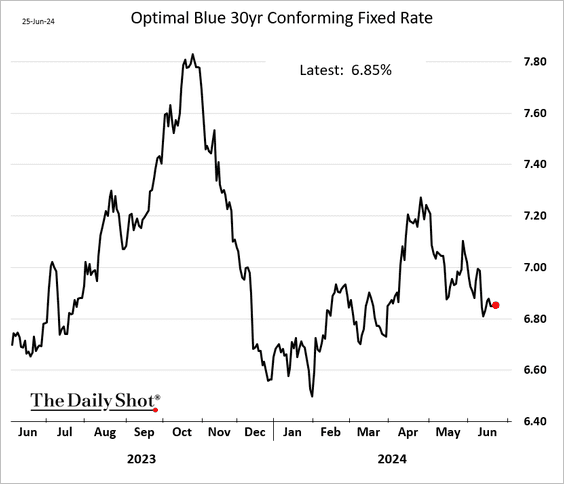
• Mortgage rates have eased significantly since the May highs.
• New listings are running well above last year’s levels.
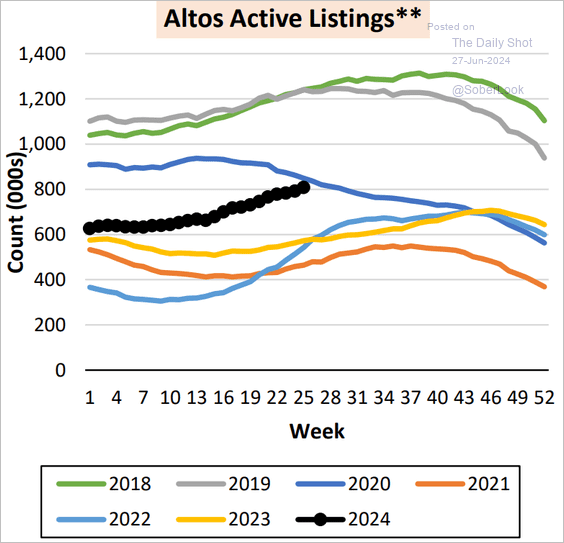 Source: AEI Housing Center
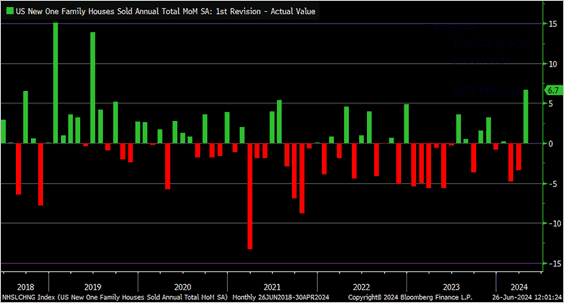
• New home sales were down 16% relative to 2023 levels in May.
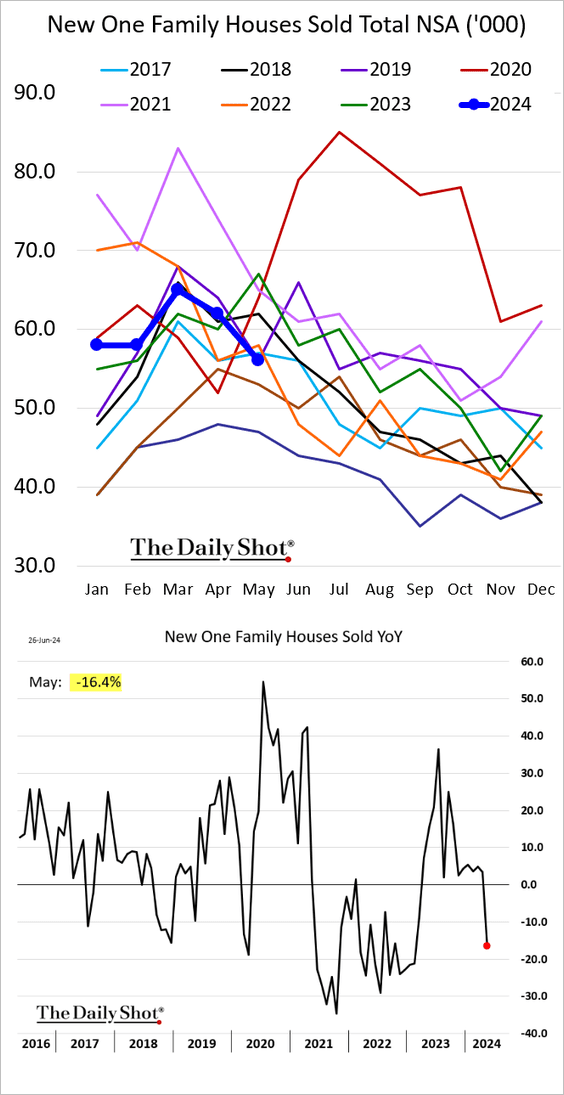
But the April figure was revised sharply higher.
 Source: @KevRGordon
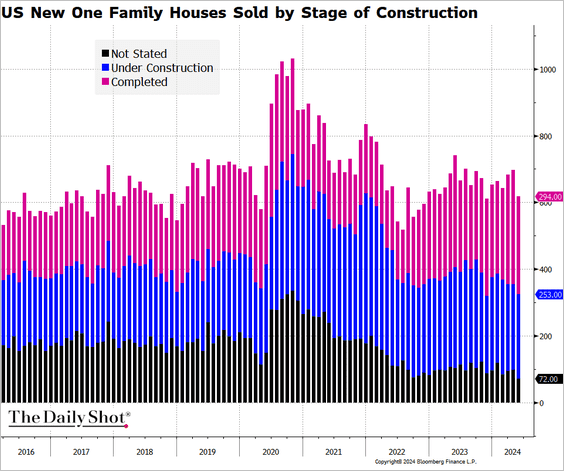
– Pre-sales of new homes (“not started”) are at multi-year lows.
Here are the percentages.
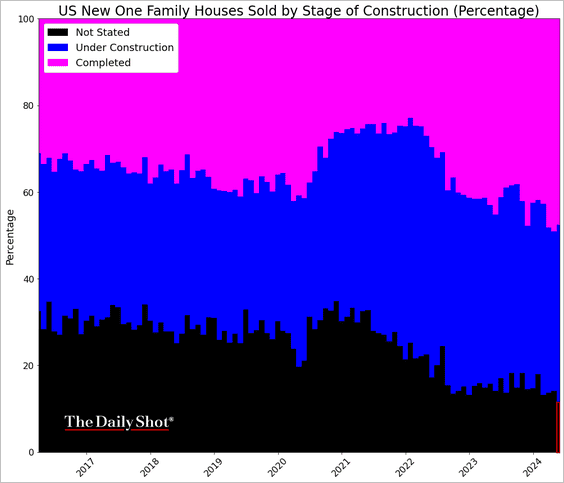
– New home inventories are at their highest levels since the GFC.
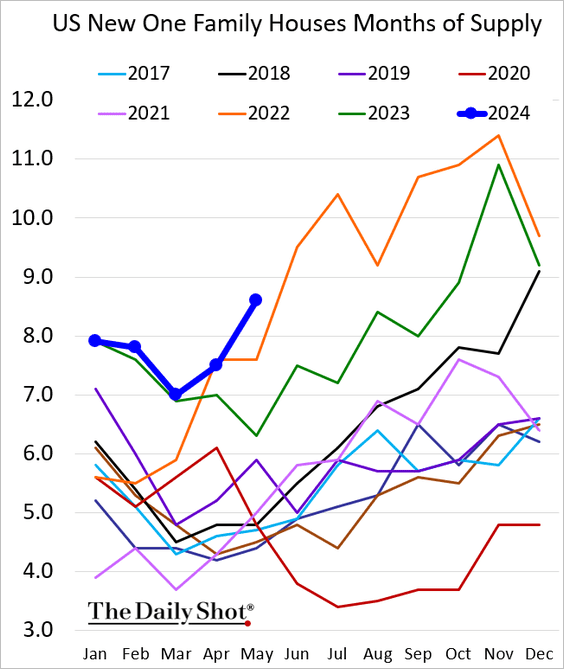
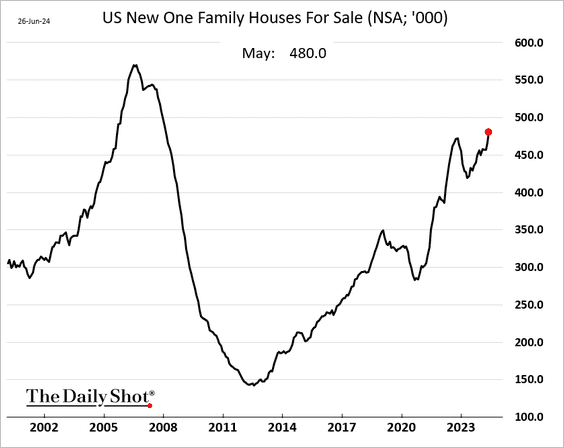
 Source: Reuters Read full article
– The median price of new houses sold is below the 2023 levels.
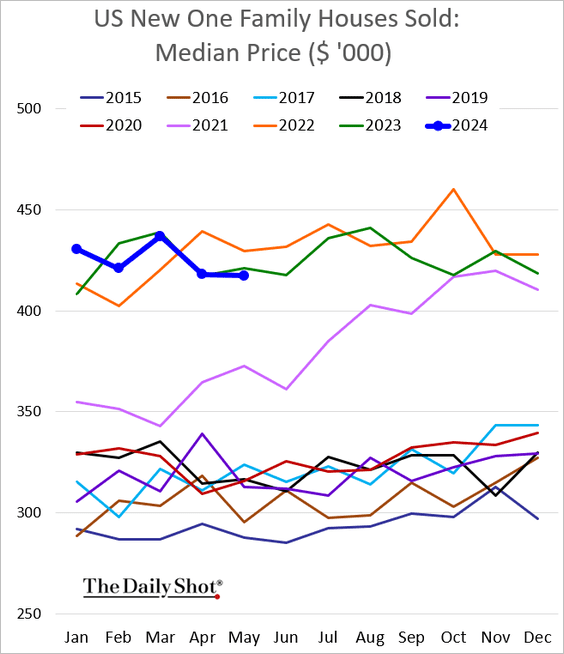
——————–
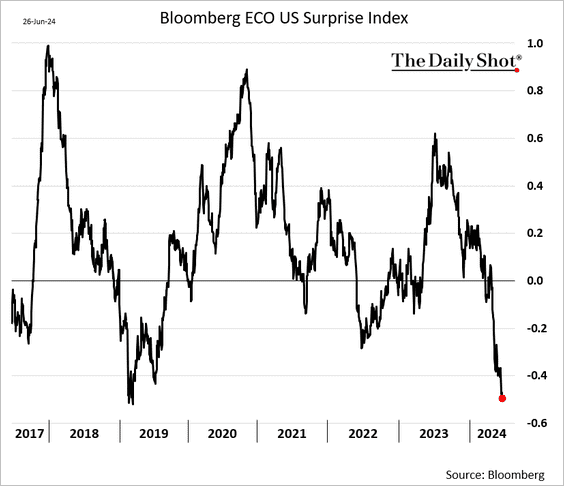
2. US economic reports continue to disappoint on average.
3. The Goldman Sachs Analyst Index, which tracks various business metrics for public companies, points to improving US economic conditions.
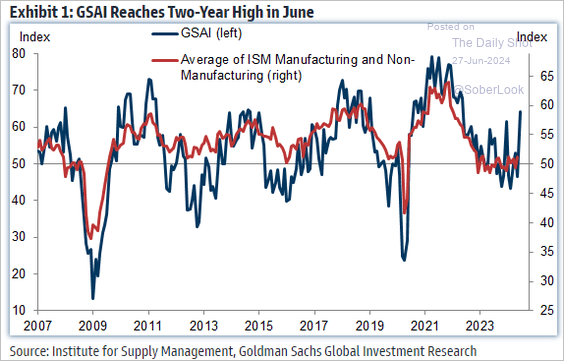 Source: Goldman Sachs; @MikeZaccardi Further reading
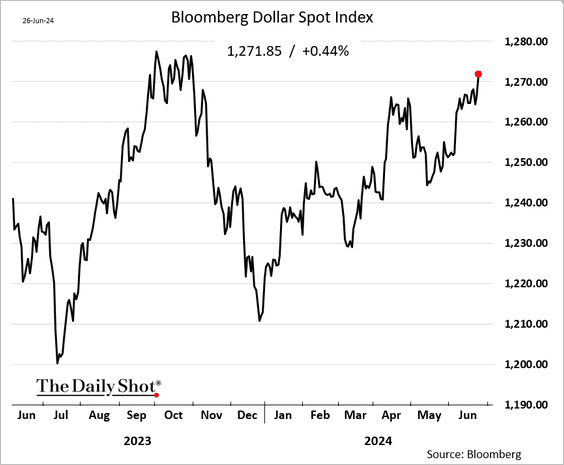
4. The US dollar continues to climb.
• Wells Fargo sees the dollar moving lower next year against other advanced economies.
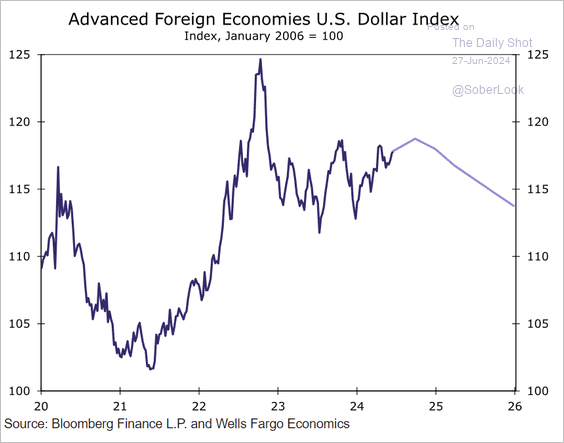 Source: Wells Fargo Securities
Back to Index
Canada
1. The BoC policy is restrictive relative to G7 peers.
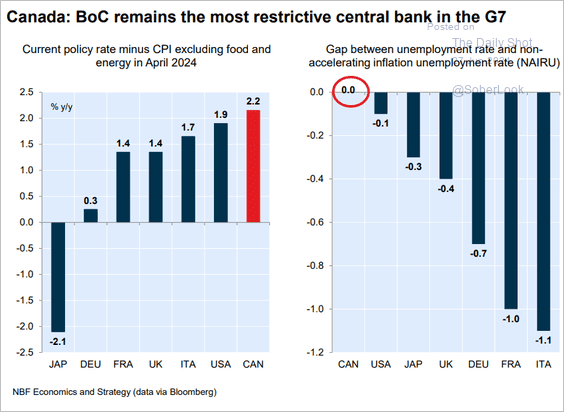 Source: Economics and Strategy Group, National Bank of Canada
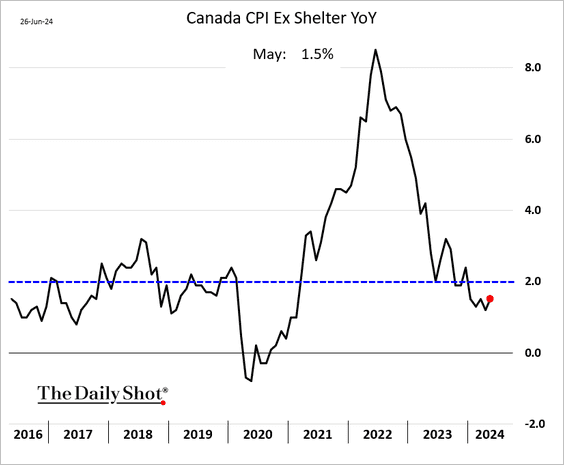
2. Canada’s inflation, excluding shelter, is running below 2%.
Back to Index
The United Kingdom
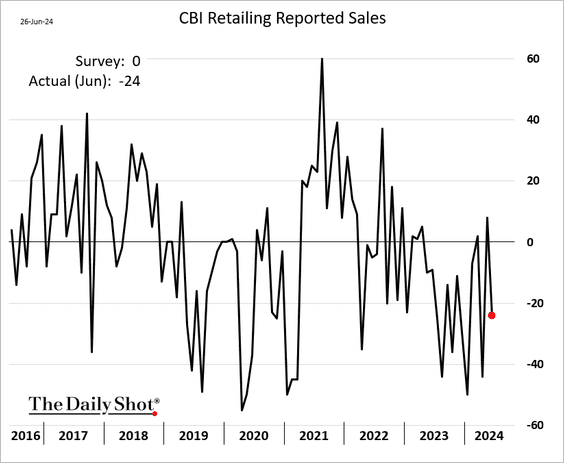
1. Retail sales unexpectedly declined this month.
 Source: Reuters Read full article
——————–
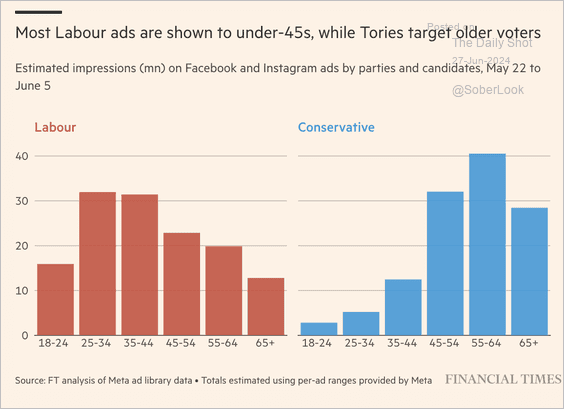
2. This chart shows Facebook and Instagram ad impressions by age group for Labour and Conservative parties.
 Source: @financialtimes Read full article
Back to Index
The Eurozone
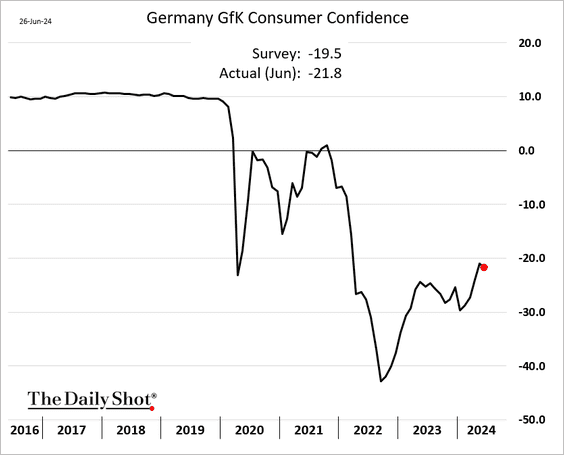
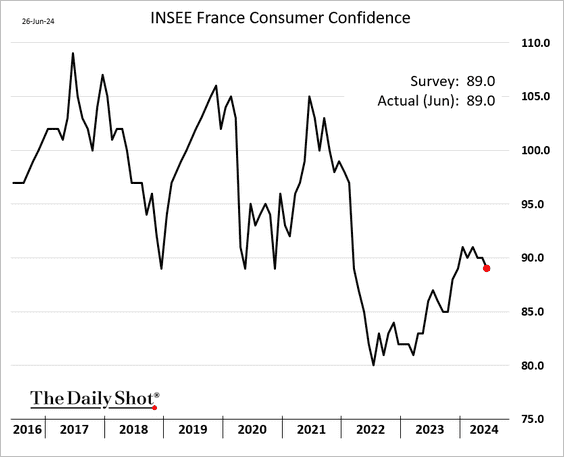
1. Consumer confidence declined in Germany and France this month.
——————–
2. France has one of the highest tax revenues as a share of GDP and one of the highest spending ratios compared to its DM peers.
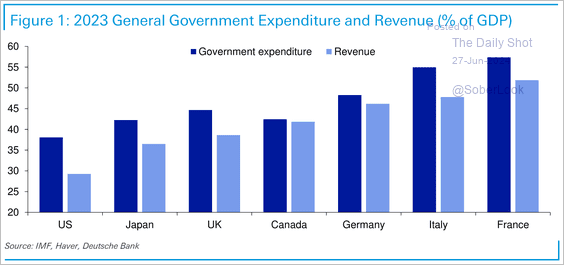 Source: Deutsche Bank Research
• France’s fiscal deficit has chronically exceeded the Maastricht Treaty requirement.
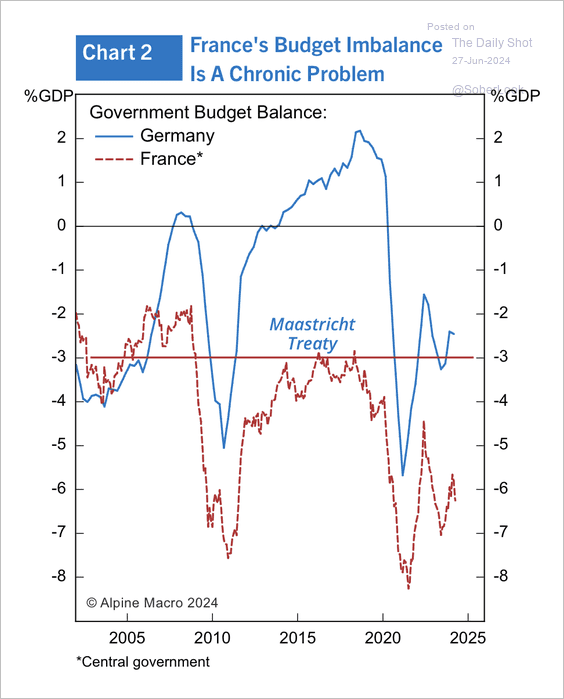 Source: Alpine Macro
Back to Index
Japan
1. Dollar-yen is trading above 160, …
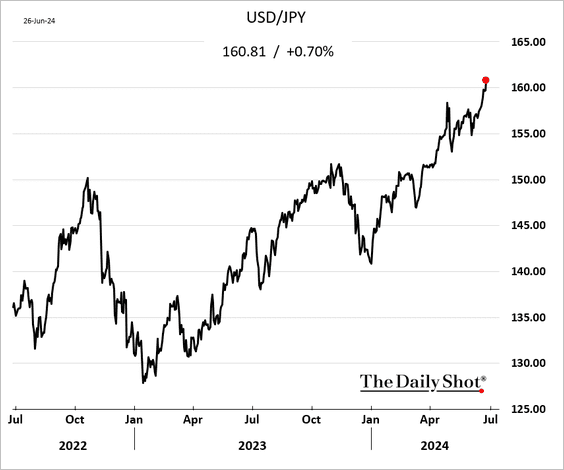
… despite diverging for the rate differential with the US.
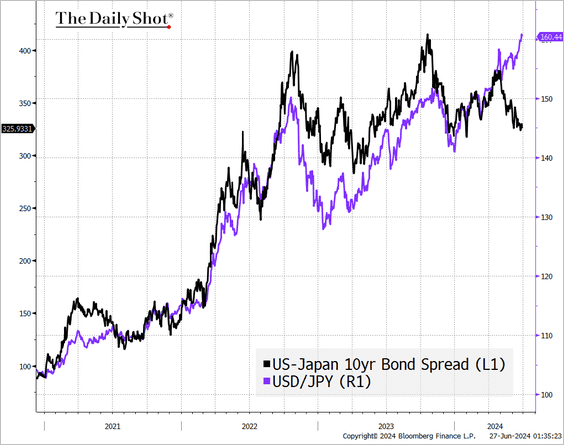
 Source: CNBC Read full article
• Yen weakness has coincided with the Bank of Japan’s quantitative easing.
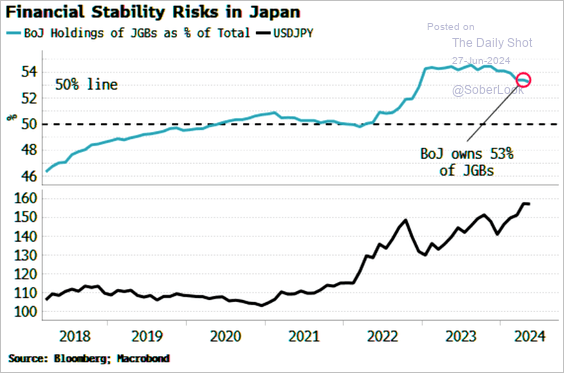 Source: Simon White, Bloomberg Markets Live Blog
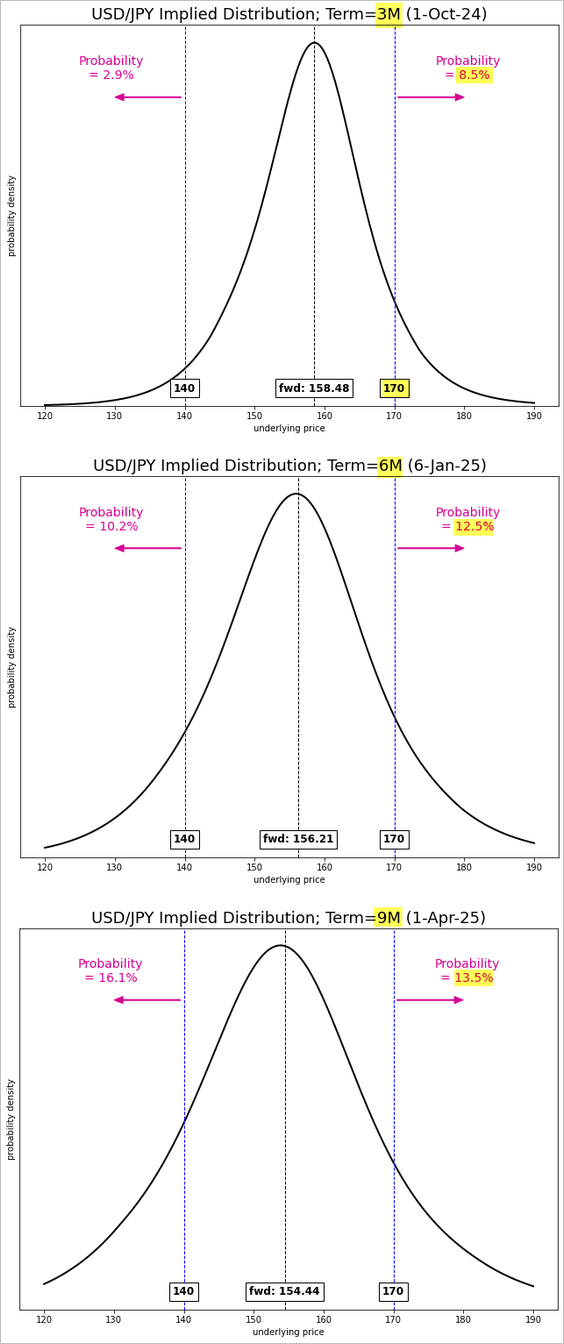
• Could we see USD/JPY at 170? Below are the probabilities of such an outcome 3, 6, and 9 months out as implied by the options markets.
——————–
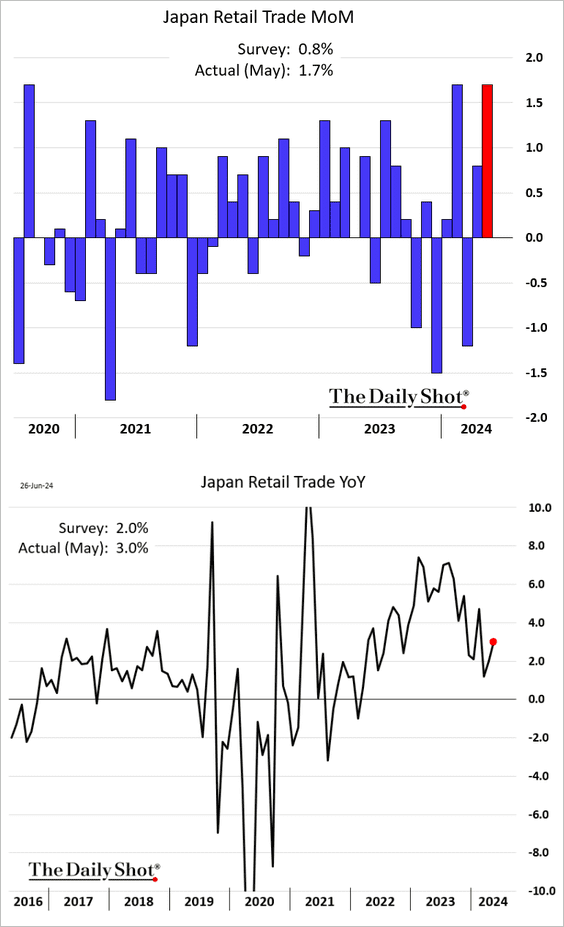
2. Retail sales jumped in May.
Back to Index
Asia-Pacific
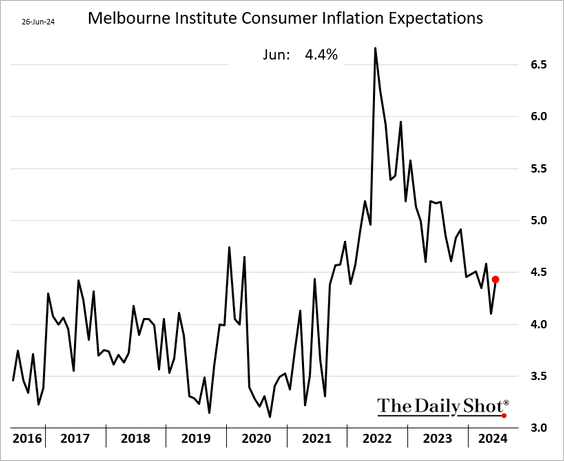
1. Australia’s consumer inflation expectations jumped this month.
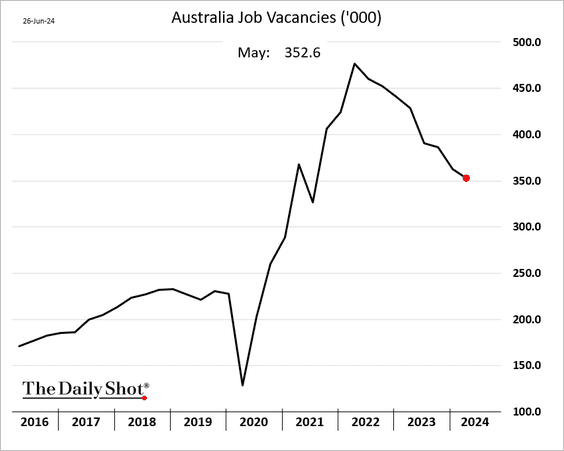
• Job vacancies continue to trend lower.
——————–
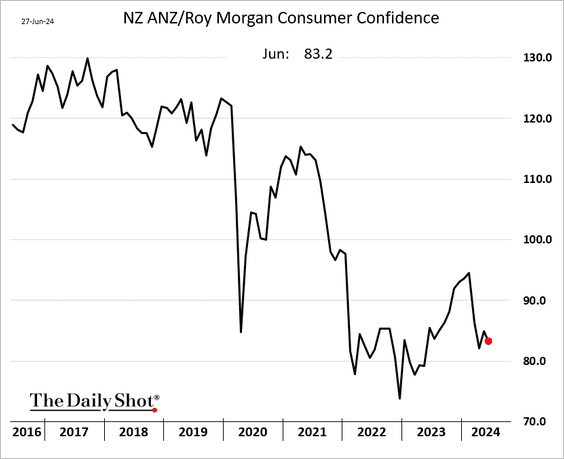
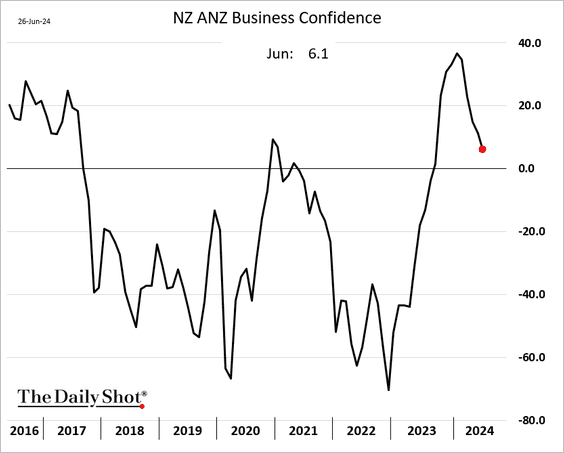
2. New Zealand’s consumer and business confidence indicators are lower this month.
Back to Index
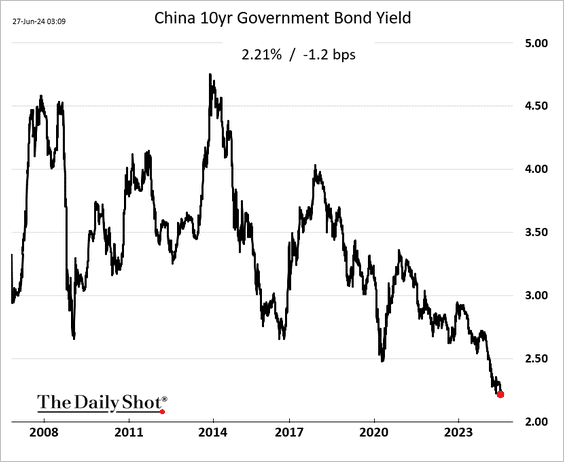
China
1. Bond yields continue to sink.
2. Forward earnings remain in a downtrend.
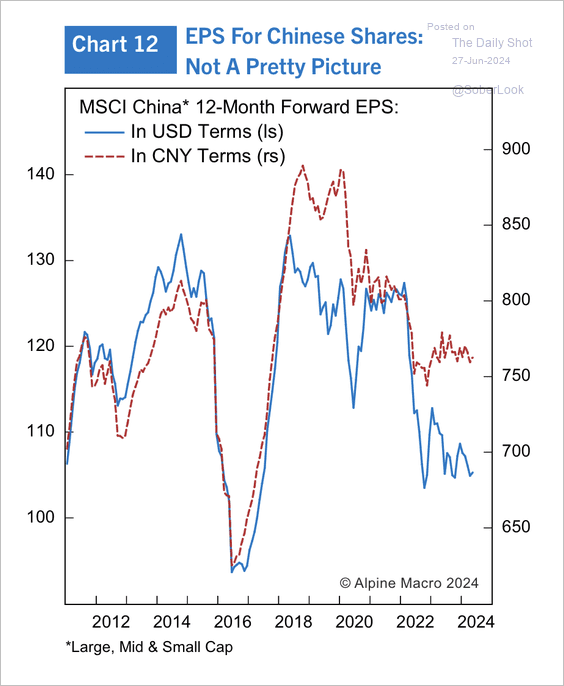 Source: Alpine Macro
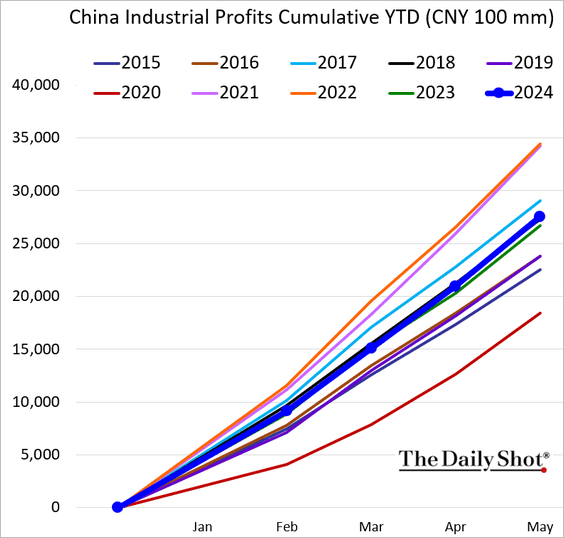
3. Industrial profits are running slightly above 2023 levels year-to-date.
Back to Index
Emerging Markets
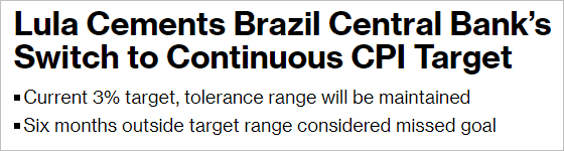
1. Brazil’s May budget deficit was wider than expected.
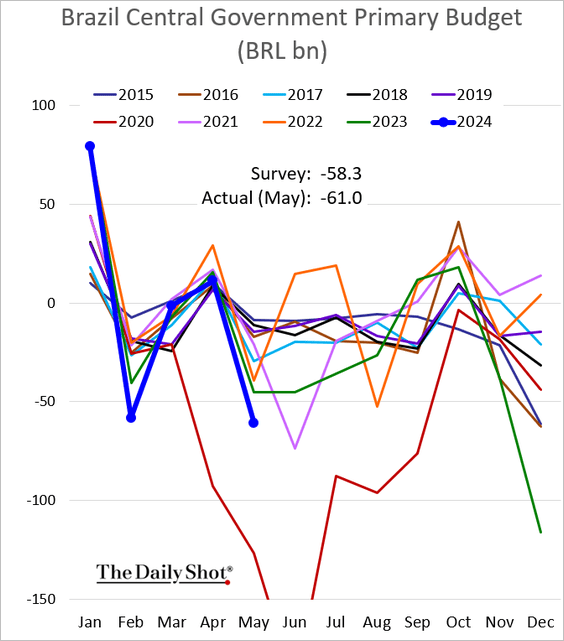
Separately, Brazil is making changes to its inflation targeting to reduce political pressure on the central bank.
 Source: @economics Read full article
——————–
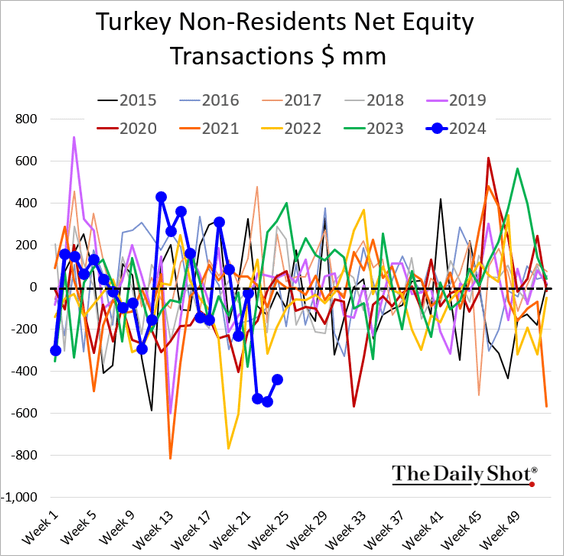
2. Foreign investors have been buying Turkish domestic bonds, …
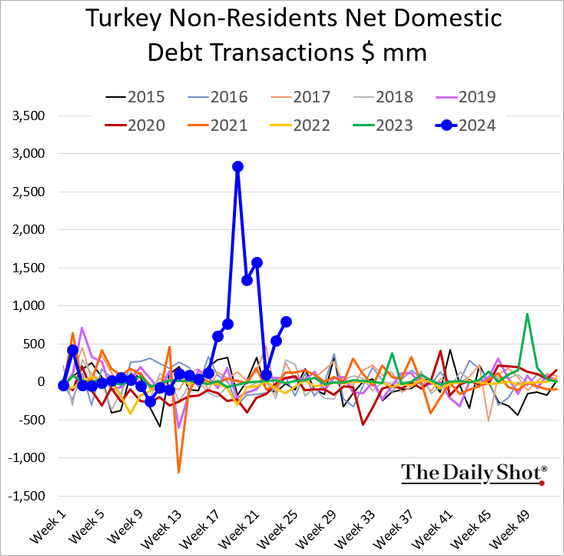
… but they continue to sell the nation’s stocks.
——————–
3. Funds are boosting bets on Indian stocks.
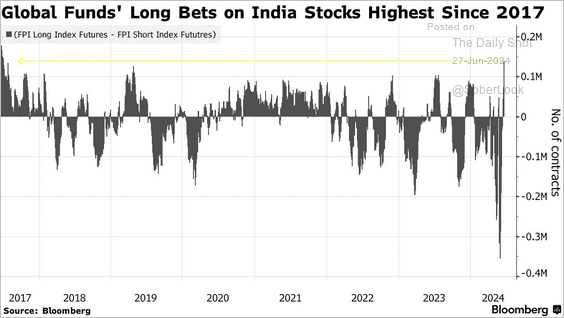 Source: @markets Read full article
4. Correlation among EM equity markets continues to trend lower.
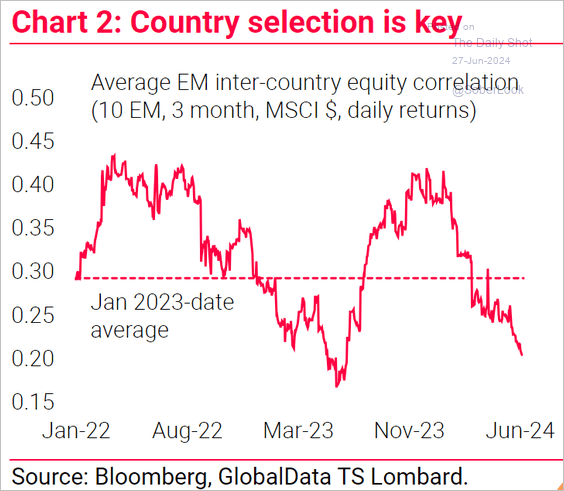 Source: TS Lombard
Back to Index
Energy
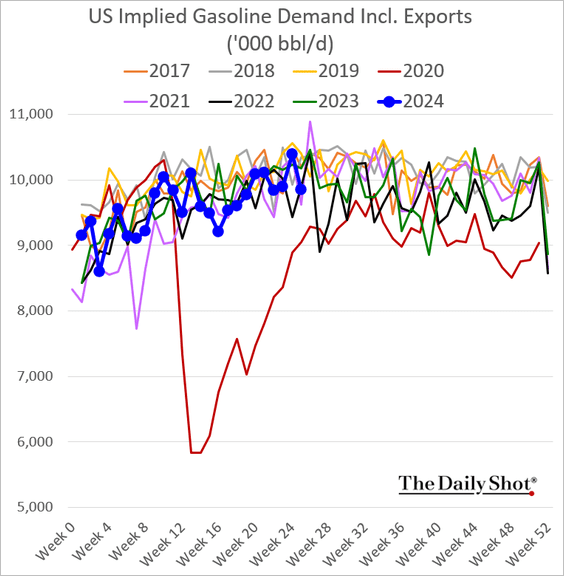
1. Last week’s US inventory report was bearish, as crude oil and gasoline inventories unexpectedly increased.
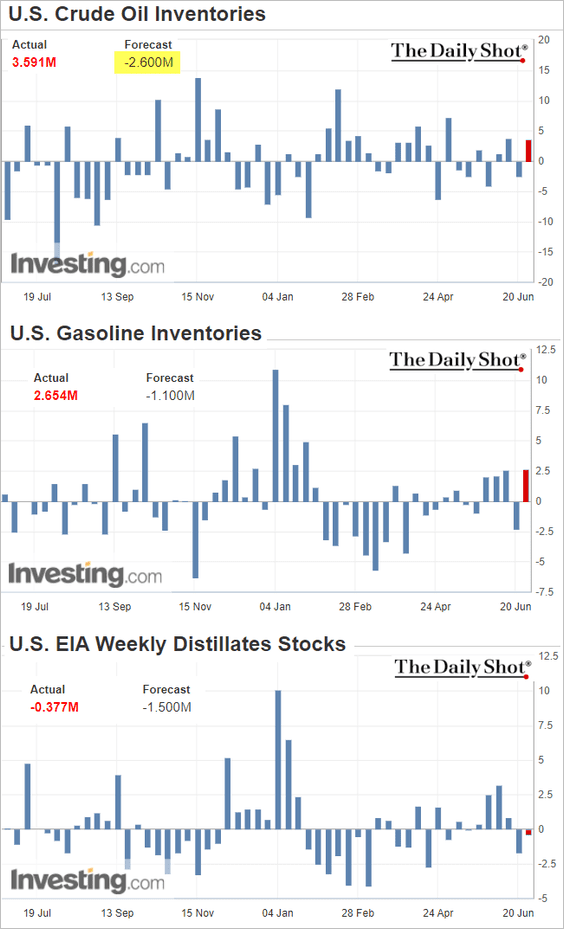
 Source: Reuters Read full article
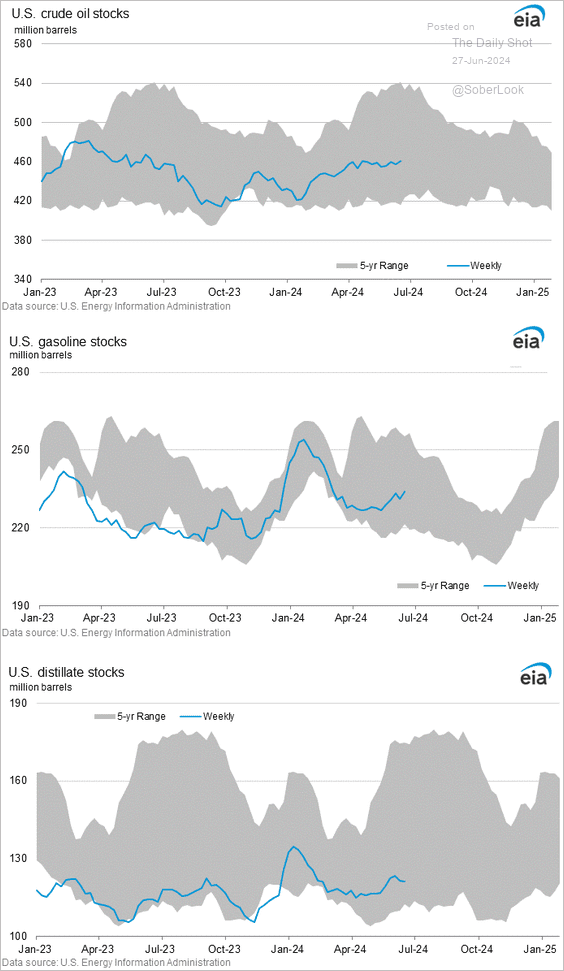
– Here are the inventory levels.
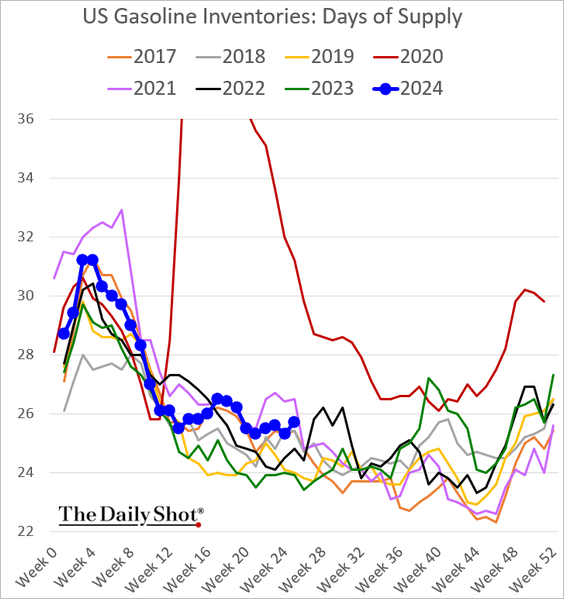
– This chart shows gasoline inventories measured in days of supply.
• Gasoline demand softened.
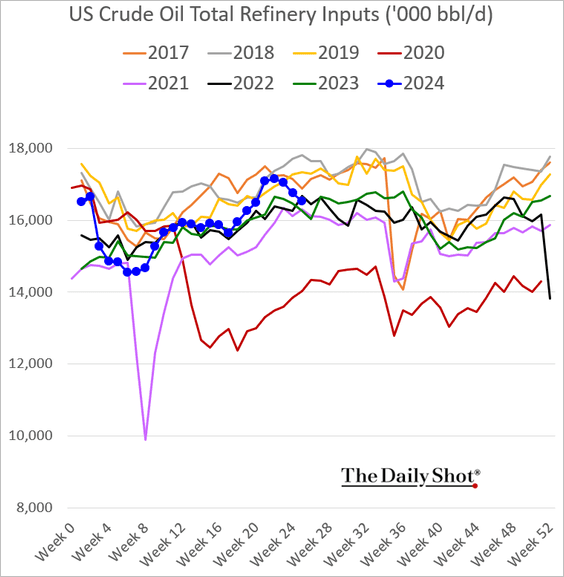
• US refinery runs continue to moderate following the pre-Memorial Day surge.
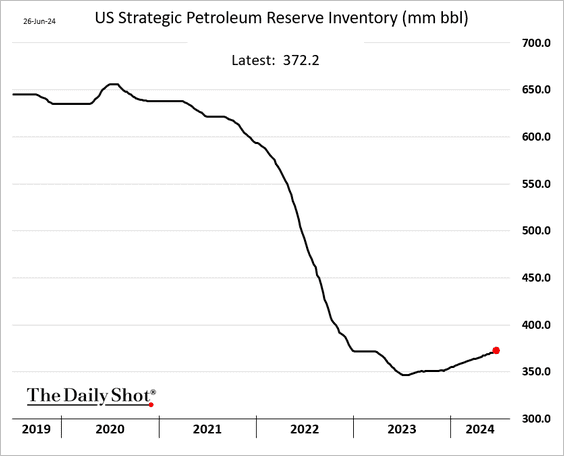
• The Strategic Petroleum Reserve inventory continues to trend higher.
——————–
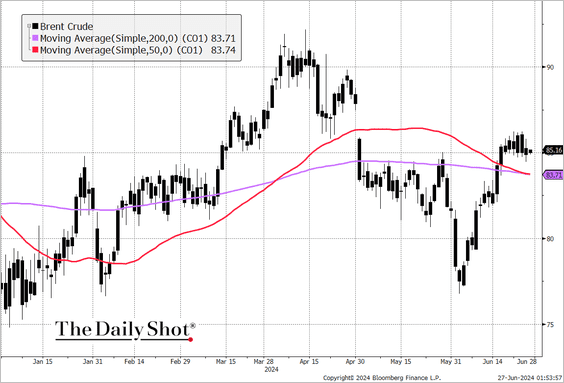
2. Brent crude formed a death cross.
 Source: @TheTerminal, Bloomberg Finance L.P.
3. China’s weak credit expansion has been a headwind for crude oil demand.
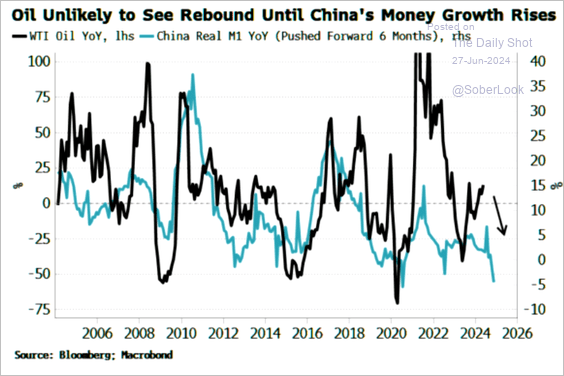 Source: Simon White, Bloomberg Markets Live Blog
4. Funds’ exposure to energy shares relative to the S&P 500 have been trending lower.
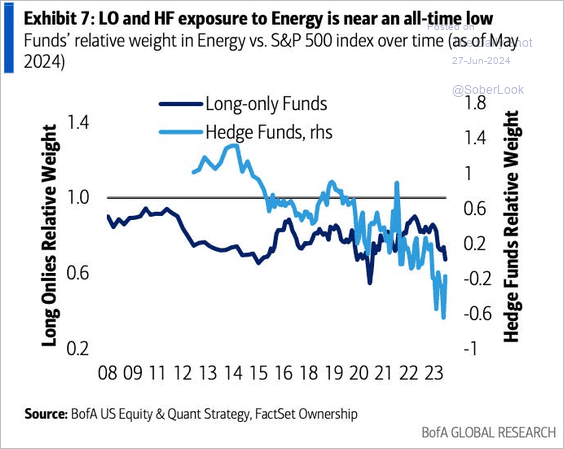 Source: BofA Global Research; @dailychartbook
Back to Index
Equities
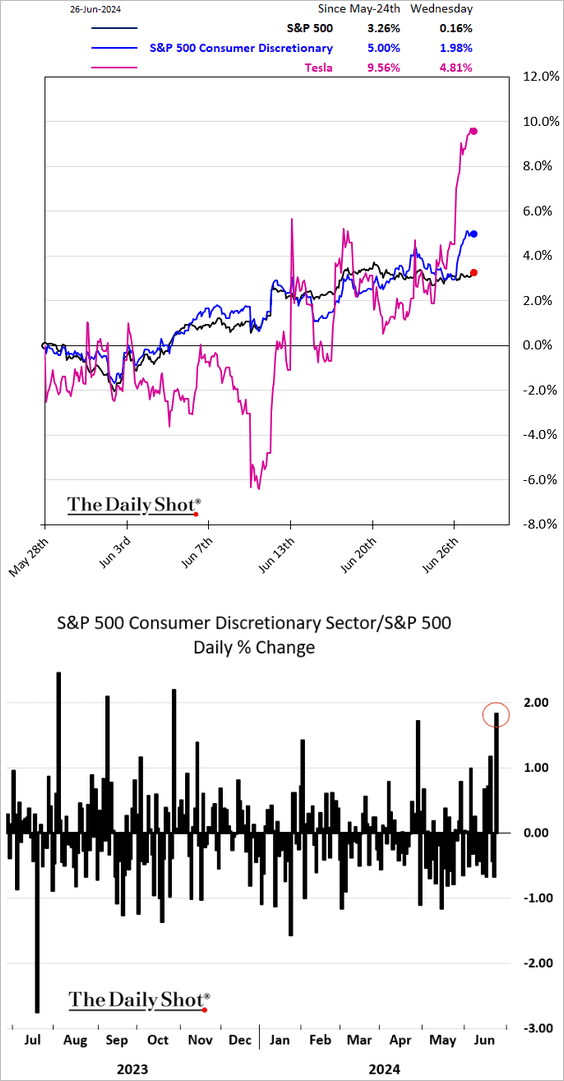
1. Wednesday was a good day for the consumer discretionary sector, which received a boost from Tesla and Amazon.
2. The S&P 500 price and breadth have been moving in opposite direction recently.
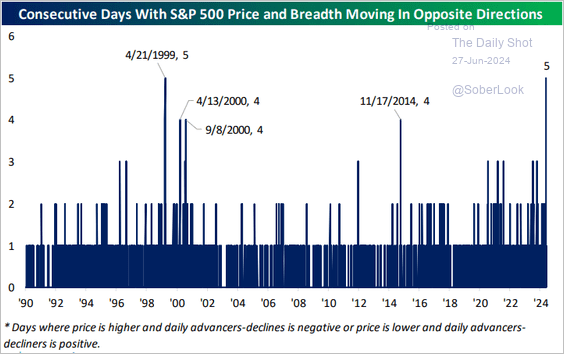 Source: @bespokeinvest Read full article
3. Most of the S&P 500’s real return this year has been driven by strong earnings growth.
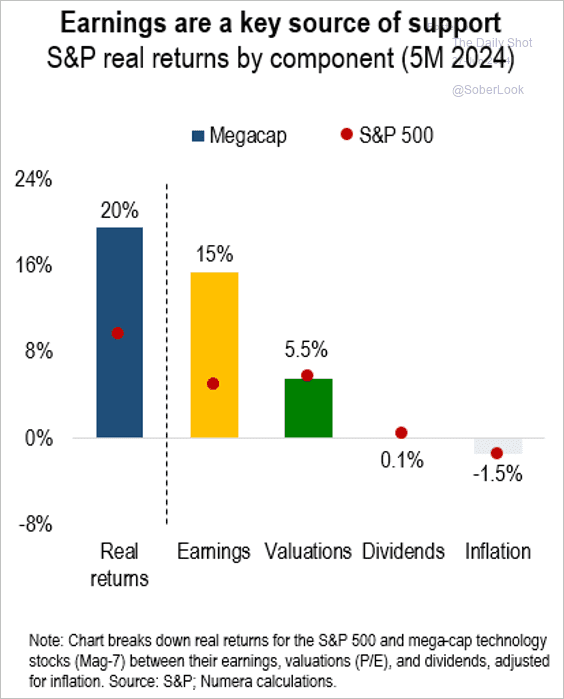 Source: Numera Analytics (@NumeraAnalytics)
4. Global IPO activity picked up this year.
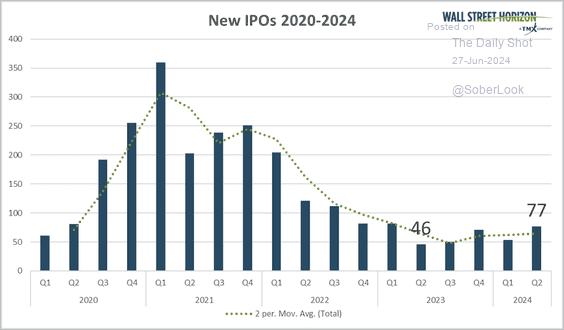 Source: @WallStHorizon
5. So far, the S&P 500 has benefited from easier financial conditions. There is a risk that a stagflation scenario could tighten financial conditions, thereby stalling the equity rally, according to Stifel.
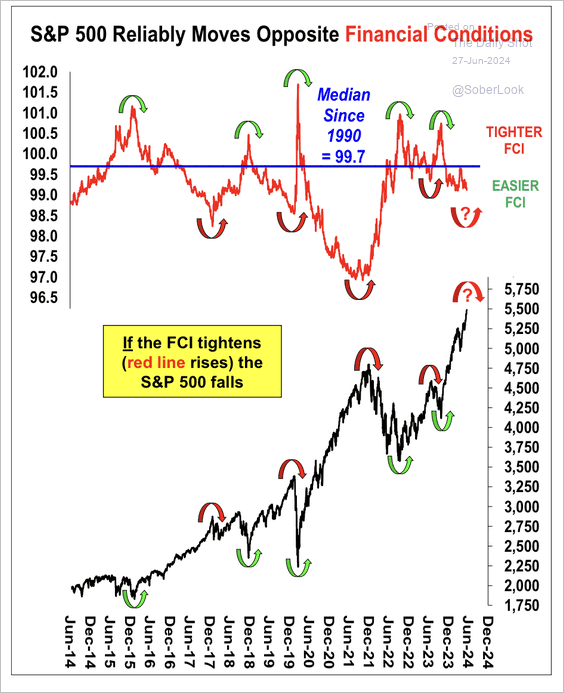 Source: Stifel
6. This chart shows the share of US equity market capitalization relative to the global market cap.
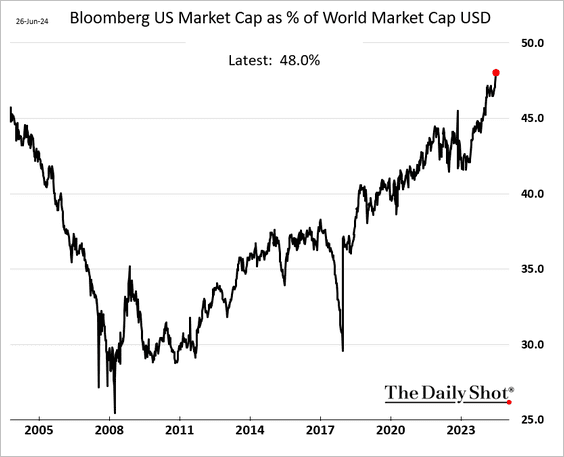 h/t @KevRGordon
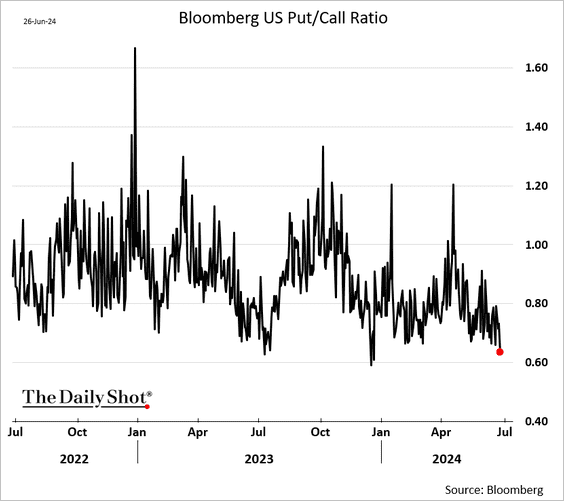
7. The US put/call ratio is at the lowest level of the year.
8. This chart displays the S&P 500 bull markets’ annualized returns, categorized by the bull market duration decile.
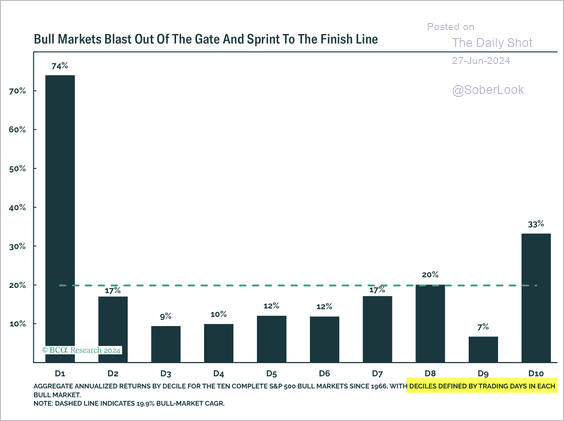 Source: BCA Research
Back to Index
Credit
1. Leveraged loan repricing surged this year.
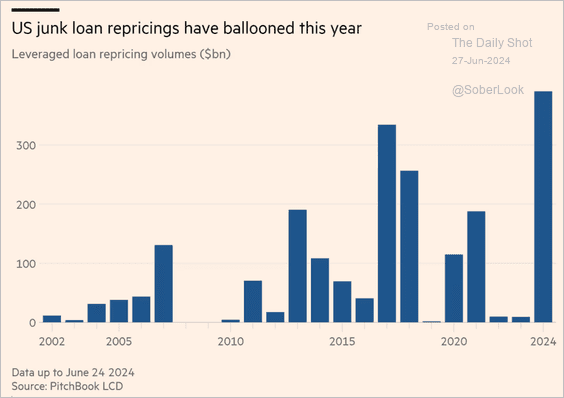 Source: @financialtimes Read full article
2. US debt-to-equity ratios have been trending lower.
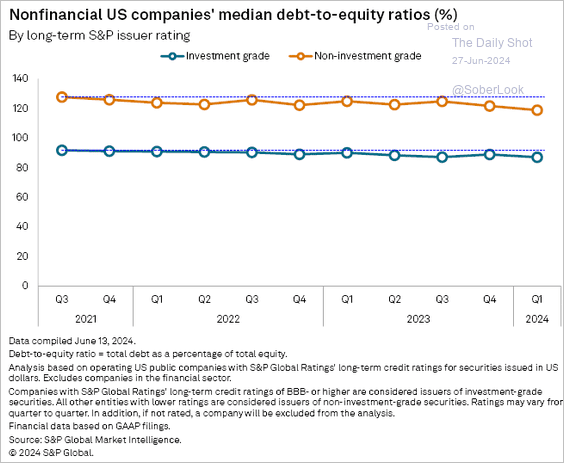 Source: S&P Global Market Intelligence
But interest coverage is deteriorating,
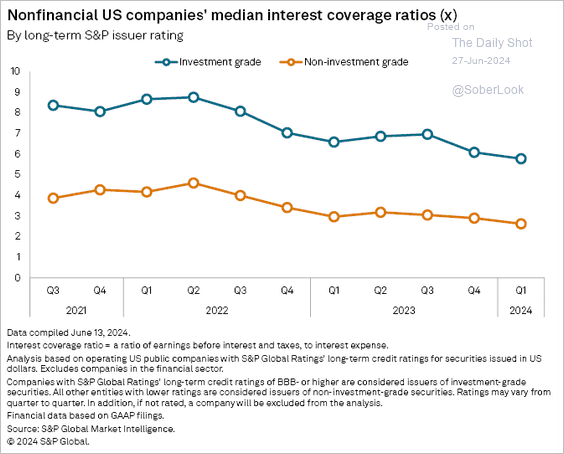 Source: S&P Global Market Intelligence
——————–
3. Here is a look at US metro areas’ vacancy rates by property type.
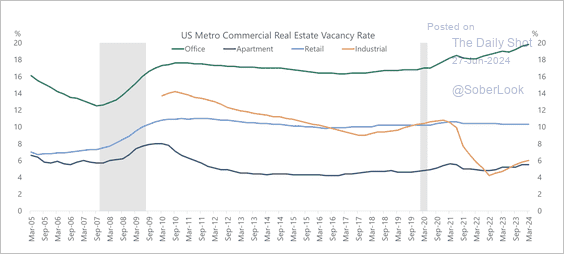 Source: Torsten Slok, Apollo
Back to Index
Rates
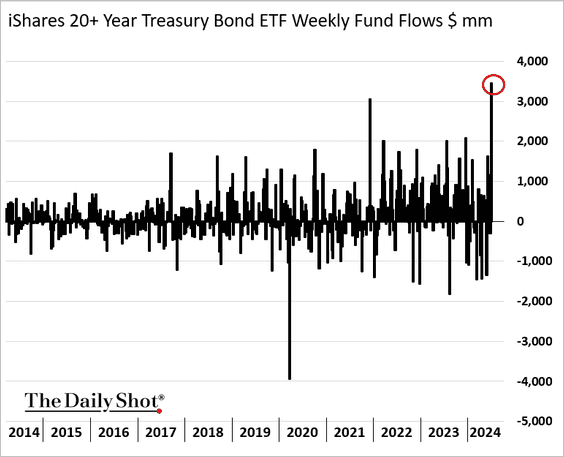
1. Flows into TLT (long-duration Treasury ETF) surged this week.
2. Bloomberg’s indicator of Treasury liquidity continues to show deterioration. A contributing factor to this trend is the presence of very old vintage bonds, which are now trading well outside the current yield curve levels.
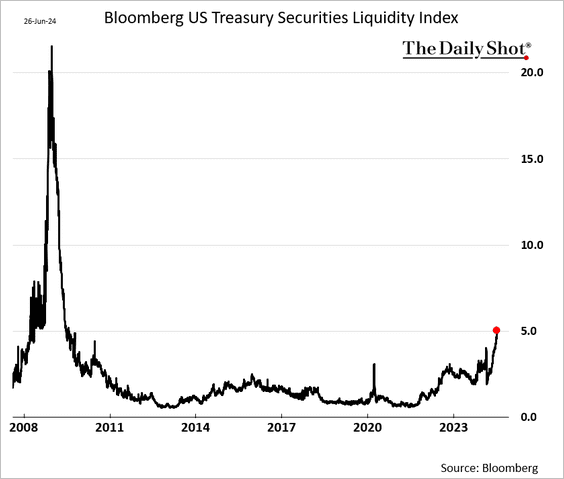 Further reading
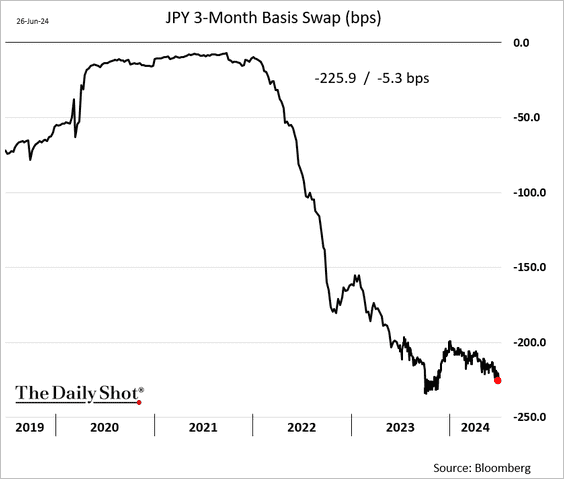
3. Treasury yields hedged into euros vs. yen have diverged sharply, …
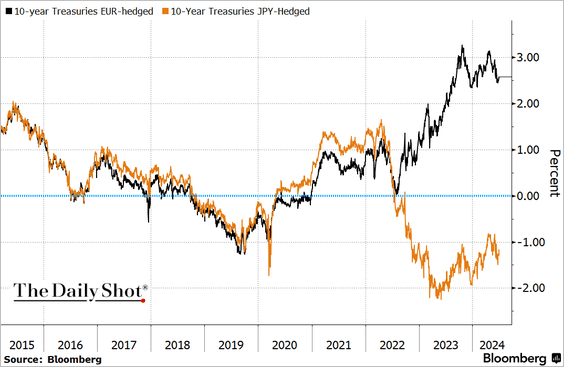 Source: @TheTerminal, Bloomberg Finance L.P.
… as the USD/JPY basis spread moved deeper into negative territory.
Back to Index
Global Developments
1. Global economic reports have been surprising to the downside.
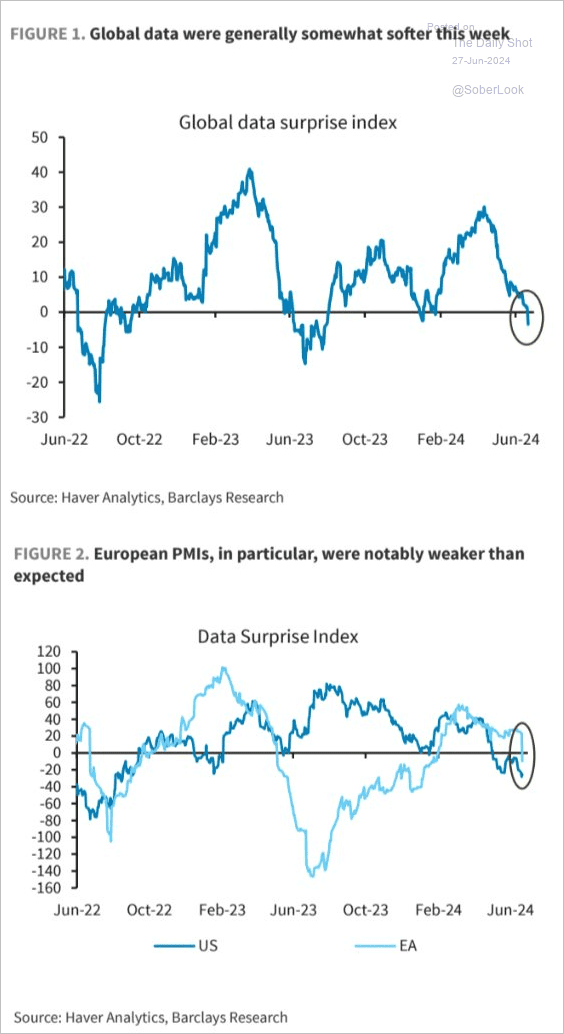 Source: Barclays Research; @WallStJesus
2. Here is a look at the GDP per capita in selected economies.
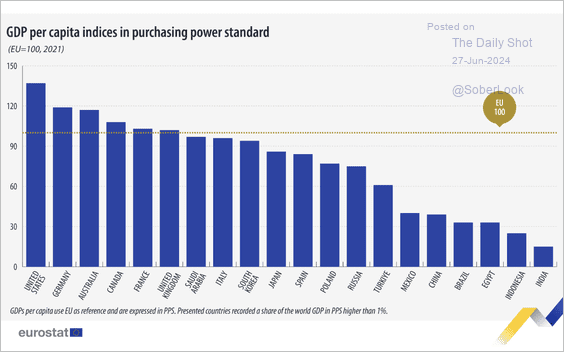 Source: Eurostat Read full article
3. Global M&A activity has been slowing.
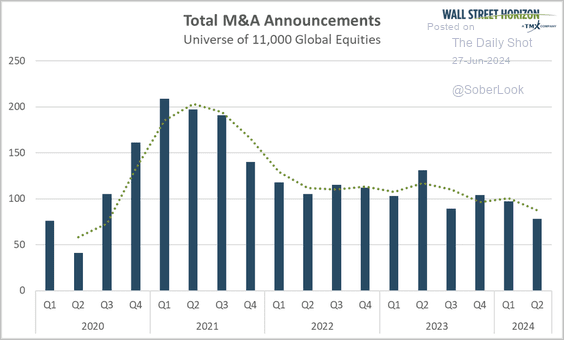 Source: @WallStHorizon
——————–
Food for Thought
1. Dwellings per thousand inhabitants in selected countries in 2022 compared to 2011:
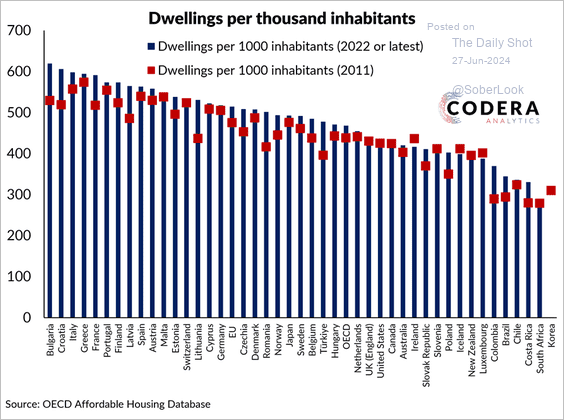 Source: Codera Analytics
2. Impact of in-store anti-theft measures on shopping convenience by age group:
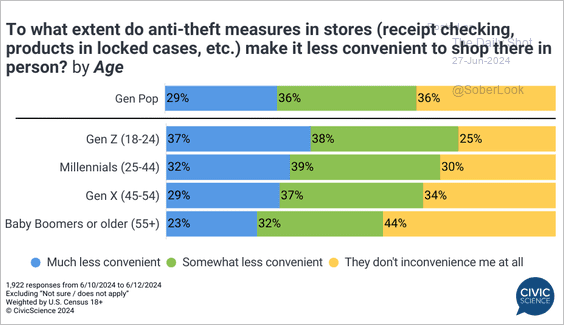 Source: @CivicScience
3. The most popular online banking services providers in the US:
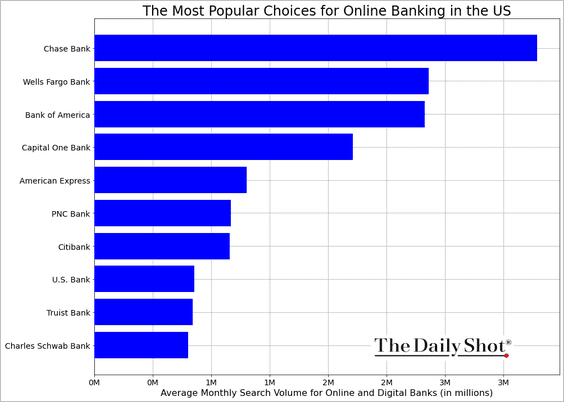 Source: Vention
4. Median age of the world’s “oldest” and “youngest” countries:
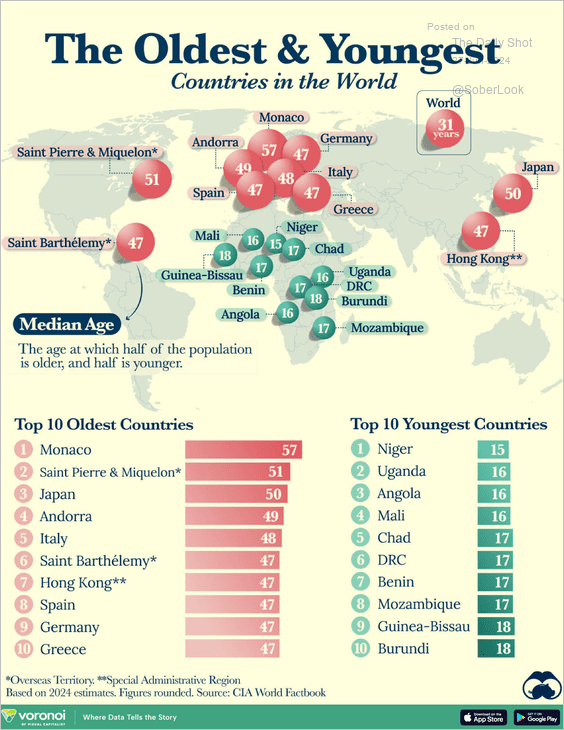 Source: Visual Capitalist Read full article
5. Satellite data on damaged buildings in Ukraine:
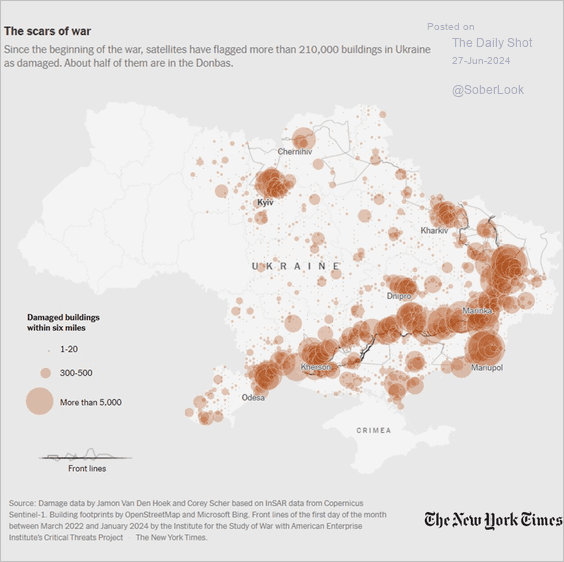 Source: The New York Times Read full article
6. Demographics of Americans suffering from anxiety and depression:
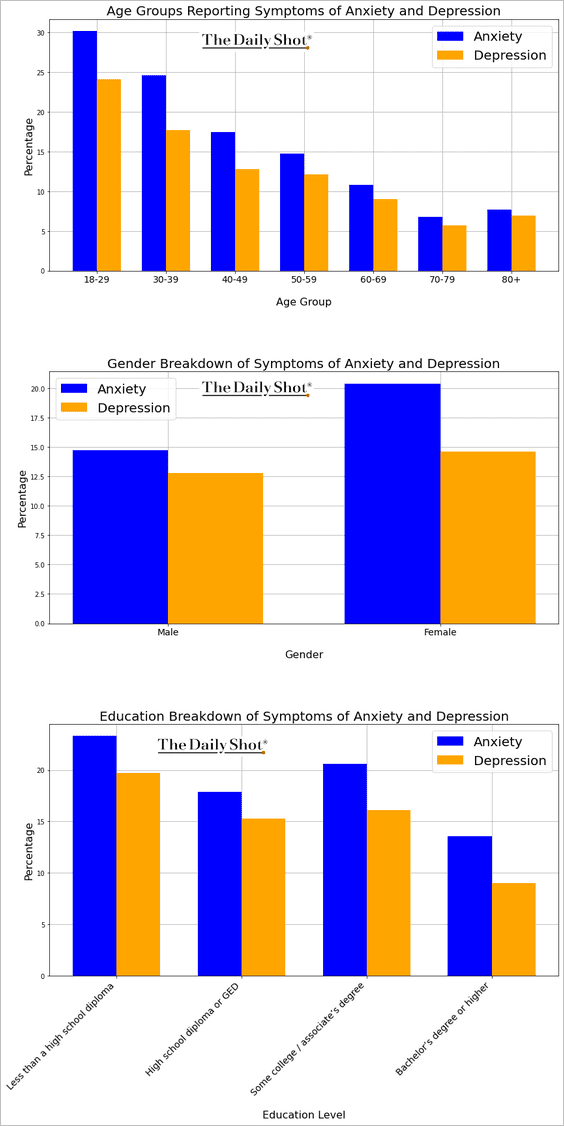 Source: The Dawn Rehab Thailand
7. Production and prices of ice cream in the US:
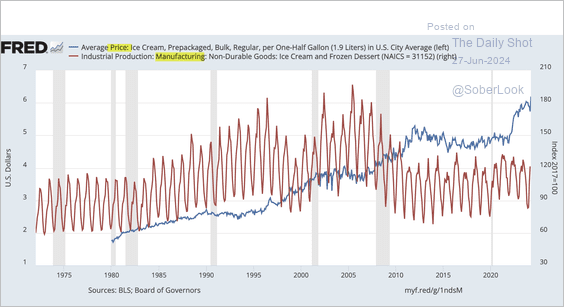 Source: Federal Reserve Bank of St. Louis Read full article
——————–
Back to Index