
The Daily Shot: 01-Jul-24
• The United States
• Canada
• The United Kingdom
• The Eurozone
• Japan
• Asia-Pacific
• China
• Emerging Markets
• Commodities
• Equities
• Credit
• Rates
• Global Developments
• Food for Thought
The United States
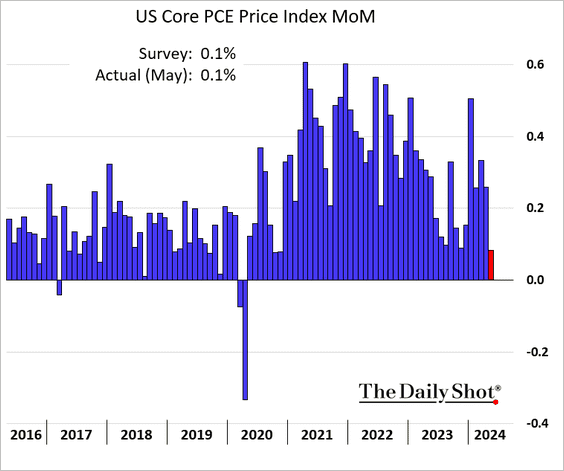
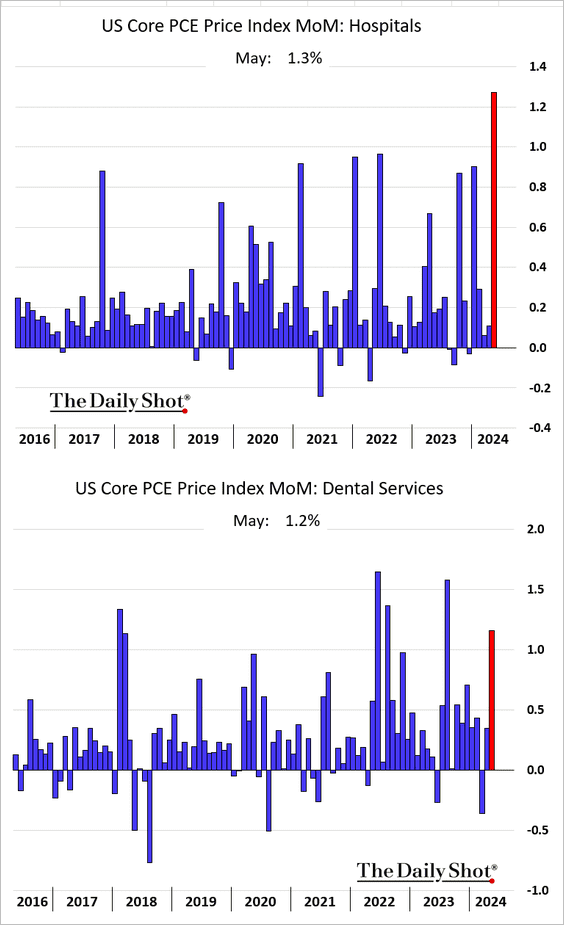
1. The core PCE inflation measure slowed sharply in May.
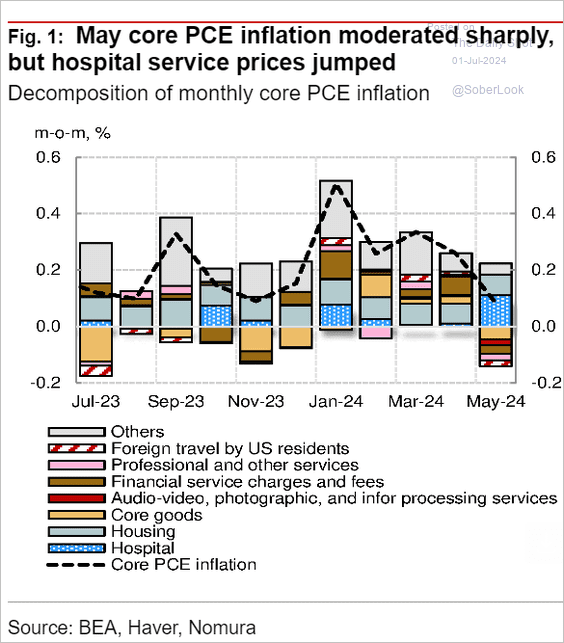 Source: Nomura Securities
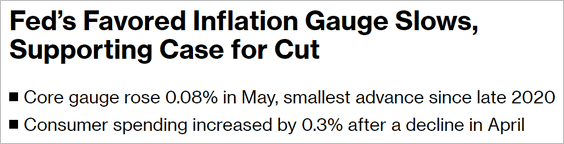 Source: @economics Read full article
• The supercore PCE inflation gains were mostly driven by medical services.
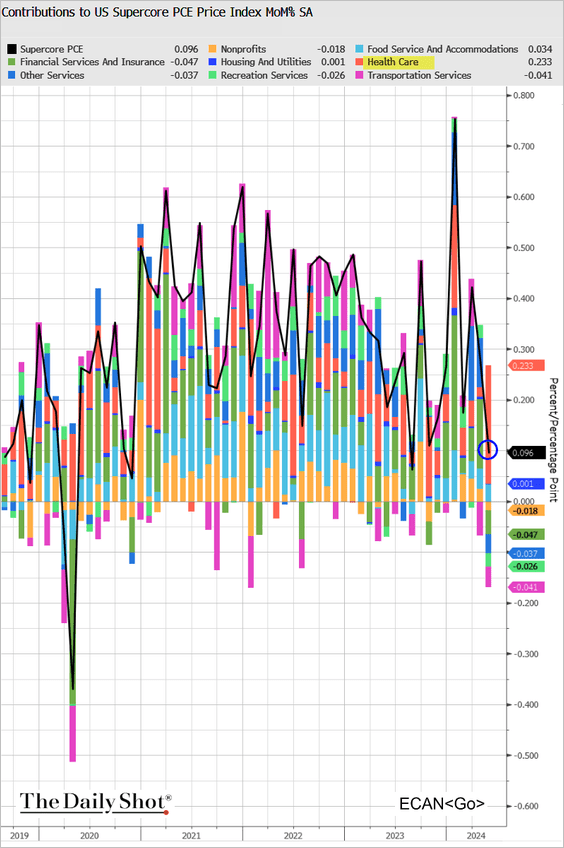 Source: @TheTerminal, Bloomberg Finance L.P.
——————–
2. Consumer spending increased in May, …
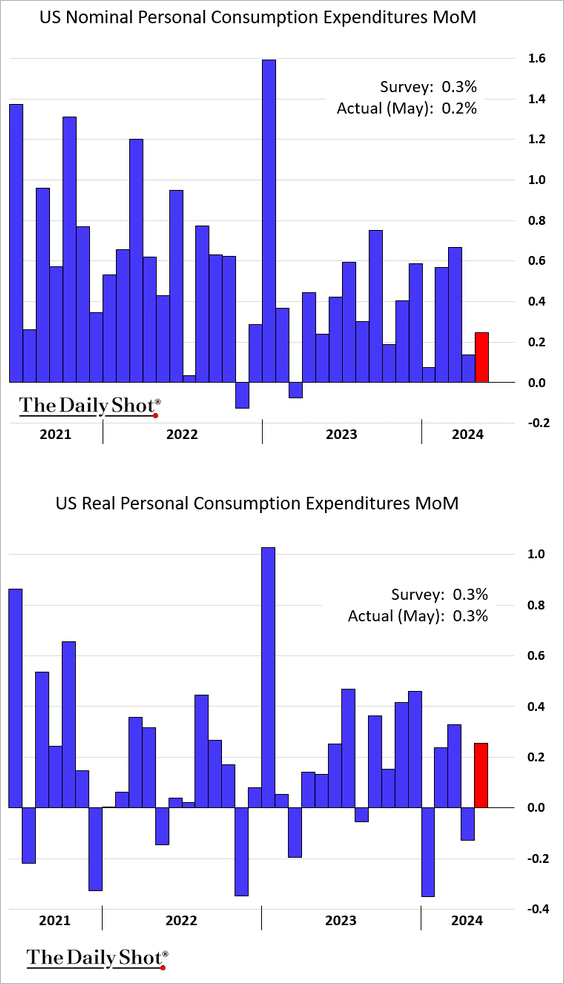
… but the index saw a meaningful downward revision.
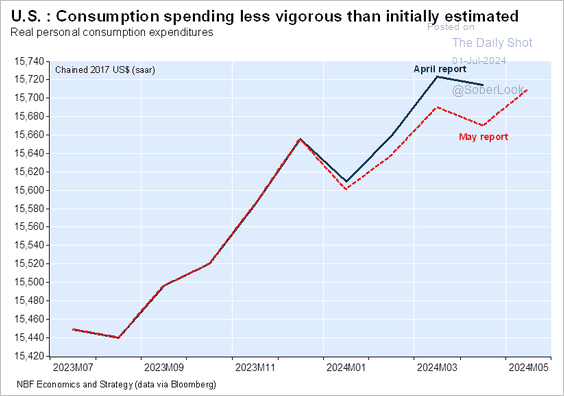 Source: Economics and Strategy Group, National Bank of Canada
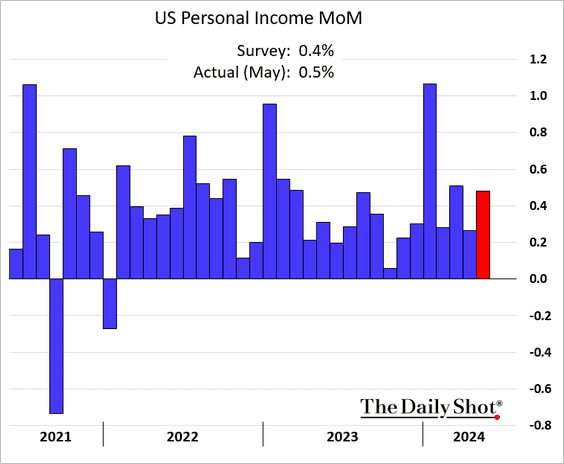
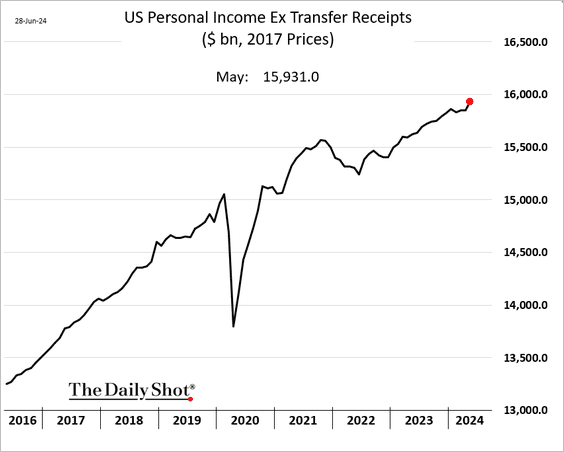
• Personal income improved.
• Here is the data on real personal income, excluding government checks.
• This chart displays the trends in real disposable personal income and consumer spending.
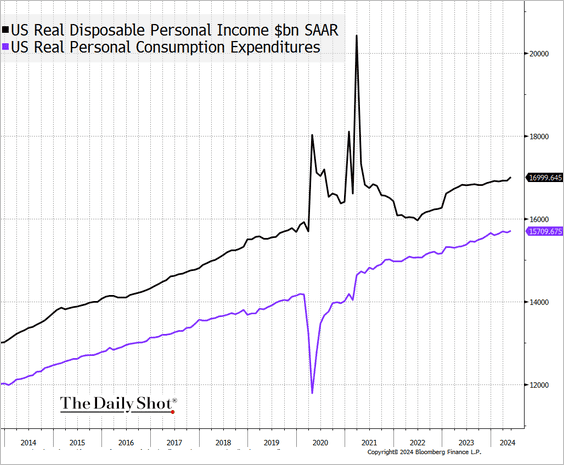 Source: @TheTerminal, Bloomberg Finance L.P.
• Below is consumer spending on goods and services.
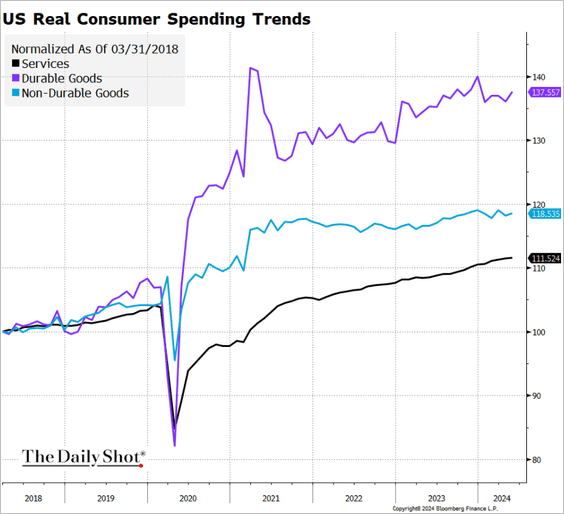 Source: @TheTerminal, Bloomberg Finance L.P.
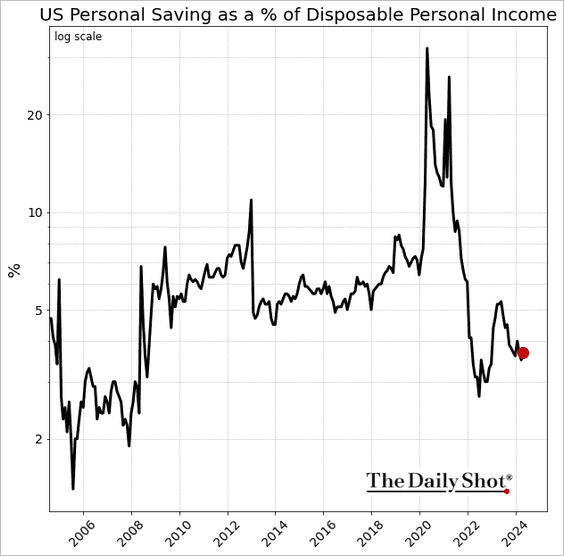
• Next, we have household savings as a share of disposable personal income (log scale).
——————–
3. The Atlanta Fed’s GDPNow estimate for Q2 GDP growth has shifted significantly lower due to softer consumer spending, as shown in the second chart below for PCE goods and PCE services.
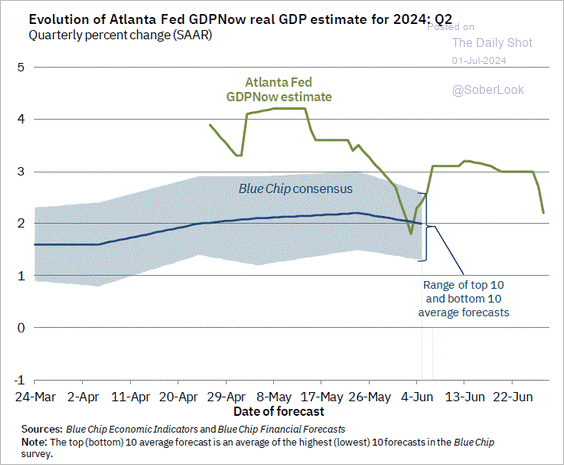 Source: Federal Reserve Bank of Atlanta
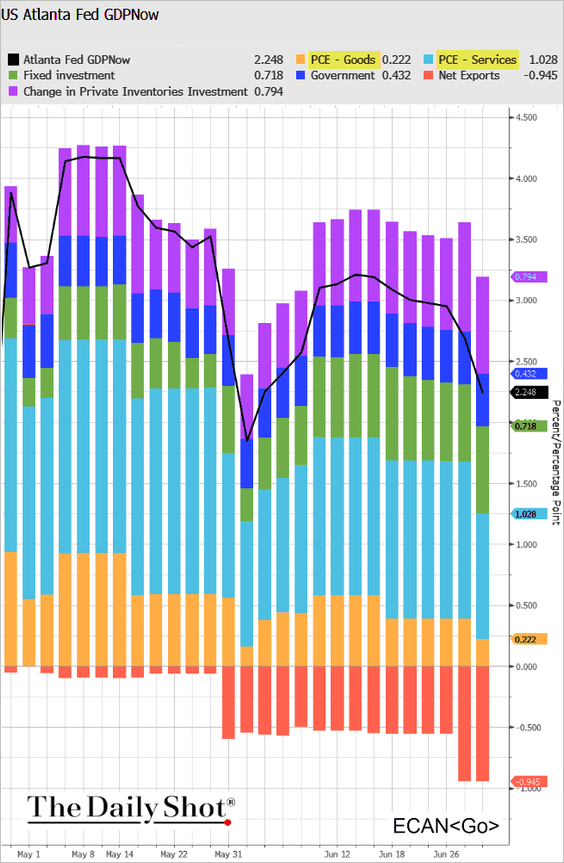 Source: @TheTerminal, Bloomberg Finance L.P.
• Housing investment, equipment spending, and trade are expected to be a drag on the Q2 GDP growth.
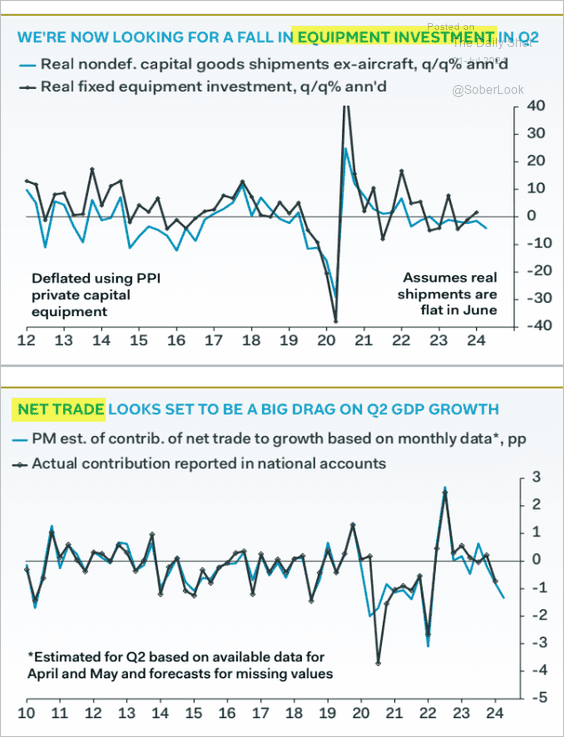 Source: Pantheon Macroeconomics
——————–
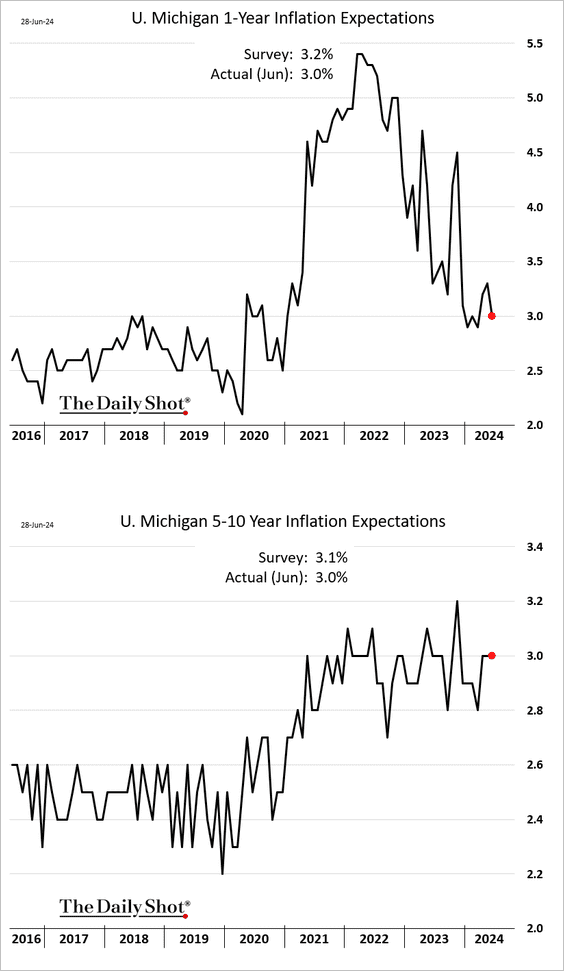
4. Consumer sentiment improved in the second half of June.
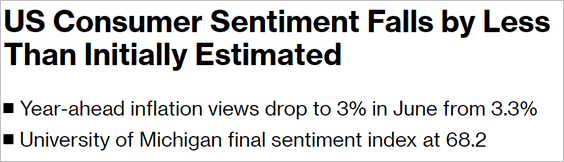 Source: @economics Read full article
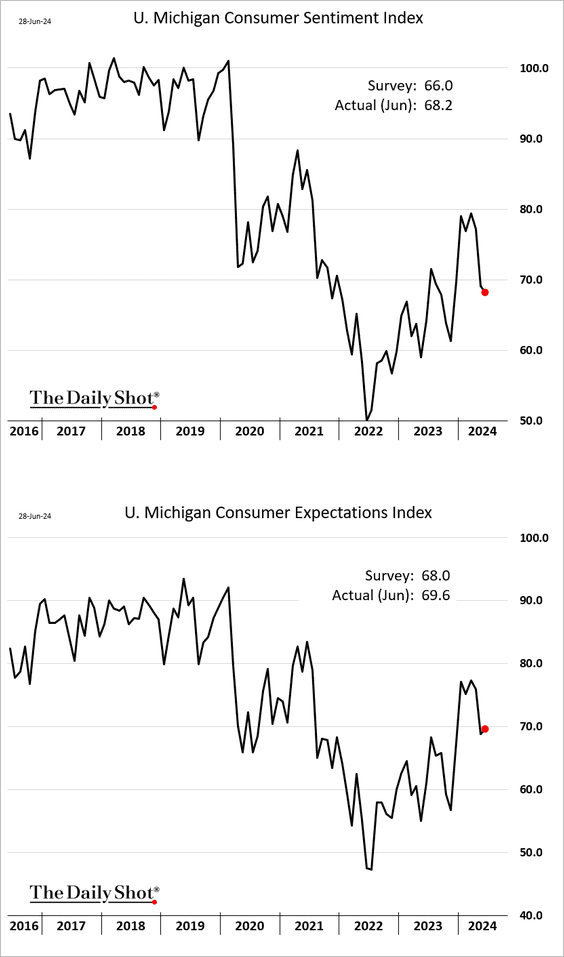
Inflation expectations were revised lower.
——————–
5. The Chicago PMI index reverted back to its more “normal” level (2 charts).
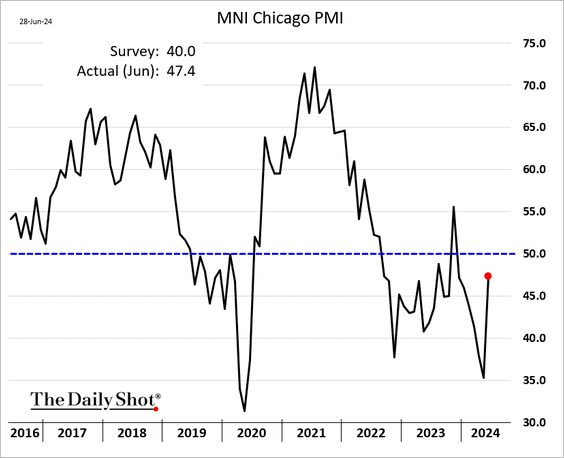
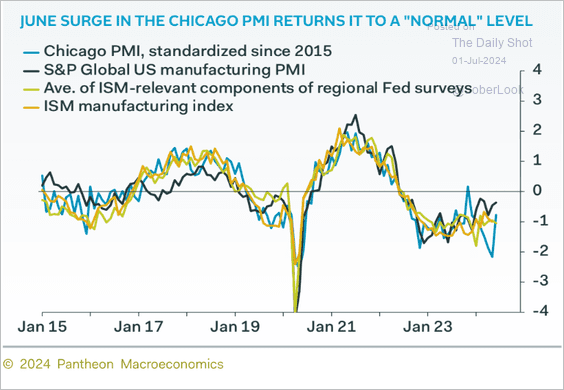 Source: Pantheon Macroeconomics
Back to Index
Canada
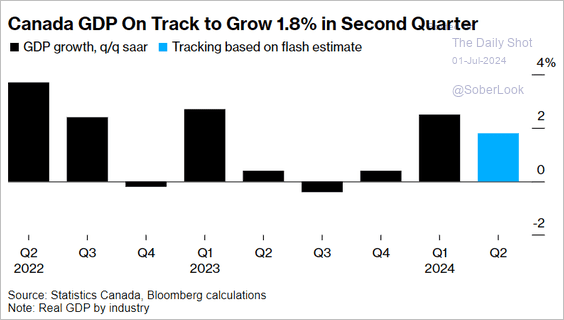
1. The GDP expanded in April, …
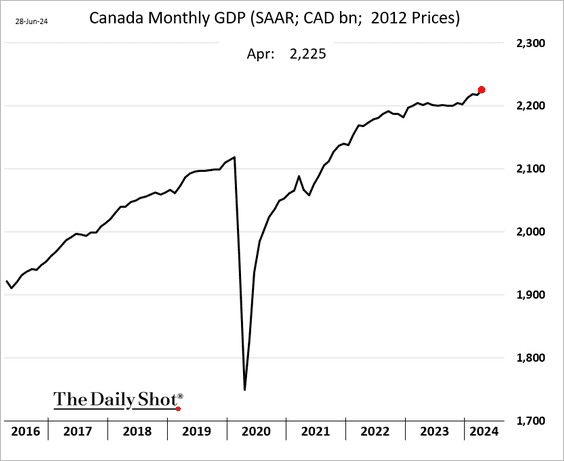
… with estimates pointing to 1.8% growth in Q2.
 Source: @economics Read full article
• Here is the GDP diffusion index.
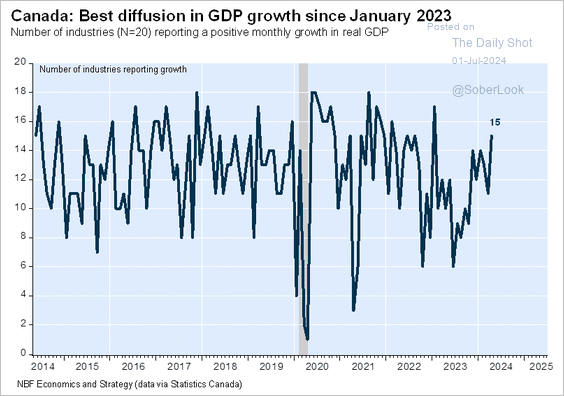 Source: Economics and Strategy Group, National Bank of Canada
——————–
2. Elevated labor costs are eating into corporate profits.
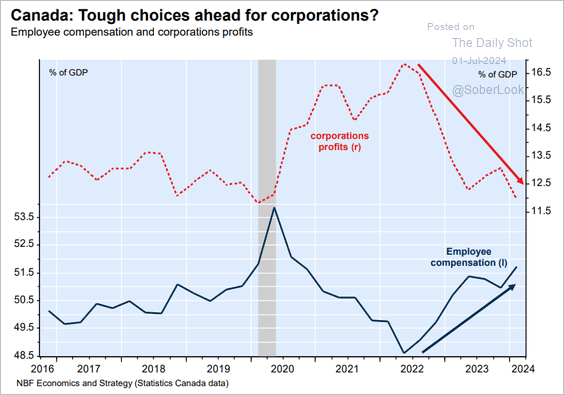 Source: Economics and Strategy Group, National Bank of Canada
Back to Index
The United Kingdom
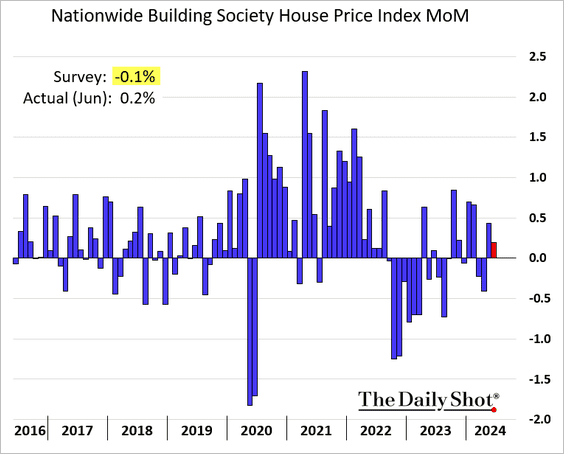
1. Home price appreciation surprised to the upside in June.
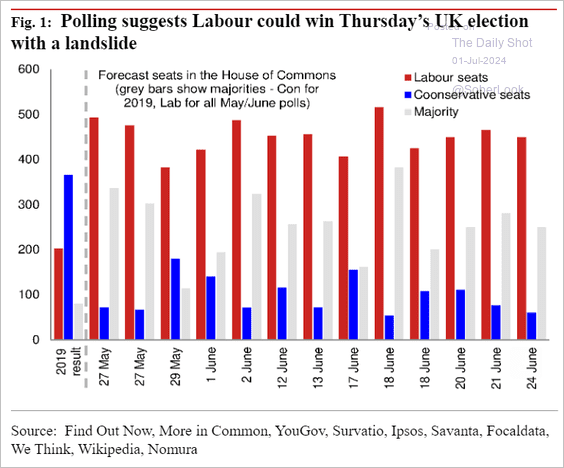
2. Here is a look at the latest polls ahead of the elections (2 charts).
 Source: Nomura Securities
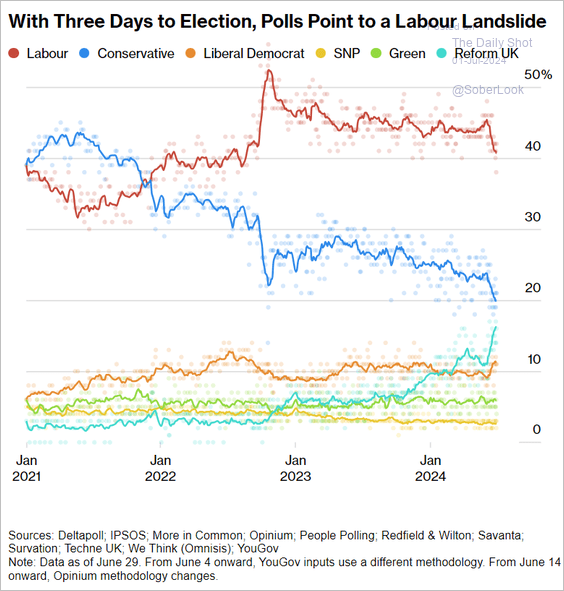 Source: @bpolitics Read full article
Back to Index
The Eurozone
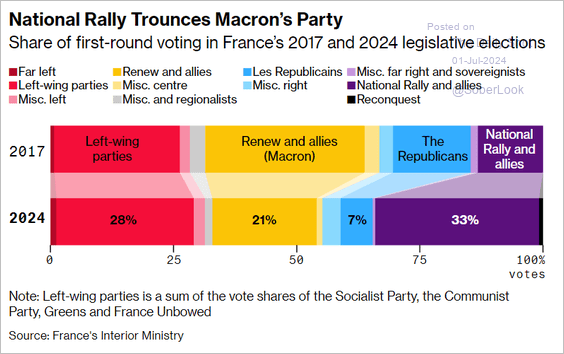
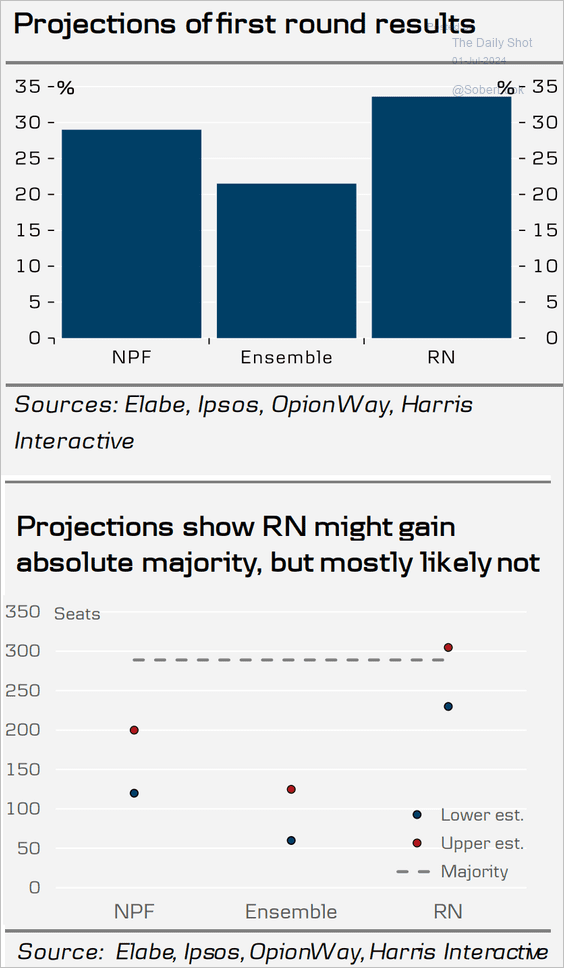
1. Let’s begin with the French elections.
 Source: Reuters Read full article
 Source: @bpolitics Read full article
Below is a comment from Danske Bank.
Initial projections, alongside statements from Macron and Melenchon on Sunday, indicate that the most probable outcome is that no party will achieve an absolute majority, resulting in a ‘hung parliament’. Hence, public spending in France is not set to rise significantly.
 Source: Danske Bank
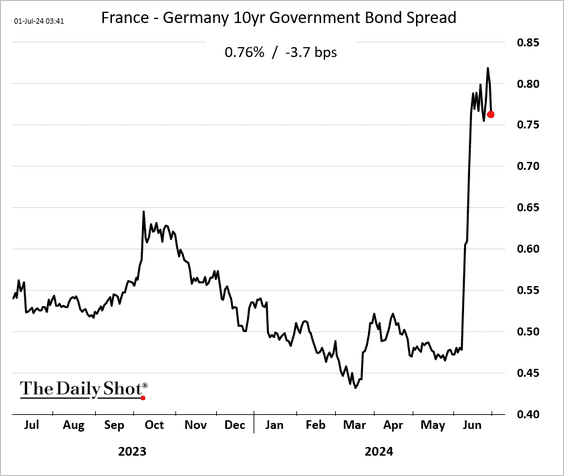
• The 10-year bond spread eased somewhat.
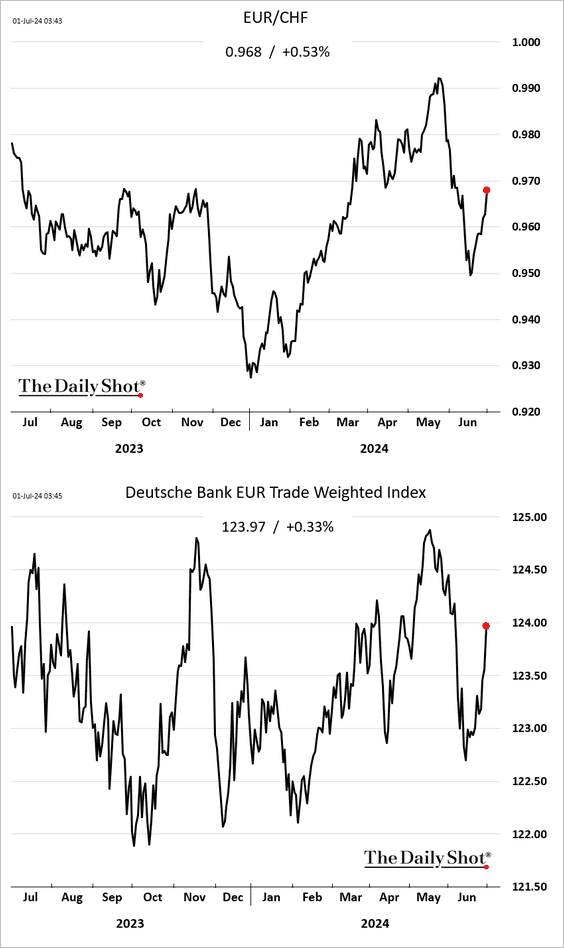
• The euro moved higher.
——————–
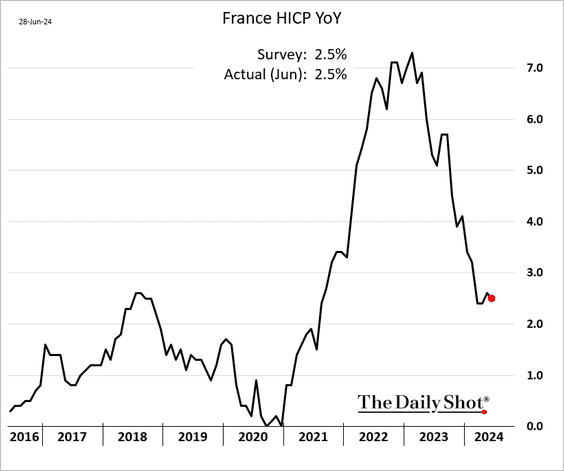
2. French inflation eased slightly in June.
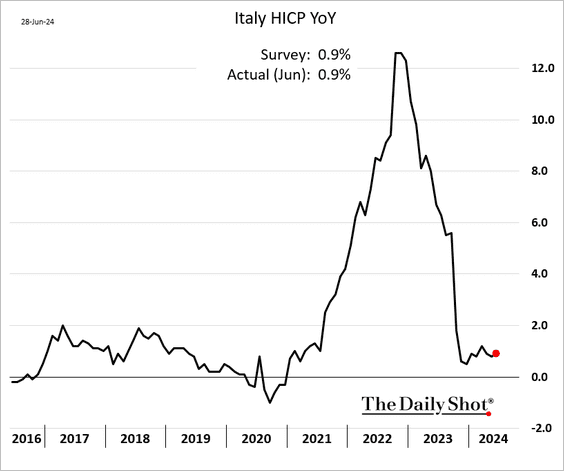
Italy’s inflation inched higher.
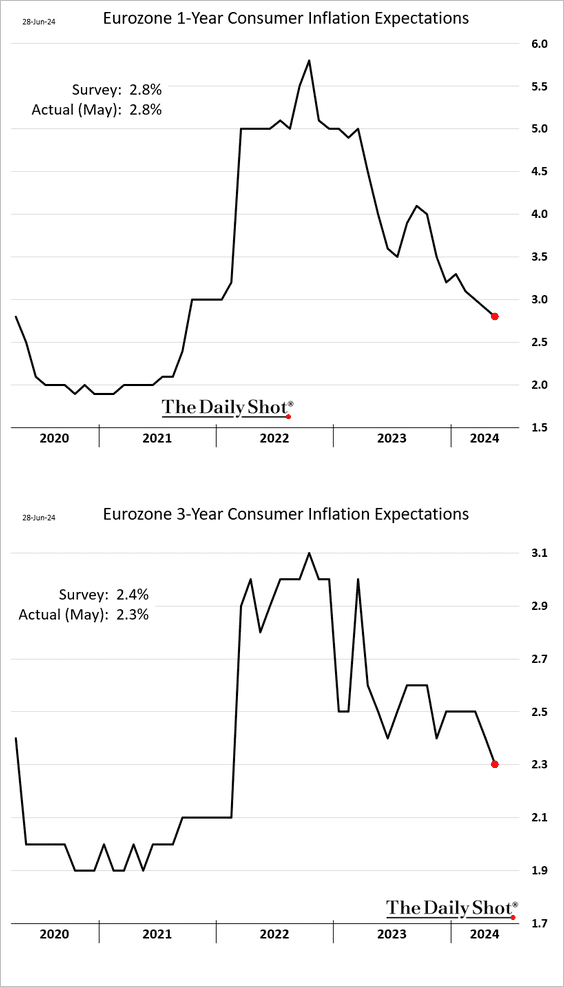
• Consumer inflation expectations continue to trend lower.
• Euro-area service inflation remains elevated.
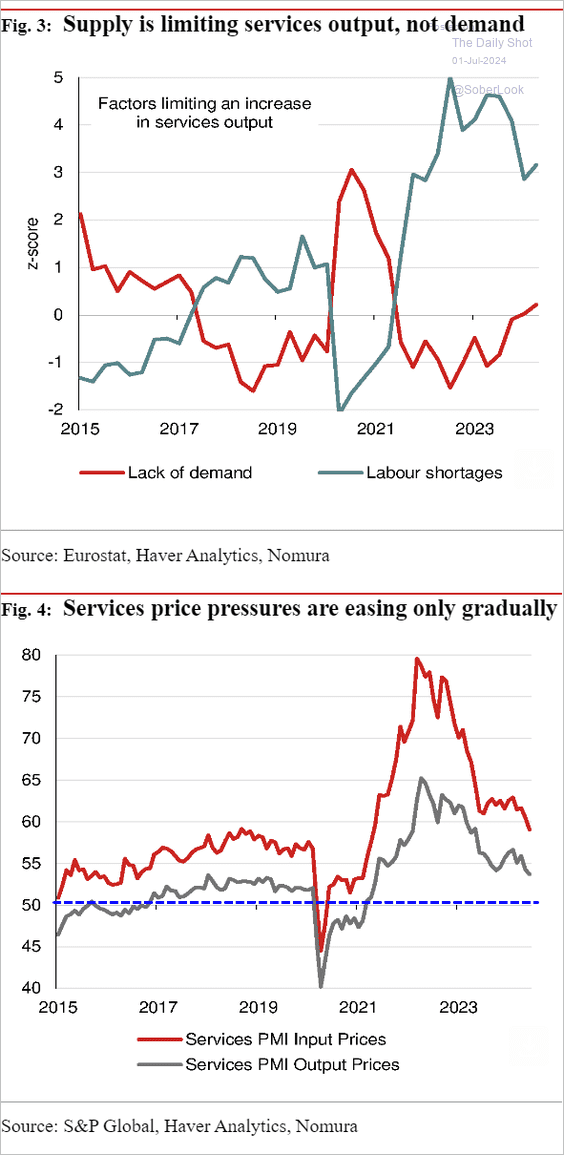 Source: Nomura Securities
• Wage growth should be slowing.
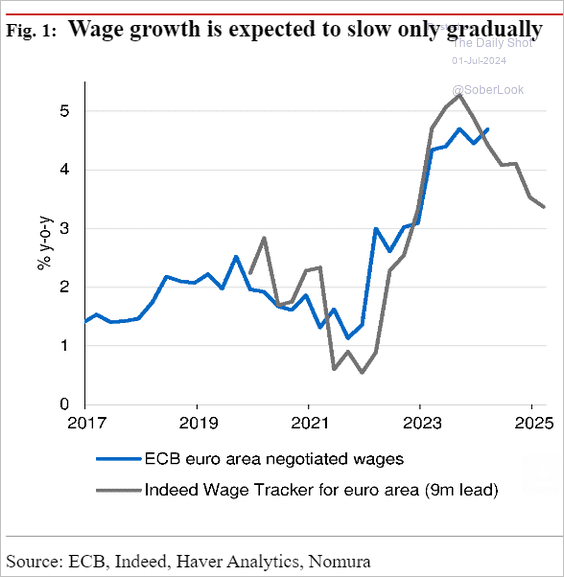 Source: Nomura Securities
Back to Index
Japan
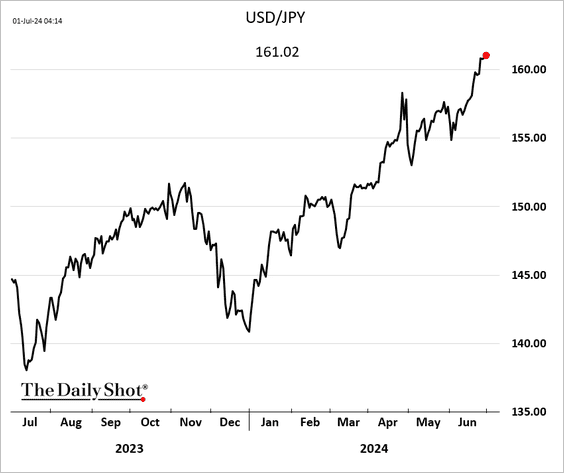
1. Dollar-yen is holding above 161.
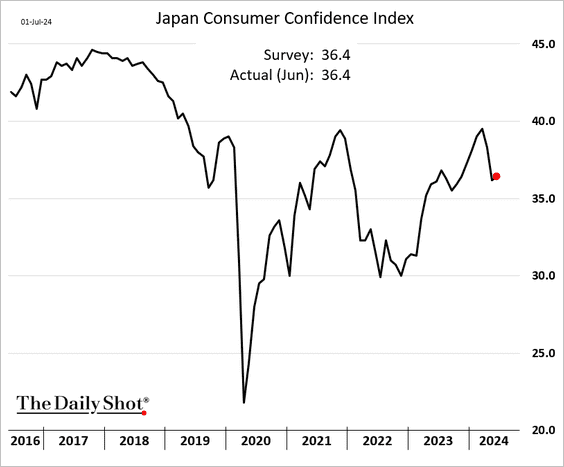
2. Consumer confidence edged higher in June.
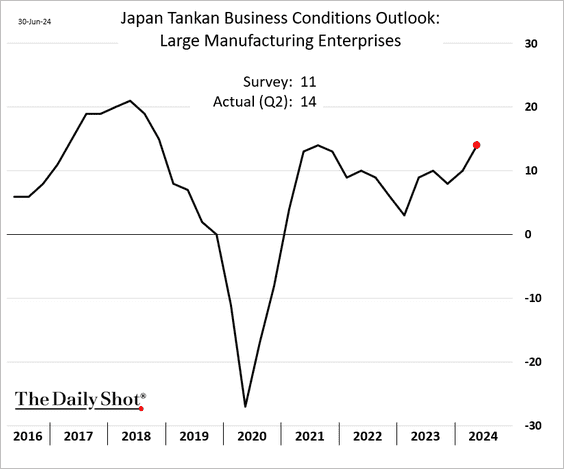
3. The Tankan report indicated that manufacturers were more optimistic in Q2.
 Source: MarketWatch Read full article
Back to Index
Asia-Pacific
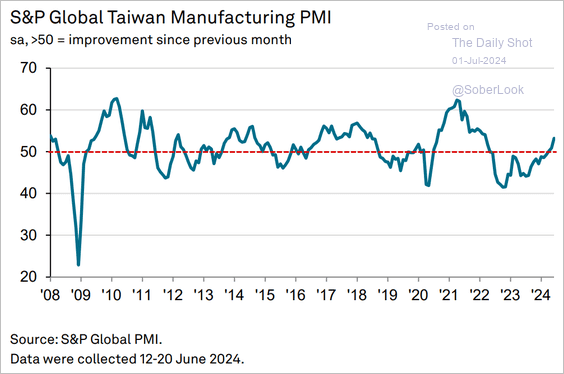
1. Taiwan’s manufacturing growth accelerated in June.
 Source: S&P Global PMI
2. South Korea’s factory activity also picked up momentum.
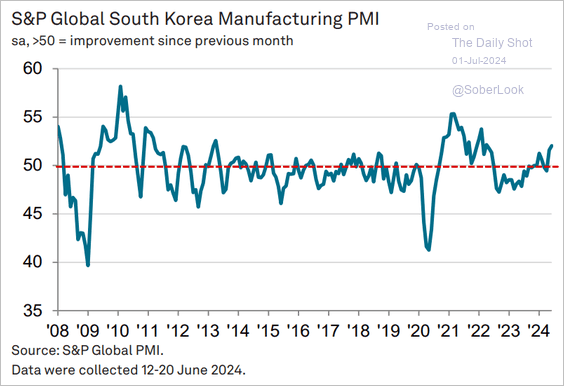 Source: S&P Global PMI
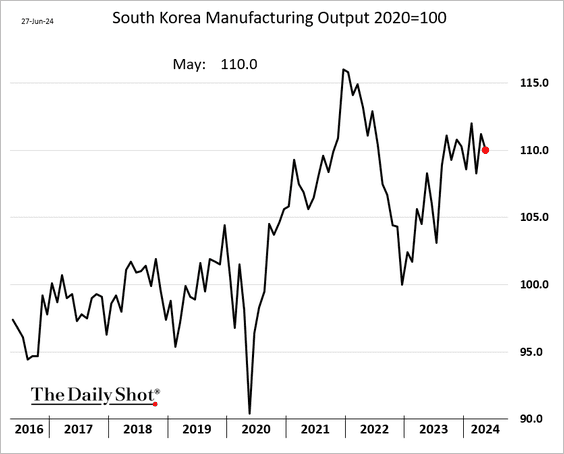
• The nation’s manufacturing output eased in May.
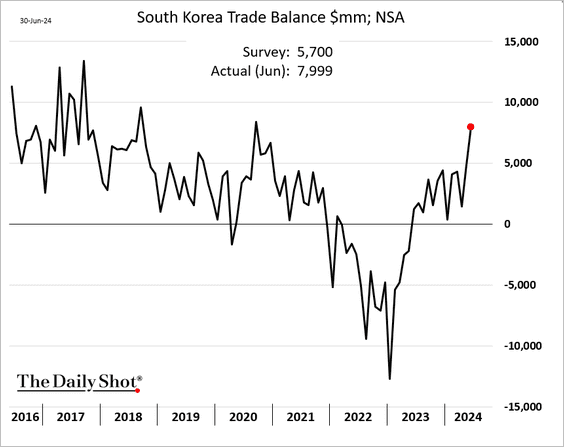
• South Korea’s trade surplus surged In June.
——————–
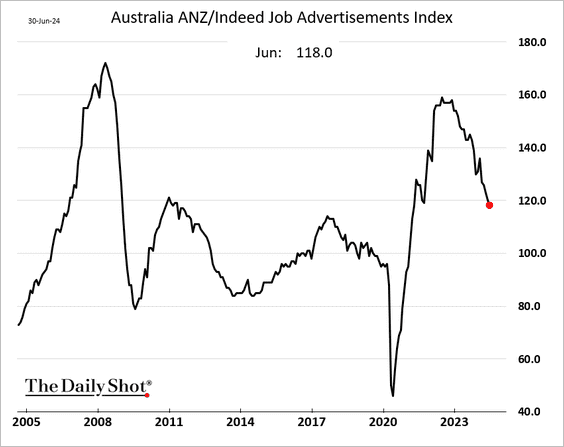
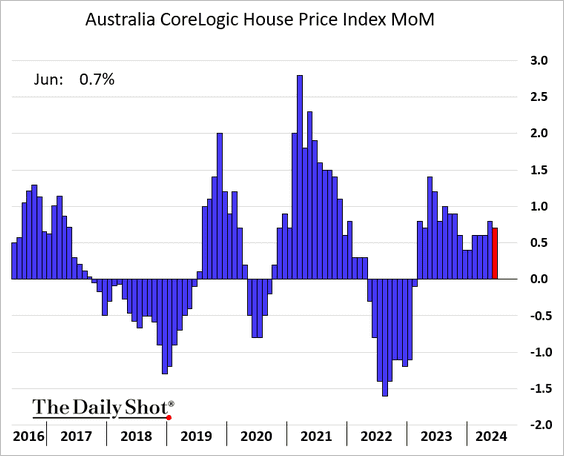
3. Australia’s job vacancies continue to ease.
• Home price appreciation is holding up well.
• Australia’s inflation tracking index edged higher in June.

——————–
4. Asian currencies have been struggling vs. USD.
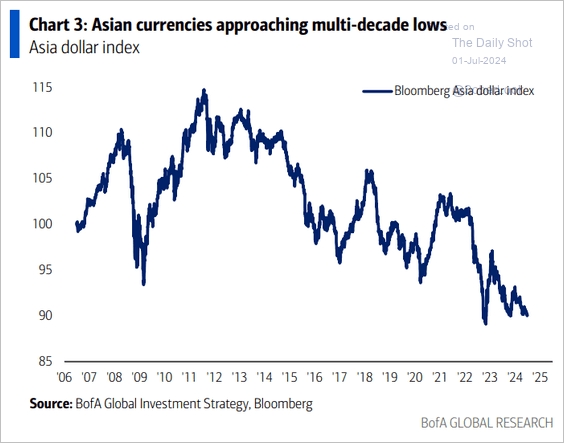 Source: BofA Global Research
Back to Index
China
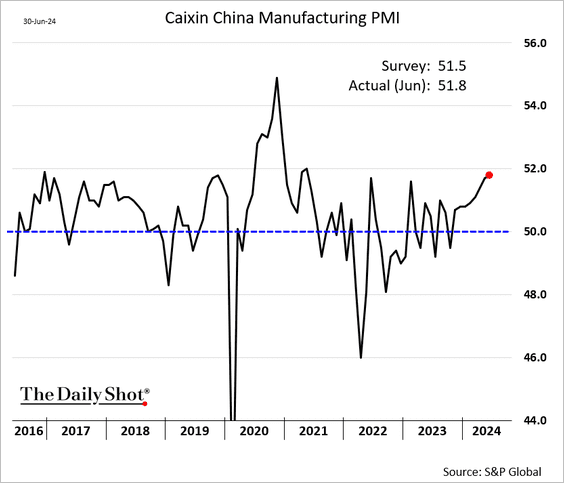
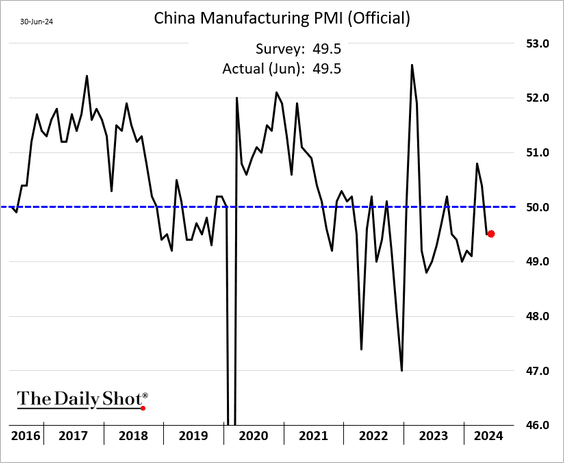
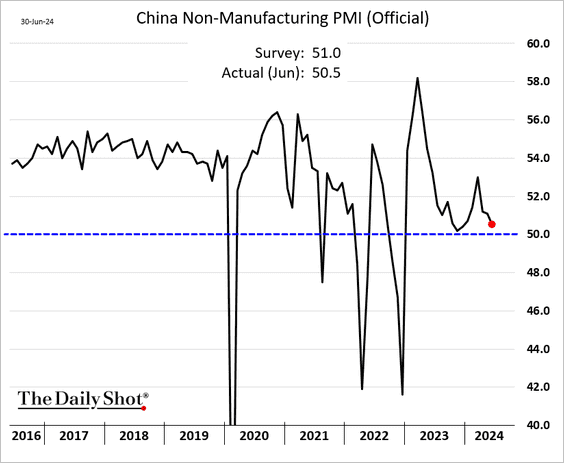
1. The PMI reports were mixed.
• The PMI index from S&P Global shows robust growth in factory activity.
But the official PMI measure remains in contraction.
• Growth in the non-manufacturing sector slowed.
——————–
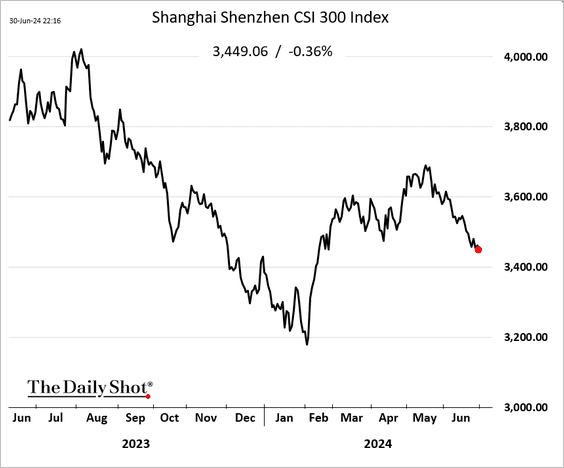
2. The Shanghai Shenzhen CSI 300 Index is almost flat year-to-date.
Back to Index
Emerging Markets
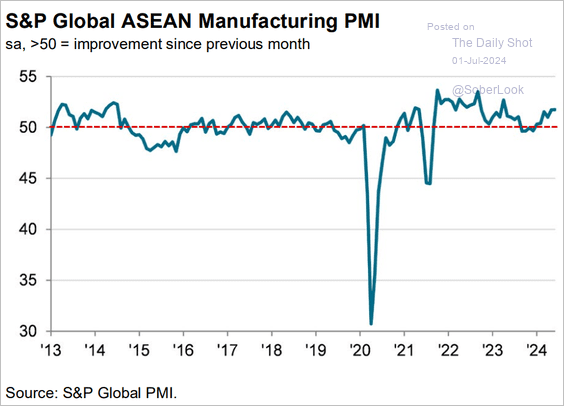
1. Let’s run through Asian manufacturing PMIs.
• ASEAN (steady growth):
 Source: S&P Global PMI
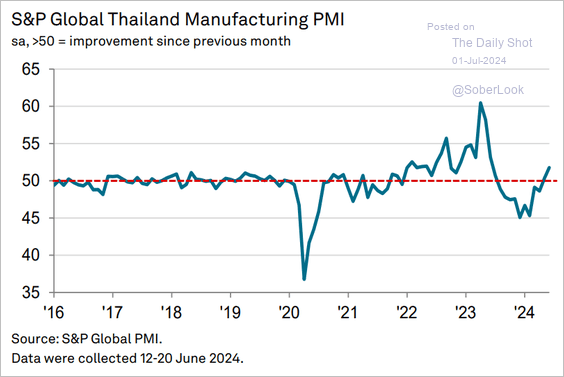
• Thailand (faster expansion):
 Source: S&P Global PMI
• Indonesia (growth stalling):
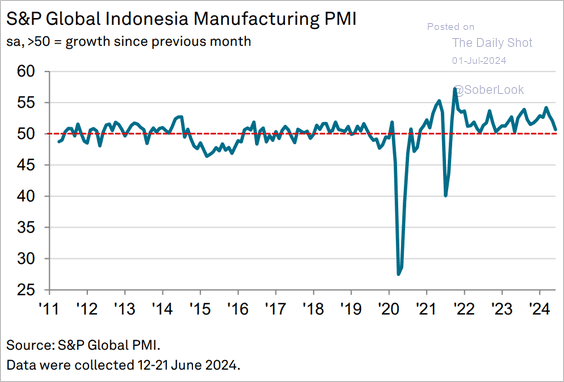 Source: S&P Global PMI
• Malaysia (no progress from May):
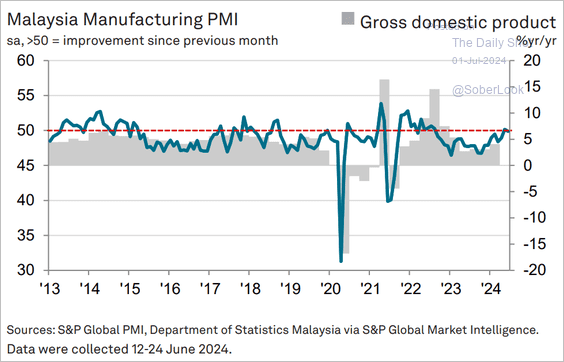 Source: S&P Global PMI
• The Philippines (slower expansion):
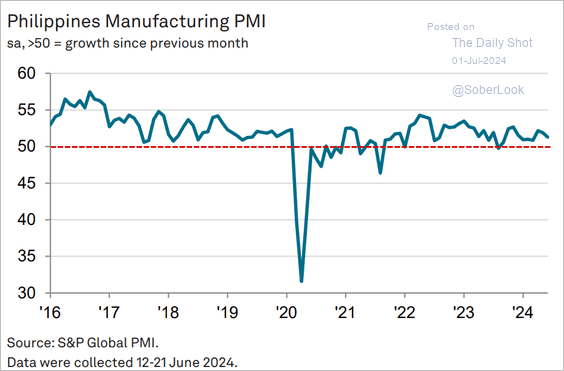 Source: S&P Global PMI
——————–
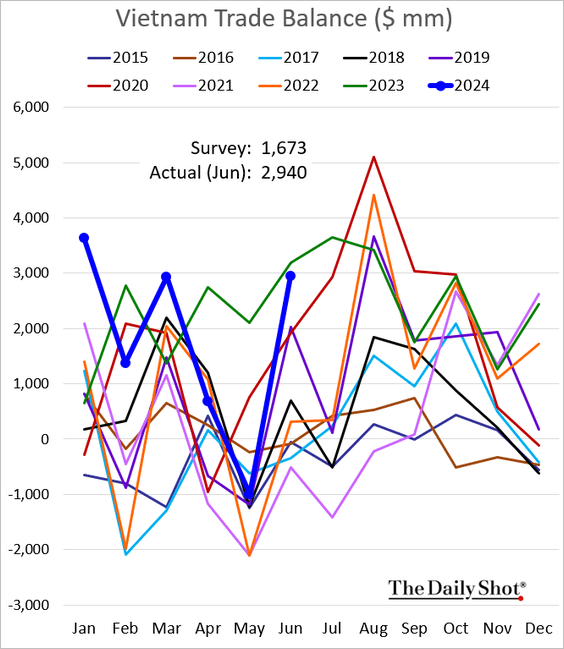
2. Vietnam’s GDP grew solidly in Q2.
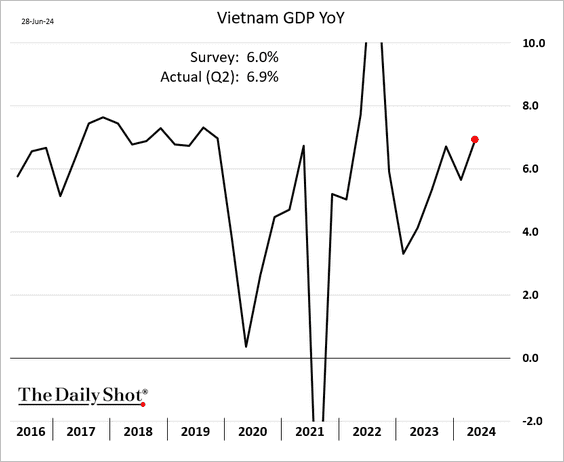
• The trade surplus surprised to the upside.
——————–
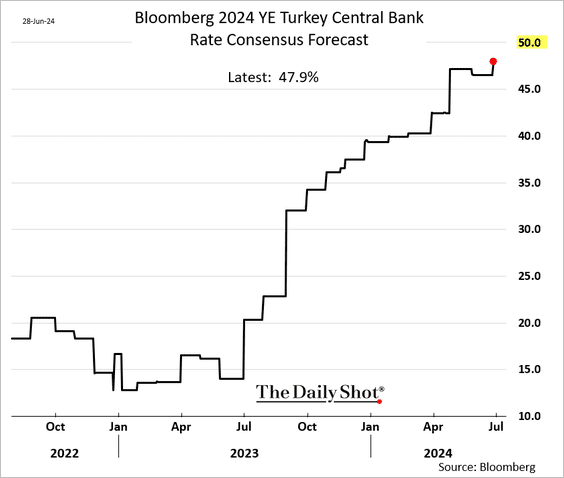
3. Hopes for significant rate cuts in Turkey this year are diminishing.
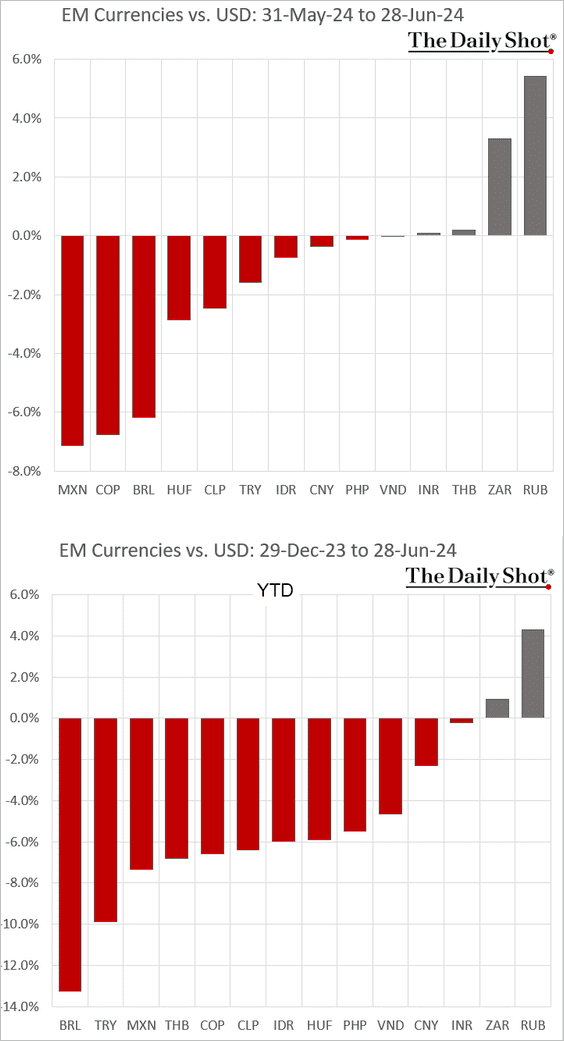
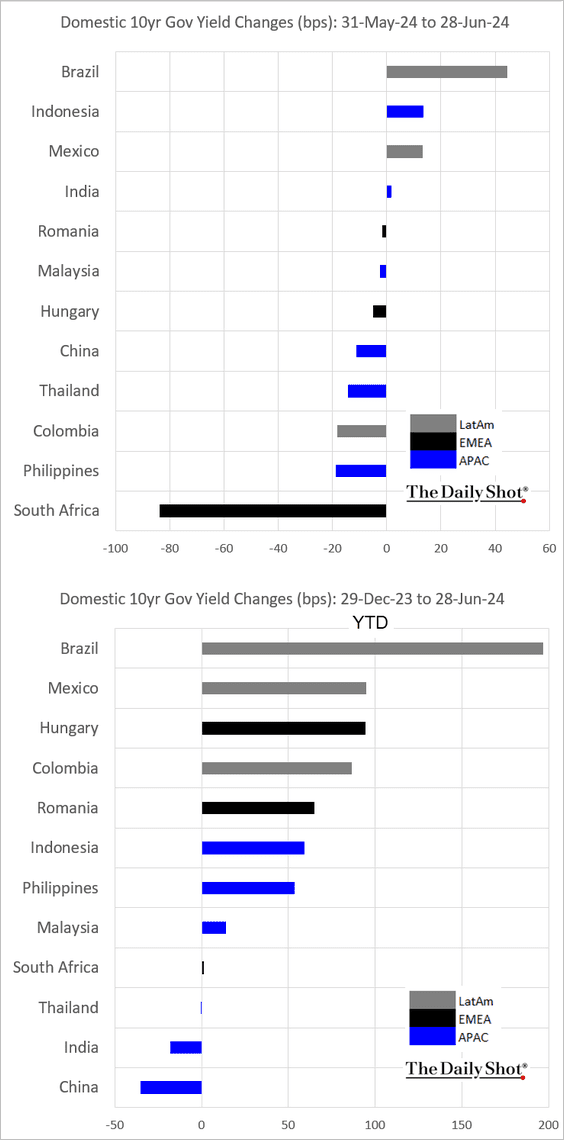
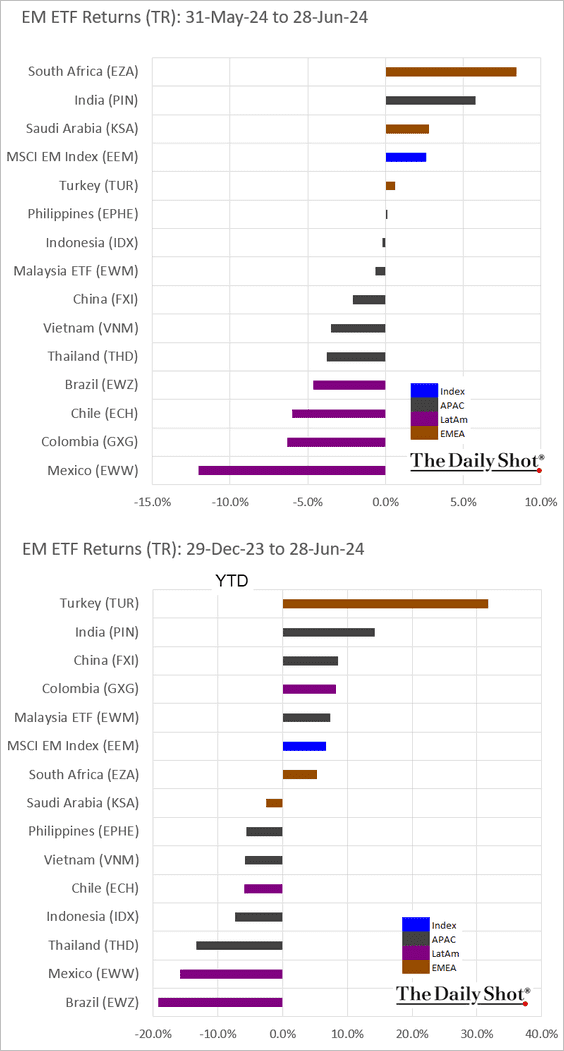
4. Next, let’s take a look at performance in June and year-to-date.
• Currencies:
• Bond yields:
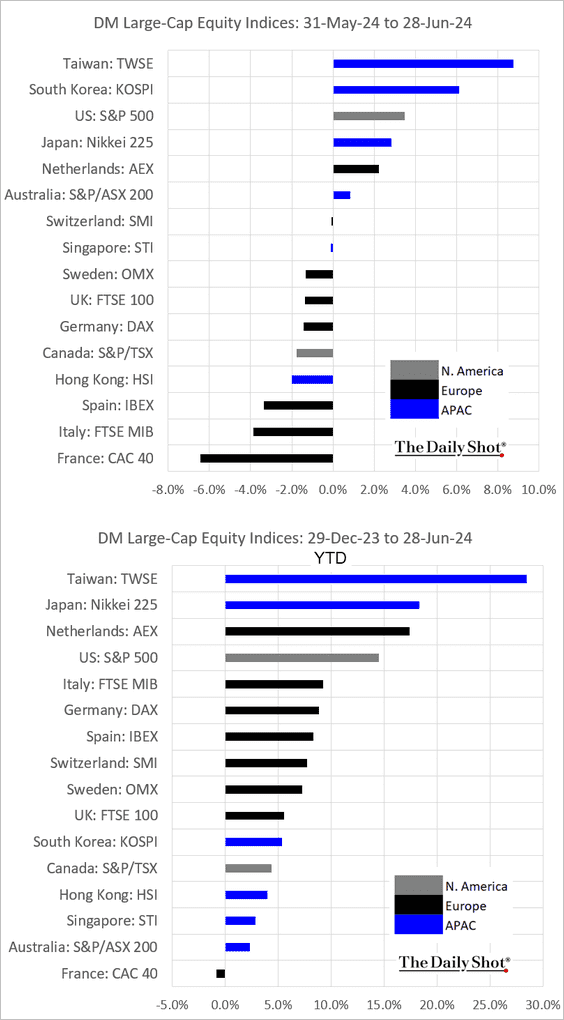
• Equity ETFs:
Back to Index
Commodities
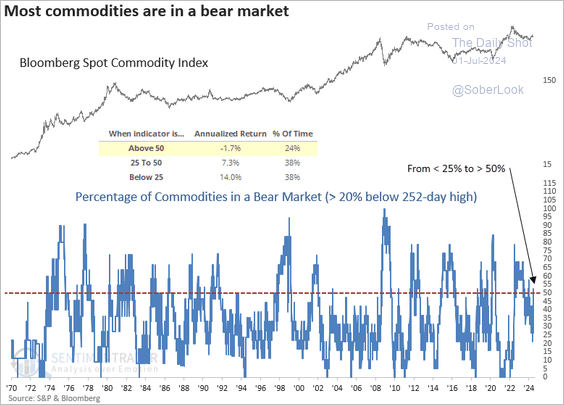
1. Most commodities are in a bear market, which typically precedes a period of weakness in the broad index.
 Source: SentimenTrader
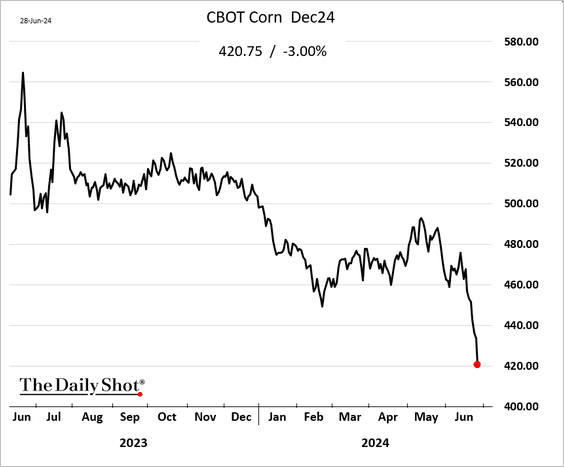
2. Corn futures remain under pressure.
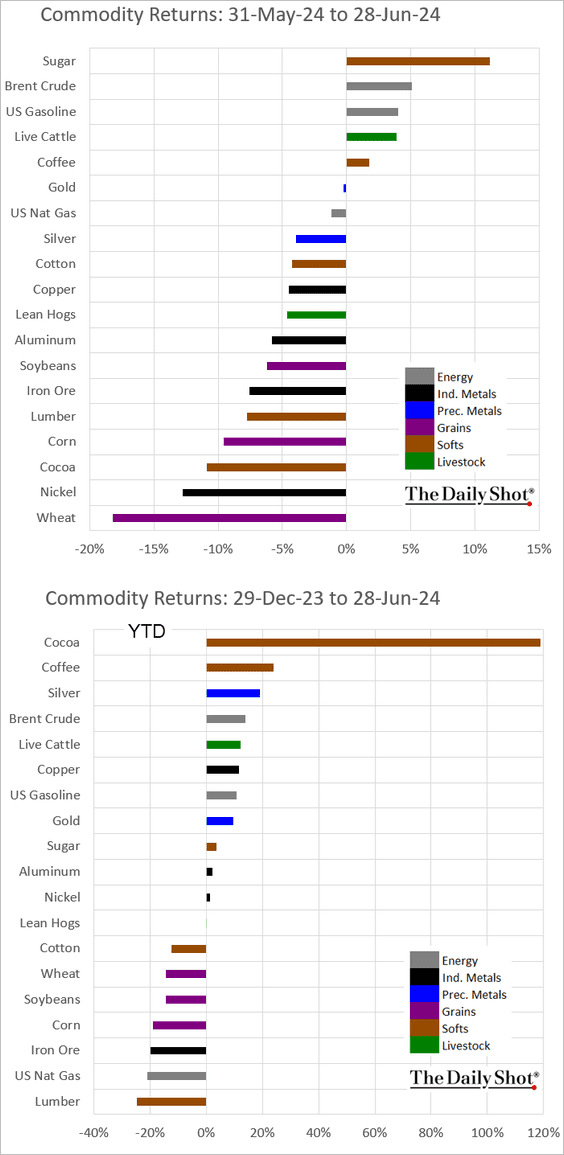
3. Here is a look at commodity markets’ performance in June and year-to-date.
Back to Index
Equities
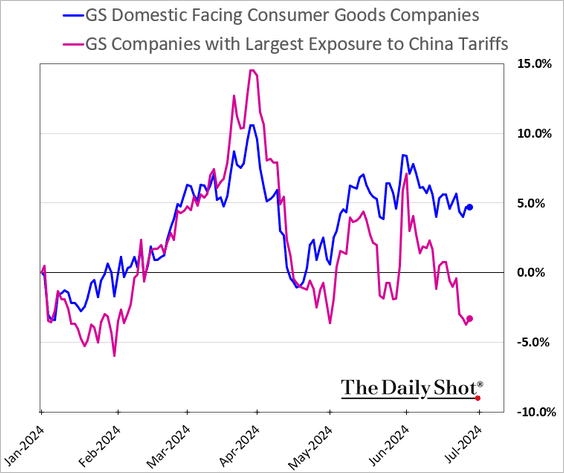
1. Consumer companies exposed to higher US tariffs on Chinese goods are underperforming.
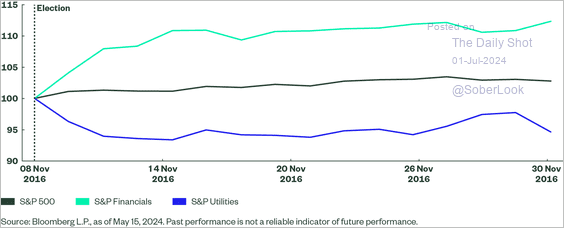
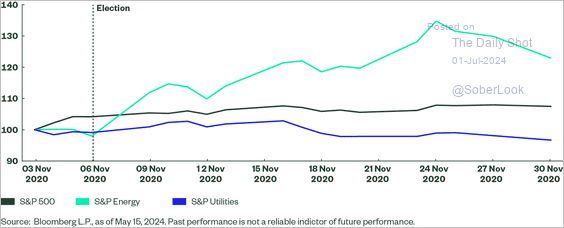
2. S&P 500 Financials benefited disproportionately following the 2016 Presidential election, while the Energy sector outperformed following the 2020 election. Utilities underperformed immediately following both elections. (2 charts)
 Source: State Street Global Advisors Read full article
 Source: State Street Global Advisors Read full article
——————–
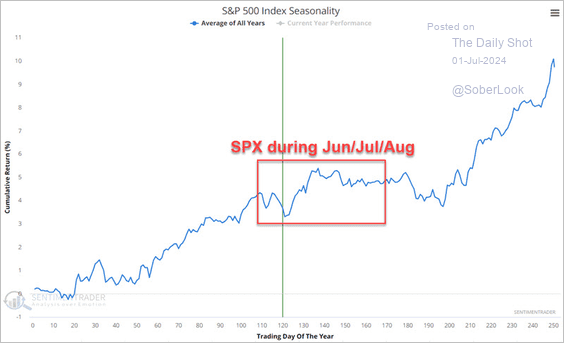
3. The S&P 500 is entering a seasonally choppy period.
 Source: SentimenTrader
4. Here is the Q2 earnings season.
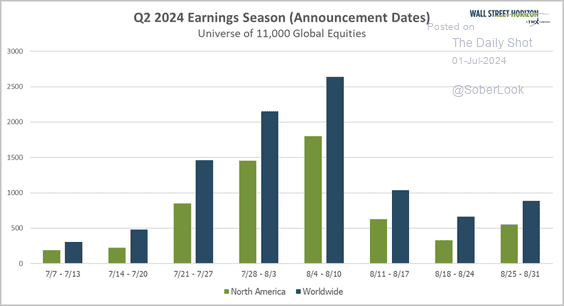 Source: @WallStHorizon
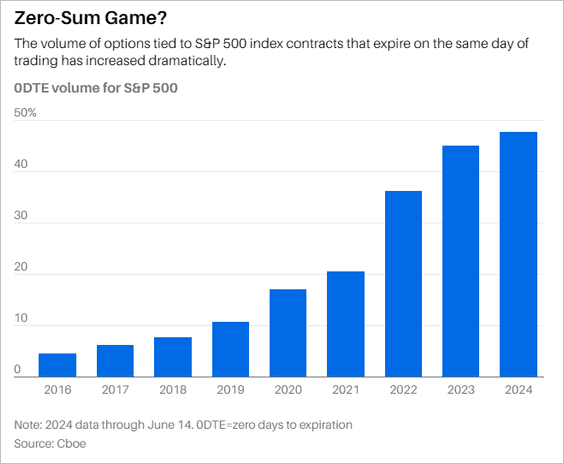
5. Zero-day option activity remains elevated.
 Further reading
6. Trading volume outside regular hours has surged this year.
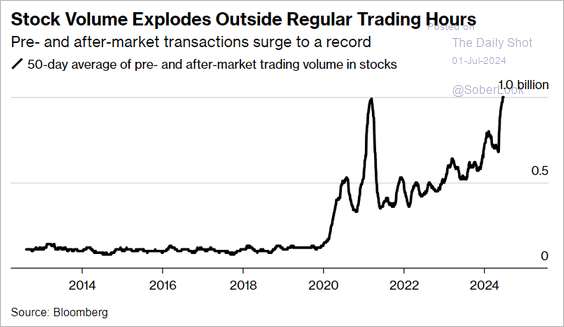 Source: @markets Read full article
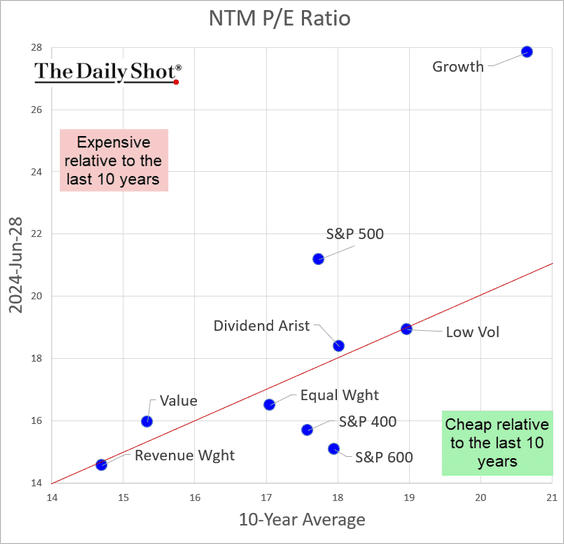
7. Here is a look at factor/style valuations relative to the 10-year average.
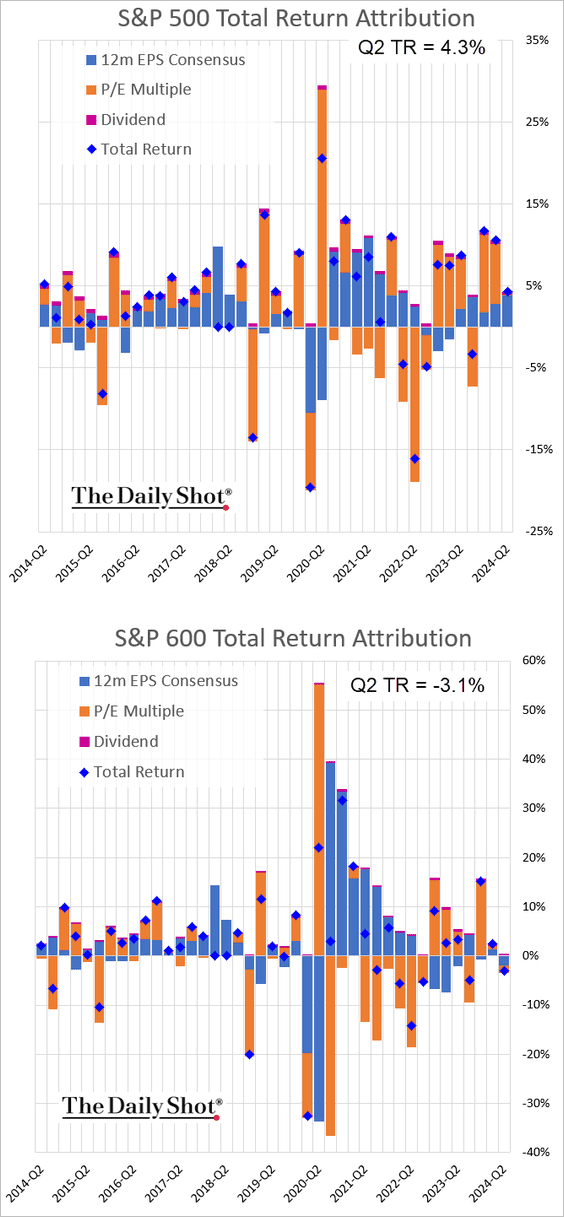
8. This chart displays the quarterly return attribution for the S&P 500 and S&P 600. In the second quarter, S&P 500 returns were driven by expectations of higher earnings.
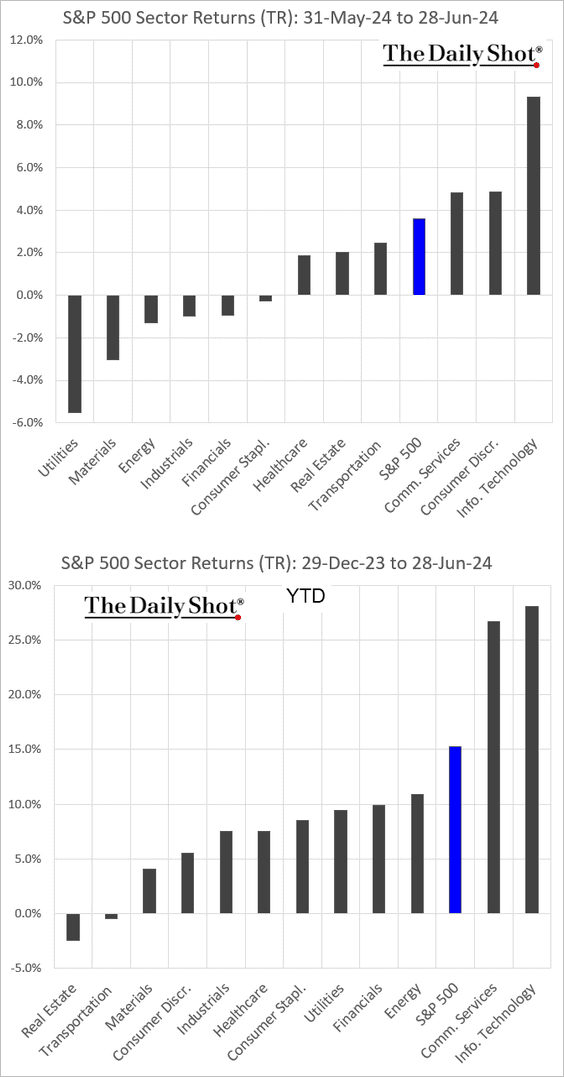
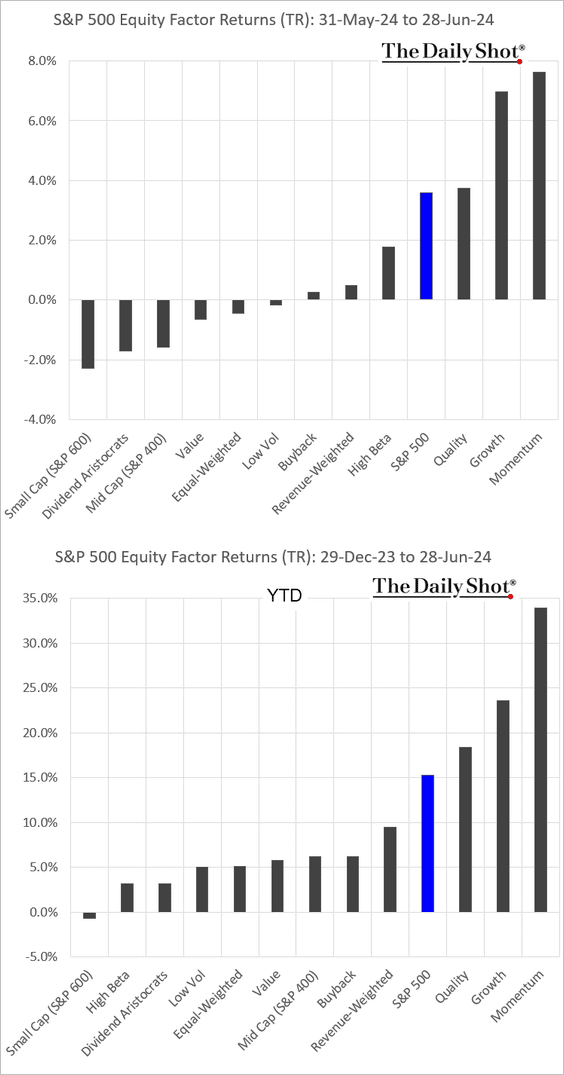
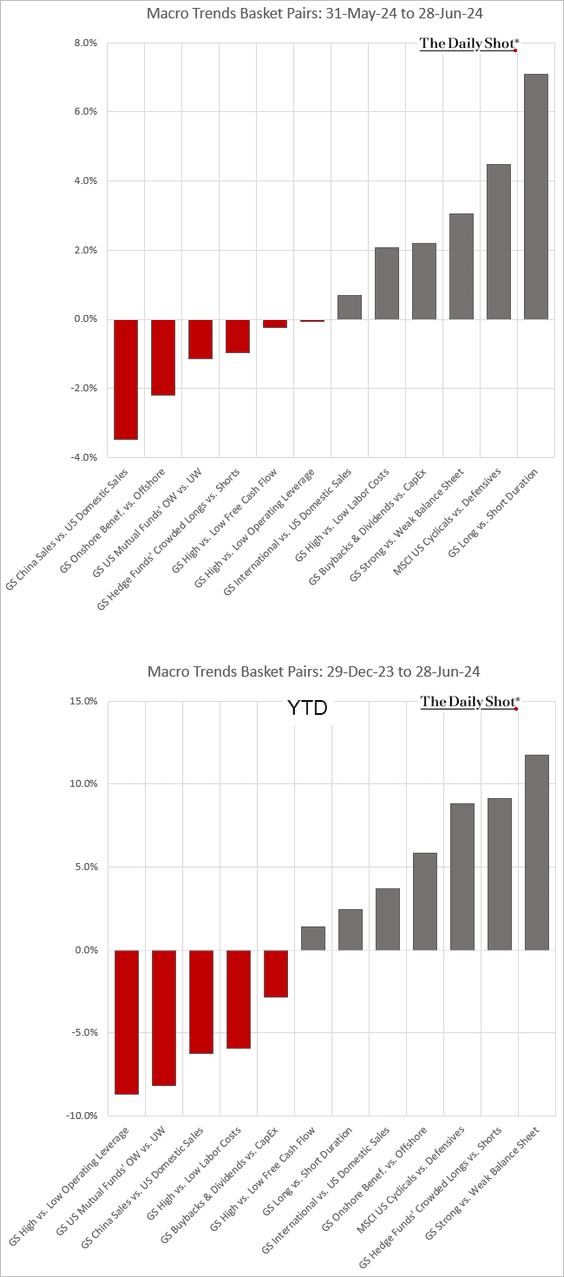
9. Finally, we have some performance data for June and year-to-date.
• Sectors:
• Equity factors:
• Macro basket pairs’ relative performance:
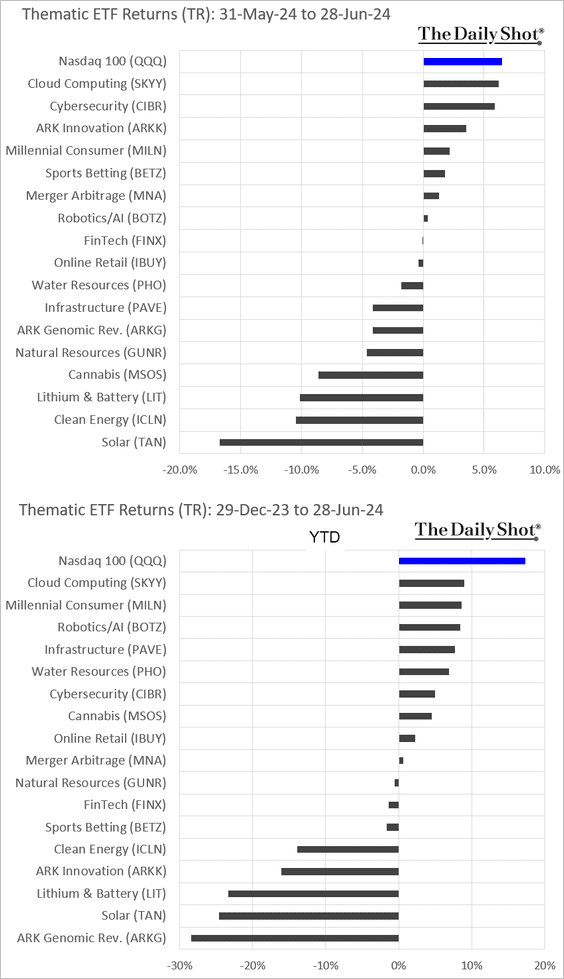
• Thematic ETFs:
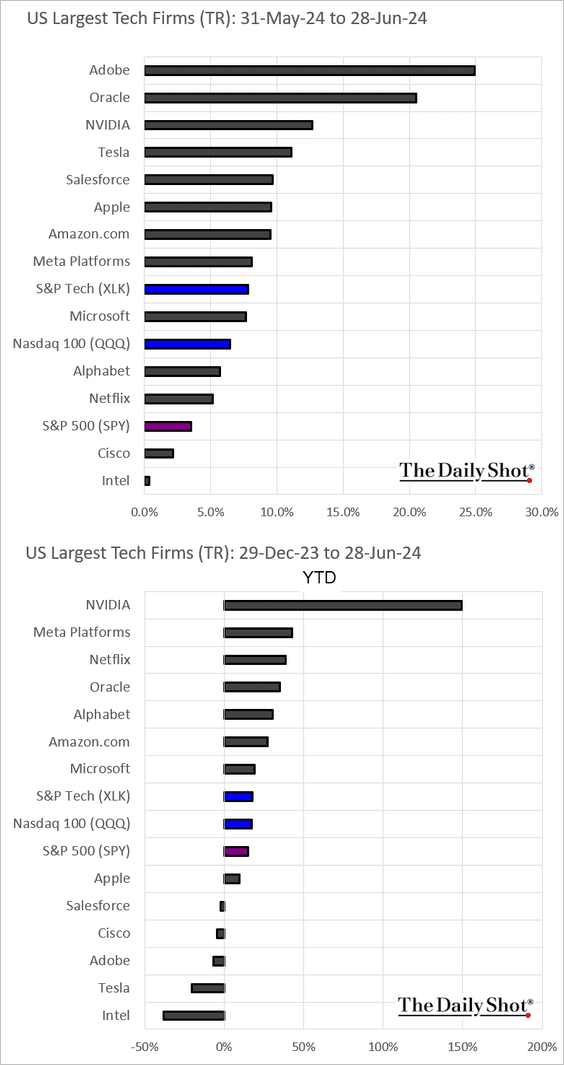
• Largest US tech firms:
Back to Index
Credit
1. Demand for leveraged loans remains robust.
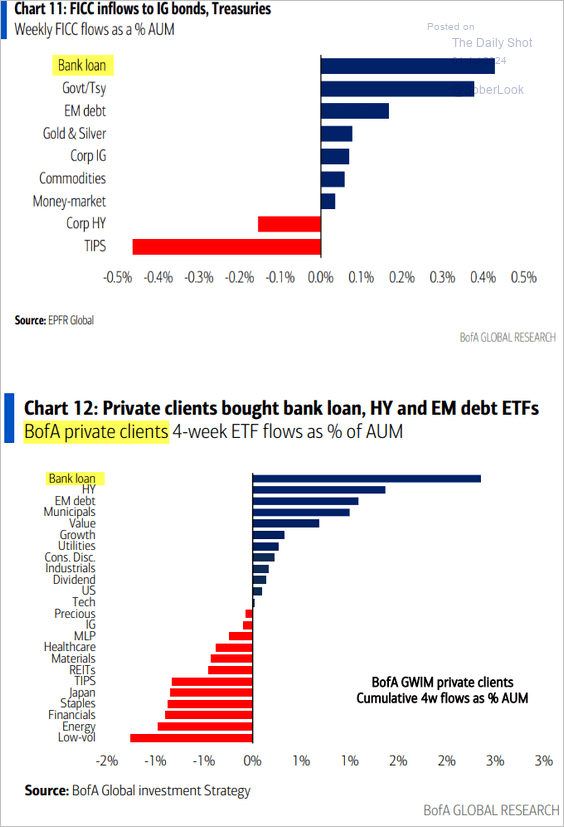 Source: BofA Global Research
2. Multifamily loans constitute the largest exposure by property type of impending loan maturities.
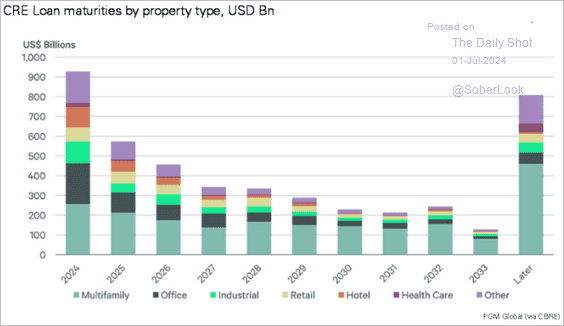 Source: PGM Global
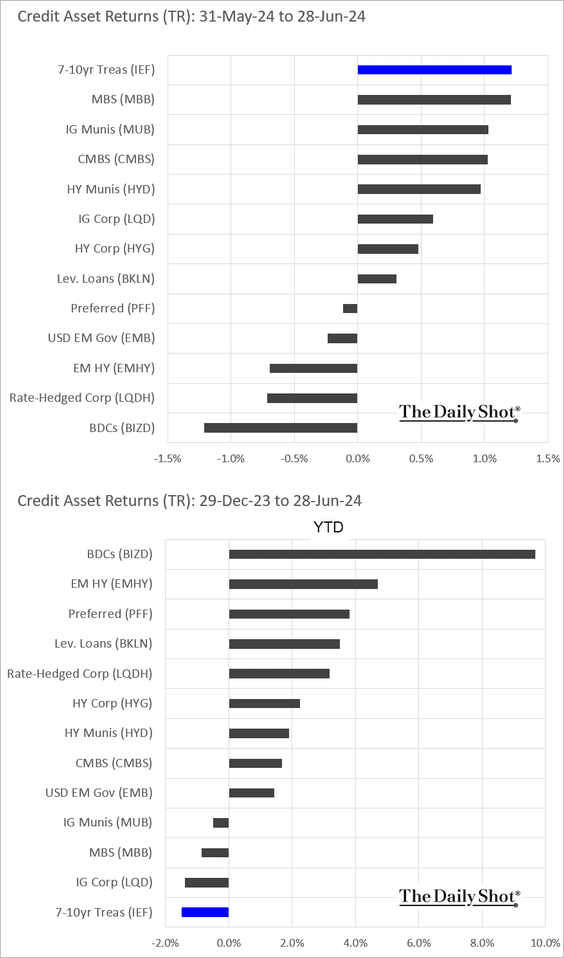
3. Here is a look at performance in June and year-to-date.
Back to Index
Rates
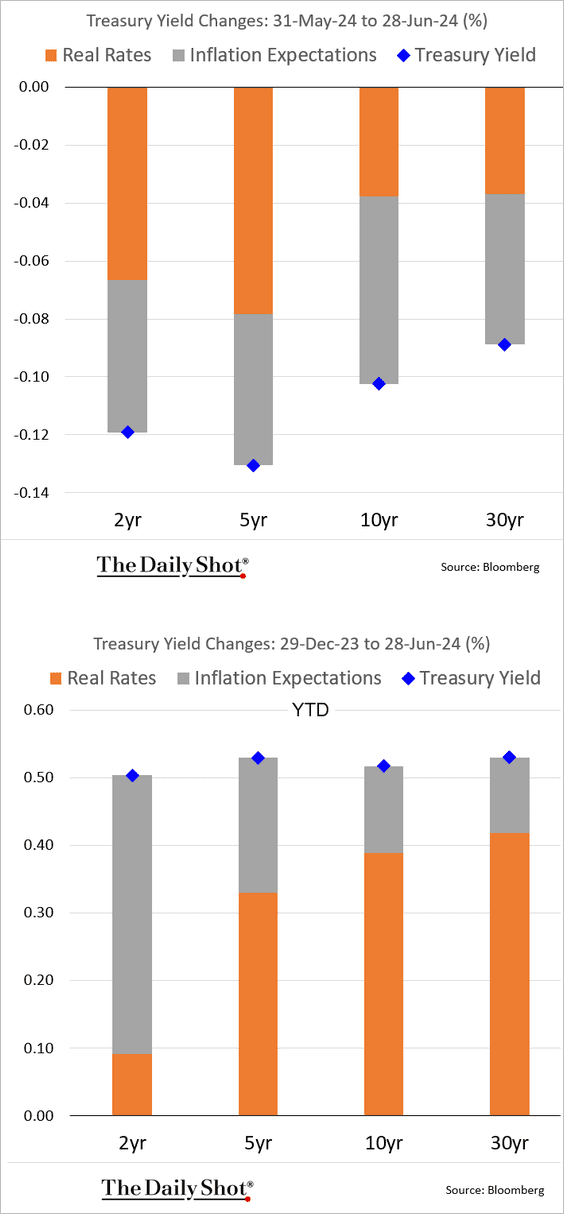
Below is the attribution of Treasury yield changes in June and year-to-date.
Back to Index
Global Developments
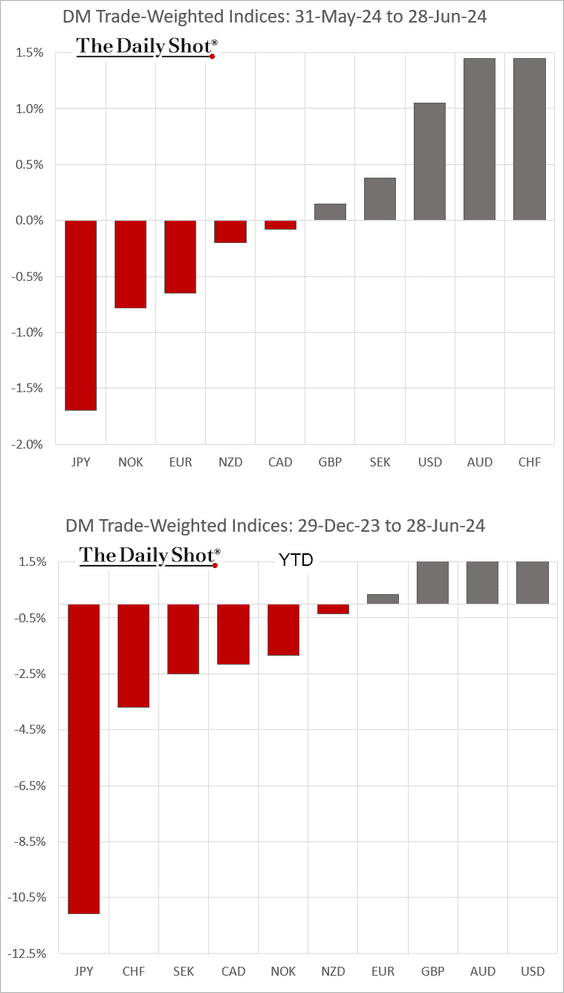
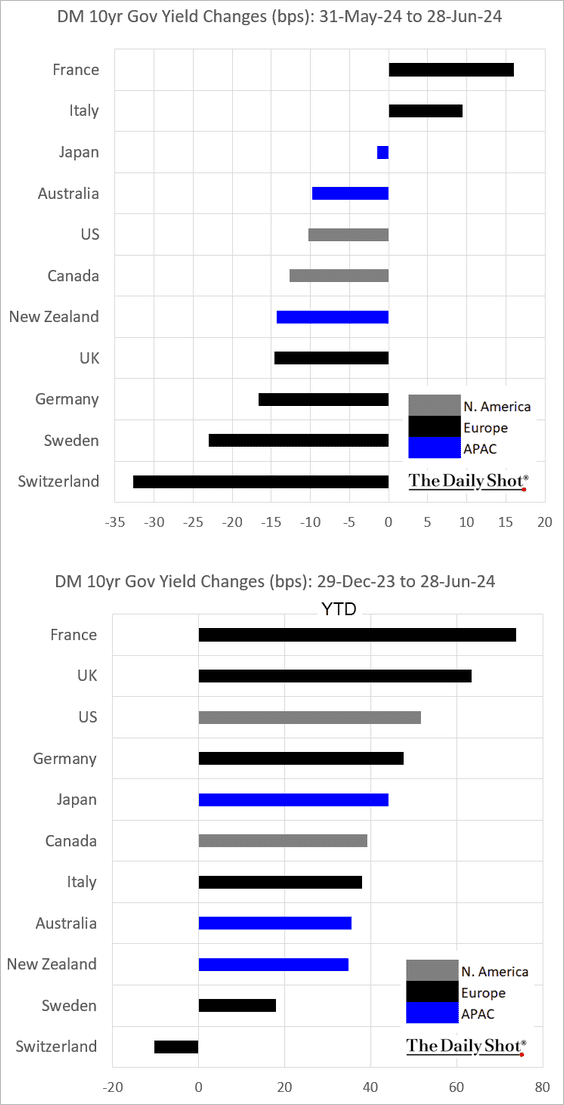
Here is the performance data for June and year-to-date.
• Currencies:
• Bond yields:
• Equities:
——————–
Food for Thought
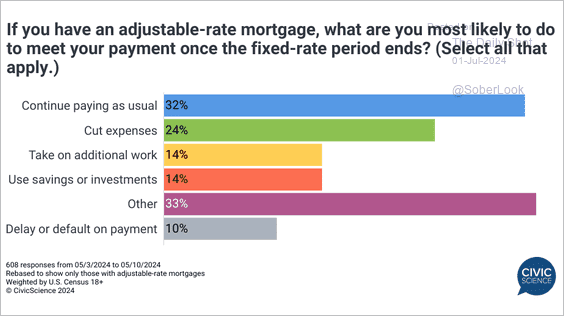
1. Actions taken by adjustable-rate mortgage holders after the fixed-rate period ends:
 Source: @CivicScience
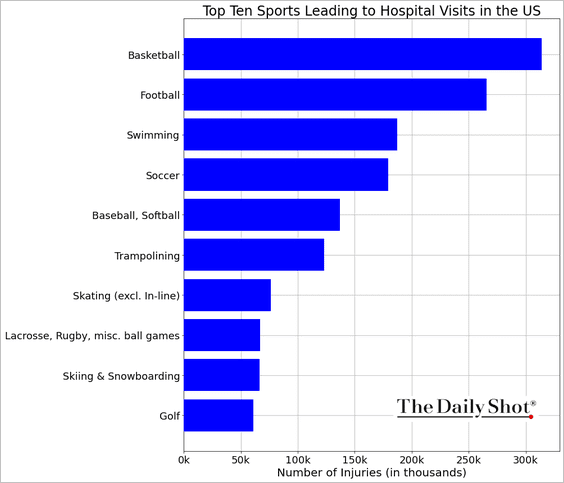
2. The top ten sports leading to hospital visits in the US:
 Source: John Foy & Associates
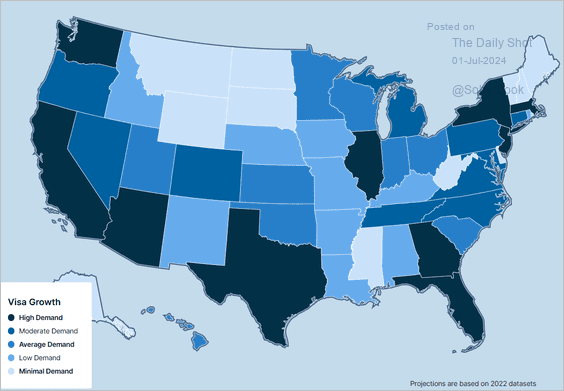
3. Demand for foreign-born labor:
 Source: Brookings Read full article
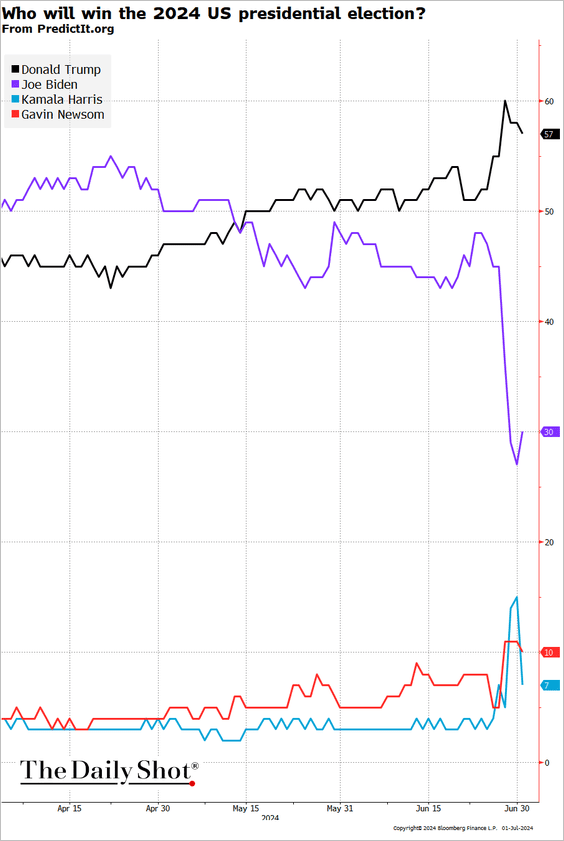
4. US presidential election probabilities in the betting markets:
5. Americans’ preference for legality of abortion:
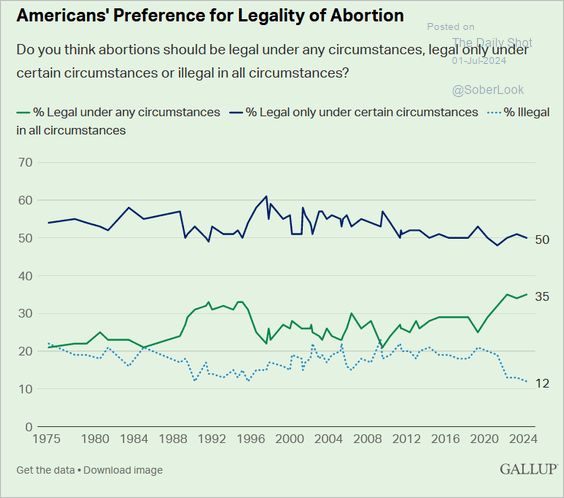 Source: Gallup Read full article
6. Perceptions of trustworthiness on social media:
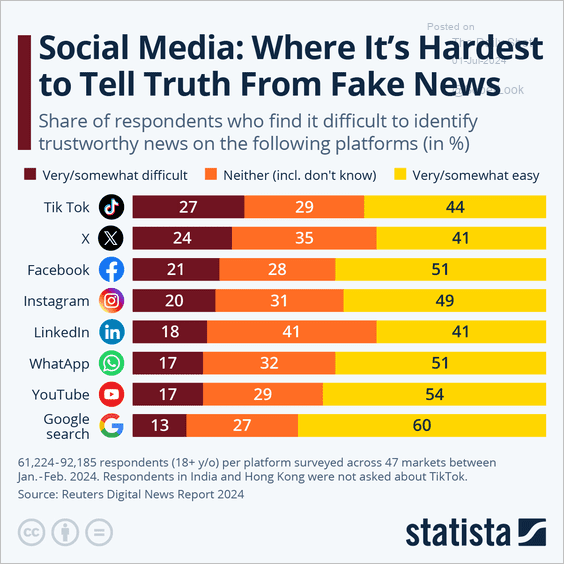 Source: Statista
7. Holidays with the highest rate of road fatalities:
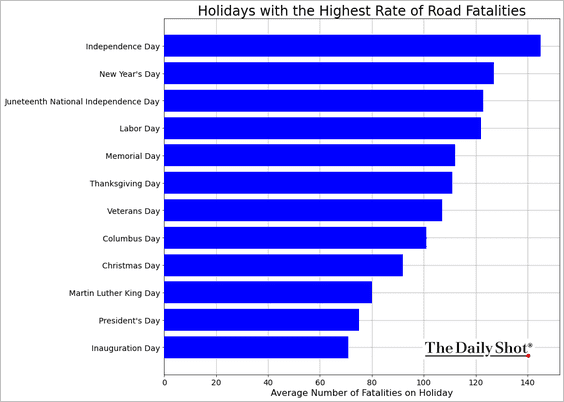 Source: Omega Law Group; National Highway Traffic Safety Administration’s FARS (Fatality Analysis Reporting System)
——————–
Back to Index