
The Daily Shot: 02-Jul-24
• The United States
• The United Kingdom
• The Eurozone
• Europe
• Japan
• China
• Emerging Markets
• Cryptocurrency
• Energy
• Equities
• Credit
• Global Developments
• Food for Thought
As a reminder, The Daily Shot will not be published this Thursday and Friday (July 4th and 5th).
The United States
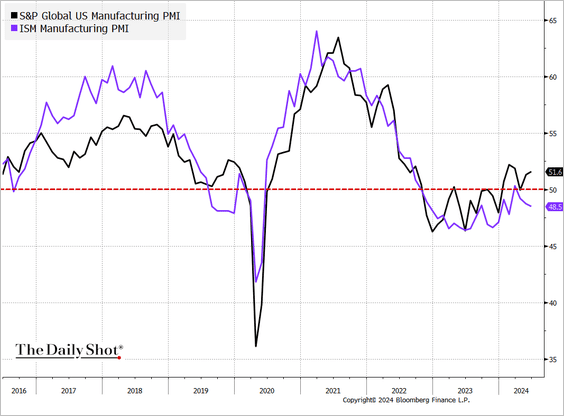
1. The ISM Manufacturing PMI held in contraction territory in June, …
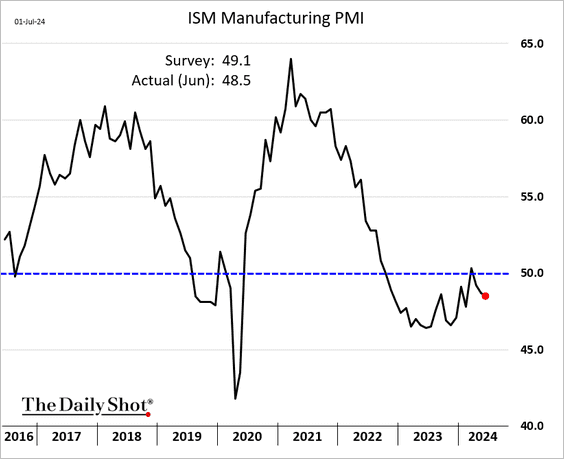
… diverging from the manufacturing PMI reported by S&P Global.
 Source: @TheTerminal, Bloomberg Finance L.P.
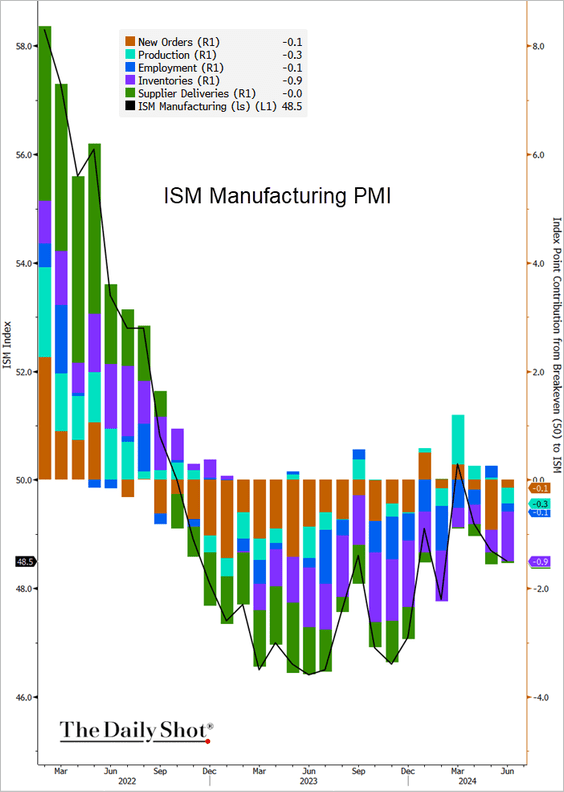
• This chart shows the contributions to the headline index.
 Source: @TheTerminal, Bloomberg Finance L.P.
– Inventory destocking dragged down the headline index, …
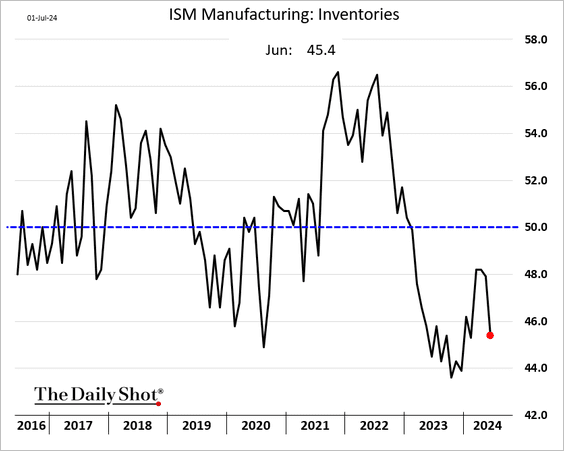
… a trend observed across S&P 500 companies.
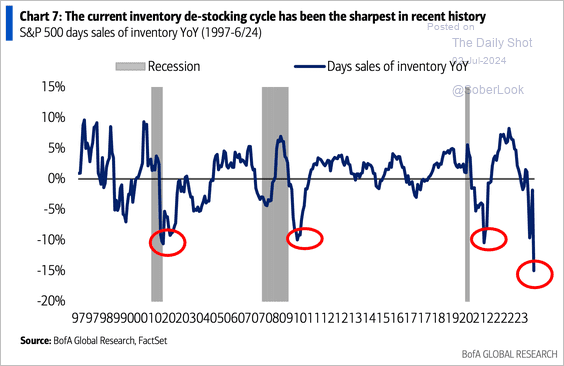 Source: BofA Global Research; @dailychartbook
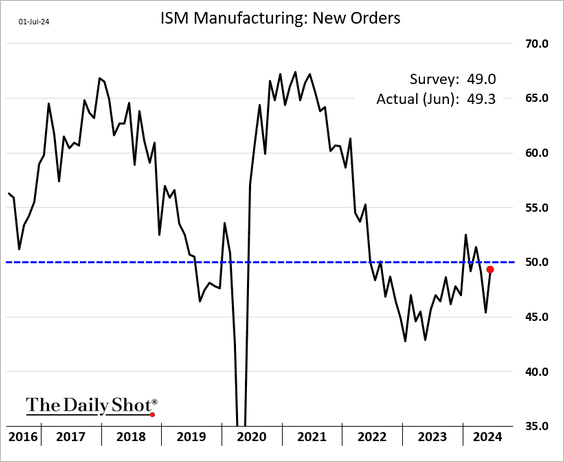
– New orders almost stabilized last month.
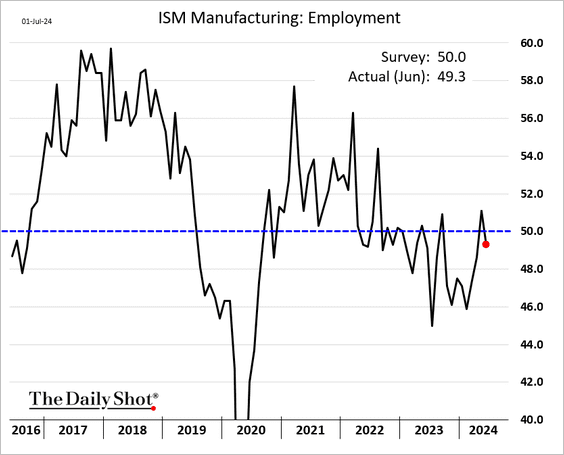
– The employment index was back in contraction territory.
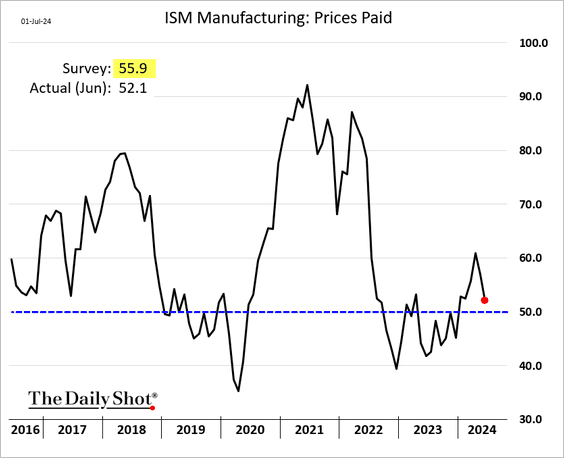
– Price pressures eased.
• The orders-inventories spread points to a bounce in the headline ISM index.
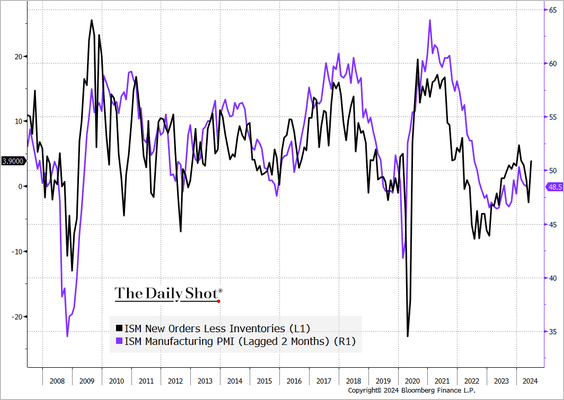 Source: @TheTerminal, Bloomberg Finance L.P.
• Based on the cyclicals-to-defensives ratio, the market anticipates a strengthening in US manufacturing activity.
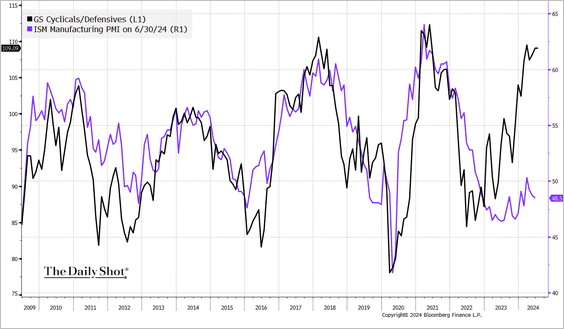 Source: @TheTerminal, Bloomberg Finance L.P.
——————–
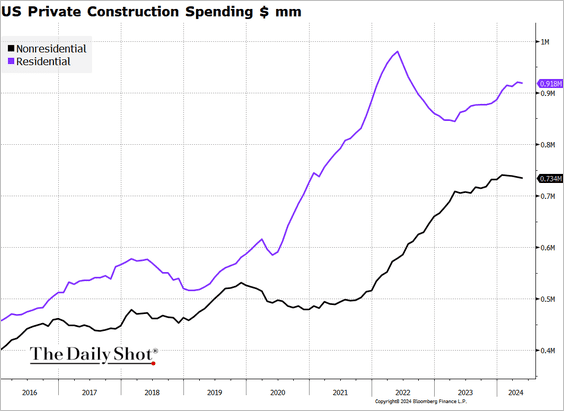
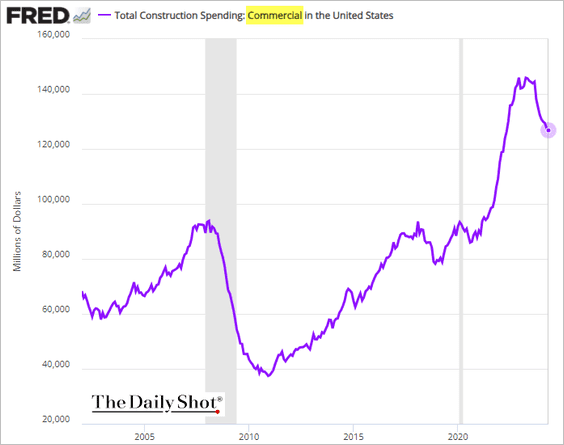
2. Construction spending unexpectedly dropped in May, …
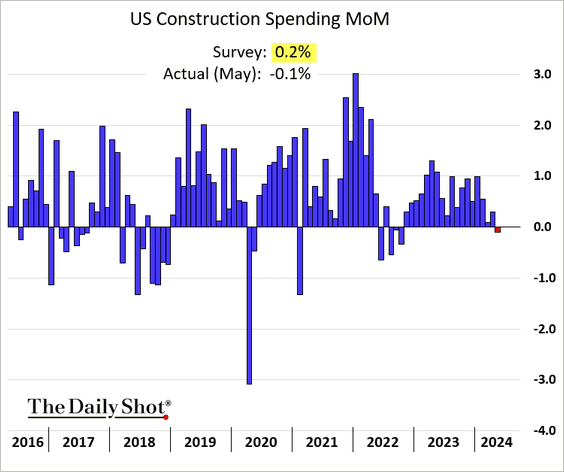
… with declines observed in private residential and nonresidential sectors.
 Source: @TheTerminal, Bloomberg Finance L.P.
• Spending on commercial real estate projects continues to decline.
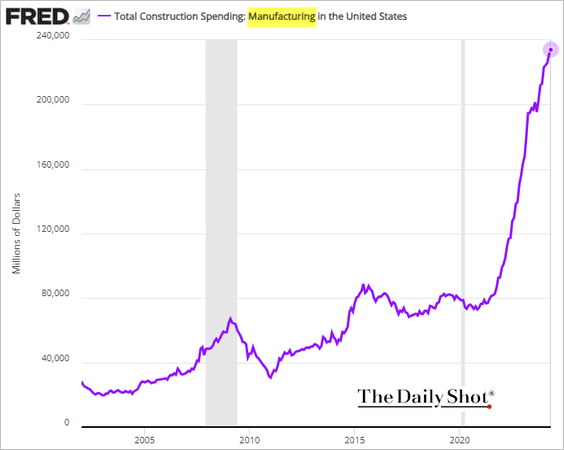
• Construction expenditures in manufacturing keep rising.
——————–
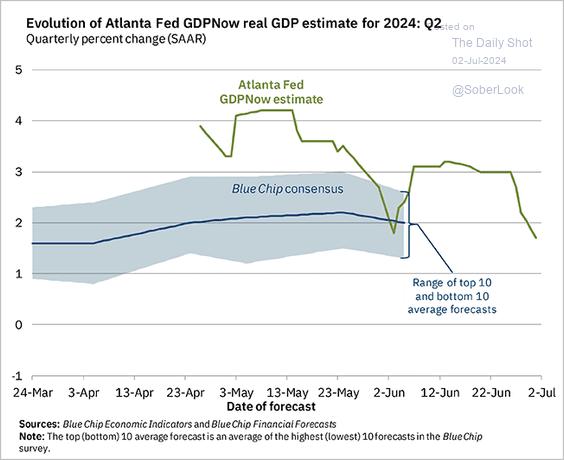
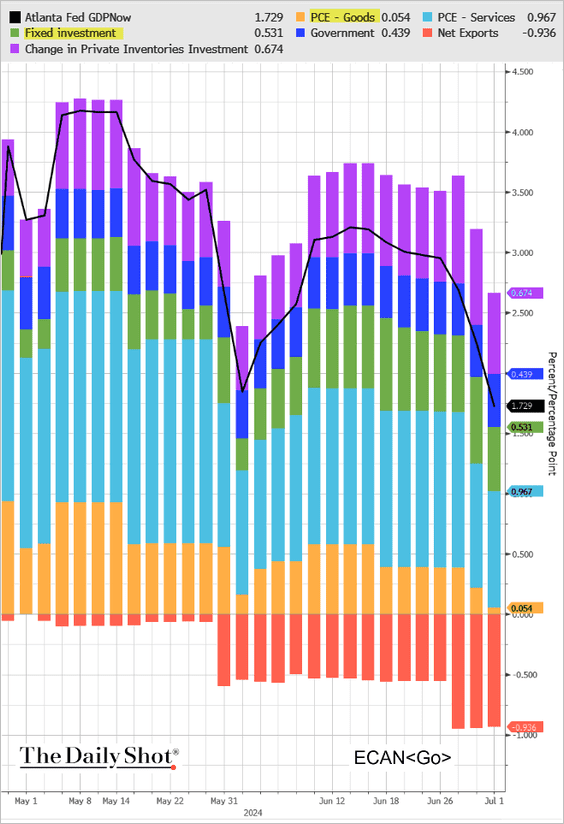
3. Weak construction spending, along with estimates of lower consumer spending on goods, further reduced the Atlanta Fed’s GDPNow estimate for Q2 growth (2 charts).
 Source: Federal Reserve Bank of Atlanta
 Source: @TheTerminal, Bloomberg Finance L.P.
——————–
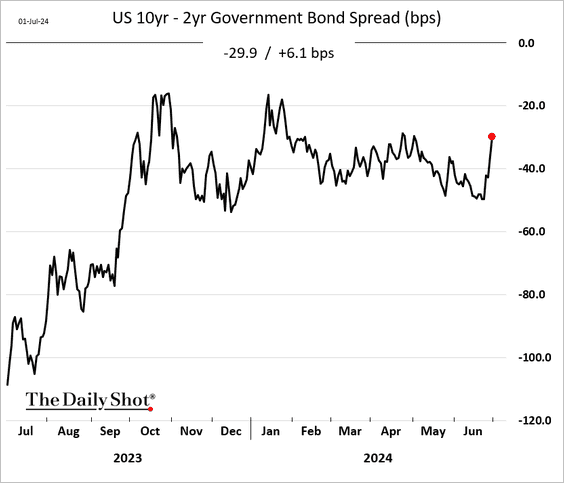
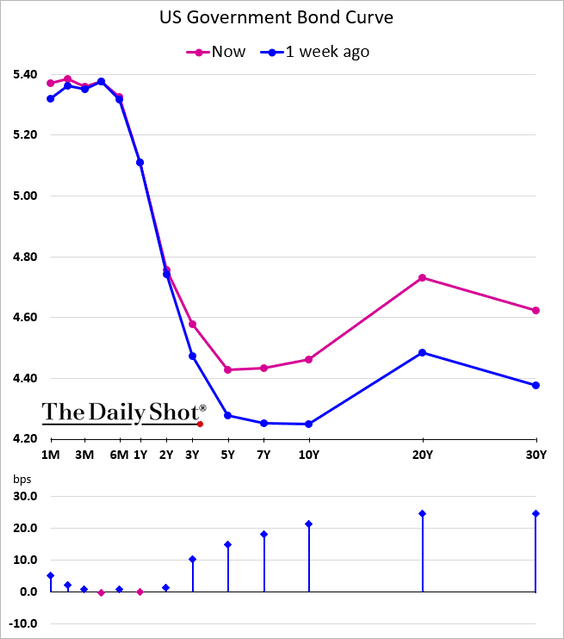
4. The Treasury curve has been steepening in recent days due to resurfacing concerns about the US fiscal outlook.
——————–
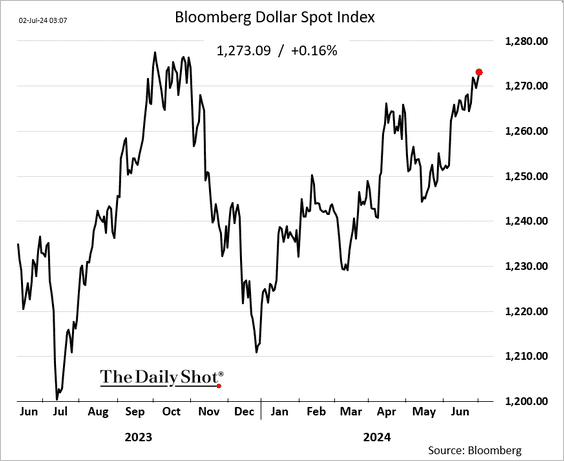
5. The US dollar continues to climb.
Back to Index
The United Kingdom
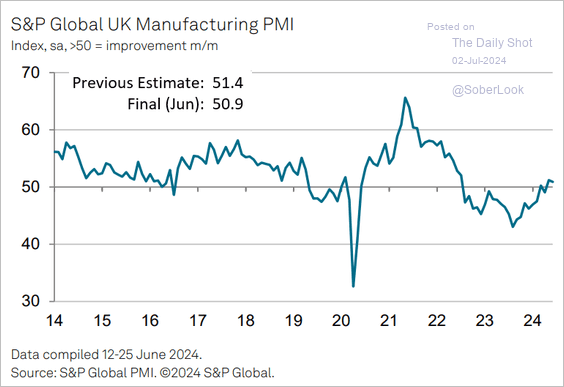
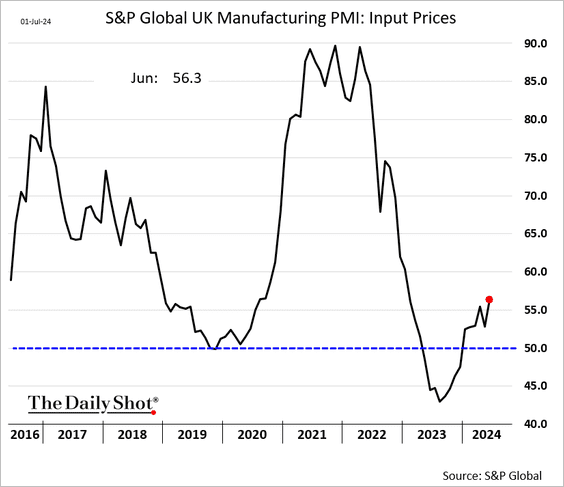
1. The final manufacturing PMI shows tepid factory activity growth in June.
 Source: S&P Global PMI
• Input price inflation has strengthened
——————–
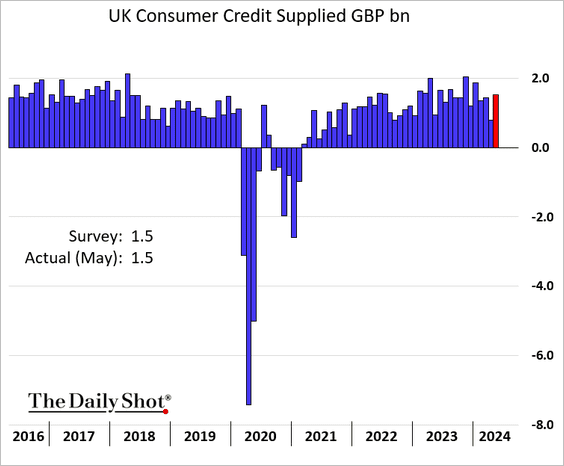
2. Consumer credit growth held up well in May.
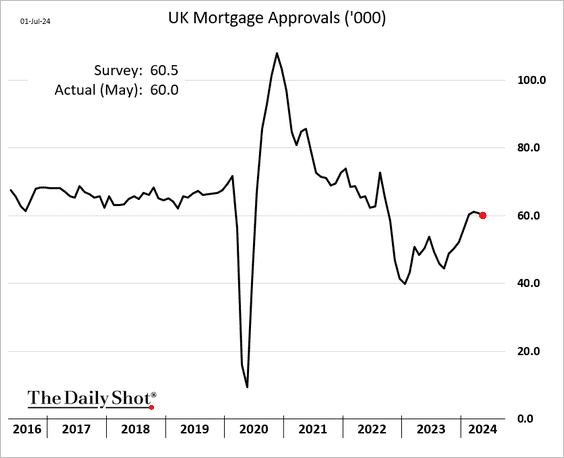
• Mortgage approvals edged lower.
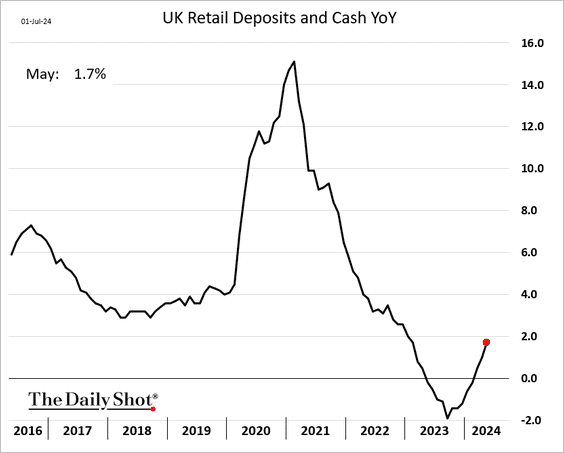
• Retail deposits are rebounding.
Back to Index
The Eurozone
1. The final PMI report confirmed the continued manufacturing slump in the euro area.
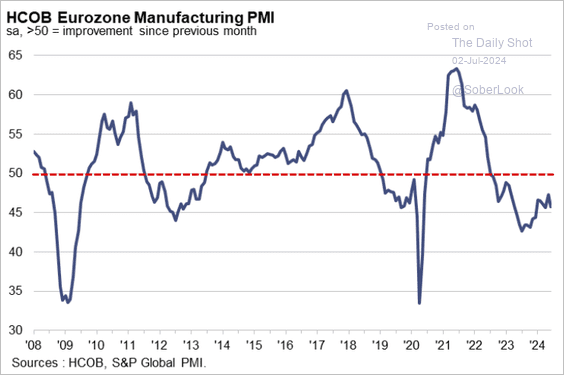 Source: S&P Global PMI
 Source: Reuters Read full article
• Italy (ongoing contraction):
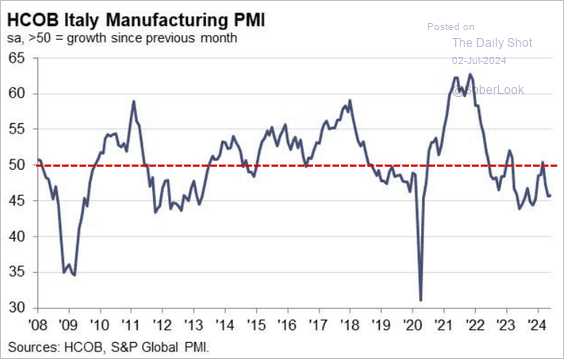 Source: S&P Global PMI
• The Netherlands (growth stalling):
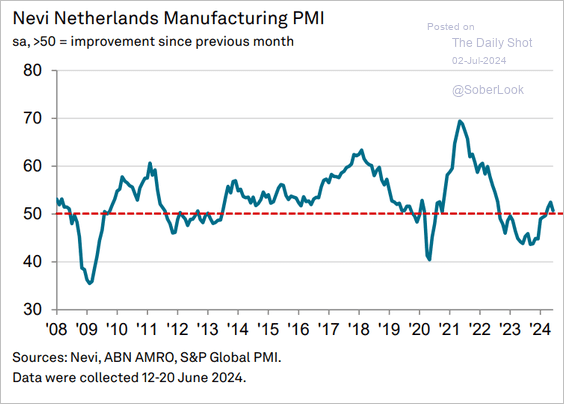 Source: S&P Global PMI
• Spain (robust growth):
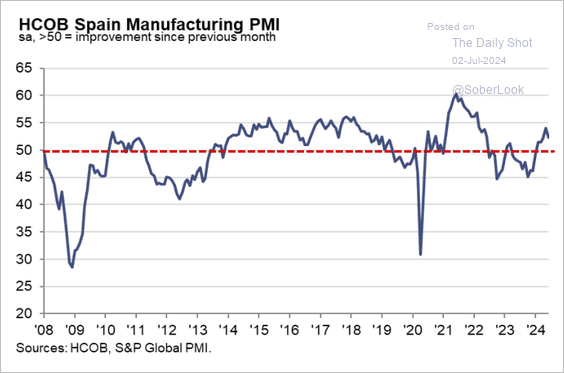 Source: S&P Global PMI
——————–
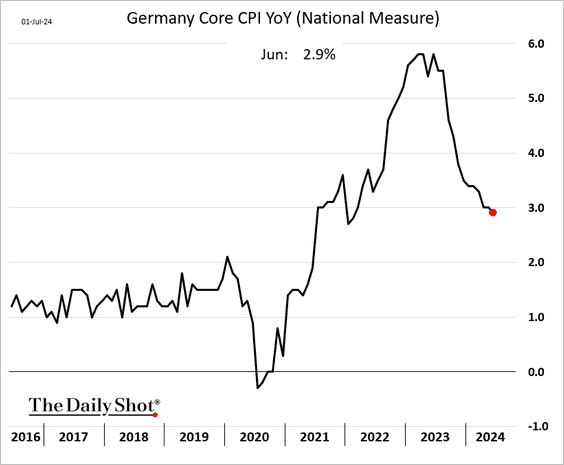
2. Germany’s inflation eased in June (as expected).
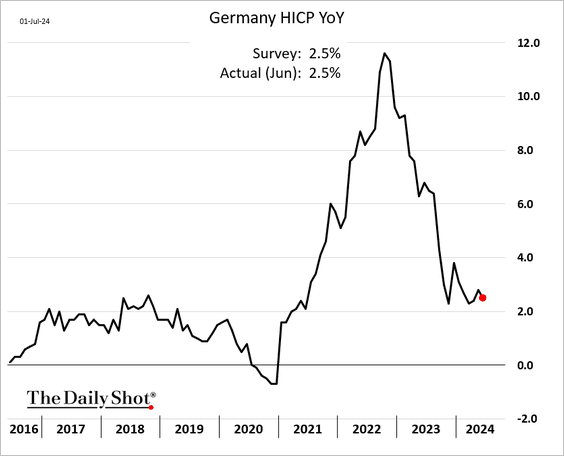
The national core CPI dipped below 3%.
——————–
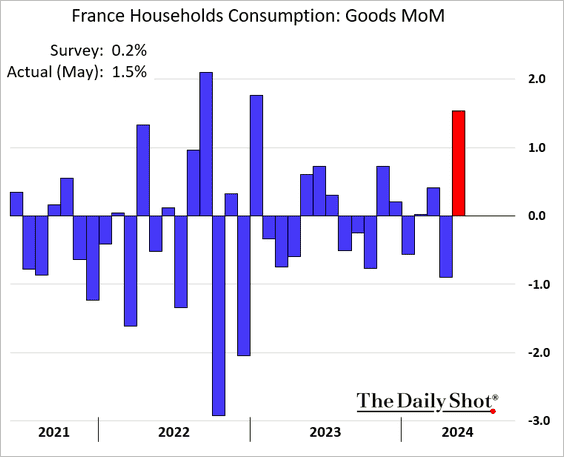
3. French goods consumption surged in May.
• Market risks related to France have eased.
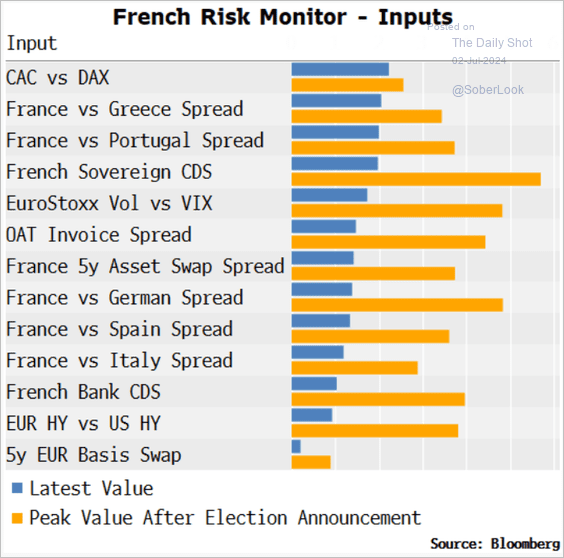 Source: Simon White, Bloomberg Markets Live Blog
——————–
4. The ECB is on pause this month but is expected to cut rates again in September and December.
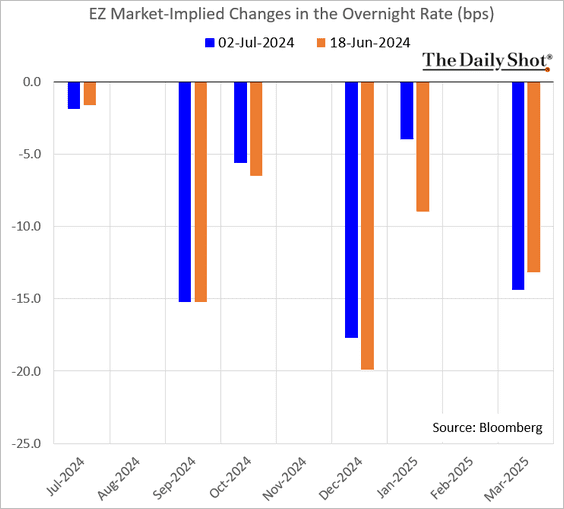
 Source: @economics Read full article
Back to Index
Europe
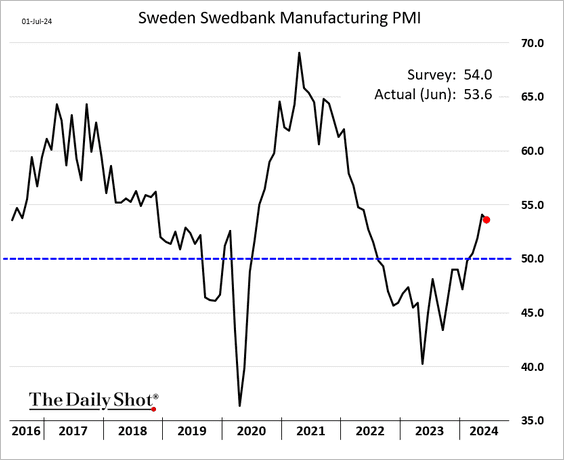
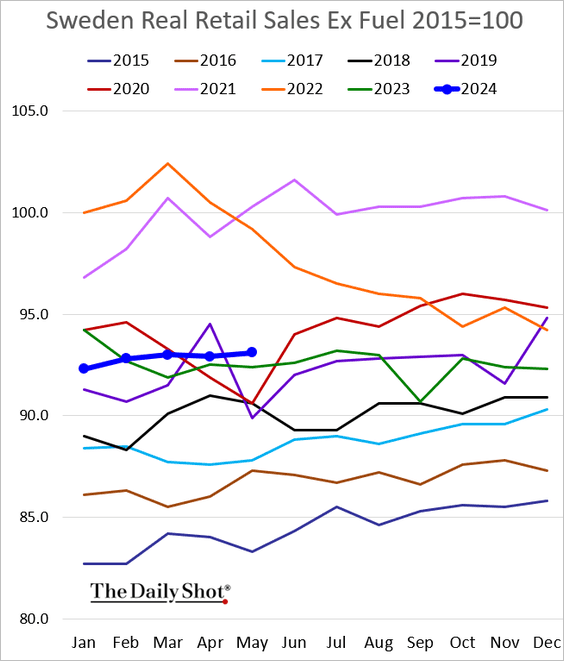
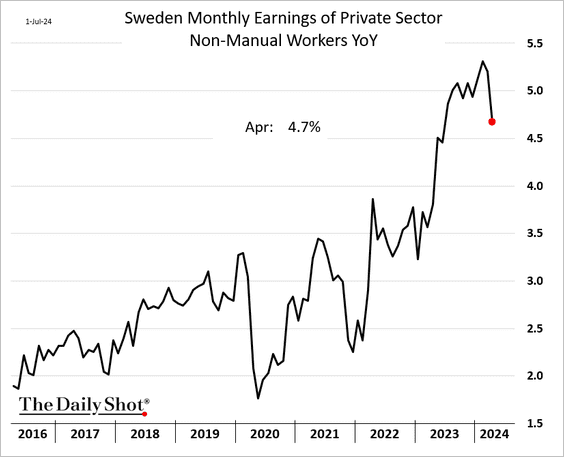
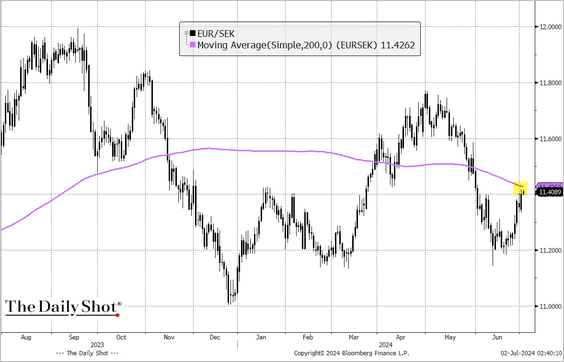
1. Let’s begin with Sweden.
• Manufacturing activity continues to expand.
• Retail sales remain above last year’s levels.
• Wage growth finally slowed in April.
• EUR/SEK is testing resistance at its 200-day moving average.
——————–
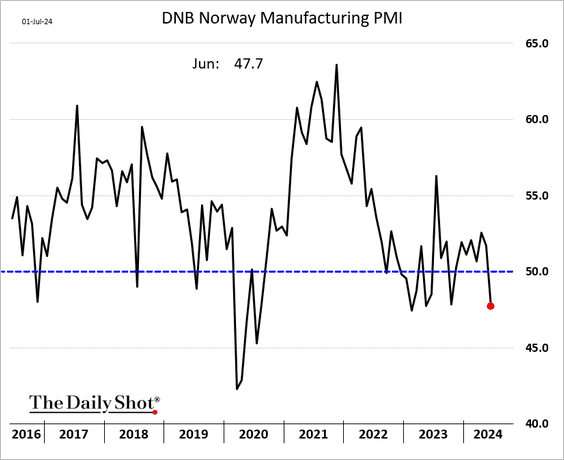
2. Norway’s factory activity dipped well into contraction territory in June.
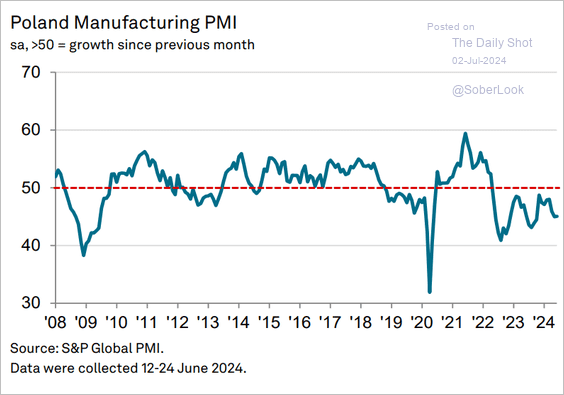
3. Central European manufacturing hubs continue to report soft factory activity (2 charts).
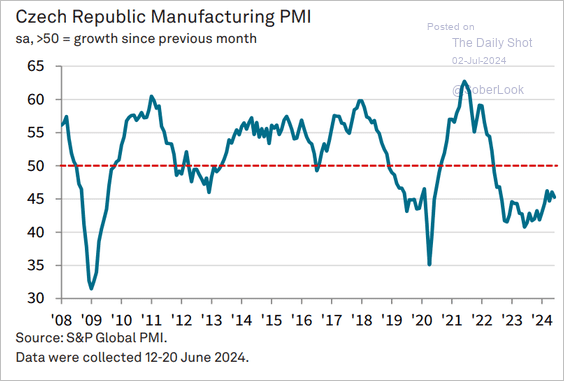 Source: S&P Global PMI
 Source: S&P Global PMI
——————–
4. Here is a look at migration flows across the EU.
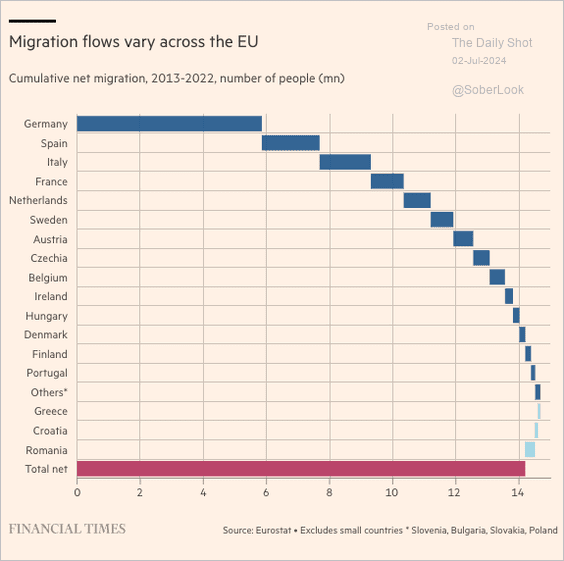 Source: @financialtimes Read full article
Back to Index
Japan
1. Dollar-yen is nearing 162.
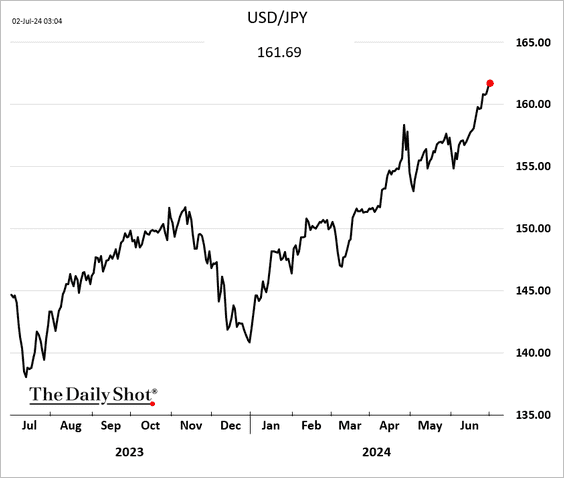
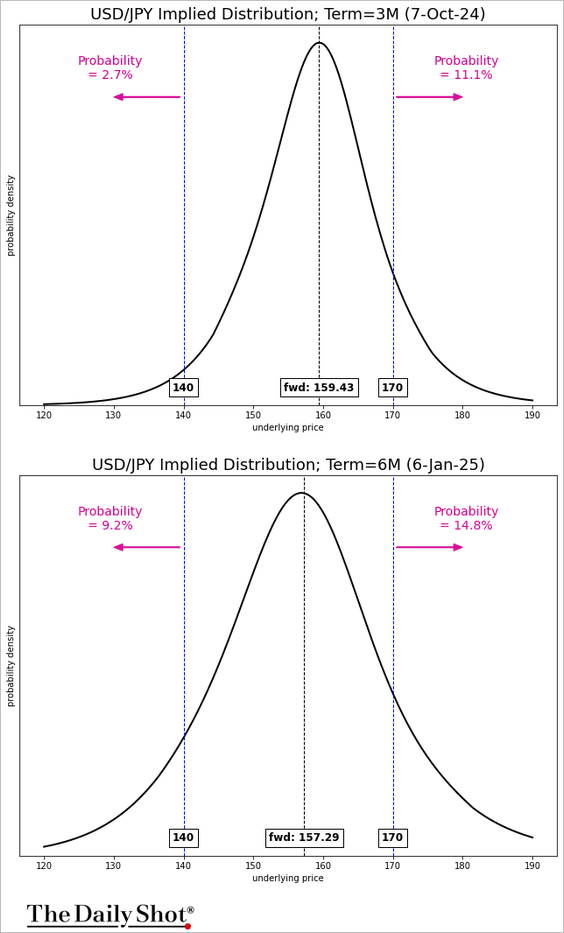
What is the options-implied probability of USD/JPY breaching 170 in 3 and 6 months?
——————–
2. A GDP contraction in 2024?
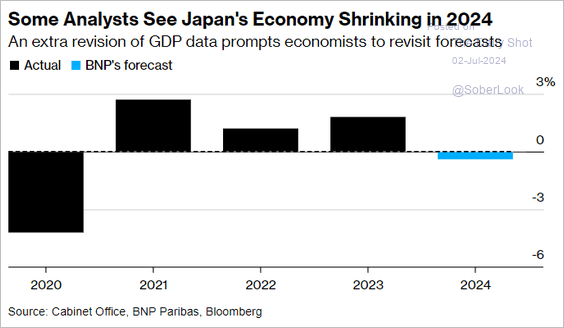 Source: @economics Read full article
Back to Index
China
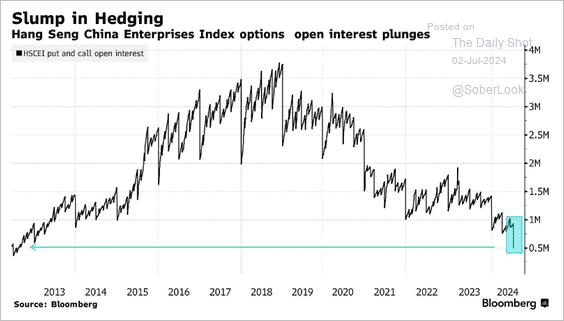
1. The open interest in options on the Hang Seng China Enterprises Index has dropped to its lowest level since 2012.
 Source: @markets Read full article
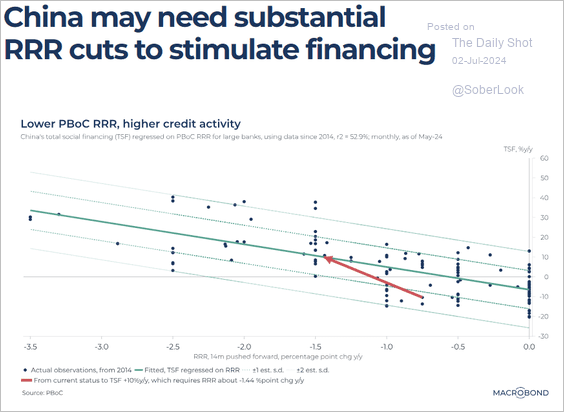
2. More RRR cuts are needed to jumpstart China’s credit growth.
 Source: Macrobond
Back to Index
Emerging Markets
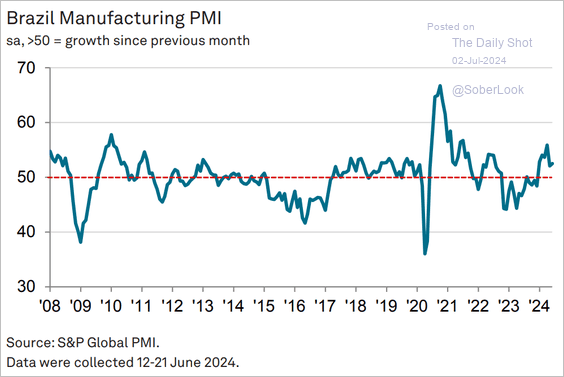
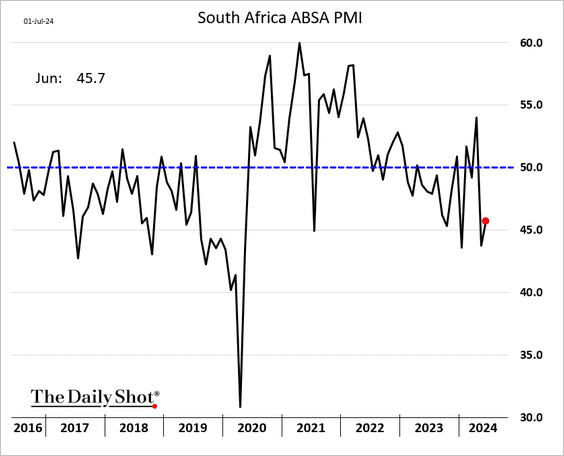
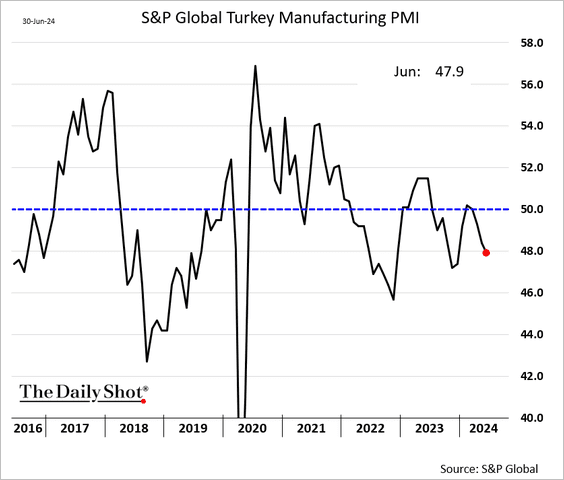
1. Let’s run through some June manufacturing PMI trends.
• Brazil (ongoing expansion):
 Source: S&P Global PMI
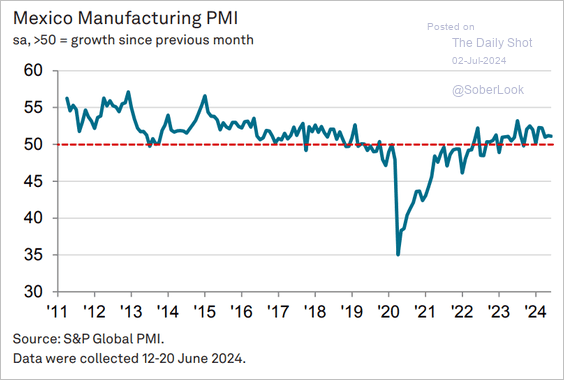
• Mexico (modest growth):
 Source: S&P Global PMI
• South Africa (ongoing contraction):
• Turkey (shrinking factory activity):
• Vietnam (rapid acceleration):
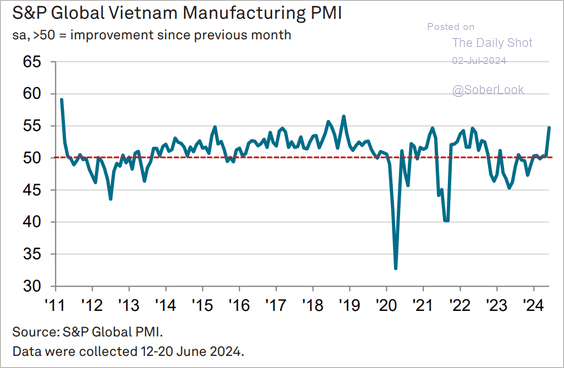 Source: S&P Global PMI
——————–
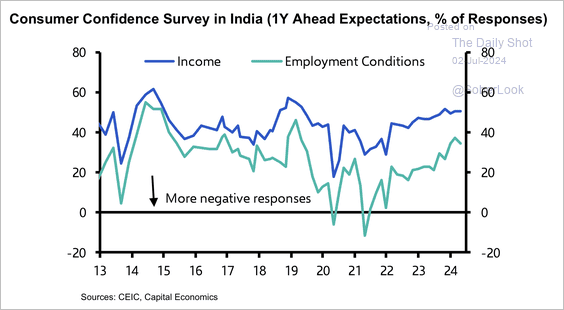
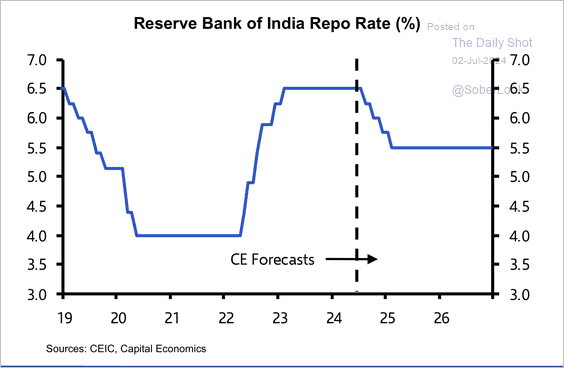
2. India’s consumer income and employment expectations remain close to their post-pandemic highs.
 Source: Capital Economics
• Capital Economics expects the RBI to begin its easing cycle in August with 75 basis points of cuts this year.
 Source: Capital Economics
——————–
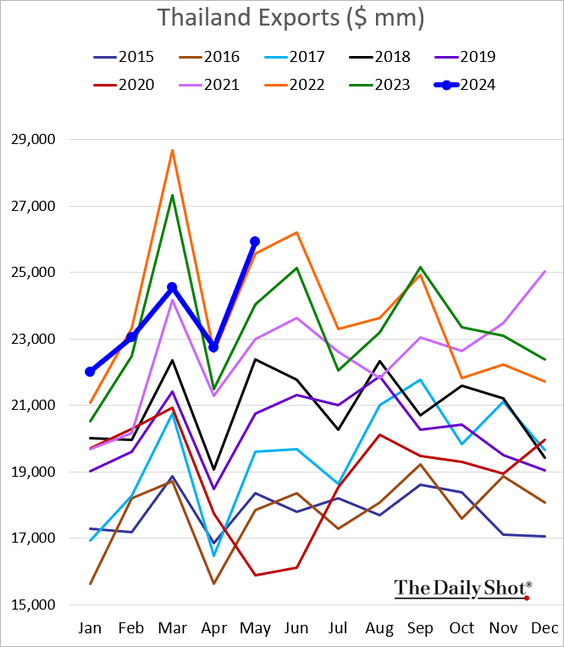
3. Thai exports hit a new high for May.
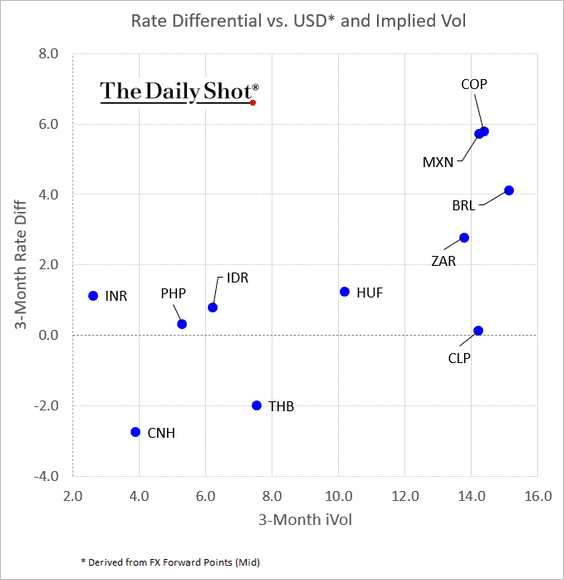
4. This scatterplot shows EM currency rate differentials vs. USD and implied volatility.
Back to Index
Cryptocurrency
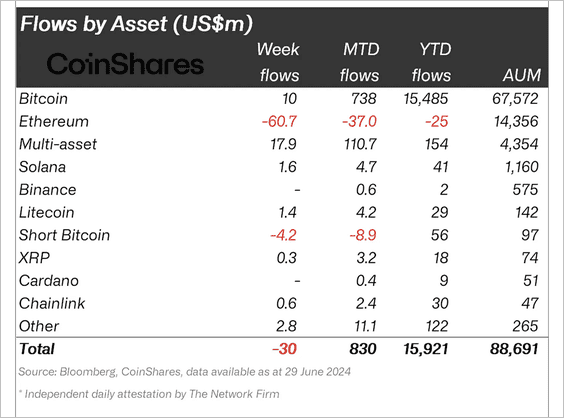
1. Crypto funds saw a third consecutive week of minor outflows led by Ethereum-focused funds. (2 charts)
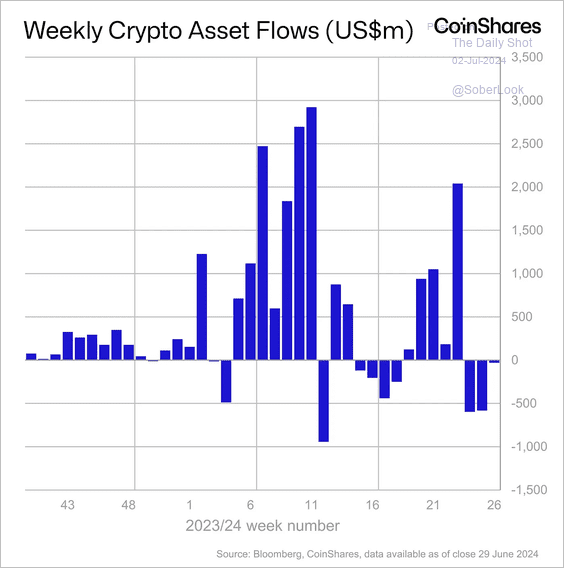 Source: CoinShares Read full article
 Source: CoinShares Read full article
——————–
2. ETFs now control a significant share of Bitcoin supply.
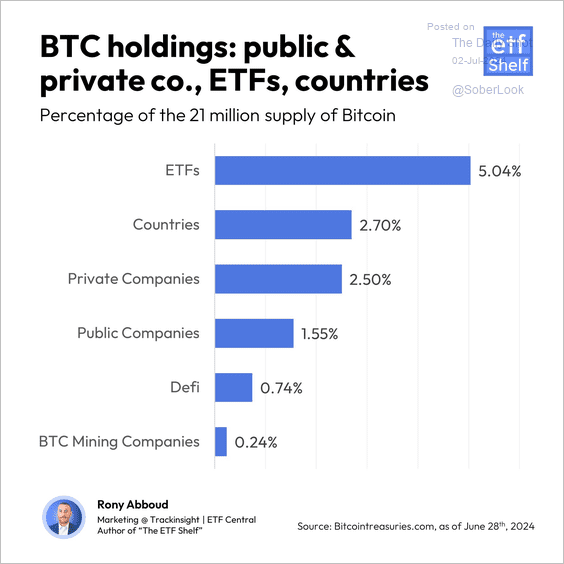 Source: The ETF Shelf
3. This chart shows relative strength and momentum of top altcoins versus bitcoin over the past 12 weeks. Chainlink (LINK), XRP, and Uniswap (UNI) are improving in relative terms.
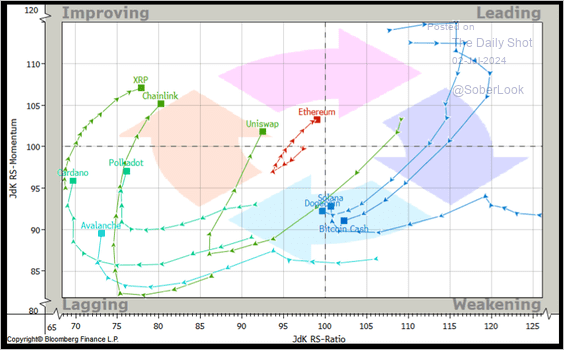 Source: @StocktonKatie
Back to Index
Energy
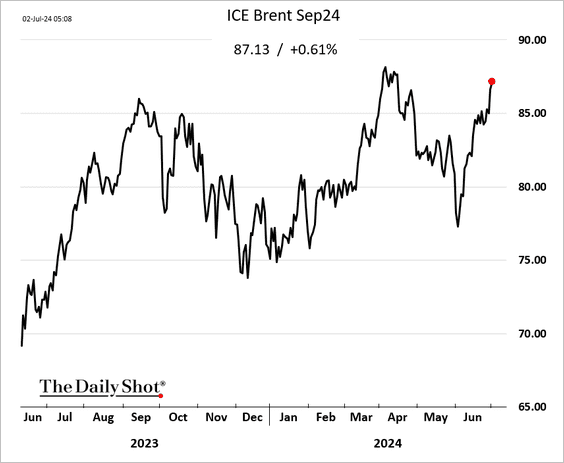
1. Brent crude is trading above $87/bbl.
2. The US is increasingly running an energy surplus.
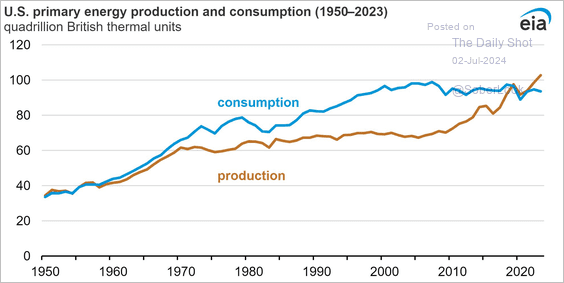 Source: @EIAgov
3. Here is a look at the levelized costs of electricity in the US for newly-built power generation assets.
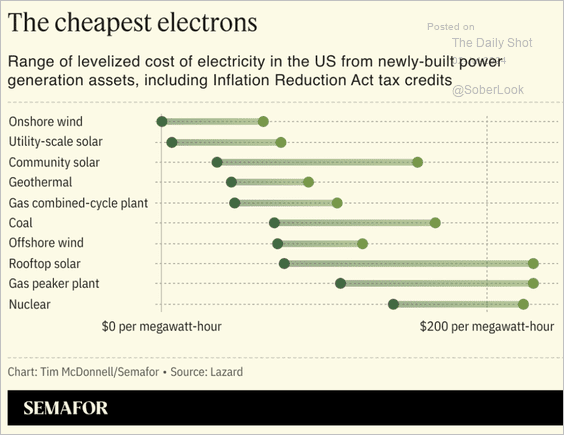 Source: Semafor
Back to Index
Equities
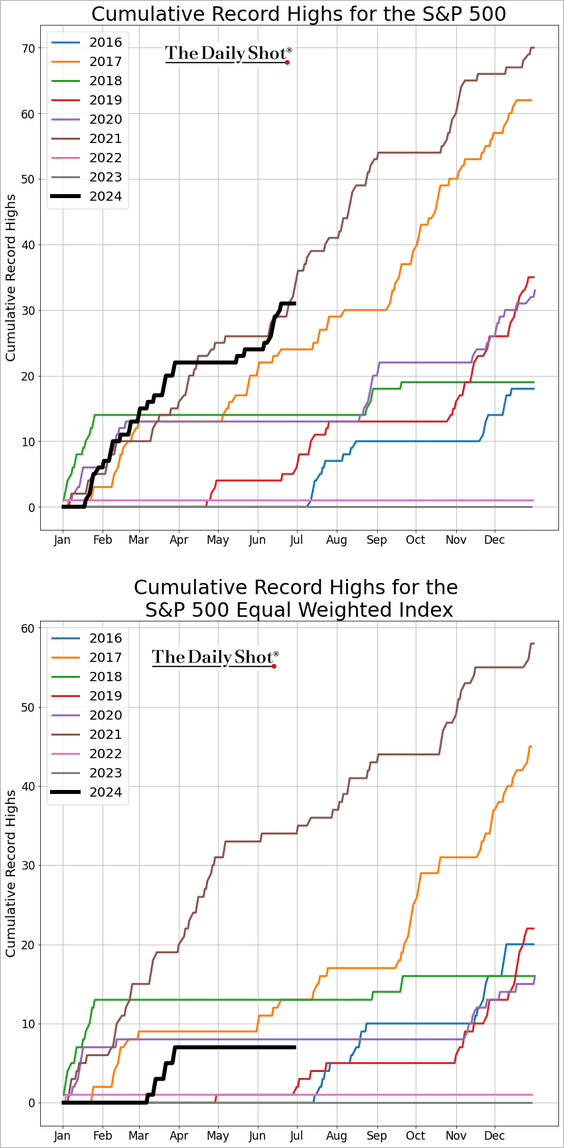
1. The Nasdaq Composite and the Magnificent 7 started the quarter with another record high.
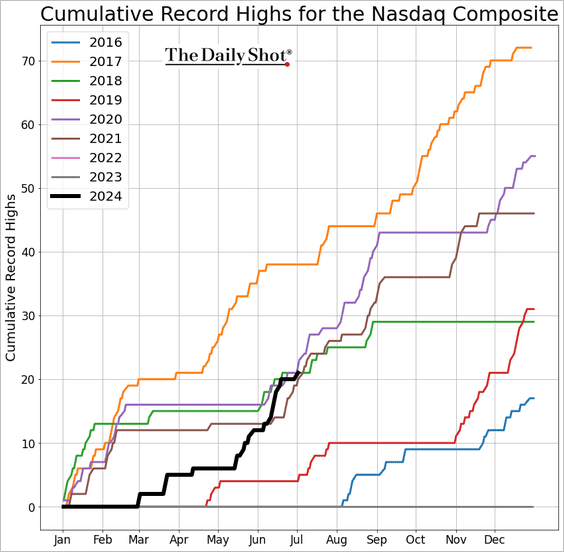
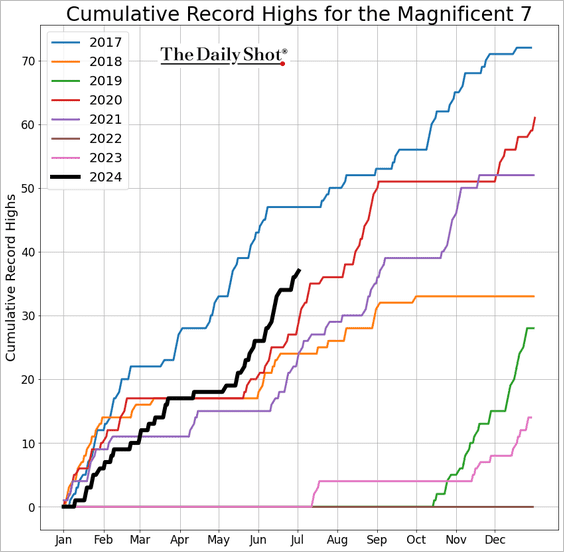
Below are the trends in record highs for the S&P 500 and the S&P 500 equal-weight index.
——————–
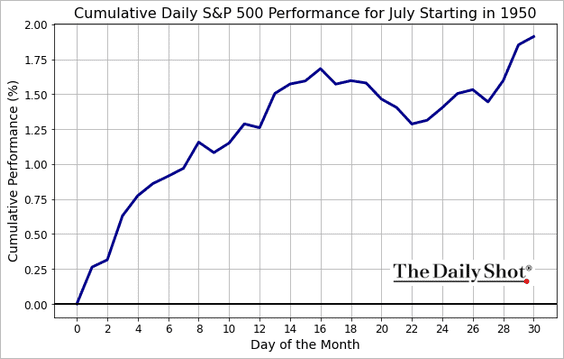
2. July tends to be a good month for stocks.
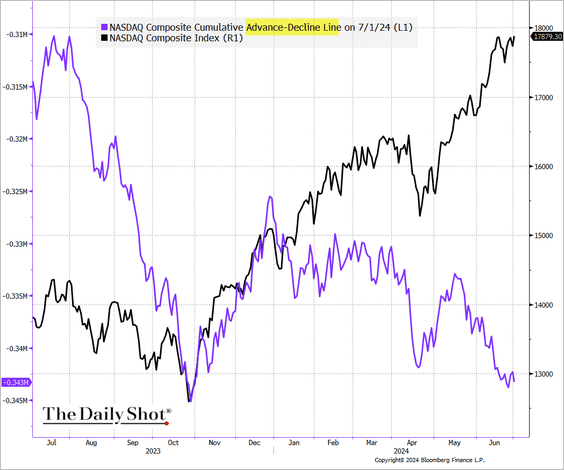
3. The divergence between index prices and breadth could be signaling a pullback.
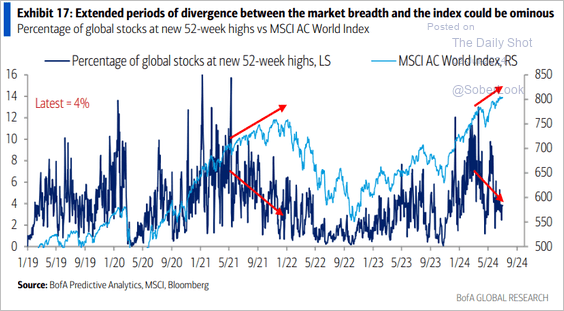 Source: BofA Global Research
• % of S&P 500 members above their 200-day moving average:
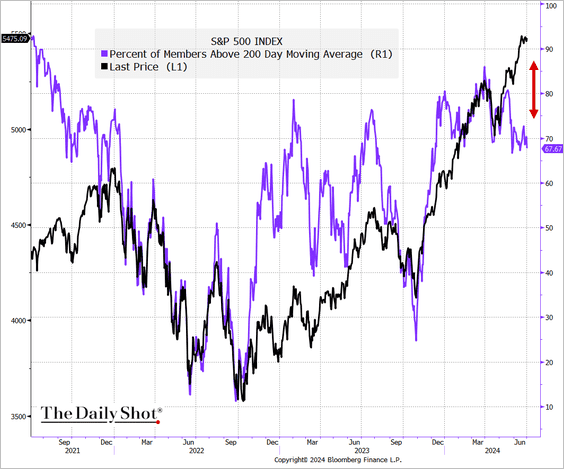 Source: @TheTerminal, Bloomberg Finance L.P.
• The Nasdaq Composite cumulative advance-decline line:
 Source: @TheTerminal, Bloomberg Finance L.P.
——————–
4. Typically, EPS projections ease going into the earnings season, but that hasn’t been the case for Q2 2024.
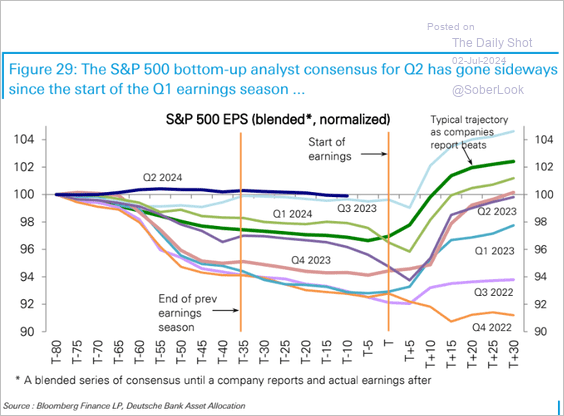 Source: Deutsche Bank Research
• Deutsche Bank anticipates robust EPS growth for the S&P 500 in the second quarter.
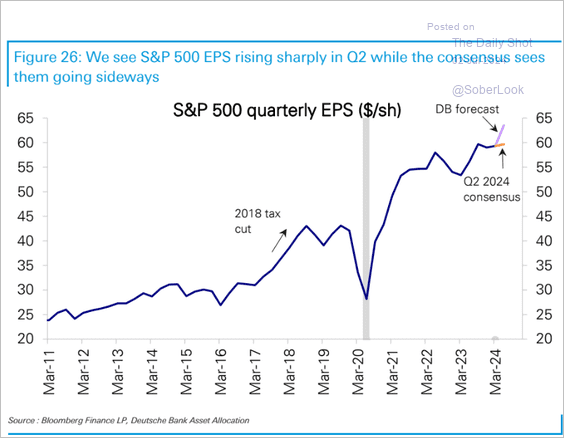 Source: Deutsche Bank Research
Here is an overview of the year-over-year EPS growth, showing expansion across most sectors.
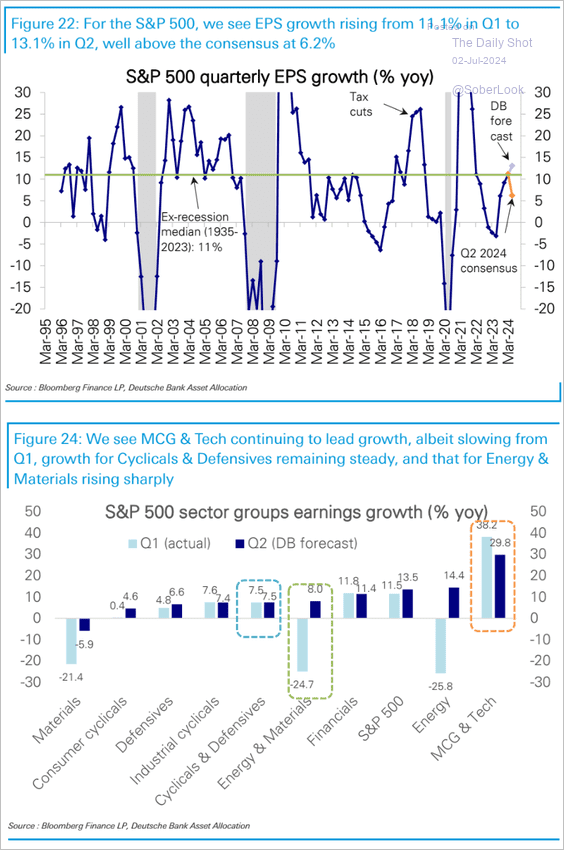 Source: Deutsche Bank Research
——————–
5. The market cap of US tech stocks has raced ahead of their share of the index earnings.
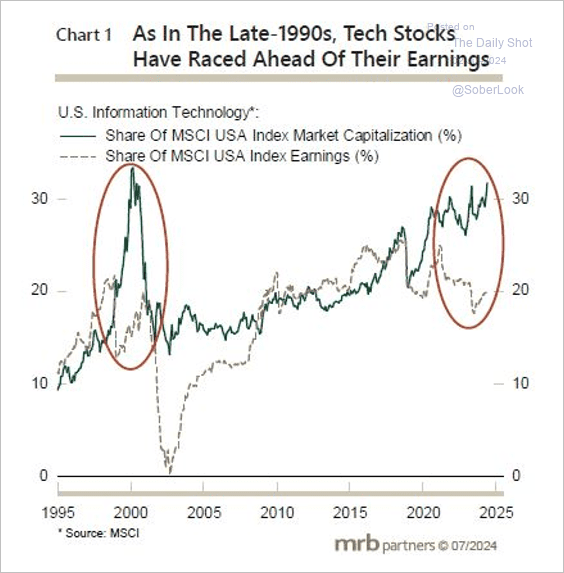 Source: MRB Partners
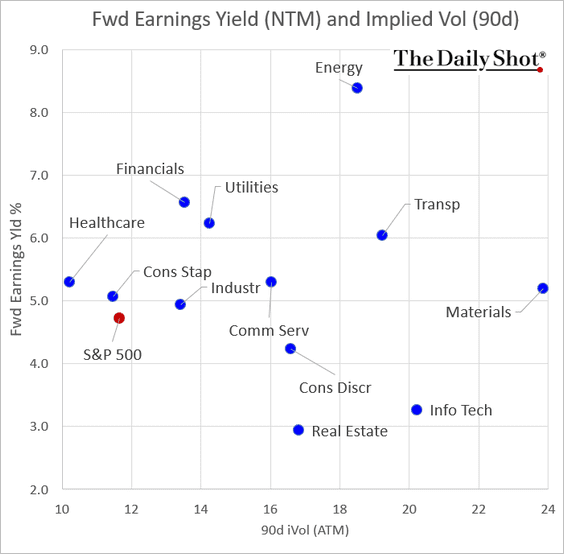
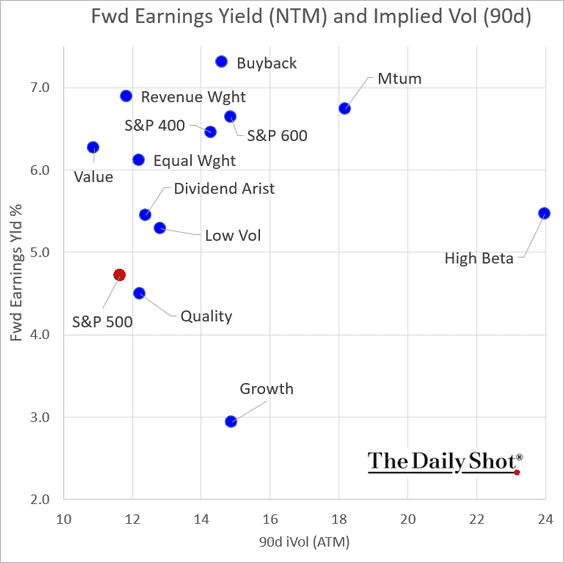
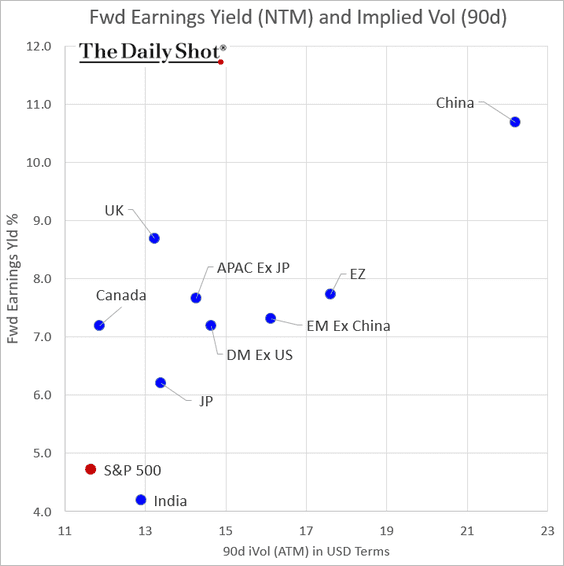
6. Next, we have the latest earnings yield and implied volatility data, reflecting projected performance versus perceived risk.
• Sectors:
• Factors/styles:
• International indices:
——————–
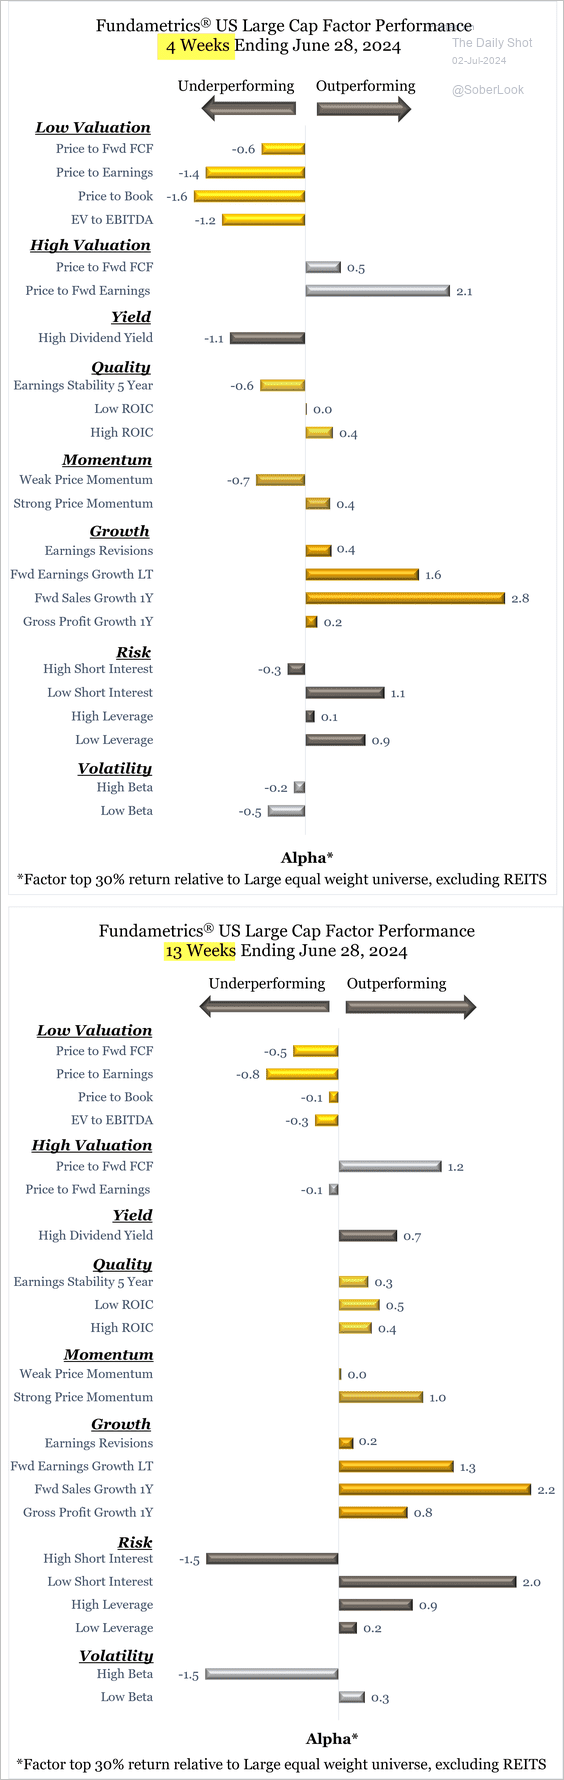
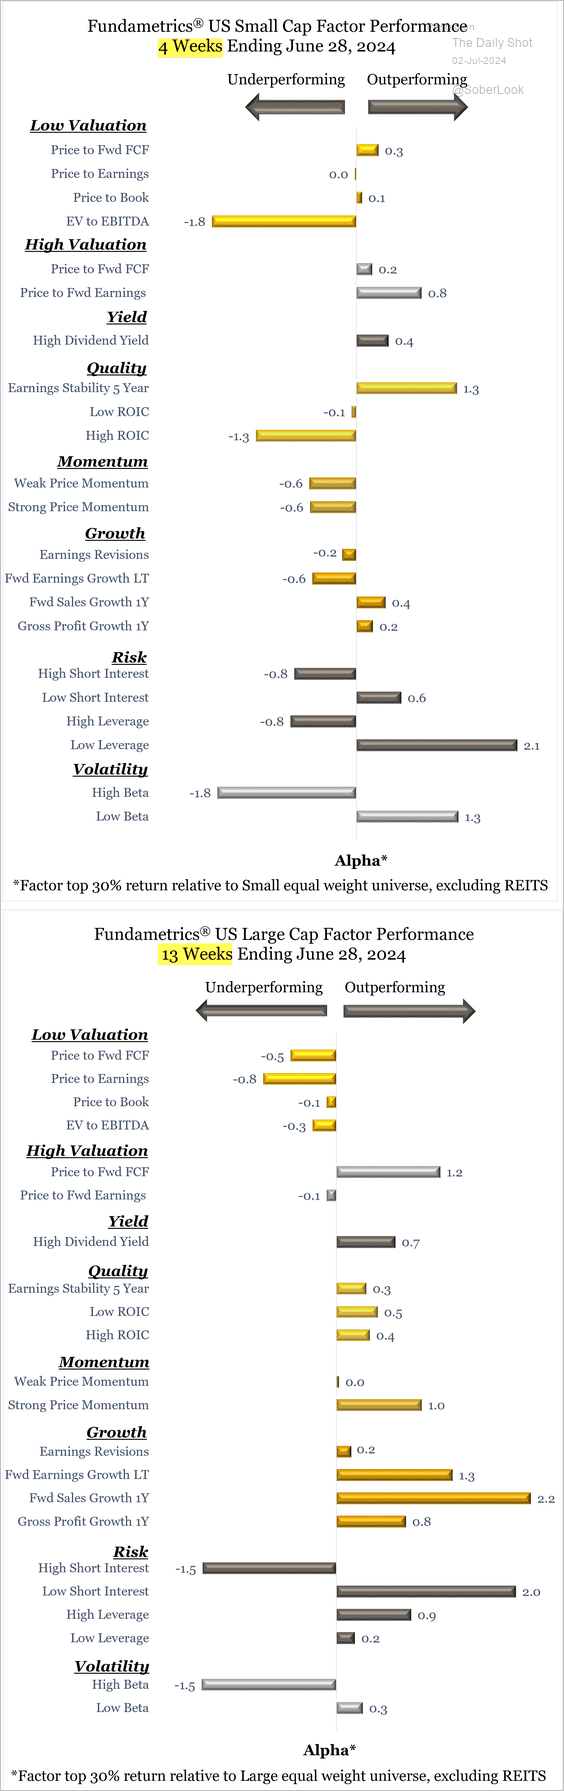
7. Finally, we present detailed performance data on equity factors for the past month and quarter.
• Large caps:
 Source: CornerCap Institutional
• Small caps:
 Source: CornerCap Institutional
Back to Index
Credit
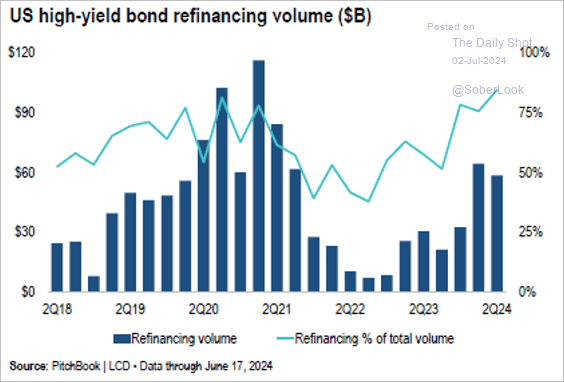
1. The refinancing trend in the US high-yield bond market has accelerated. Investors are chasing new-issue yields and spreads lower ahead of an expected Fed pivot to rate cuts, according to PitchBook.
 Source: PitchBook
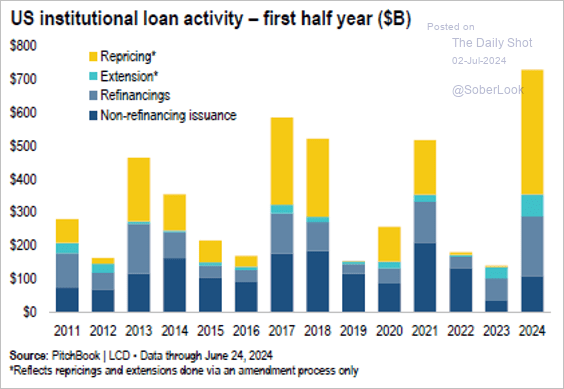
2. US leveraged loan activity advanced during the first half of the year as more companies repriced existing debt lower.
 Source: PitchBook
3. Coupons paid to CLO investors continue to dwindle – a possible result of the surge in new issuance over the past quarter.
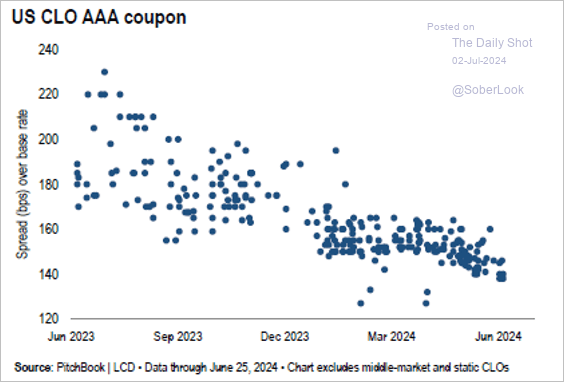 Source: PitchBook
• CLO ETFs have seen strong inflows.
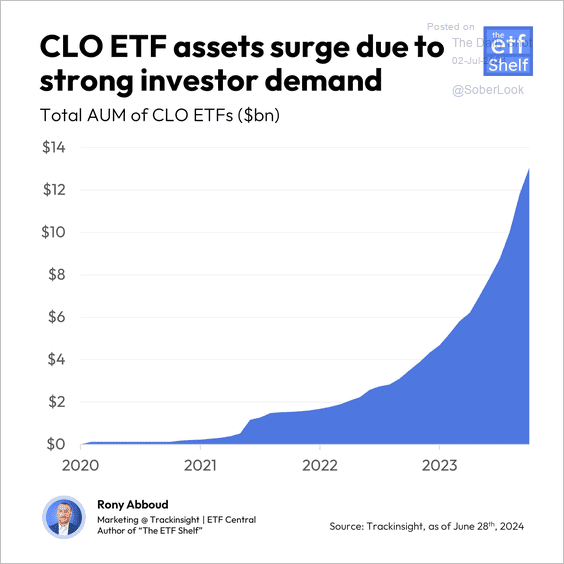 Source: The ETF Shelf
——————–
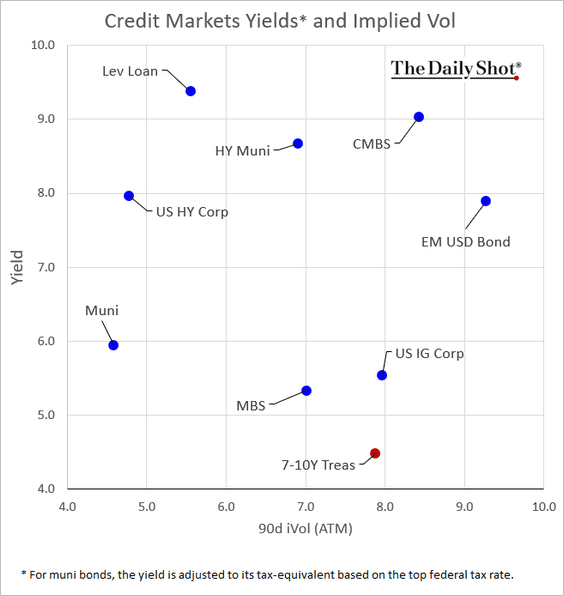
4. Finally, we have asset yields and implied volatility (projected performance versus perceived risk).
Back to Index
Global Developments
1. What percentage of central banks will be in easing mode by the end of the year (2 charts)?
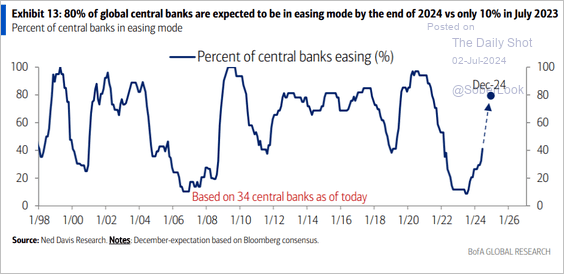 Source: BofA Global Research
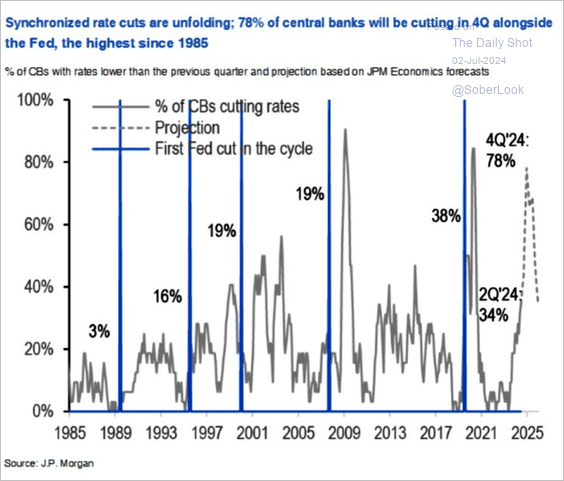 Source: JP Morgan Research; @WallStJesus
——————–
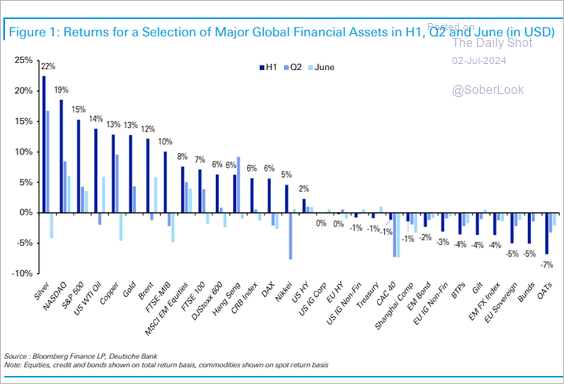
2. Silver led the way in Q2 despite a pullback in June, while gold, copper, and oil were high up on the list. Stocks held up, while French assets slumped.
 Source: Deutsche Bank Research
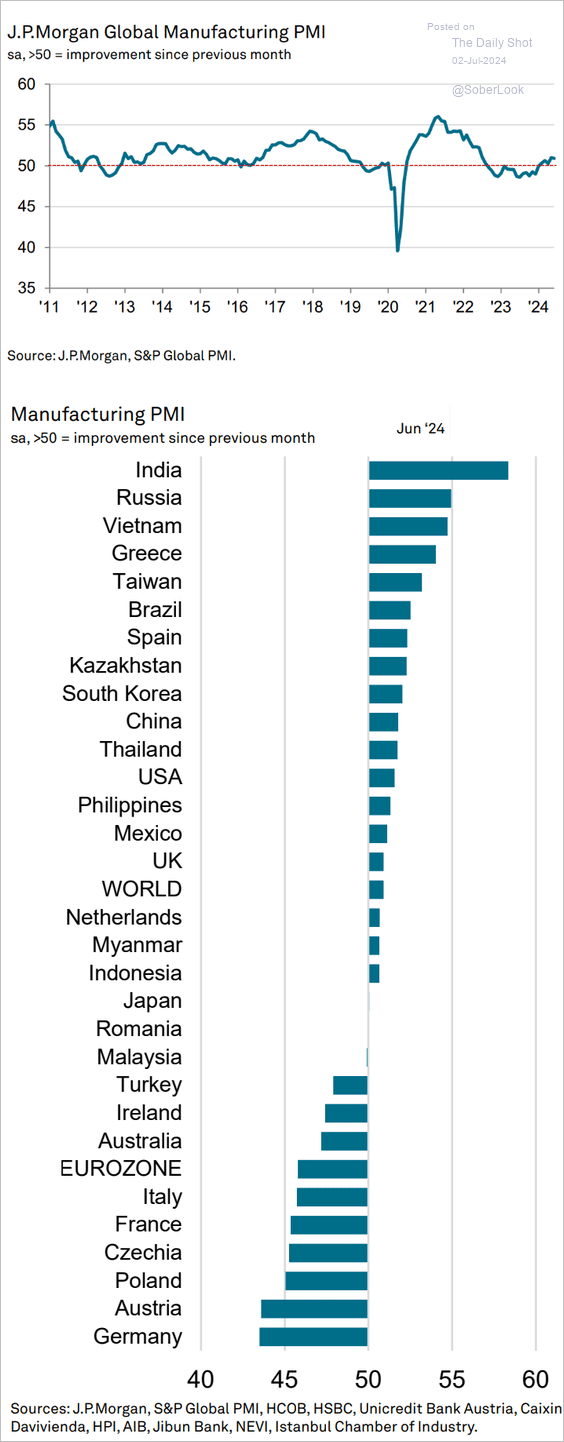
3. Global factory activity continued to expand in June. The second panel shows PMI measures by country/region.
 Source: S&P Global PMI
——————–
Food for Thought
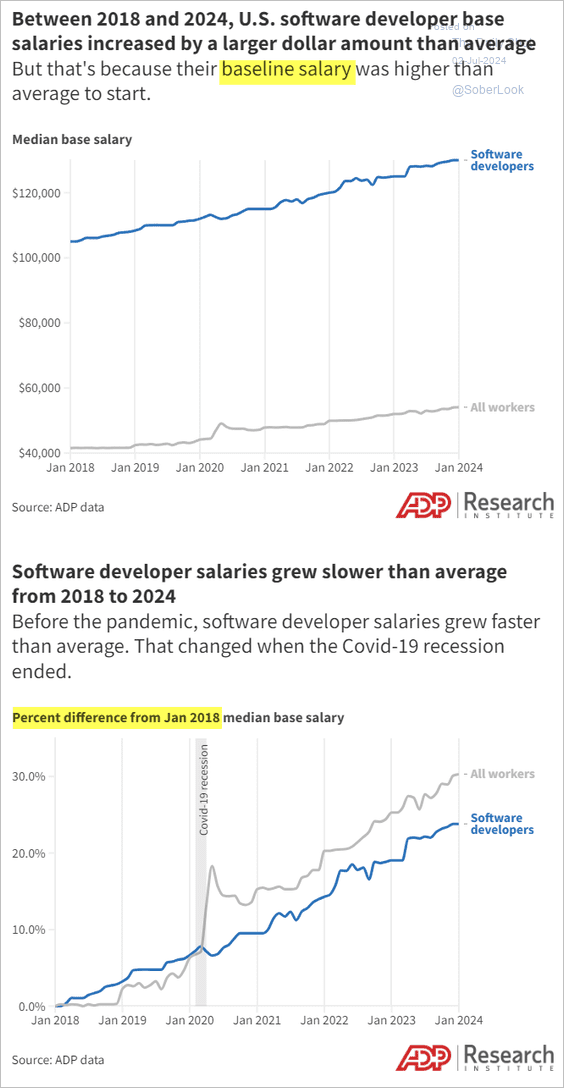
1. Software developer salaries:
 Source: ADP Research Institute
• Software developer employment trend:
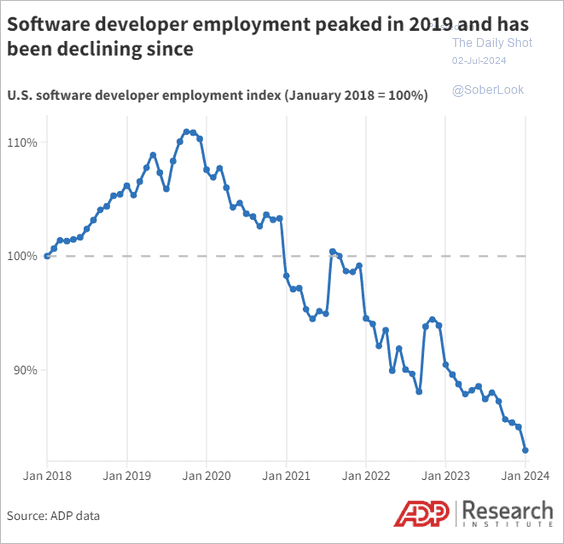 Source: ADP Research Institute
——————–
2. Reported incidents and hazards from generative AI:
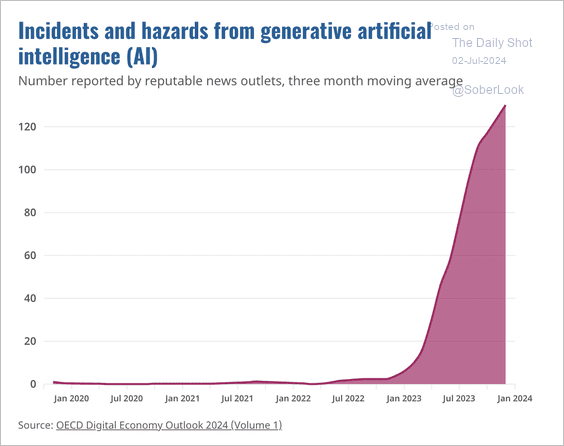 Source: OECD Read full article
3. US migrants from outside Latin America:
 Source: Reuters Read full article
4. Average time to begin operations for nuclear plants in selected countries:
![]() Source: MacroPolo Read full article
Source: MacroPolo Read full article
5. Medical malpractice cases:
 Source: John Fitch
6. Password overload:
 Source: Statista
——————–
Back to Index