
The Daily Shot: 13-May-24
• The United States
• Canada
• The United Kingdom
• Europe
• Japan
• China
• Emerging Markets
• Commodities
• Equities
• Credit
• Global Developments
• Food for Thought
The United States
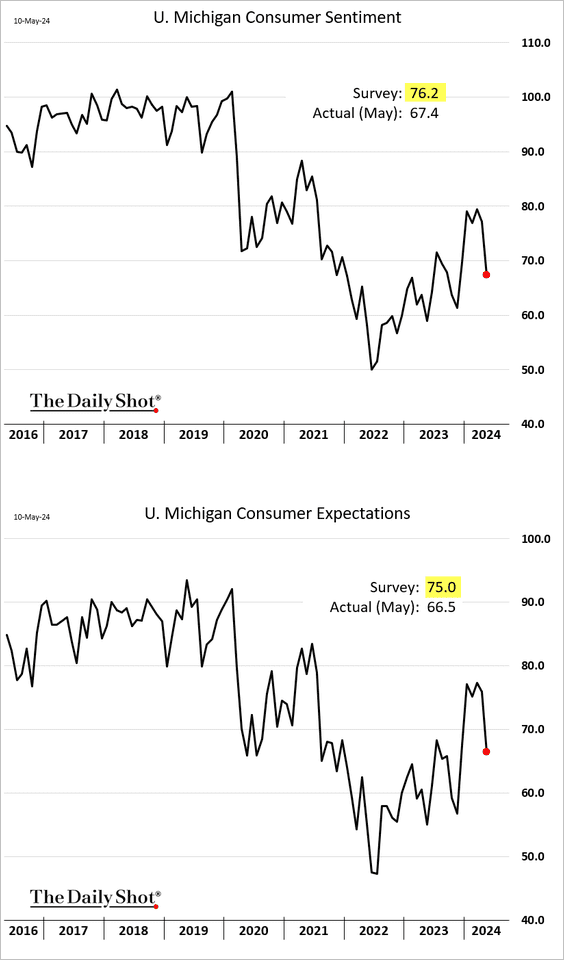
1. Consumer sentiment deteriorated more than expected at the beginning of May, according to the latest U. Michigan survey.
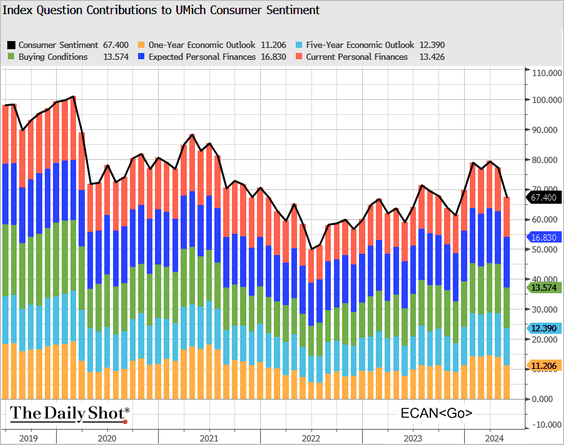
Here are the contributions.
 Source: @TheTerminal, Bloomberg Finance L.P.
• Households are increasingly concerned about higher unemployment ahead, which often serves as a leading indicator for the unemployment rate.
 Source: Pantheon Macroeconomics
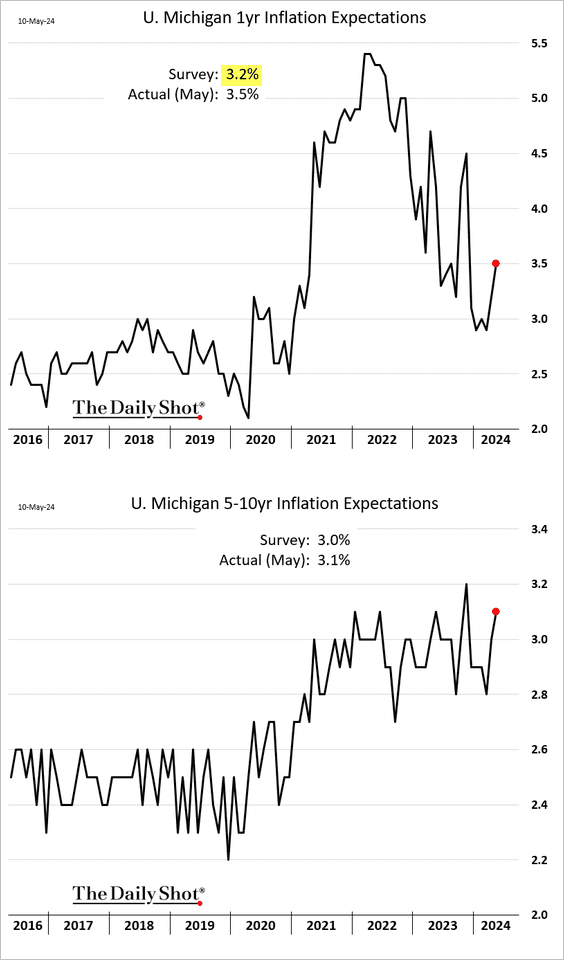
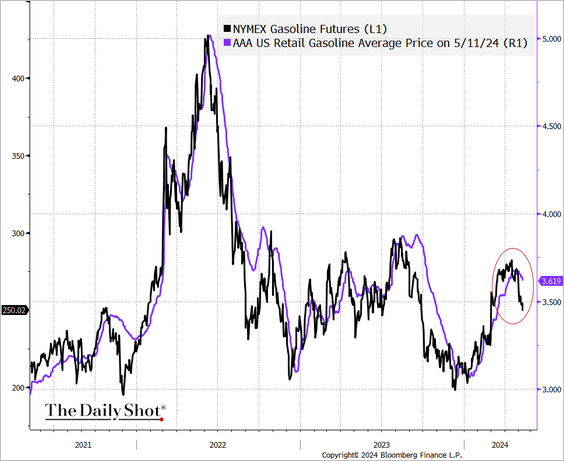
• Inflation expectations jumped with gasoline prices.
However, futures point to lower prices at the pump over the next few days.
 Source: @TheTerminal, Bloomberg Finance L.P.
• Real household income expectations tumbled.

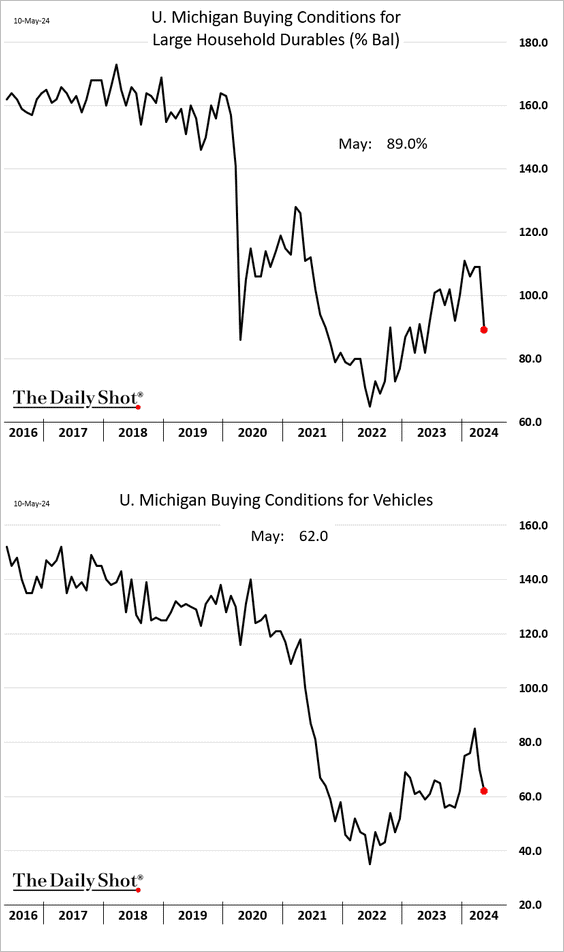
• Durables buying conditions are lower.
• Buying conditions for houses hit a record low.

– Homeowners haven’t been this upbeat on longer-term home price appreciation since 2007.

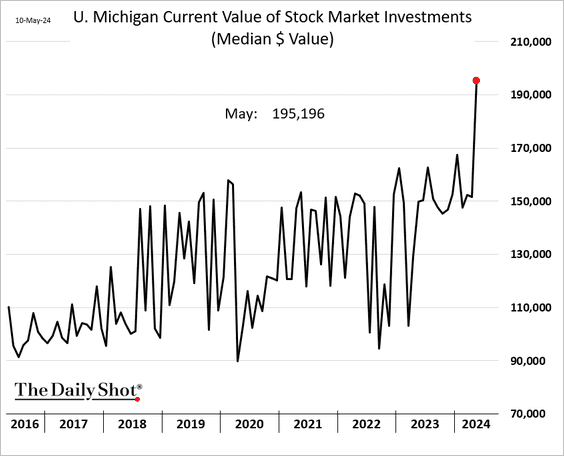
• Households reported a record high value of equity investments.
——————–
2. Google search activity points to higher jobless claims ahead.
 Source: Pantheon Macroeconomics
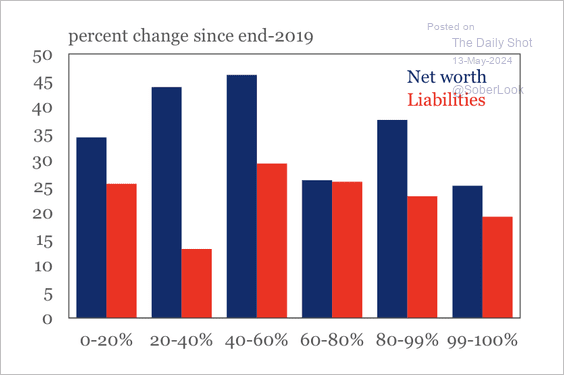
3. Households’ asset accumulation has broadly outpaced debt accumulation since the onset of the pandemic.
 Source: IIF
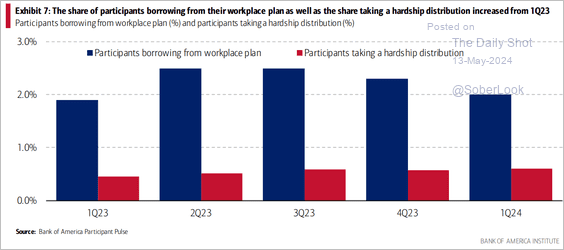
• This chart shows the share of employees tapping their 401k accounts.
 Source: Bank of America Institute
——————–
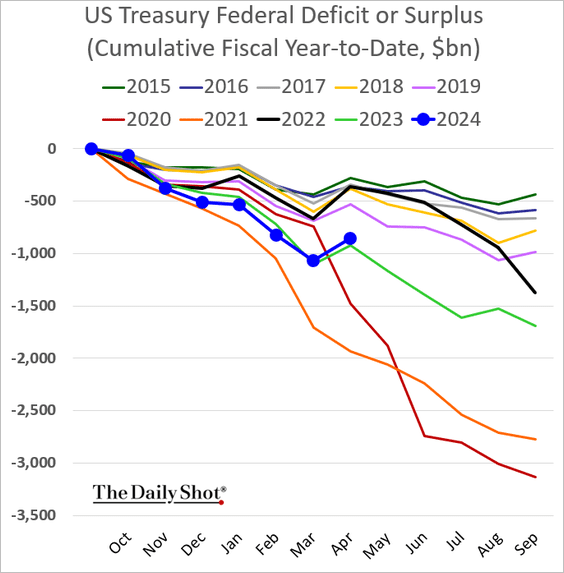
4. The net boost to the federal budget from tax receipts in April was lower than expected but still exceeded last year’s level.
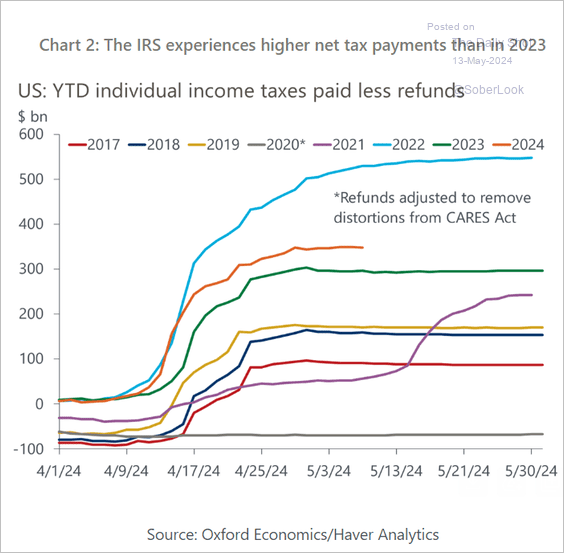
• Individual income taxes paid less refunds are running well above last year’s levels, …
 Source: Oxford Economics
… boosted by higher stock prices.
 Source: Oxford Economics
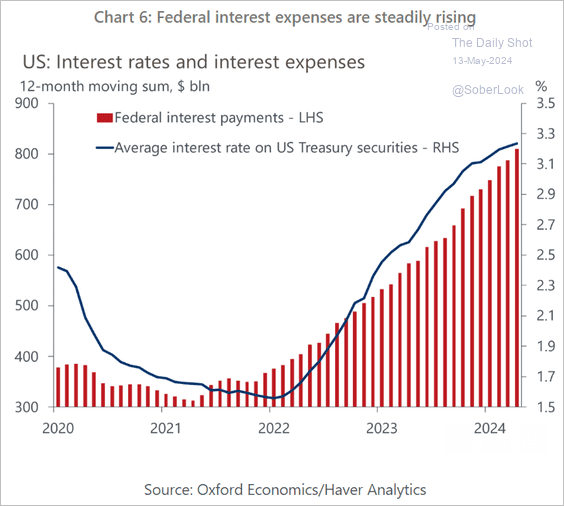
• Federal interest expenses continue to rise.
 Source: Oxford Economics
Back to Index
Canada
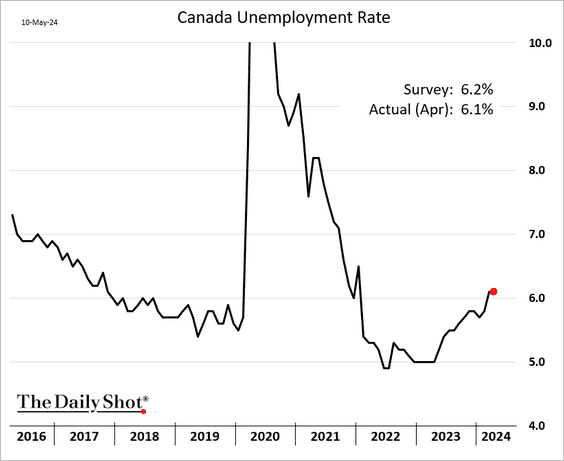
1. Canada’s April employment gains were well above forecasts.

 Source: Reuters Read full article
• The unemployment rate held steady.
• The participation rate ticked higher.

• Wage growth eased but remains elevated.

——————–
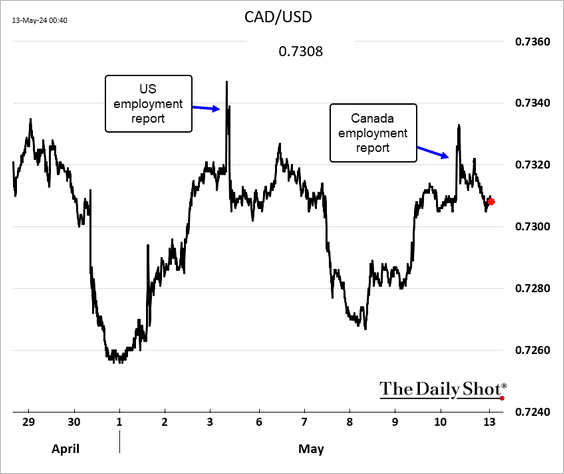
2. The probability of a BoC June rate cut dipped below 50% following the strong employment report.

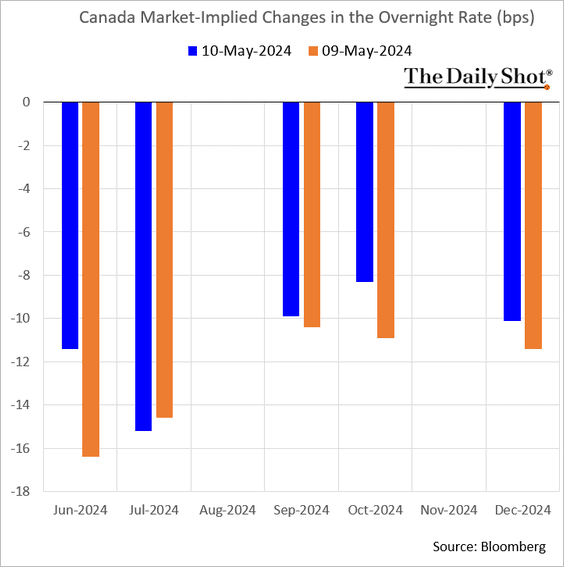
• Bond yields climbed.

The loonie jumped but retreated shortly after.
——————–
2. The Ivey PMI, which measures activity in both private and public organizations, has reached its highest level in two years.

Back to Index
The United Kingdom
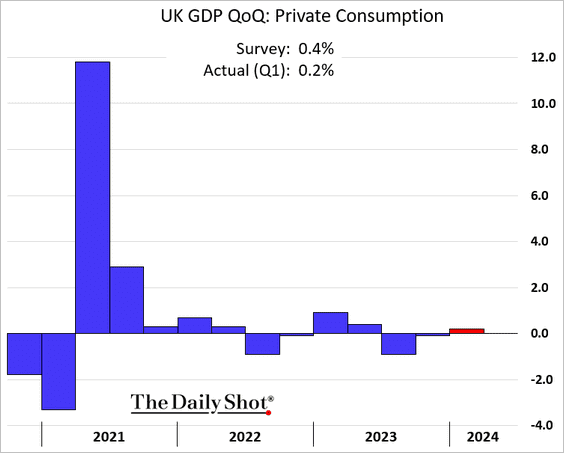
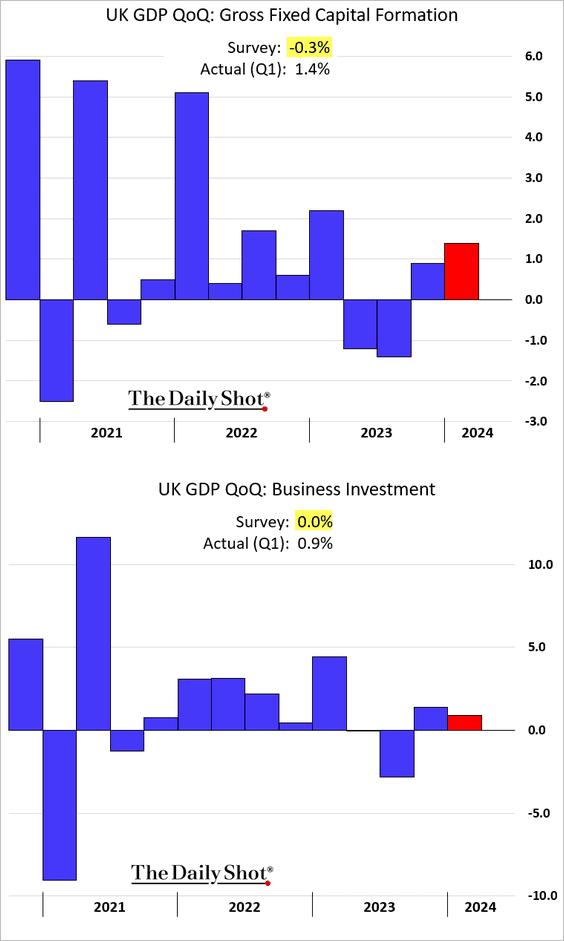
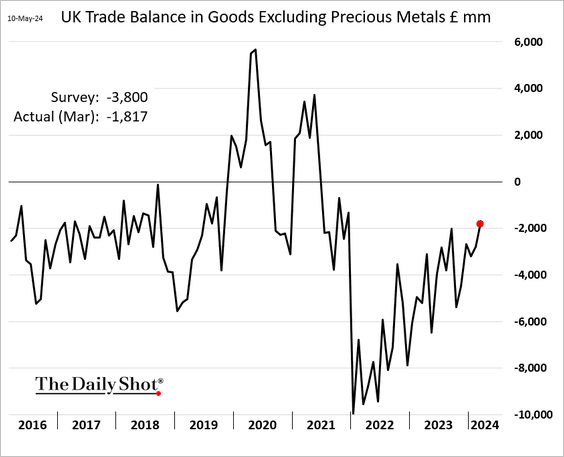
1. As we saw last week (chart), the Q1 GDP growth topped expectations, signaling the country’s exit from recession.
• Consumer spending was soft, …
… but business investment grew faster than expected.
• Weaker imports also boosted growth, …
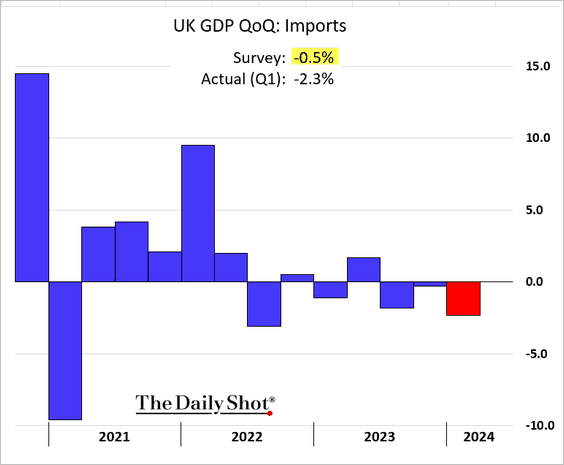
… as the trade deficit narrowed.
——————–
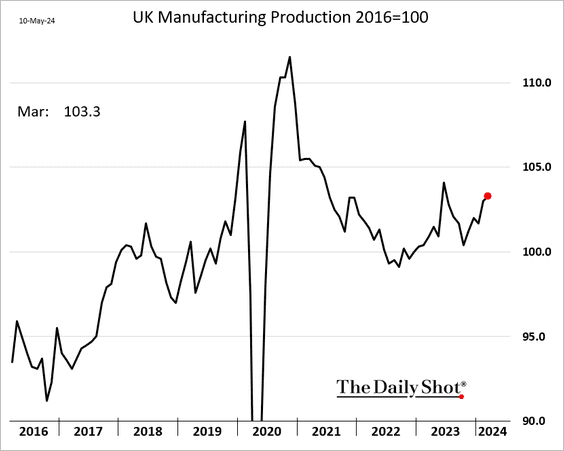
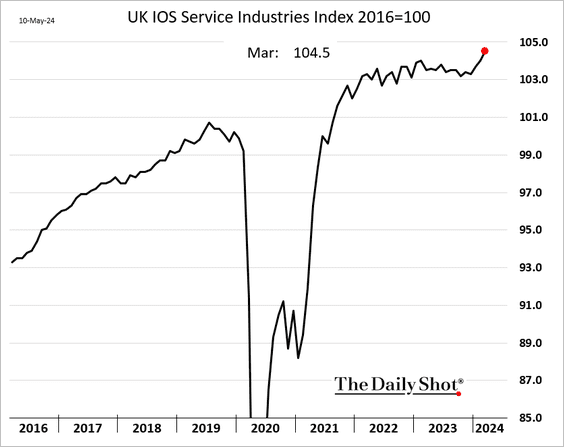
2. Production activity improved across the board in March.
• Manufacturing production:
• Services output:
• Construction output:

——————–
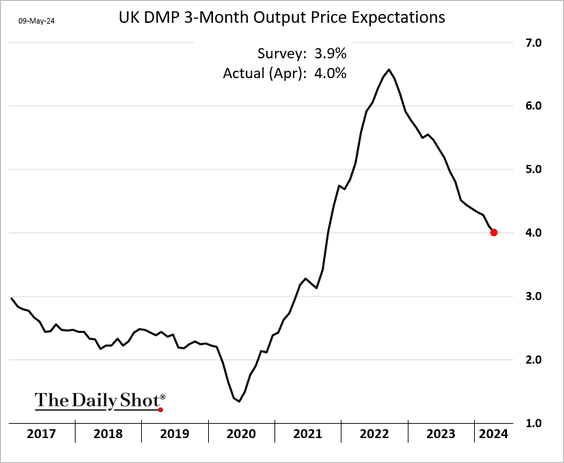
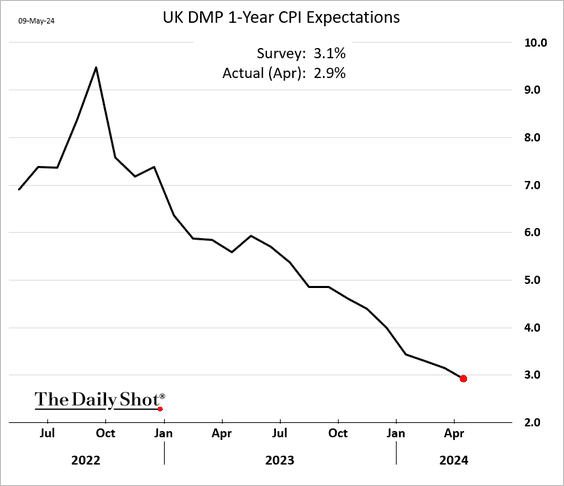
3. Companies expect slower PPI and CPI growth ahead.
Back to Index
Europe
1. Sweden’s economic activity improved in March.
– Industrial production:

– Services:

– Consumer spending:

——————–
2. Norway’s CPI growth was higher than expected last month.

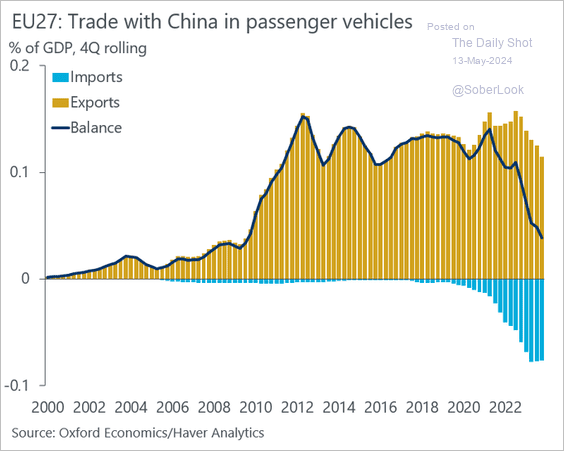
3. Here is a look at the EU’s vehicle trade with China.
 Source: @DanielKral1, @OxfordEconomics
Back to Index
Japan
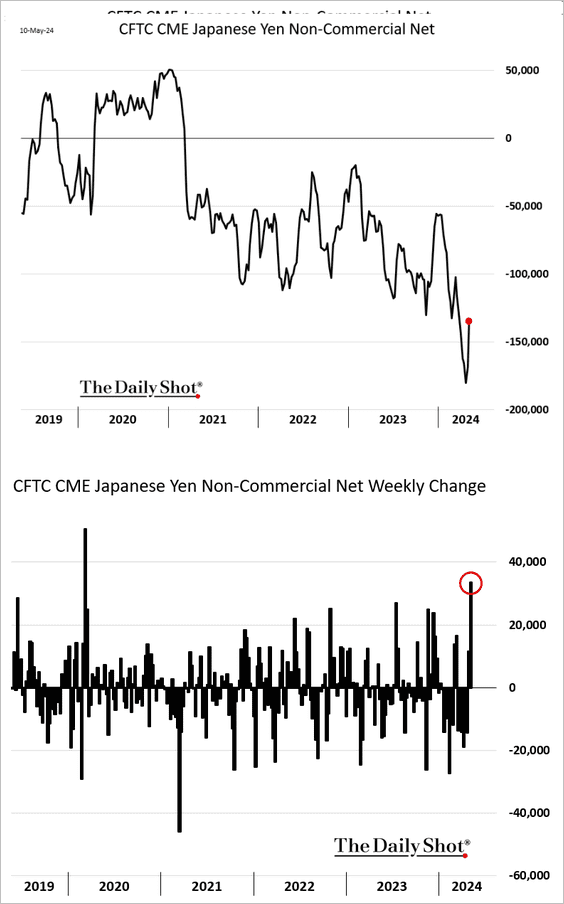
1. Funds sharply reduced their bets against the yen after the BoJ’s interventions.
2. Flows into Japan-focused funds have accelerated.
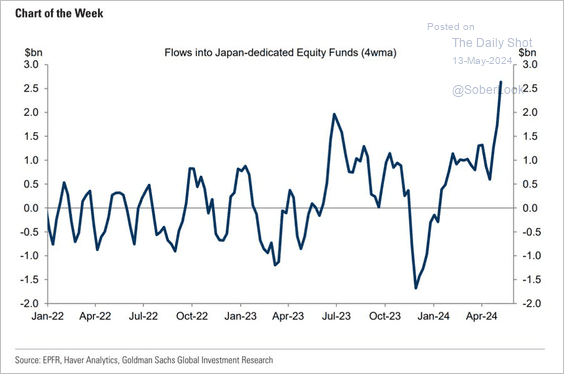 Source: Goldman Sachs; @WallStJesus
3. Japan’s current account surplus in March was lower than expected but still reached a record high.

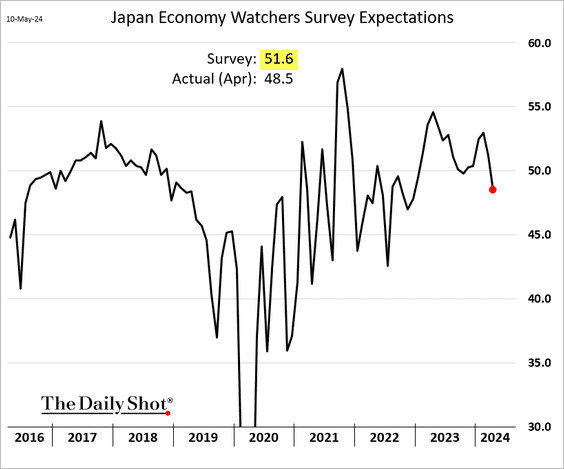
4. The Economy Watchers Survey Expectations index continues to fall.
Back to Index
China
1. China’s credit growth slowed more than expected in April.
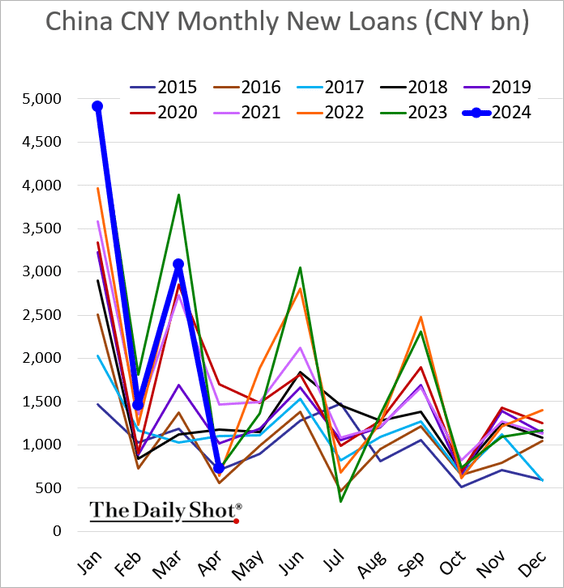
Net aggregate financing was negative, …

… as net government debt issuance declined.
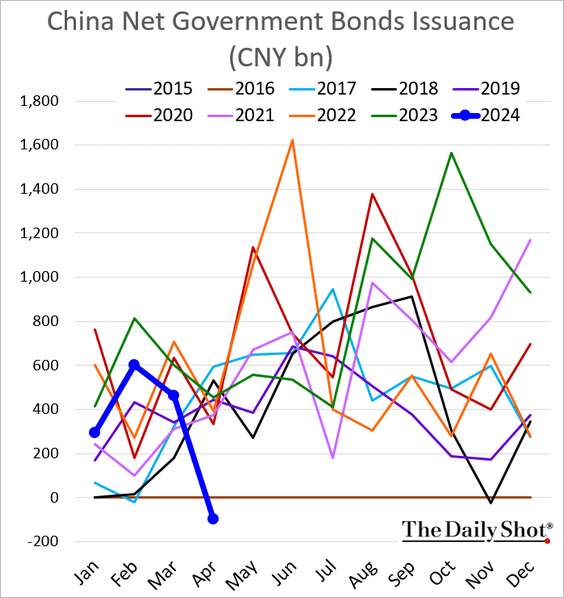
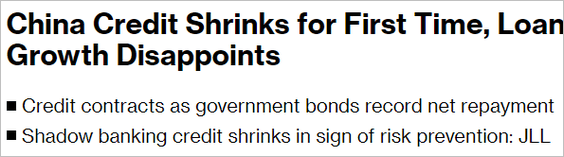 Source: @markets Read full article
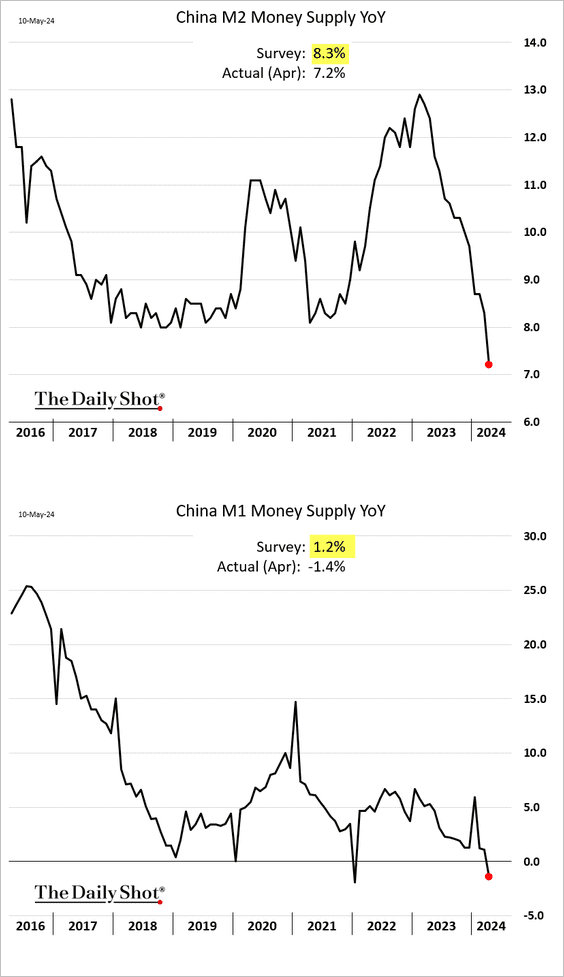
• The broad money supply growth continues to slow, while the narrow money supply growth was negative on a year-over-year basis.
——————–
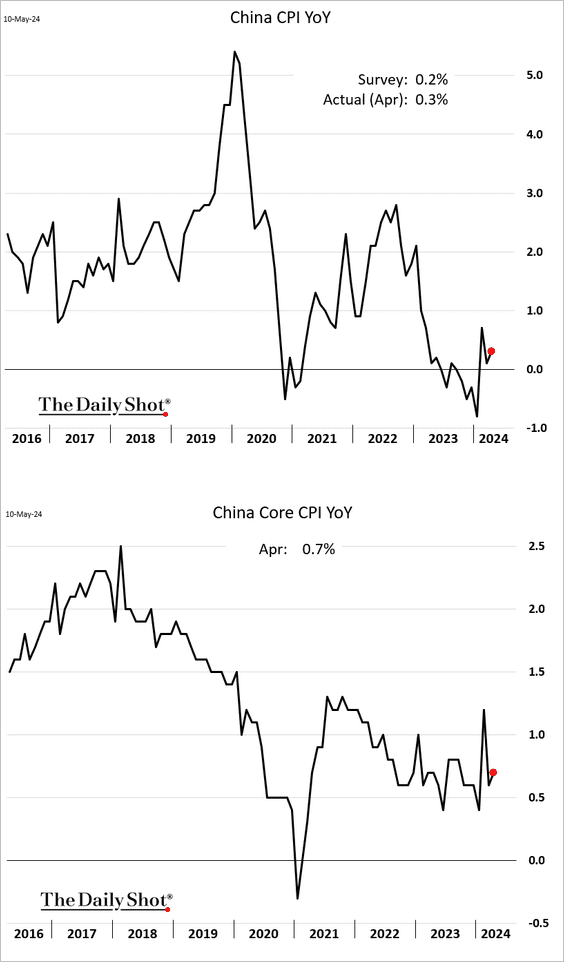
2. Inflation remains subdued.
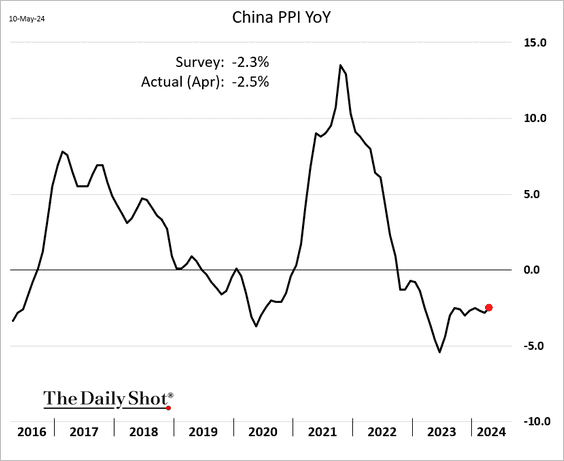
Here is the PPI.
——————–
3. The offshore yuan is weakening, with USD/CNH back at the 200-day moving average.
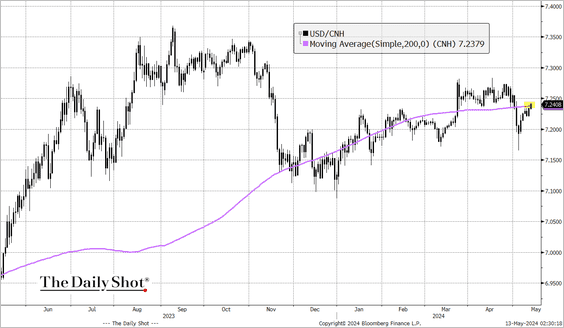 Source: @TheTerminal, Bloomberg Finance L.P.
4. Hong Kong-listed stocks are up almost 12% year-to-date.
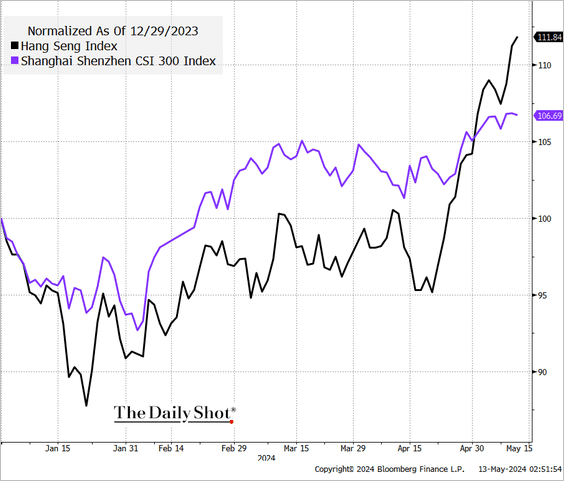 Source: @TheTerminal, Bloomberg Finance L.P.
Back to Index
Emerging Markets
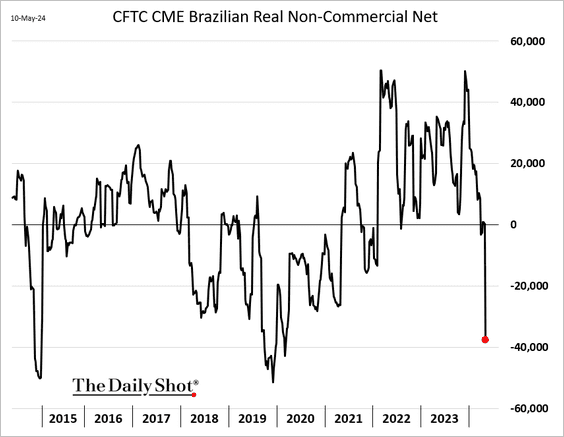
1. Hedge funds have soured on the Brazilian real.
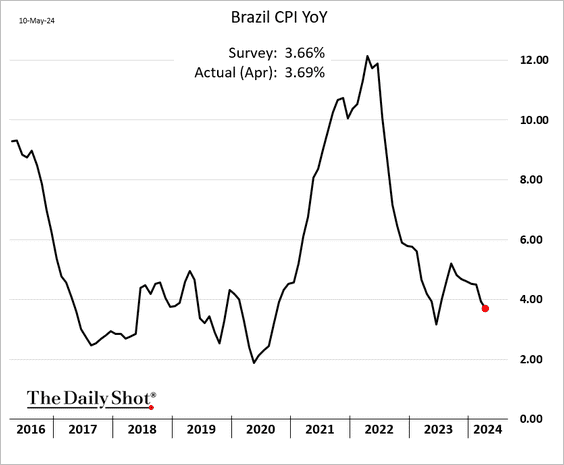
• Brazil’s inflation continues to moderate.
——————–
2. Mexico’s manufacturing output increased again in March.
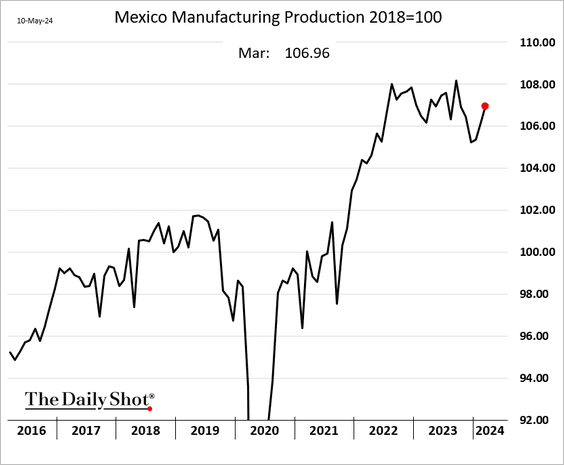
 Source: MarketWatch Read full article
——————–
3. EM inflation surprises remain mixed.
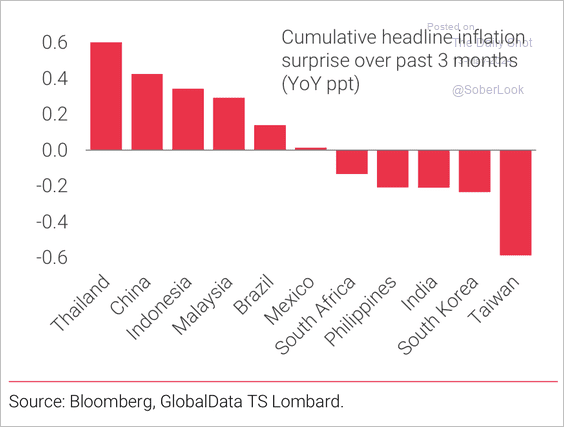 Source: TS Lombard
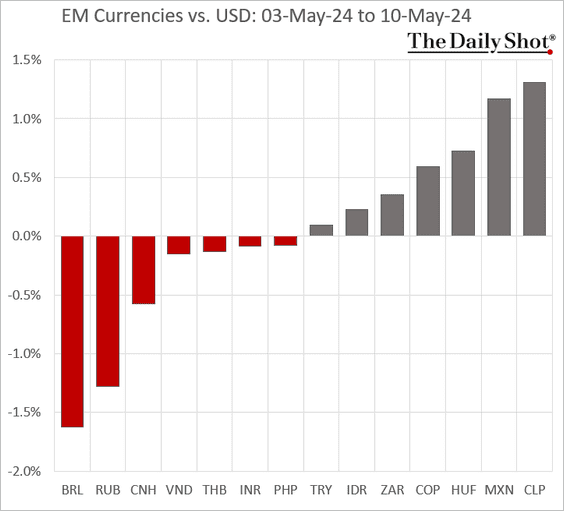
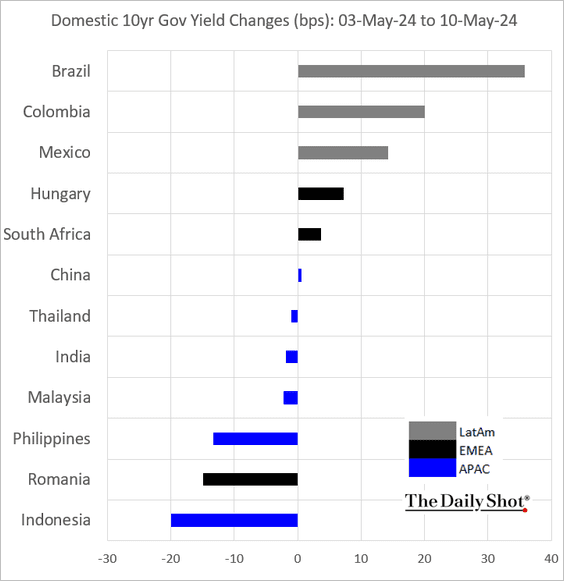
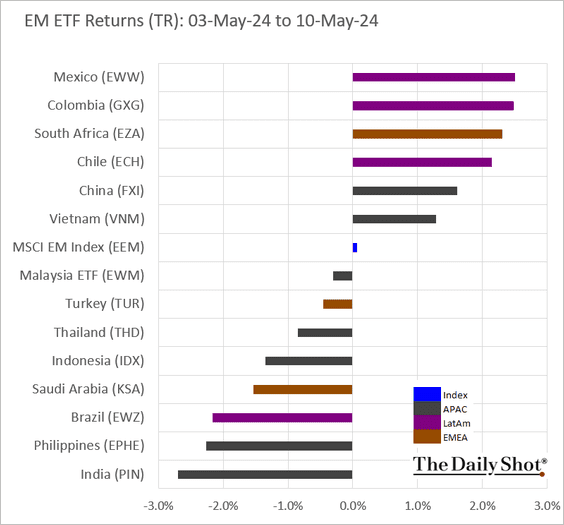
4. Here is a look at last week’s performance.
• Currencies:
• Bond yields:
• Equity ETFs:
Back to Index
Commodities
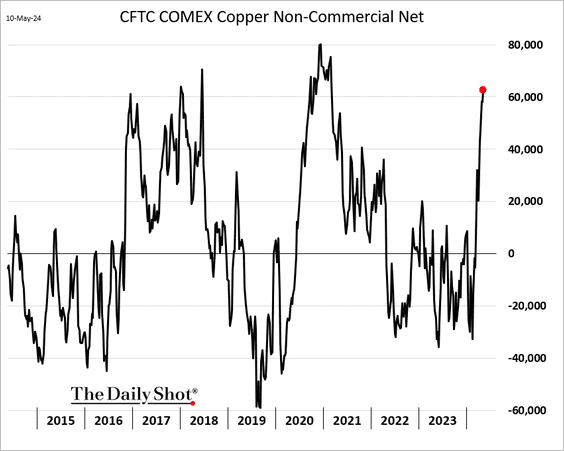
1. Hedge funds continue to boost their bets on copper.
2. Iron ore prices have sharply diverged from the rise in stocks at Chinese ports.
 Source: Capital Economics
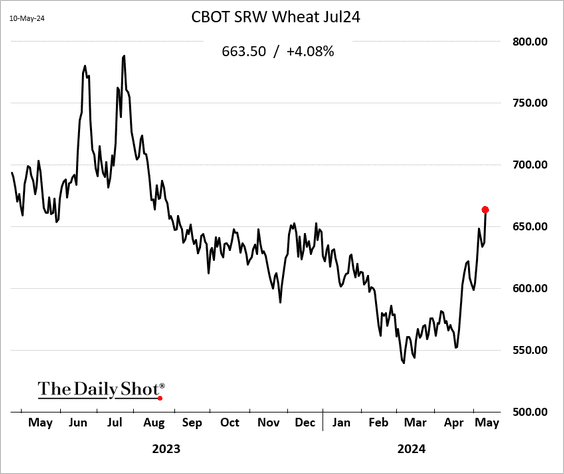
3. Wheat futures continue to rally.
4. Sugar prices have been under pressure, …
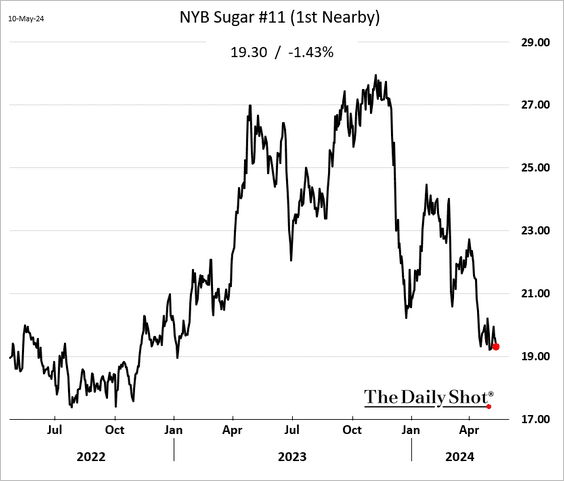
… with speculative accounts cutting their exposure.

——————–
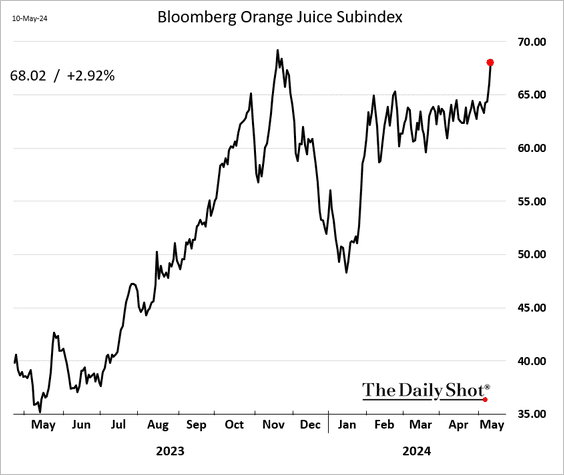
5. Orange juice prices are surging again.
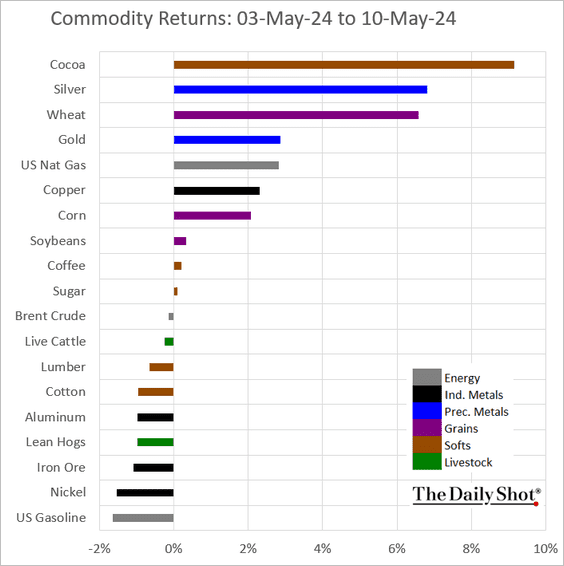
6. Here is a look at last week’s performance.
Back to Index
Equities
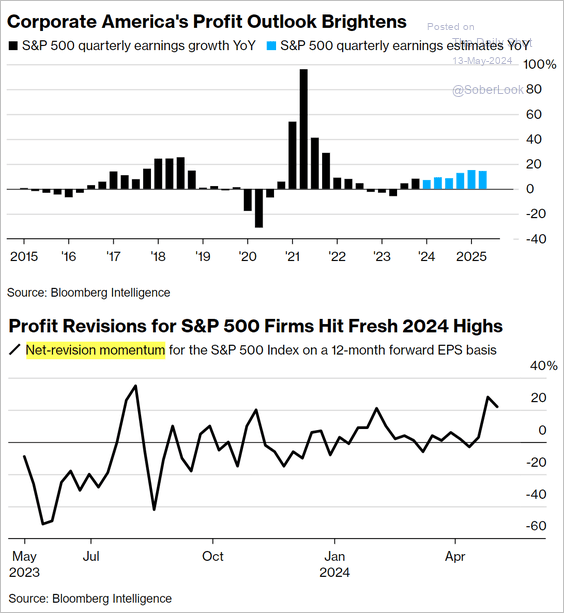
1. The S&P 500 earnings growth projections look strong.
 Source: @markets Read full article
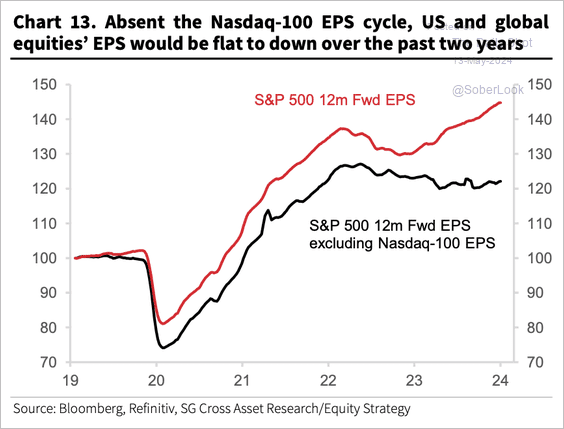
• Improved earnings per share expectations have been driven by stocks in the Nasdaq 100.
 Source: Societe Generale Cross Asset Research; @AyeshaTariq
——————–
2. Share buyback activity continues to strengthen.
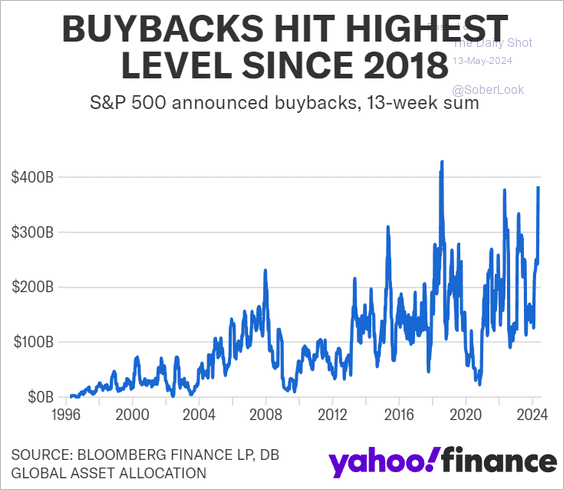 Source: Yahoo Finance Read full article
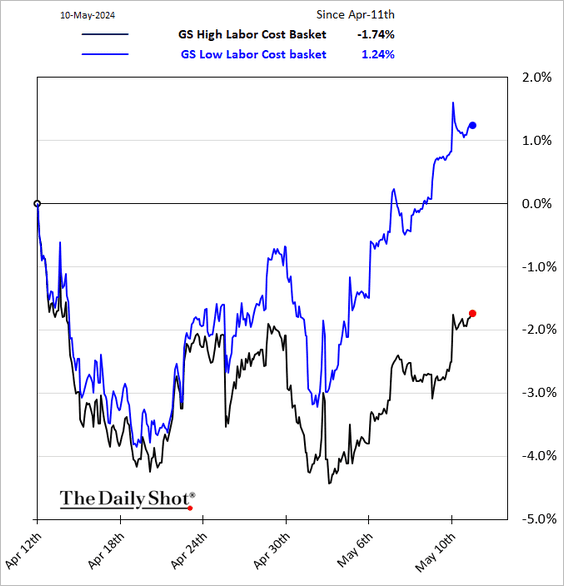
3. Companies with low labor costs have been outperforming this month.
4. The GS sentiment index is back in “stretched” territory.
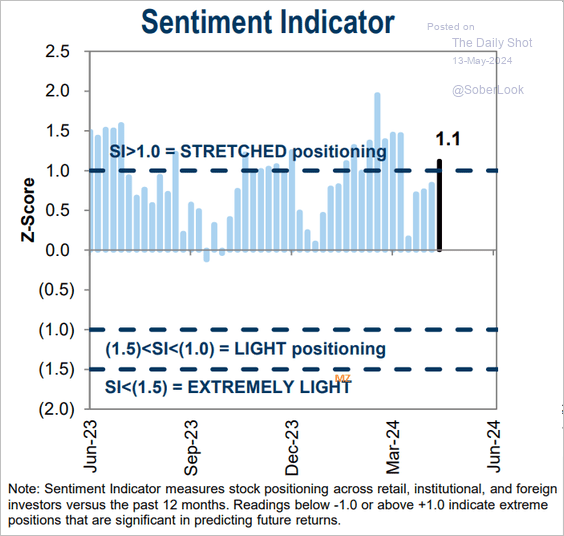 Source: Goldman Sachs; @MikeZaccardi
5. Options traders are betting on defensives.
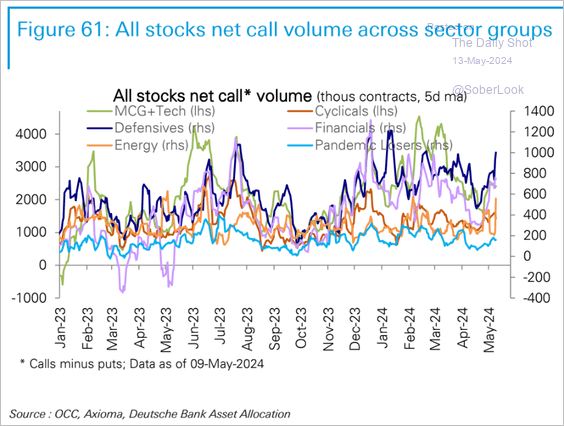 Source: Deutsche Bank Research
6. Financial Twitter posts point to stronger retail flows ahead.
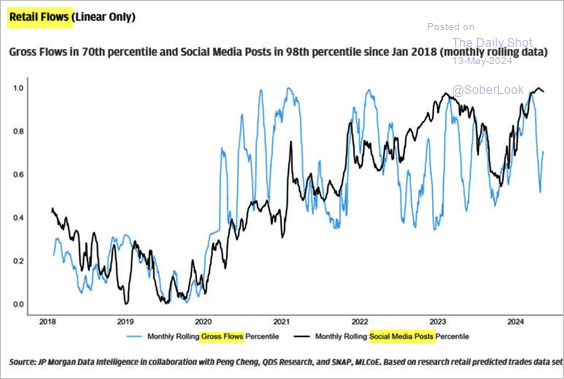 Source: JP Morgan Research; @WallStJesus
7. Here is a look at sector correlations to high-yield bond spreads and the ISM Manufacturing PMI.
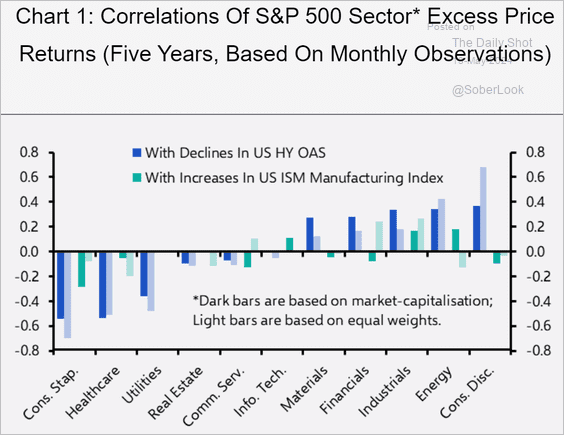 Source: Capital Economics
8. This chart shows the historical performance of “Sell in May and go away.”
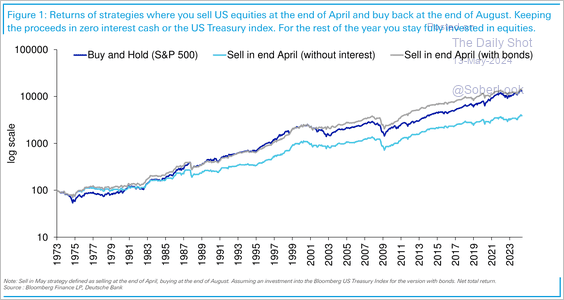 Source: Deutsche Bank Research
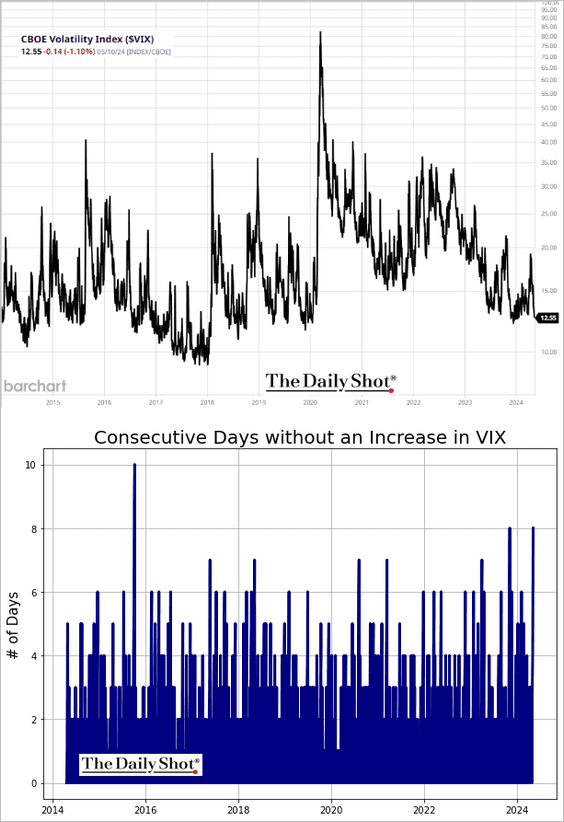
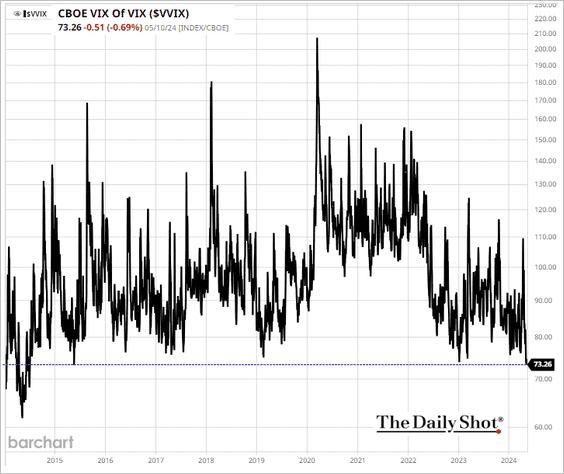
9. VIX and VVIX (vol of vol) indicators continue to decline.
——————–
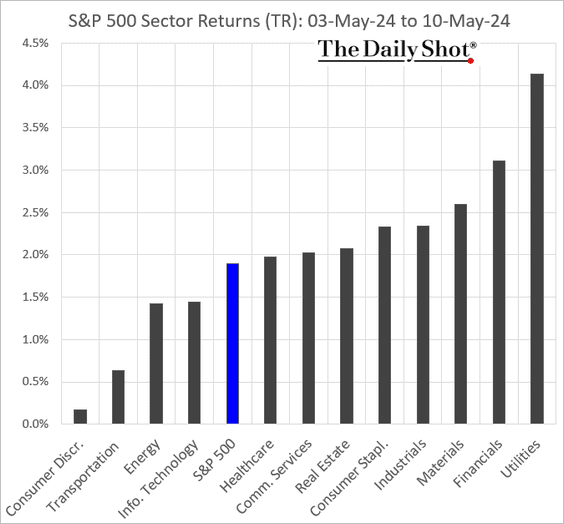
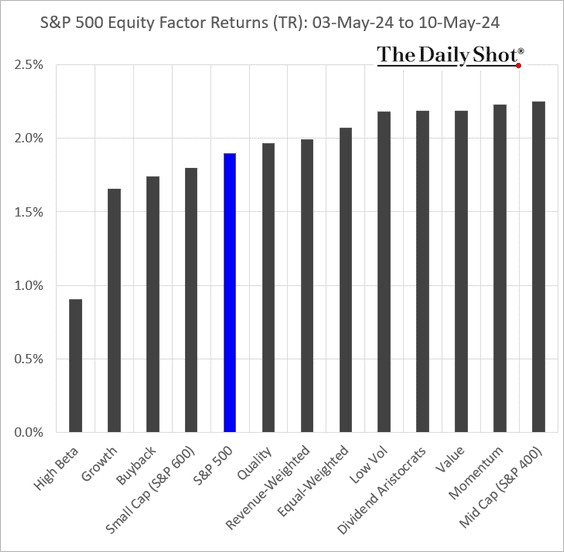
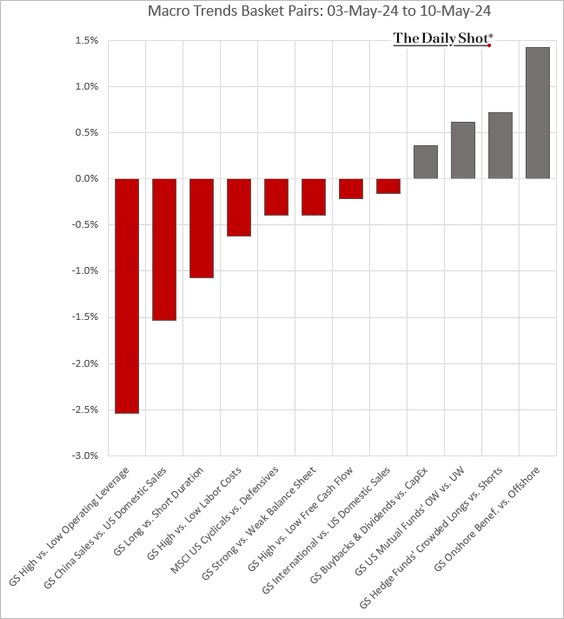
10. Here is a look at last week’s performance data.
• Sectors:
• Equity factors:
• Macro basket pairs’ relative performance:
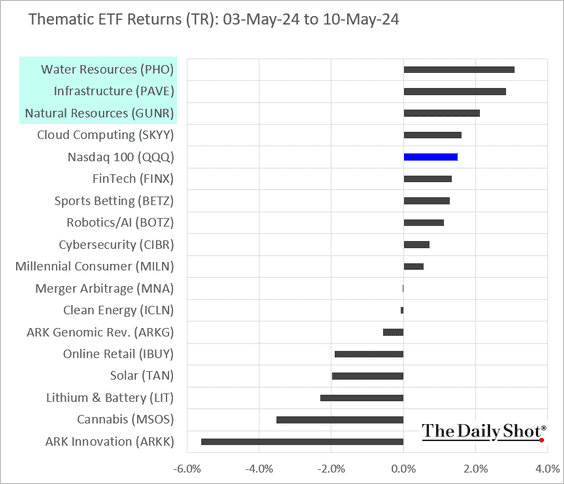
• Thematic ETFs:
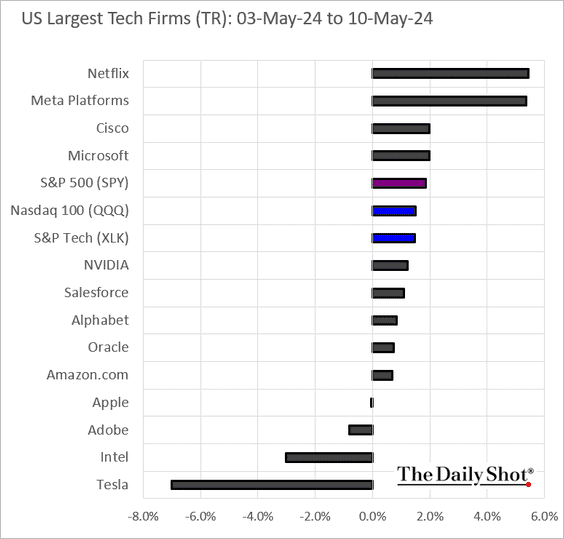
• Largest US tech firms:
Back to Index
Credit
1. Is rising unemployment signaling wider high-yield spreads?
 Source: BofA Global Research
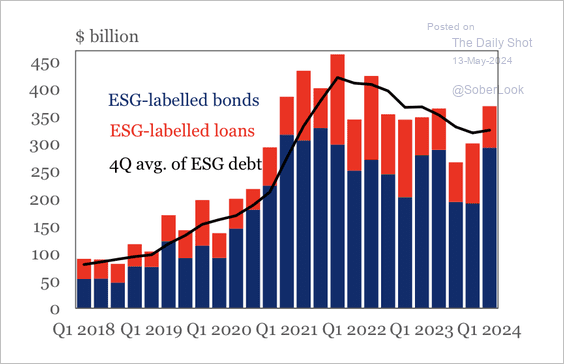
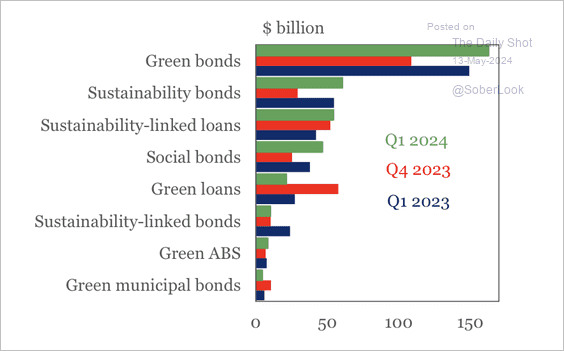
2. There was an uptick in ESG debt issuance early this year, largely driven by green bonds. (2 charts)
 Source: IIF
 Source: IIF
——————–
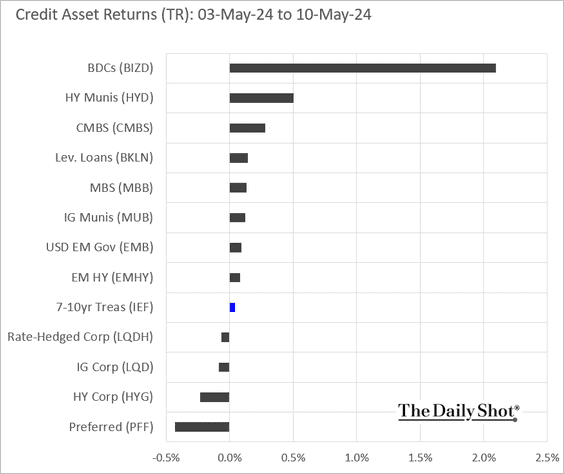
3. Below is last week’s performance data across credit asset classes.
Back to Index
Global Developments
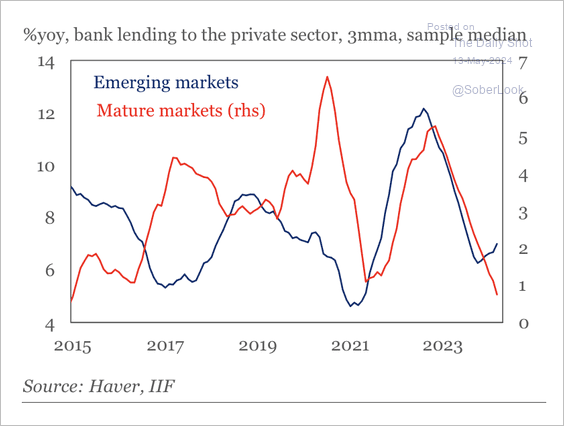
1. Bank lending growth in mature markets remains muted, while EM has troughed.
 Source: IIF
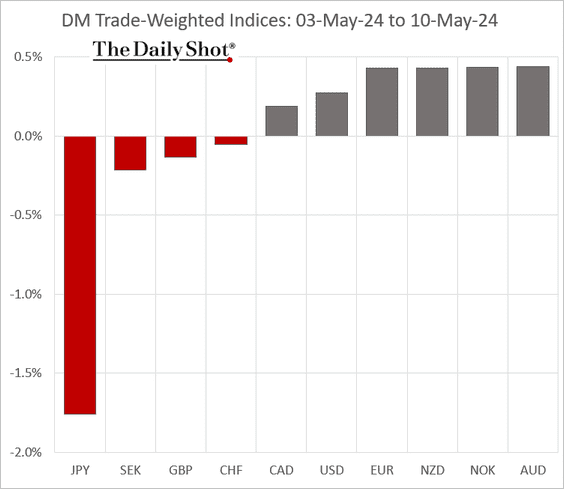
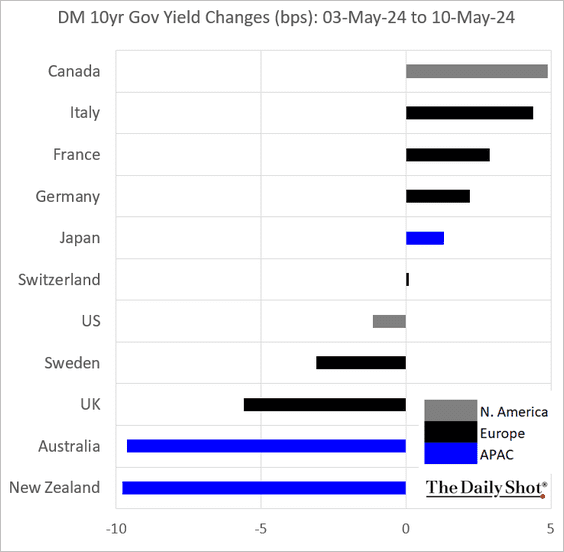
2. Here is a look at last week’s performance data.
• Currencies:
• Bond yields:
• Equities:
——————–
Food for Thought
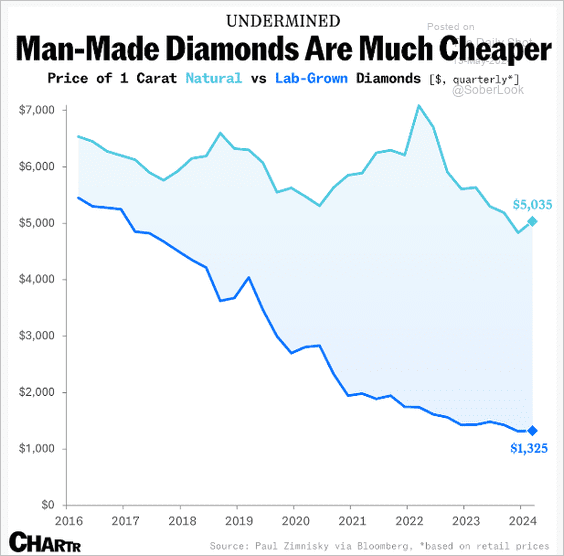
1. Price trends for natural and lab-grown diamonds:
 Source: @chartrdaily
2. Record earnings in the live-music industry:
 Source: Statista
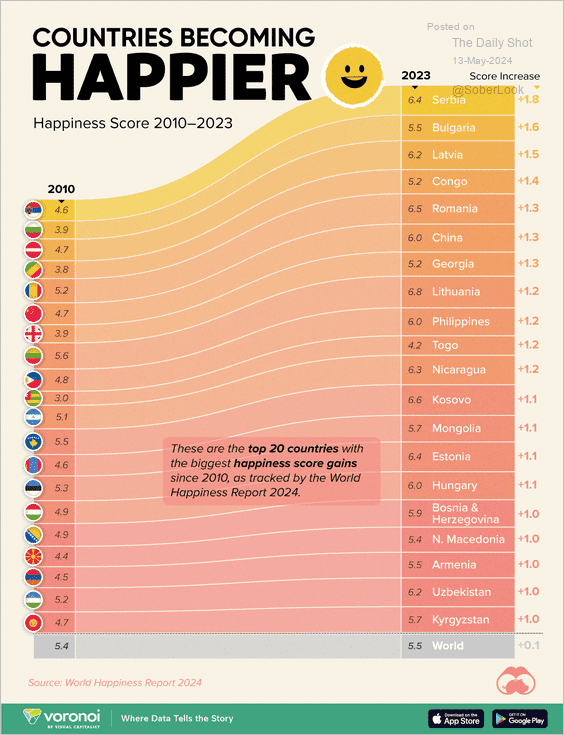
3. Happiness score gains between 2010-2023:
 Source: Visual Capitalist Read full article
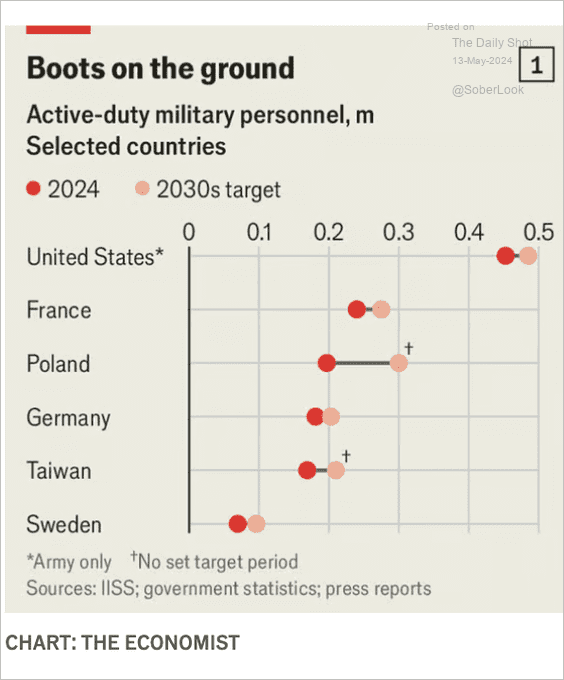
4. Current and target active-duty military personnel by country:
 Source: The Economist Read full article
5. Indebtedness to China:
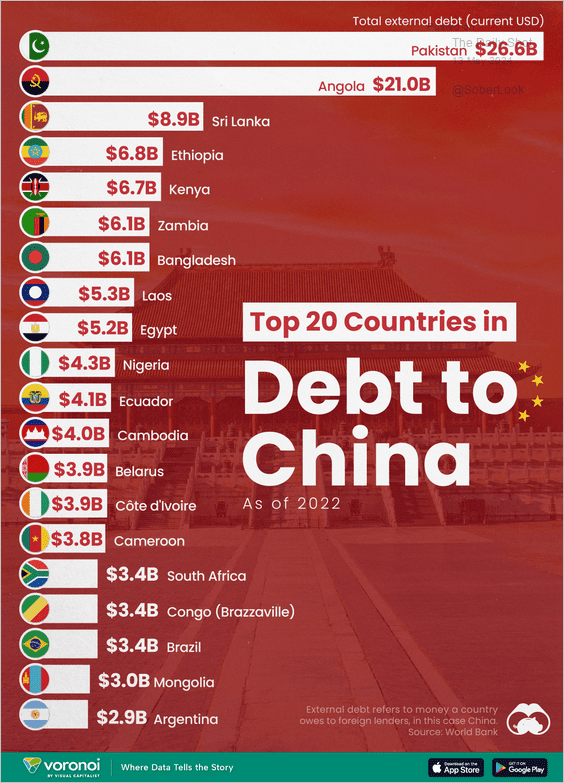 Source: Visual Capitalist Read full article
6. Babies delivered by cesarean section:
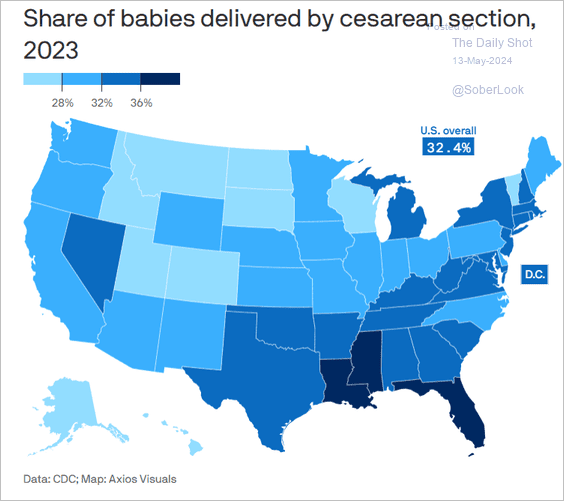 Source: @axios Read full article
7. La Niña sets the stage for more and potentially stronger hurricanes to develop in the Atlantic.
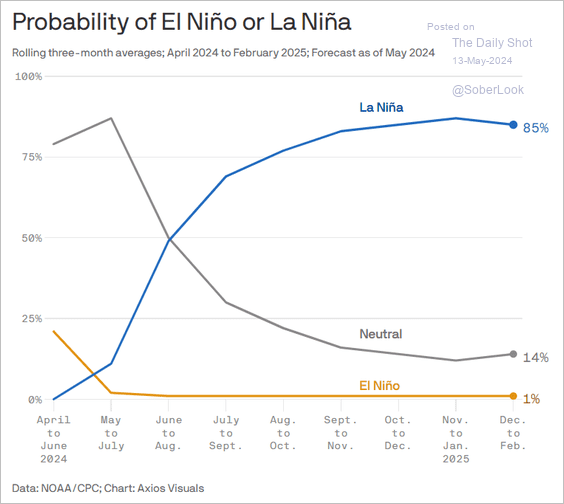 Source: @axios Read full article
8. Global revenue of top media franchises:
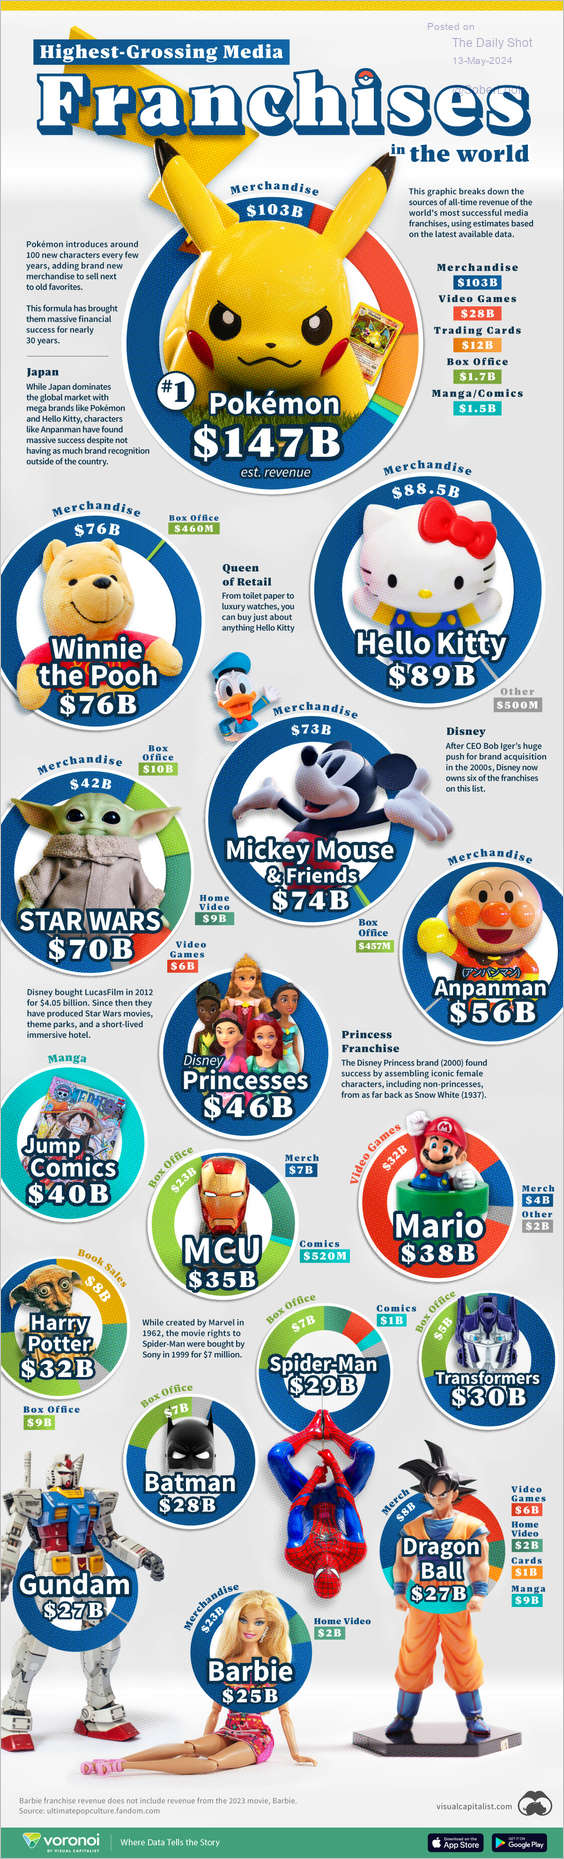 Source: Visual Capitalist Read full article
——————–
Back to Index