
The Daily Shot: 05-Jan-21
• The United States
• Canada
• The United Kingdom
• The Eurozone
• Asia – Pacific
• China
• Emerging Markets
• Cryptocurrency
• Commodities
• Energy
• Equities
• Credit
• Rates
• Global Developments
• Food for Thought
The United States
Happy New Year!
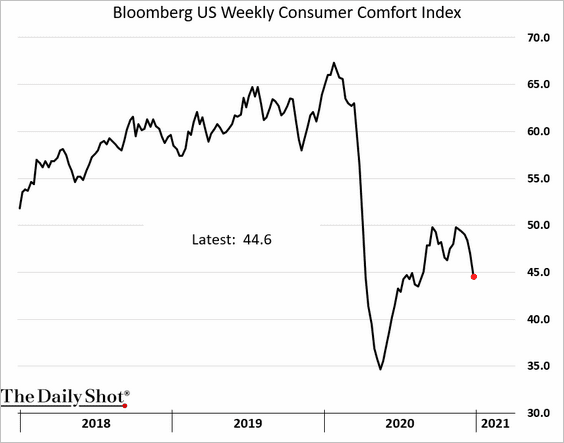
1. Consumer sentiment deteriorated going into the year-end.
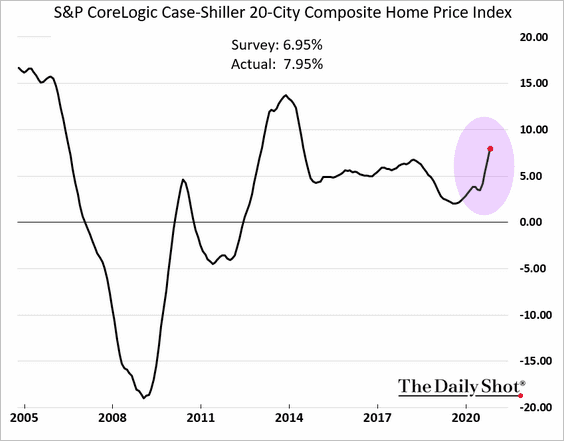
2. Home prices continued to rally in October, with the Case-Shiller index now up 8% vs. a year ago.
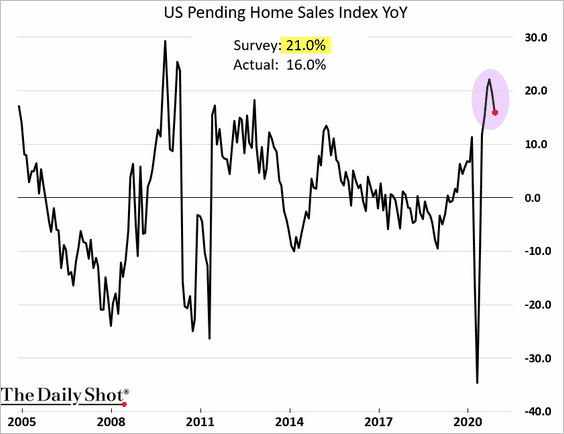
However, pending home sales pulled back in November.
——————–
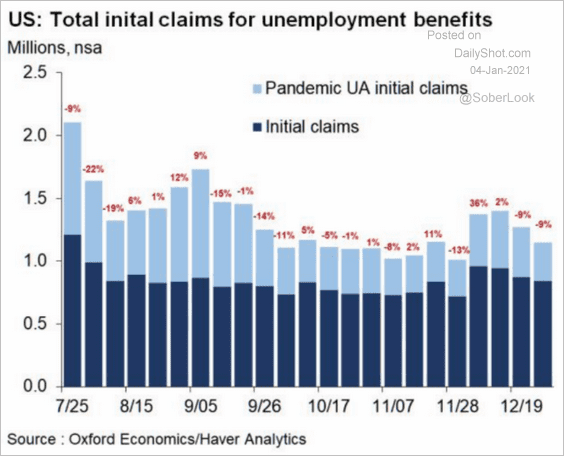
3. Next, we have some updates on the labor market.
• Initial jobless claims are holding above a million per week.
 Source: Oxford Economics
• How much of a post-holiday rebound should we expect in small-business employment?
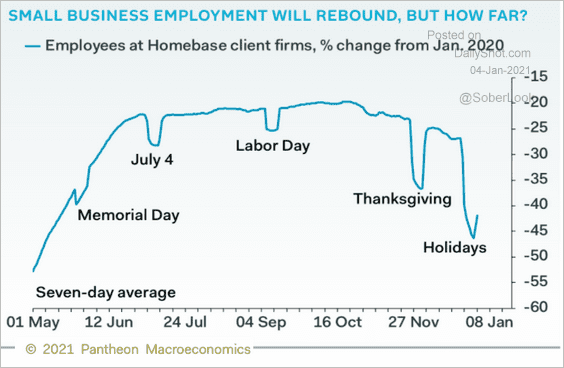 Source: Pantheon Macroeconomics
• Record numbers of Americans have been missing work due to illness this year.
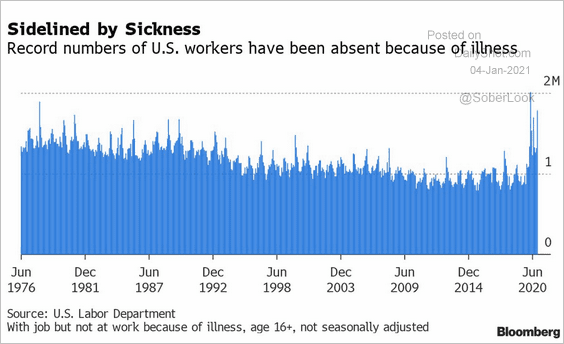 Source: @BloombergQuint Read full article
——————–
4. The pandemic changed Americans’ spending patterns.
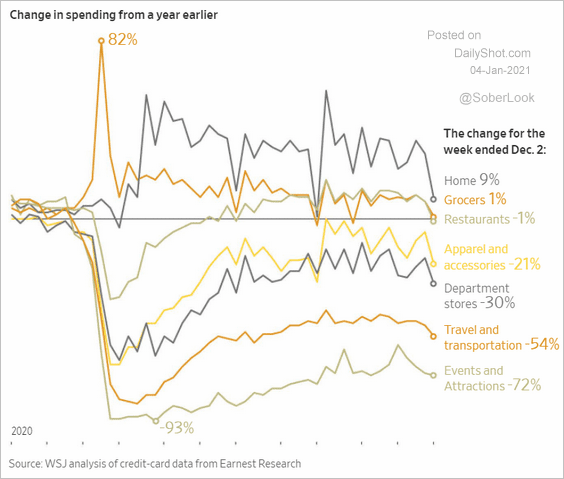 Source: @WSJ Read full article
The pullback in spending and massive government support resulted in a sharp increase in savings. This is part of the reason for the 2020 flood of retail funds into stocks and options.
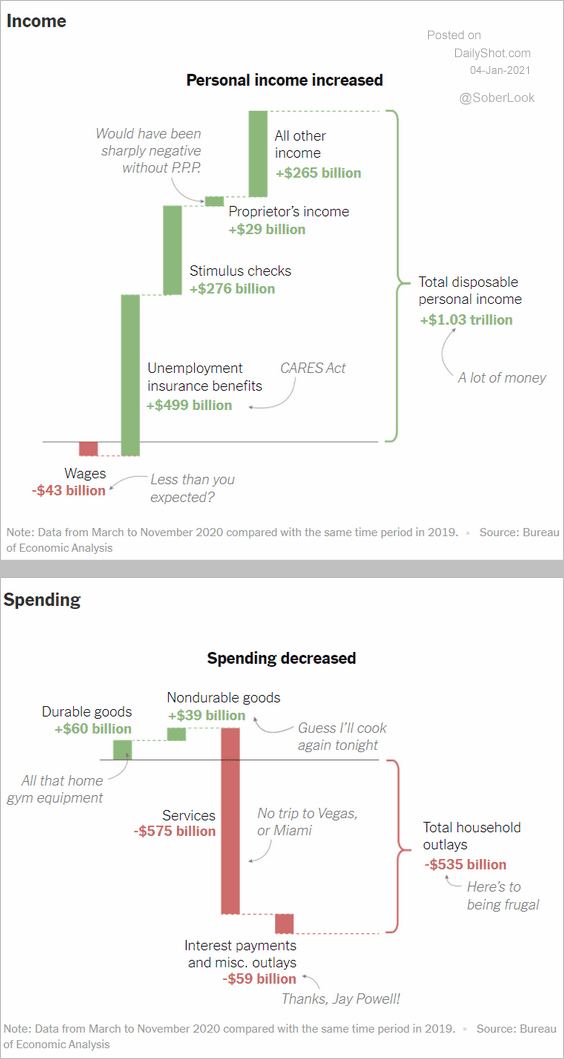 Source: The New York Times Read full article
——————–
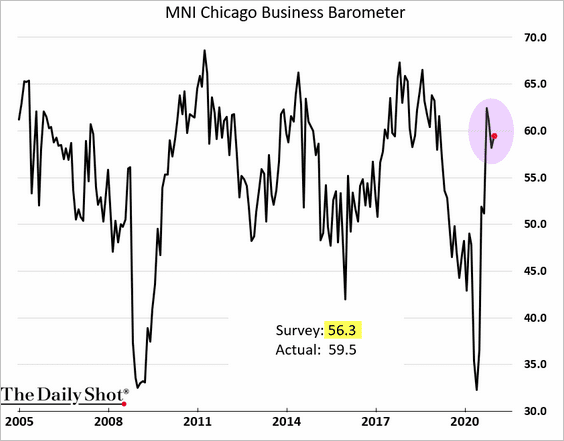
5. The Chicago PMI index, which measures business activity in the Midwest, surprised to the upside in December. It bodes well for manufacturing growth at the national level.
6. US trade deficit in goods hit a new record as imports outpace exports.
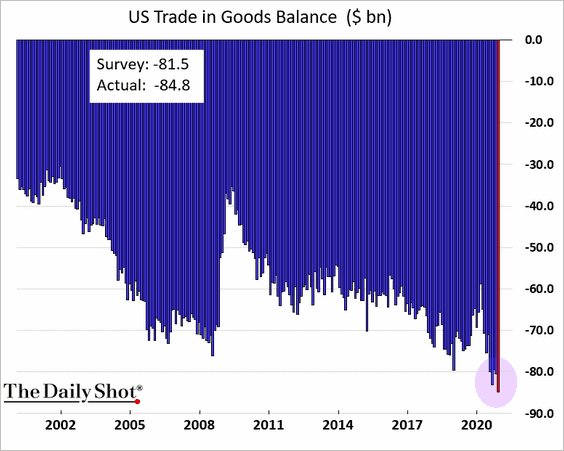
We can see this divergence in container shipment trends.
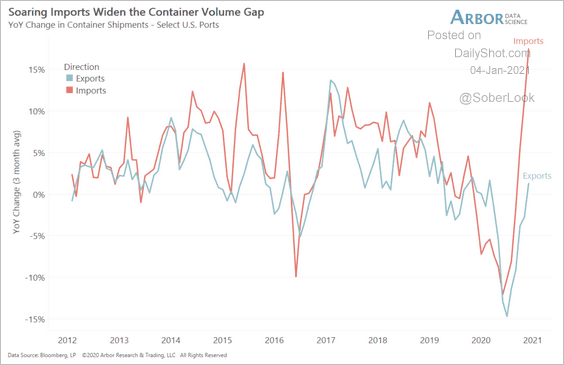 Source: Arbor Research & Trading
——————–
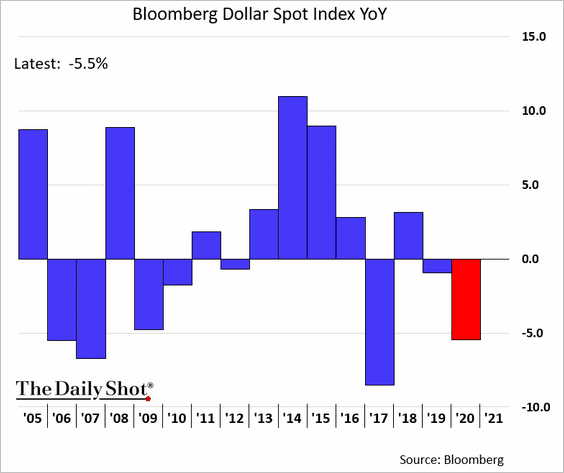
7. The dollar weakness should help improve US exports.
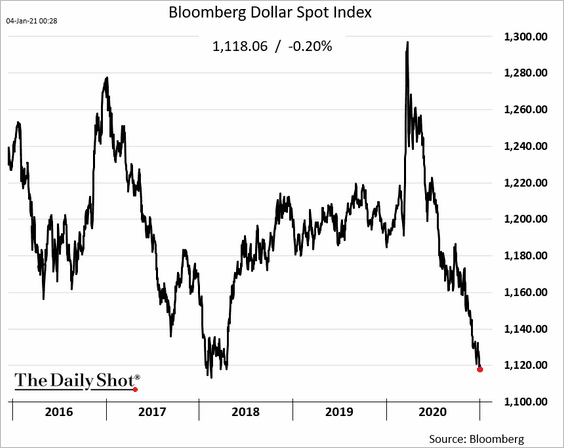
This chart shows the annual changes in the Bloomberg US dollar index.
——————–
8. Greenback’s slide is also one of the reasons for elevated market-based inflation expectations.
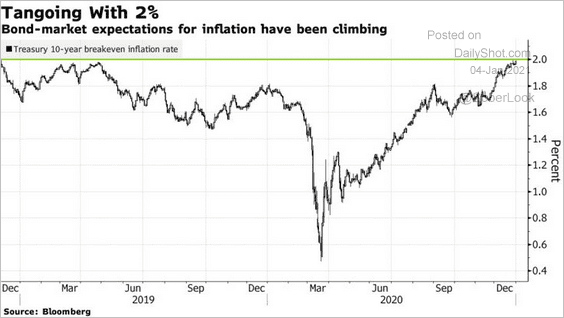 Source: @markets Read full article
9. The COVID situation shows no signs of easing.
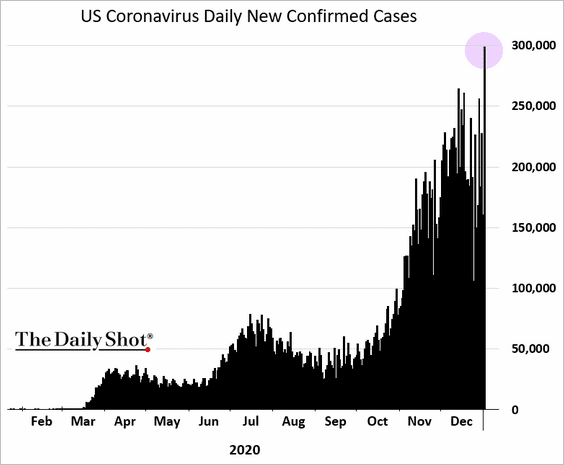
But Americans’ interest in vaccination appears to be rising.
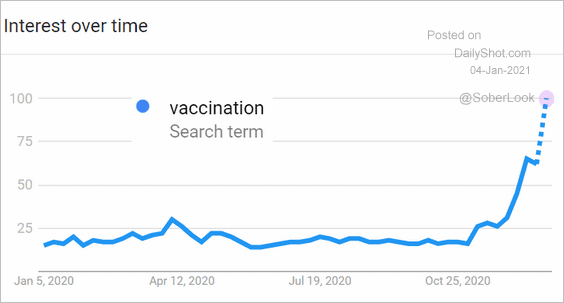 Source: Google Trends
Back to Index
Canada
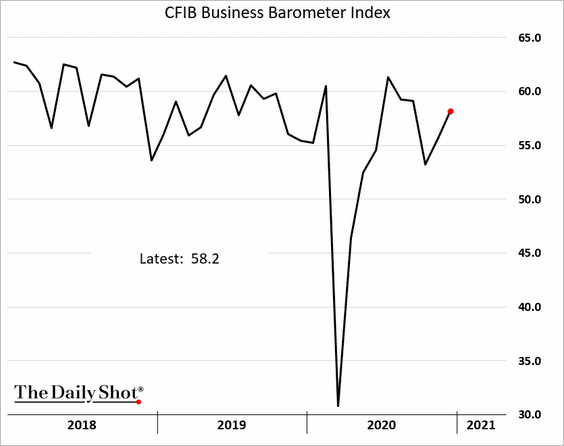
1. The small- and medium-size business activity rebounded in December.
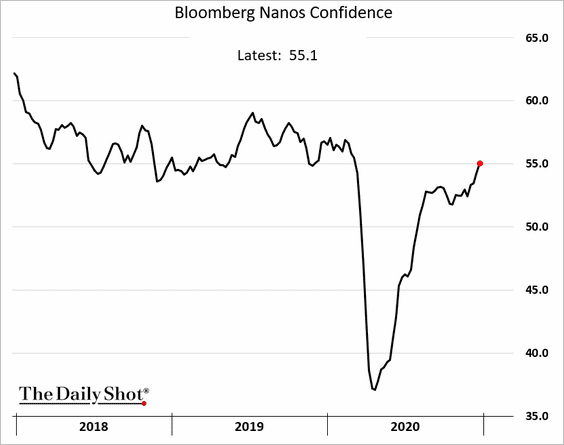
2. Consumer confidence is approaching pre-COVID levels.
Back to Index
The United Kingdom
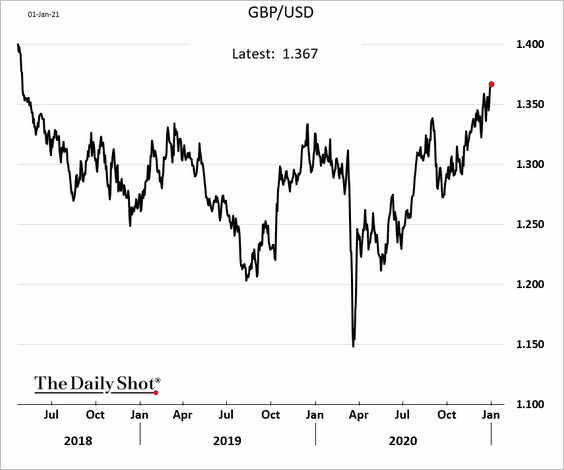
1. The pound strengthened on the back of the UK-EU trade agreement.
The pound remains below fair value based on its purchasing power parity.
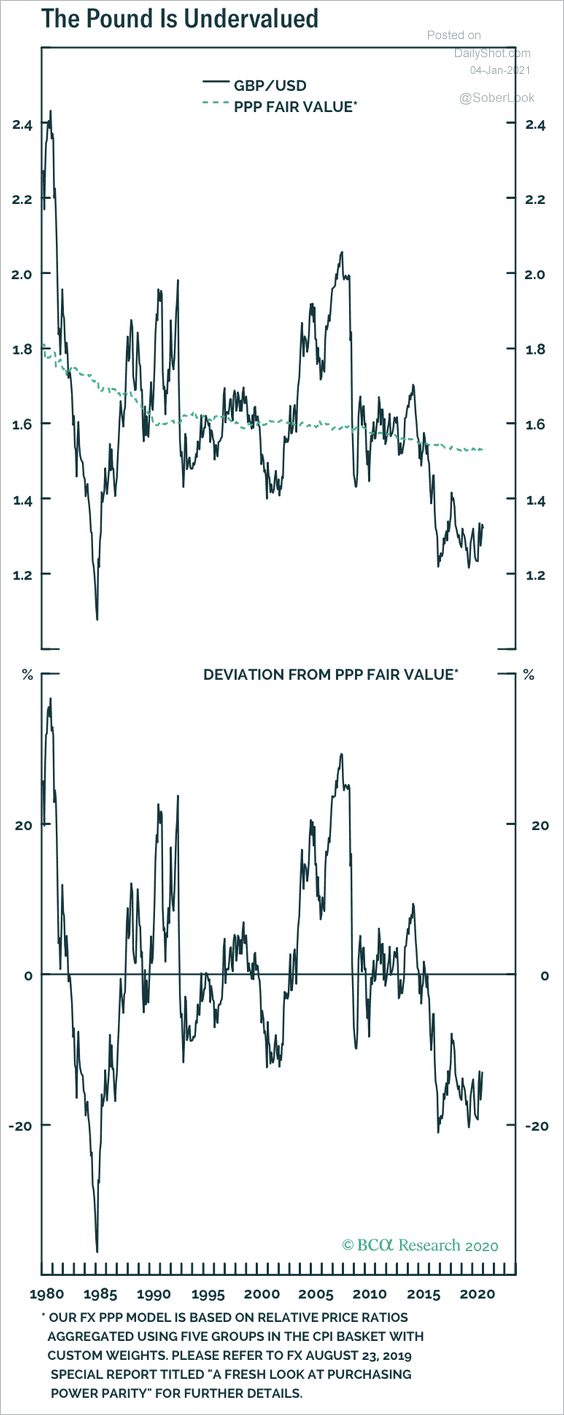 Source: BCA Research
——————–
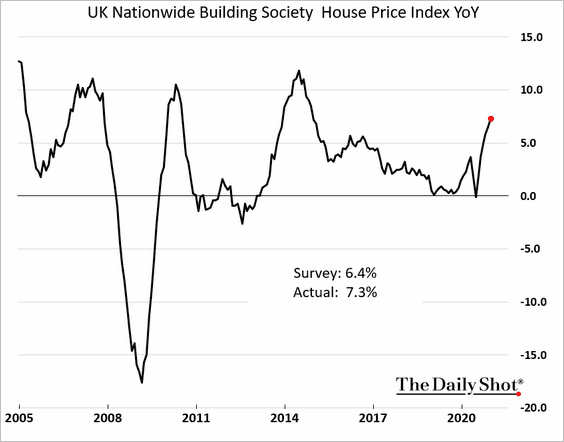
2. Home price appreciation continues to surprise to the upside.
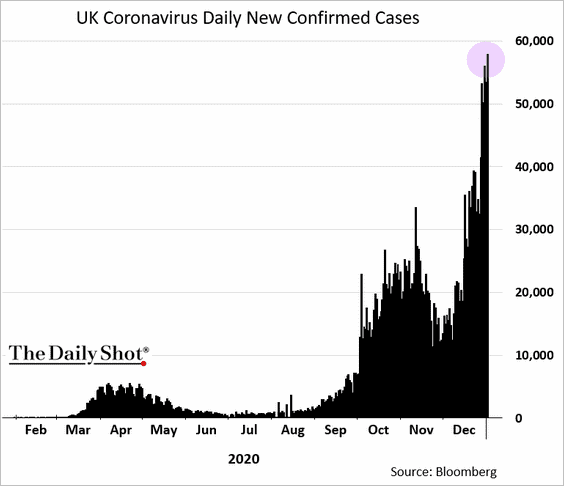
3. The COVID situation is out of control as the new variant of the virus spreads.
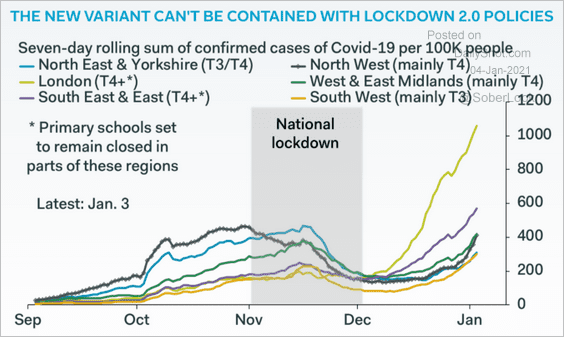 Source: Pantheon Macroeconomics
Many hospitals are stretched to the limit.
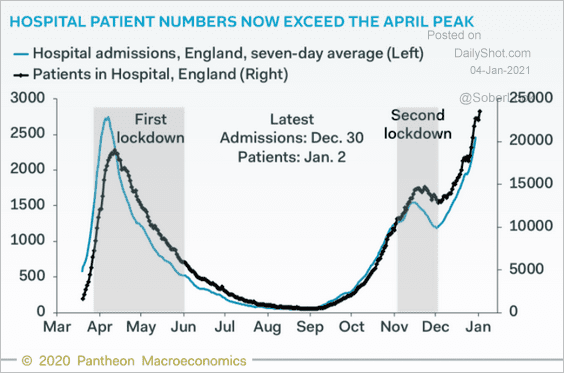 Source: Pantheon Macroeconomics
Back to Index
The Eurozone
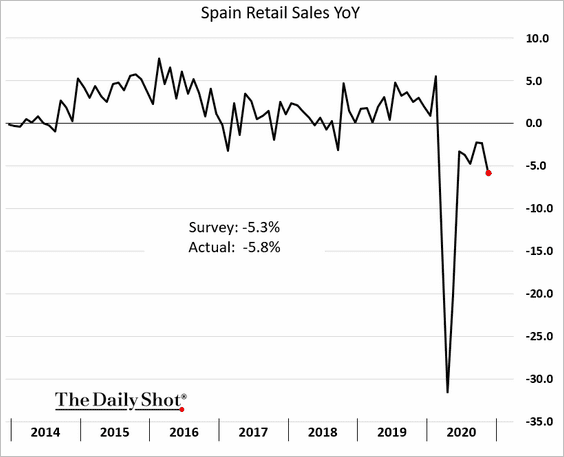
1. Spain’s retail sales deteriorated in November.
2. German hospitals are under pressure.
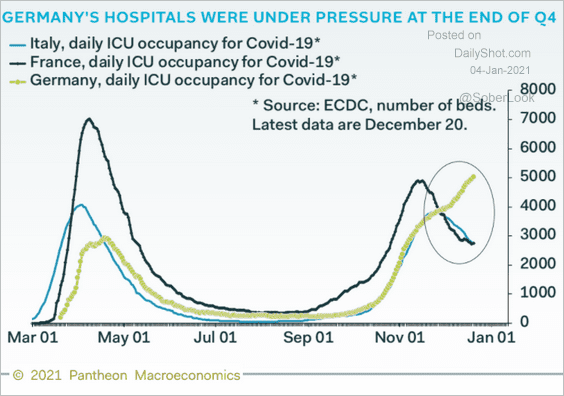 Source: Pantheon Macroeconomics
3. European governments will try to rein in spending this year.
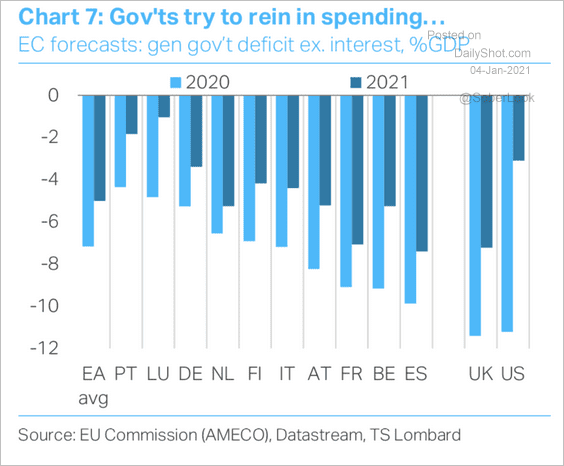 Source: TS Lombard
Back to Index
Asia – Pacific
1. Japan’s nominal wages are contracting again, and the core CPI has dropped back below zero.
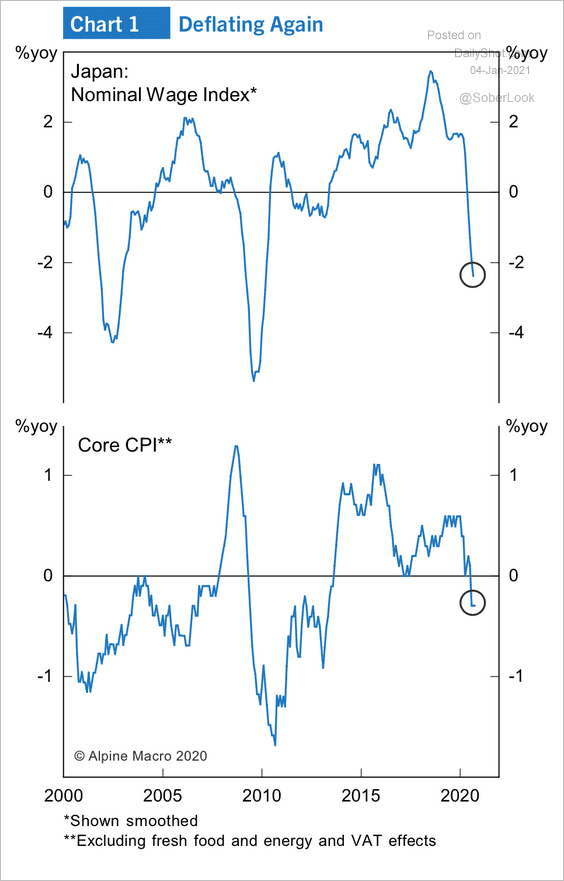 Source: Alpine Macro
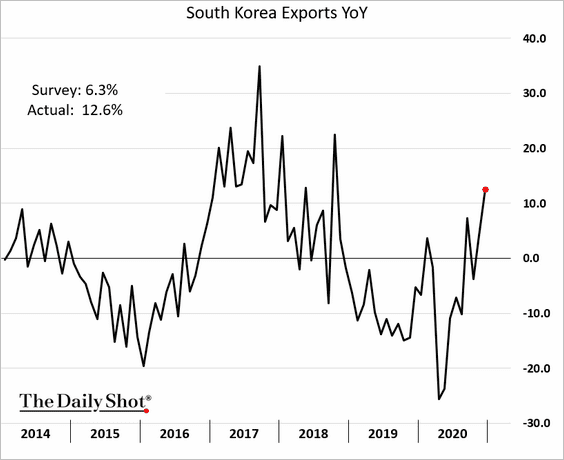
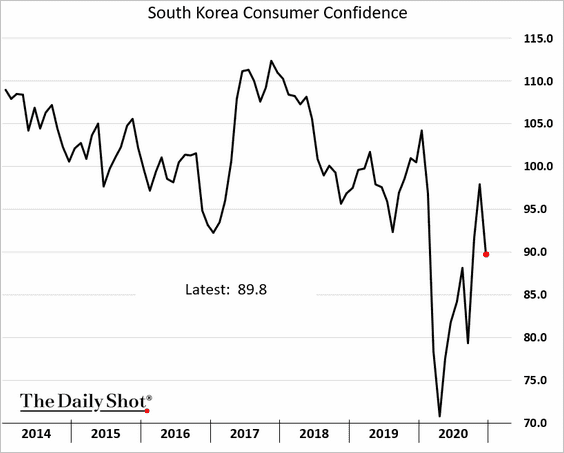
2. Next, we have some updates on South Korea.
• Exports strengthened last month.
• Consumer confidence pulled back.
• Growth in factory activity remains robust.
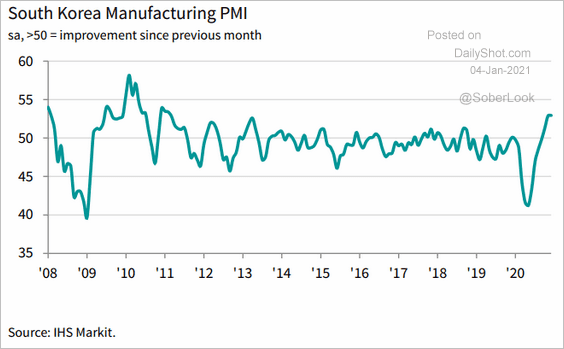 Source: IHS Markit
——————–
3. Taiwan’s manufacturing PMI hit a multi-year high.
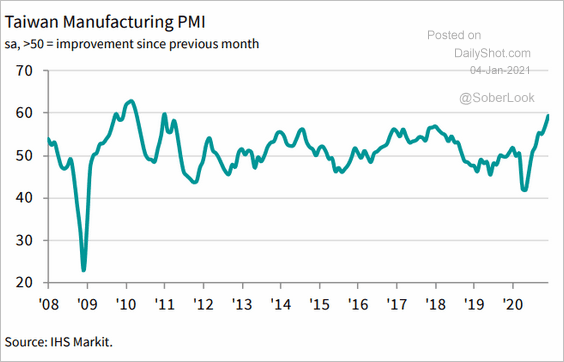 Source: IHS Markit
4. China’s massive credit expansion could support further upside in the Aussie dollar.
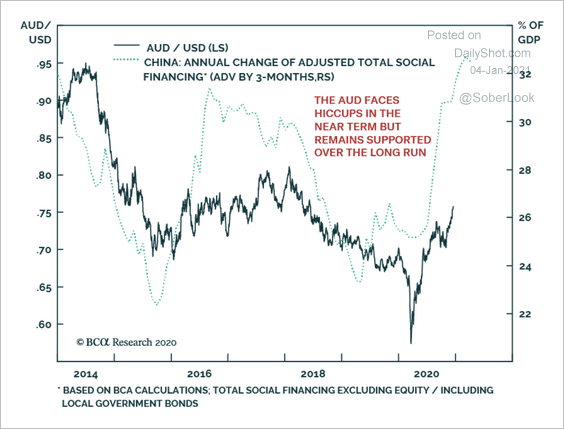 Source: BCA Research
Back to Index
China
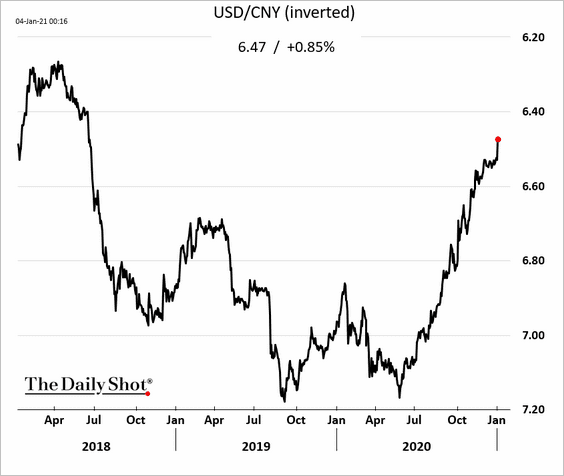
1. The renminbi continues to climb against the US dollar.
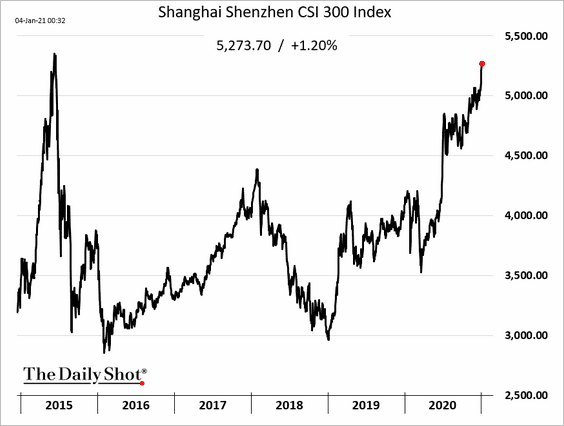
2. The stock market is pushing toward record highs.
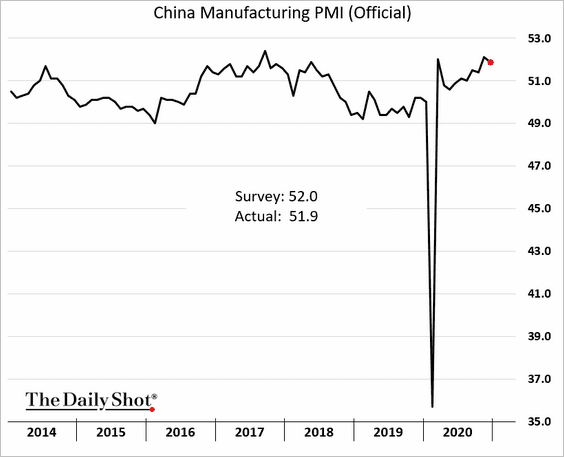
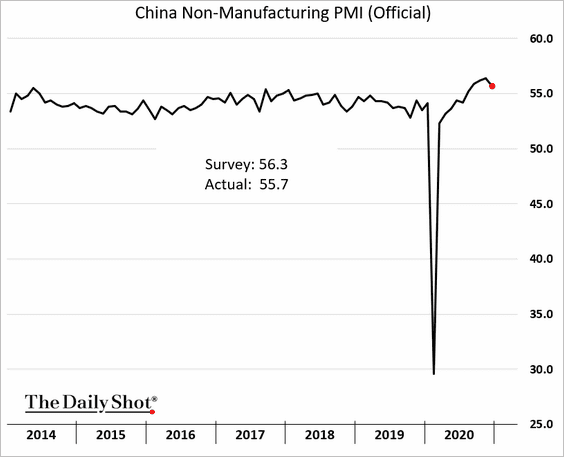
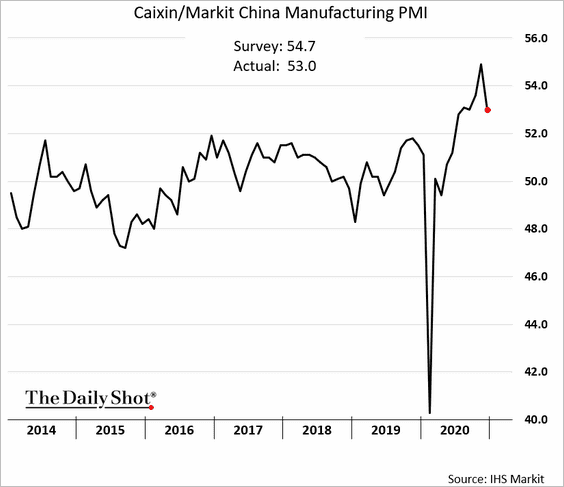
3. PMI indicators continue to show robust growth in business activity, but momentum softened in December.
• Manufacturing PMI (official):
• Services PMI:
• Markit manufacturing PMI:
——————–
4. China’s trade with Africa has grown in recent years.
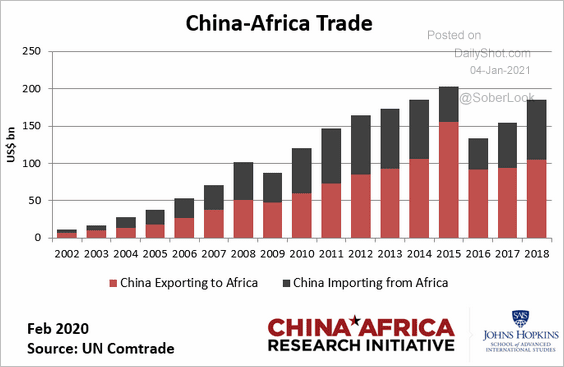 Source: China Africa Research Initiative Read full article
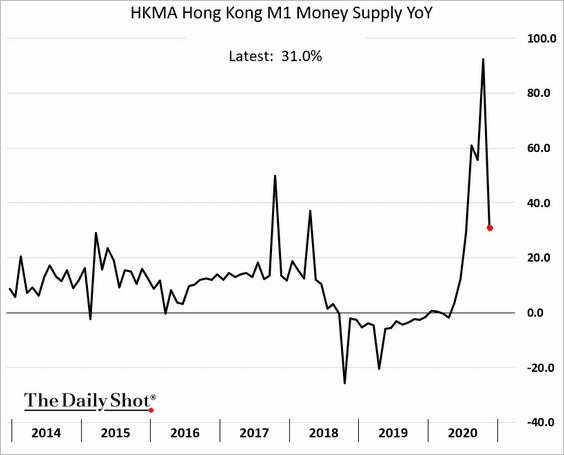
5. Hong Kong’s deposits retreated in November as foreign investors pulled out cash earmarked for the Ant Financial IPO.
Back to Index
Emerging Markets
1. Let’s run through EM Asia manufacturing PMI reports.
• Countries in growth mode:
– Indonesia:
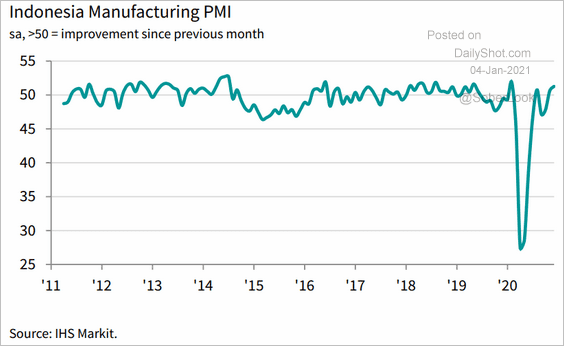 Source: IHS Markit
– Thailand:
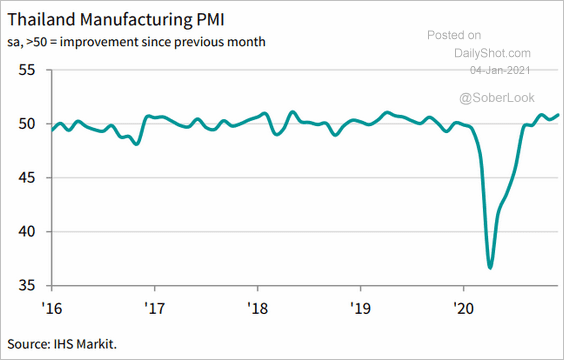 Source: IHS Markit
– Vietnam:
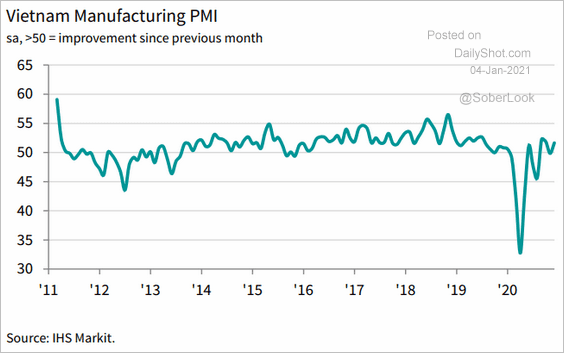 Source: IHS Markit
• Countries still struggling:
– The Philippines:
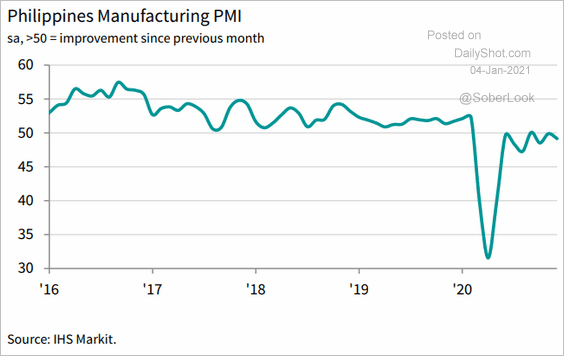 Source: IHS Markit
– Malaysia:
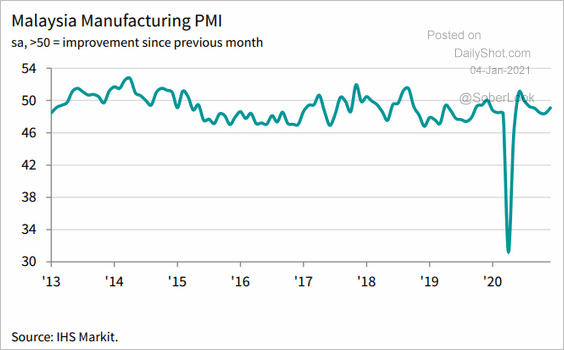 Source: IHS Markit
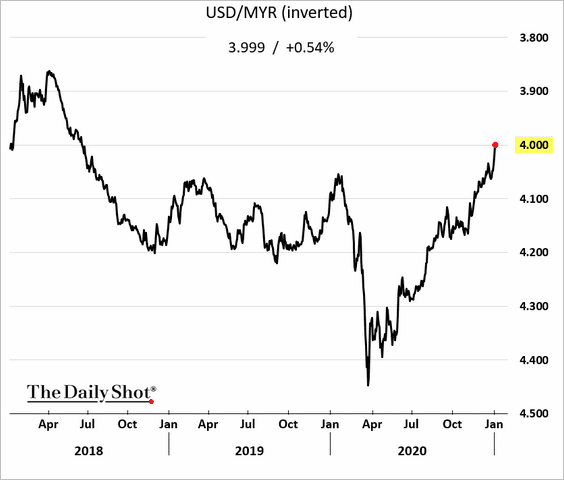
By the way, the Malaysian ringgit continues to strengthen, breaching 4 to the dollar for the first time since mid-2018.
——————–
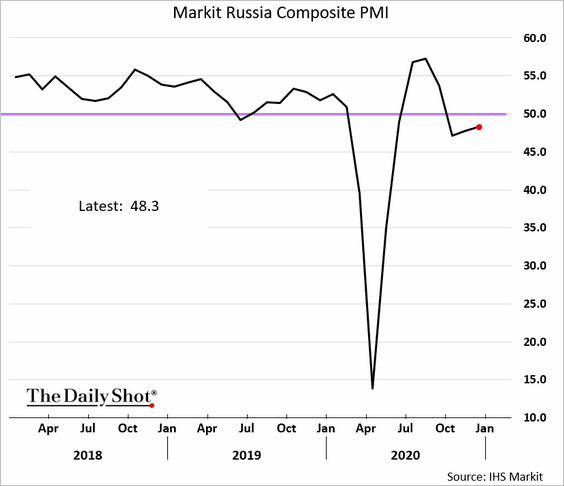
2. Russia’s business activity remains sluggish.
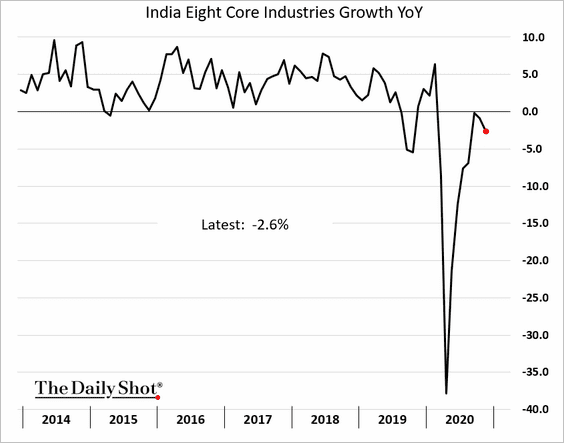
3. India’s core sector growth weakened further.
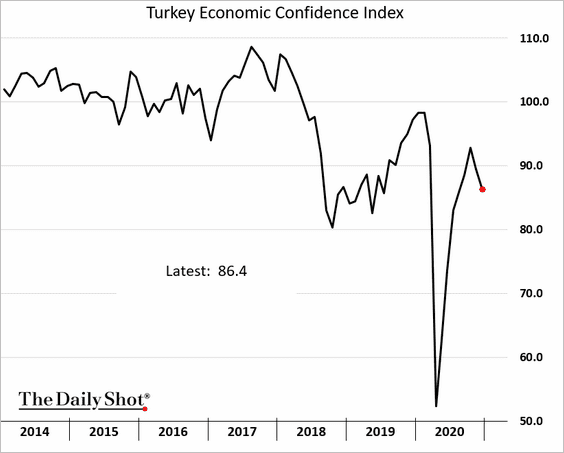
4. Turkey’s consumer confidence deteriorated last month.
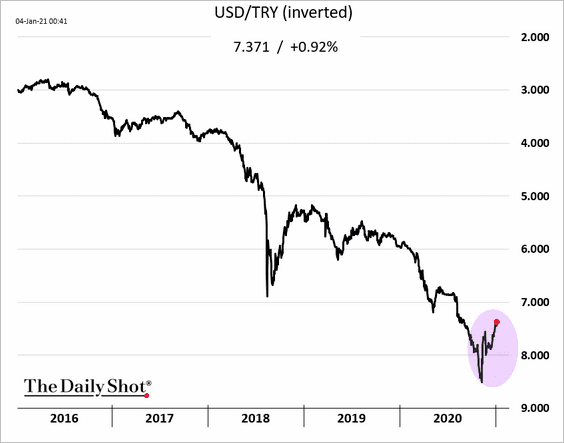
The Turkish lira continues to recover.
——————–
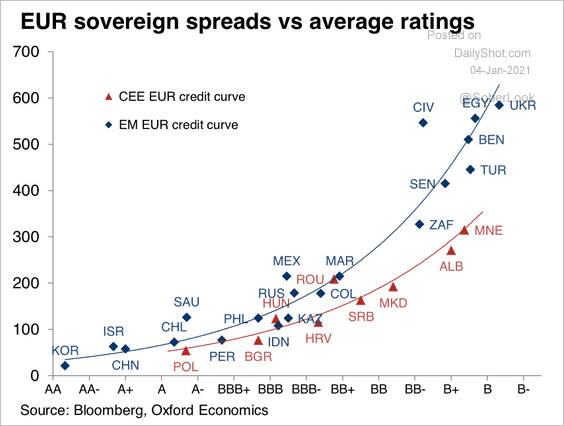
5. Central European countries’ debt has been trading at tighter spreads relative to the rest of EM.
 Source: Oxford Economics
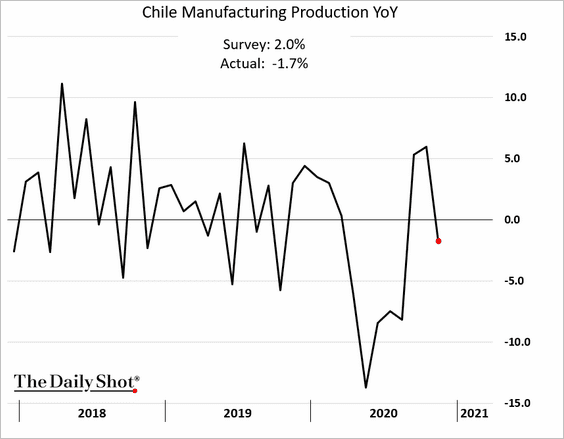
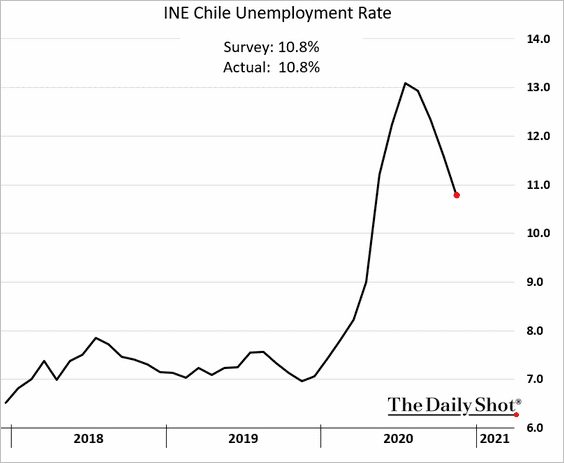
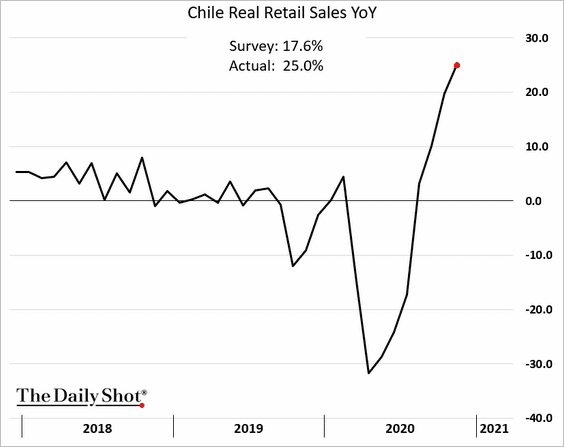
6. Next, we have some updates on Chile.
• The November manufacturing output surprised to the downside.
• The labor market continues to recover.
• Retail sales are up 25% from a year ago, topping economists’ estimates.
——————–
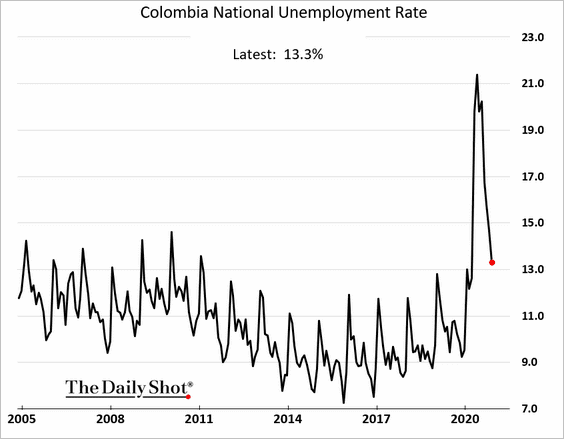
7. Colombia’s unemployment rate is dropping quickly.
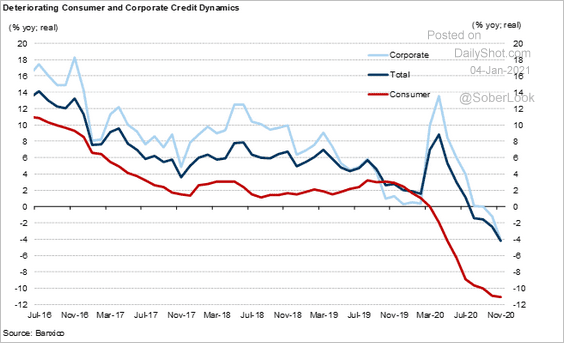
8. Mexico’s credit continues to shrink, which will be a drag on growth.
 Source: Goldman Sachs
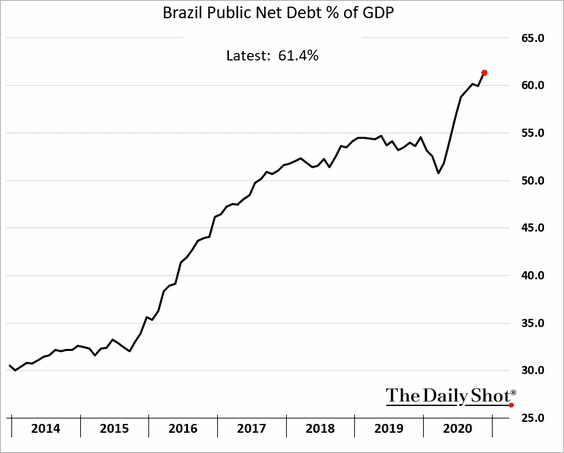
9. Brazil’s fiscal situation is still worsening.
10. Venezuela’s economy and oil production continue to deteriorate.
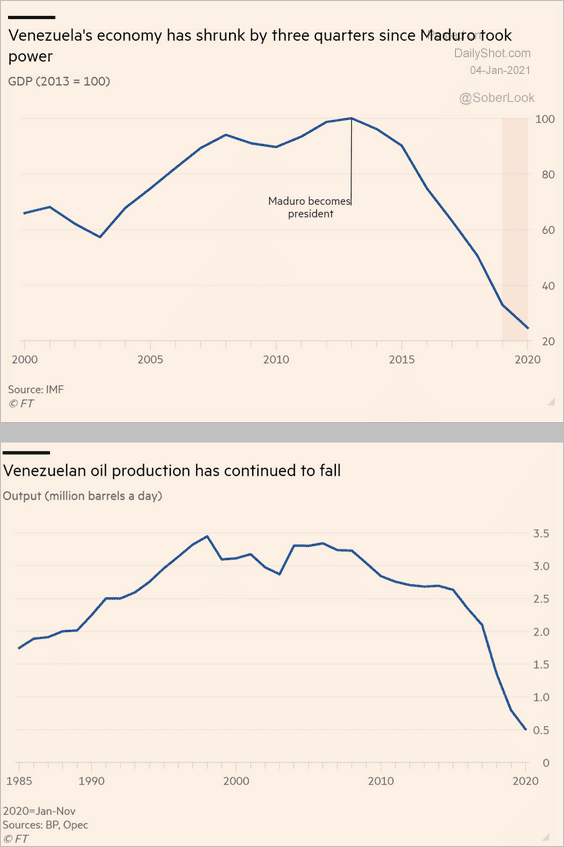 Source: @financialtimes Read full article
Back to Index
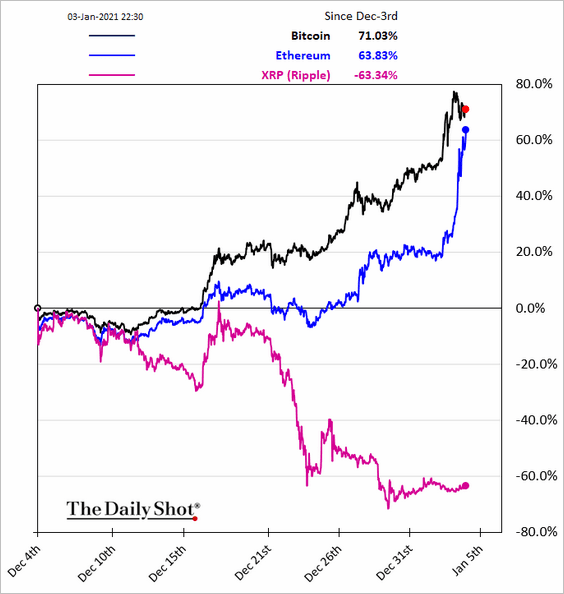
Cryptocurrency
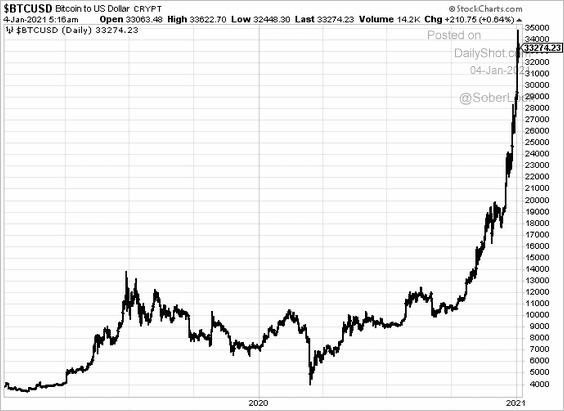
1. Bitcoin blasted past $30k.
So far, Bitcoin is following a similar uptrend seen in previous halving cycles.
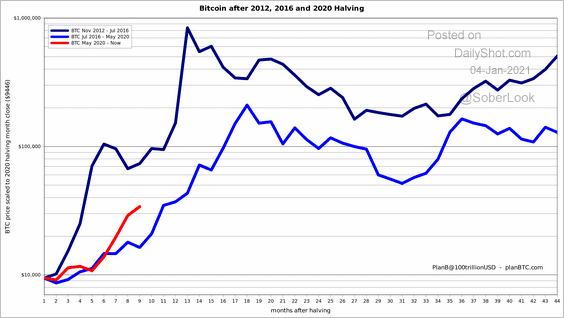 Source: @100trillionUSD
——————–
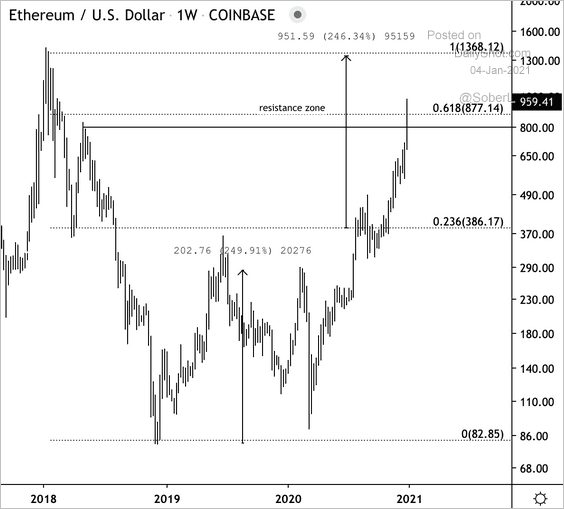
2. Ethereum rose sharply in recent days.
Here is a long-term chart of ETH/USD, which surged past resistance and is on its way to challenge 2018 highs.
 Source: @DantesOutlook
——————–
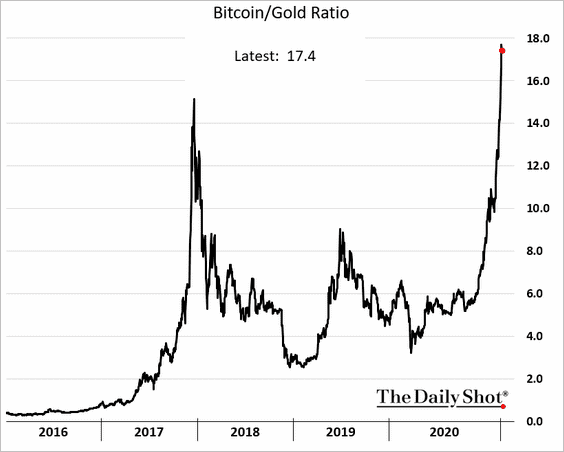
3. The Bitcoin-gold ratio hit a record high.
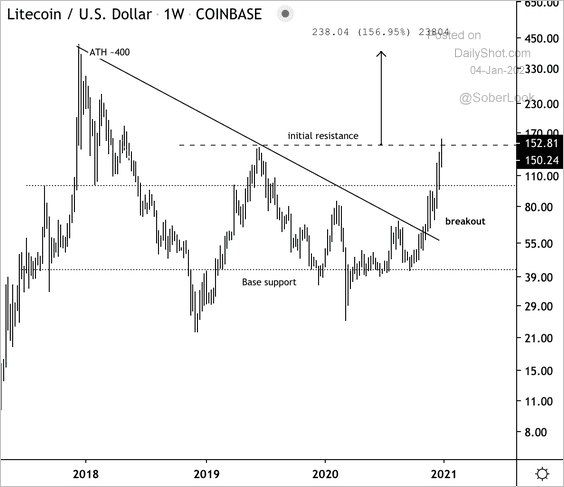
4. Litecoin has broken above a two-year downtrend.
 Source: @DantesOutlook
Back to Index
Commodities
1. Agricultural commodities have sharply outperformed the broad commodity index this year.
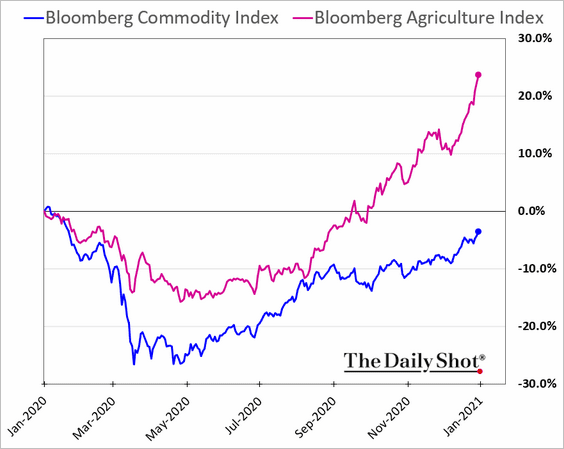 Source: @TheTerminal, Bloomberg Finance L.P.
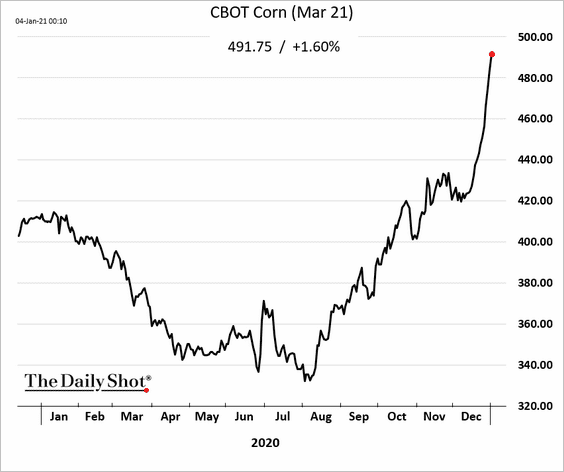
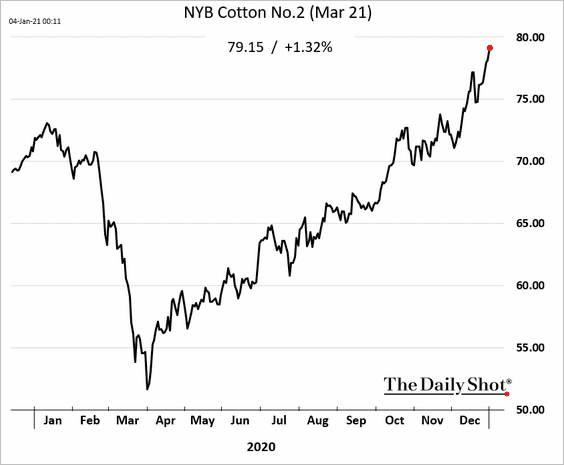
Here are corn and cotton futures.
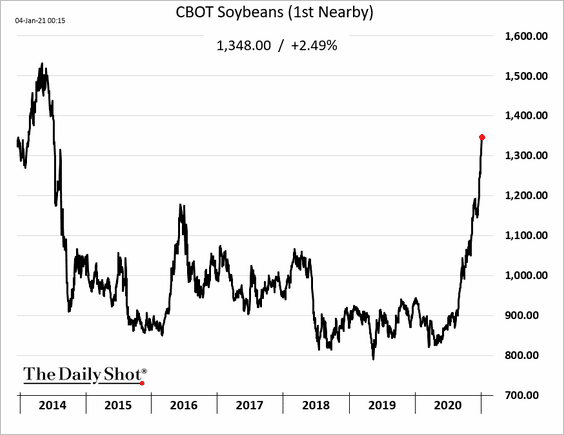
The CBOT soybean futures front contract hit the highest level since 2014.
——————–
2. Industrial metals have also outperformed.
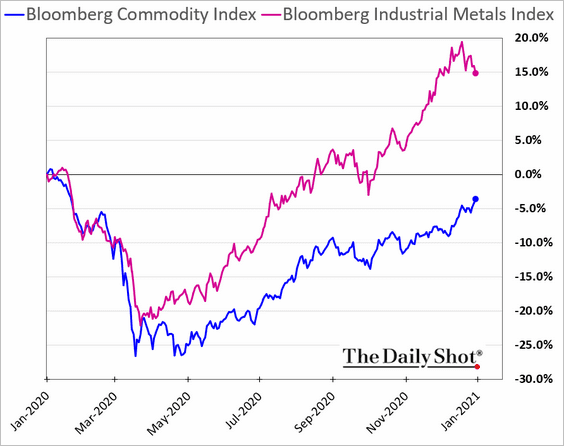 Source: @TheTerminal, Bloomberg Finance L.P.
Here is copper vs. previous bull markets.
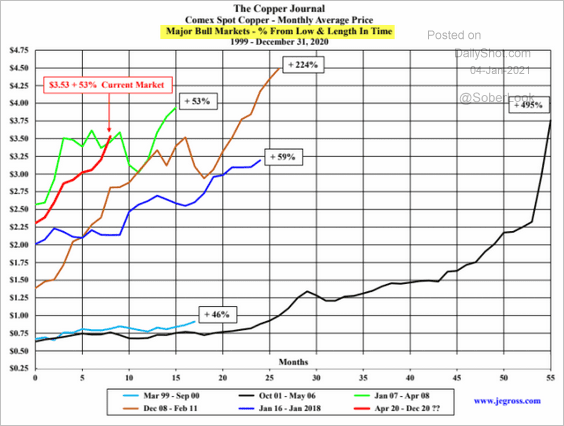 Source: John E Gross
——————–
3. Gold ETFs experienced substantial outflows in recent weeks.
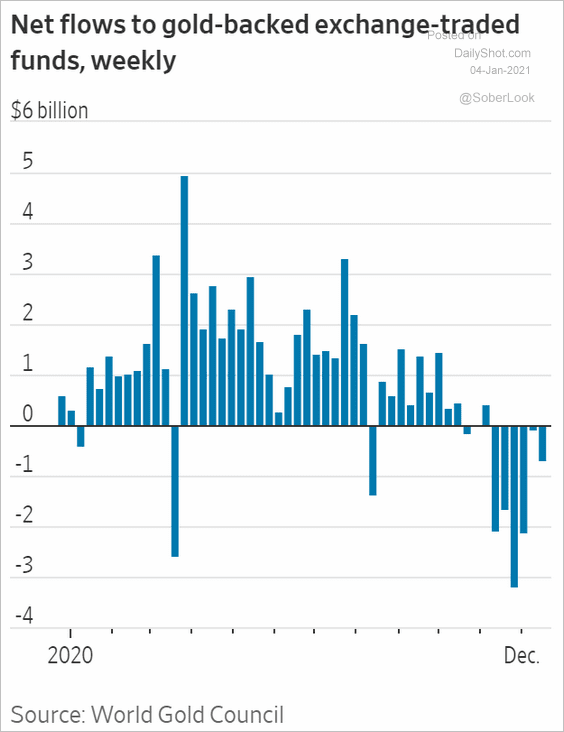 Source: @WSJ Read full article
But the weak dollar has been supporting gold.
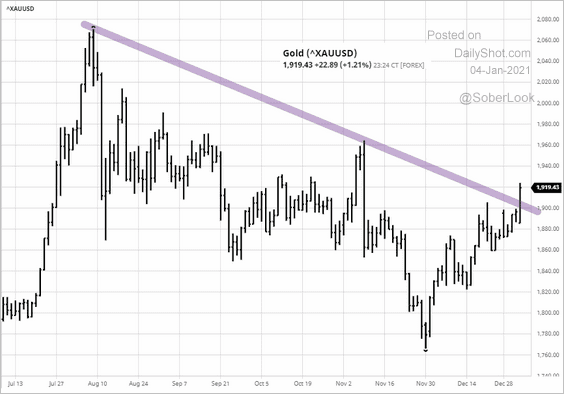 Source: barchart.com
——————–
4. China’s steel inventory levels quickly declined into the winter season.
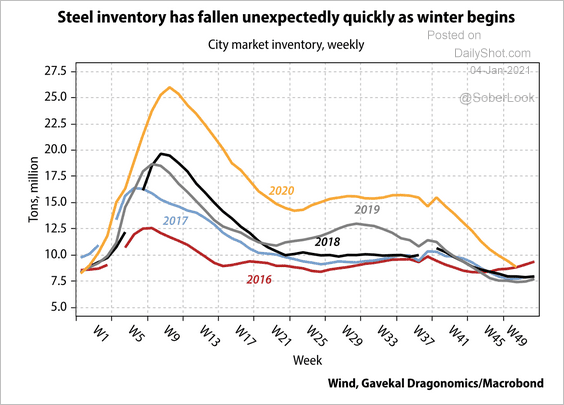 Source: Gavekal Research
Back to Index
Energy
Asian LNG outperformed other key commodities this year.
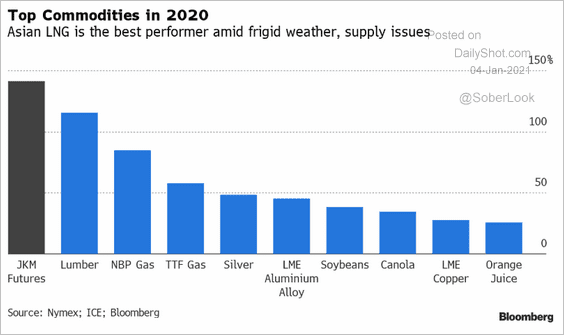 Source: @SStapczynski
Higher prices are boosting LNG trade.
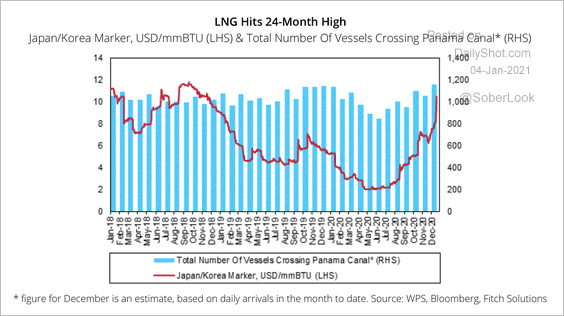 Source: Fitch Solutions Macro Research
This chart shows US LNG exports.
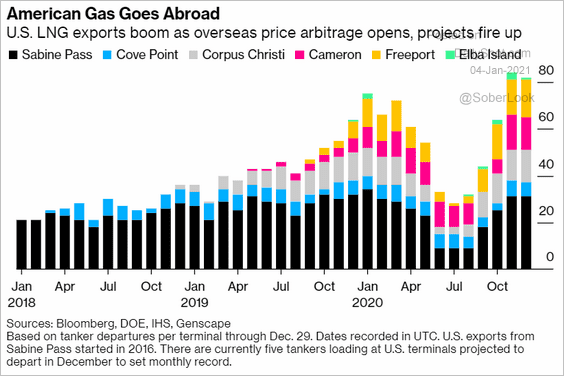 Source: @markets Read full article
Back to Index
Equities
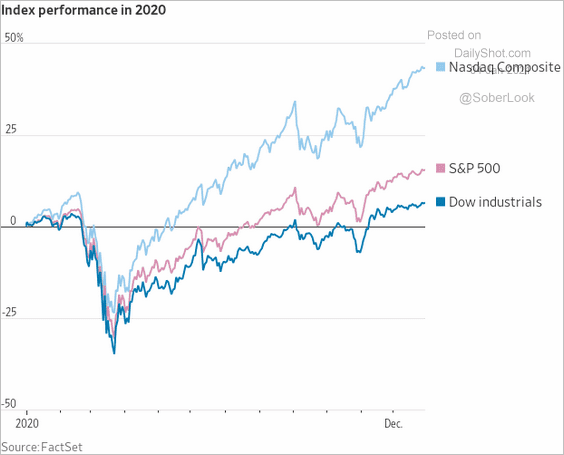
1. The S&P 500 hit a record last week boosted by the passage of the new stimulus bill. Here is the 2020 relative performance of major US indices.
 Source: @ahirtens
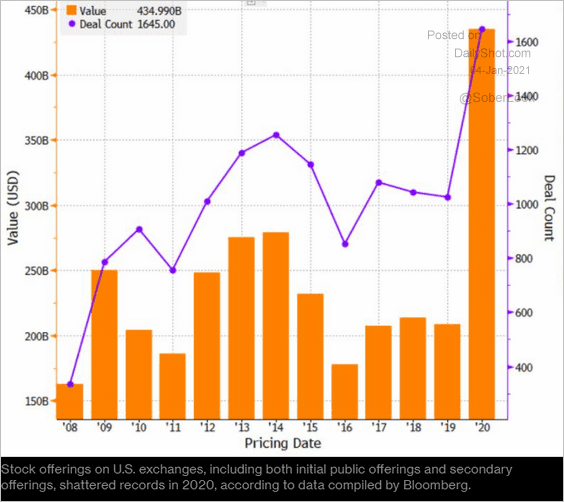
2. The 2020 IPO volume was impressive.
 Source: @markets Read full article
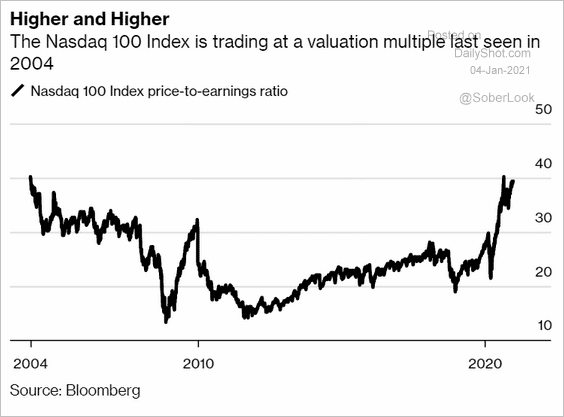
3. The Nasdaq 100 valuation multiple is the highest since 2004.
 Source: @markets Read full article
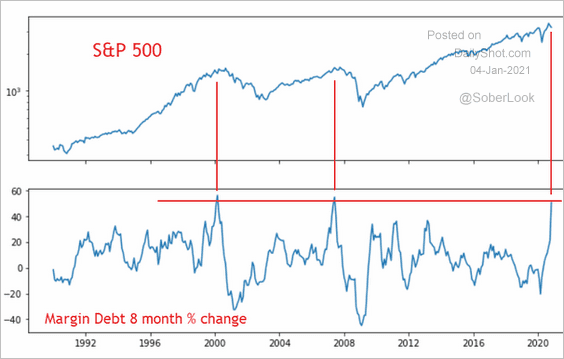
4. Margin debt has risen sharply this year.
 Source: @bullmarketsco, h/t @jessefelder
5. This chart shows the average daily visits to retail brokerage websites.
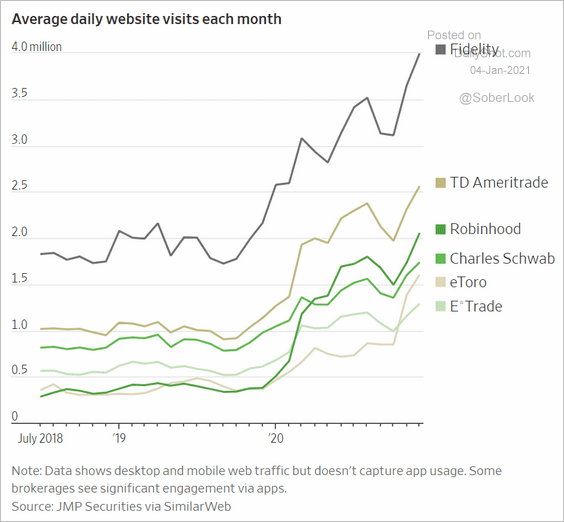 Source: @WSJ Read full article
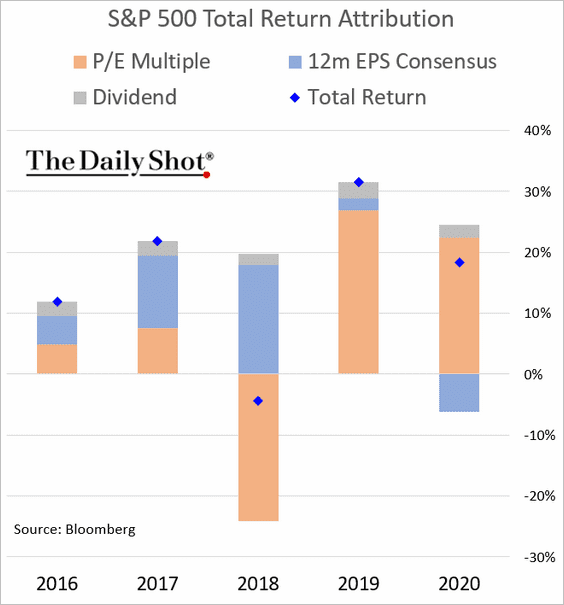
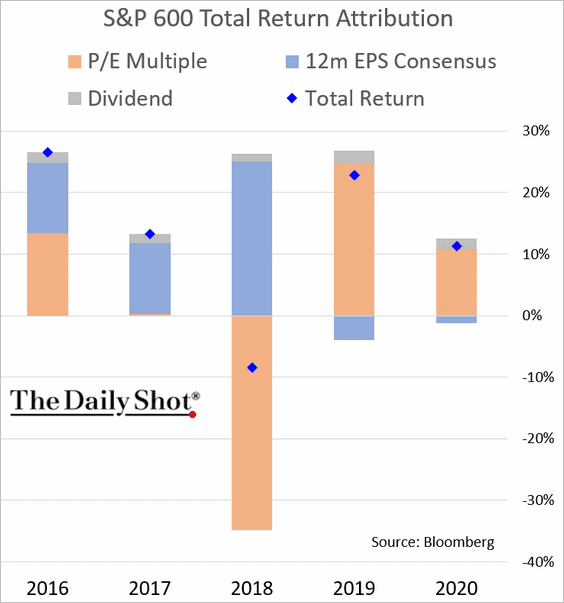
6. Below is the performance attribution for the S&P 500 and the S&P 600 (small caps).
——————–
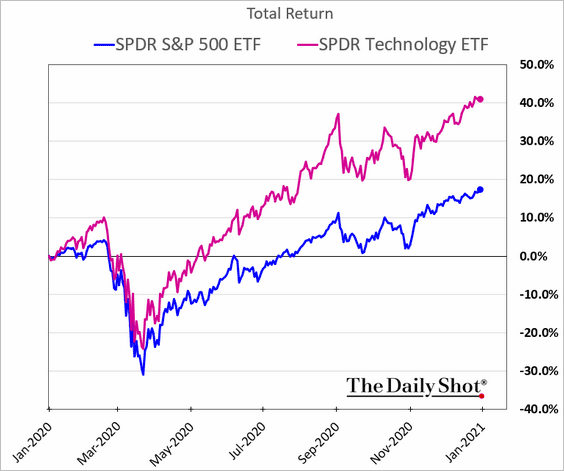
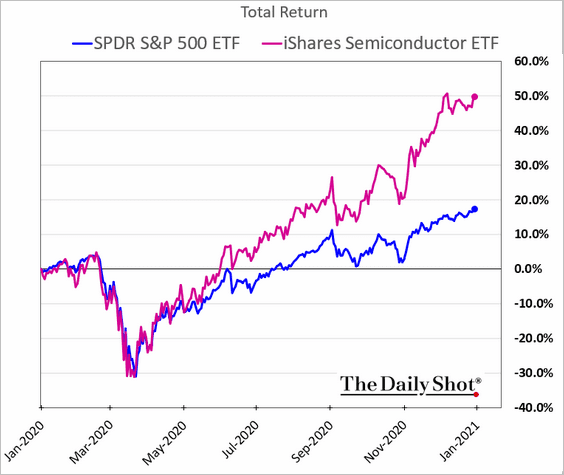
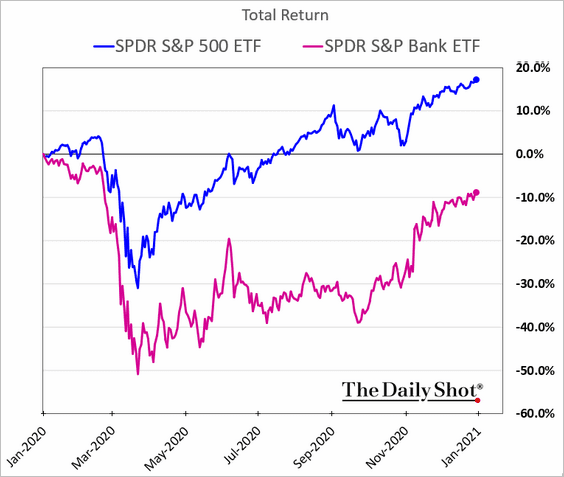
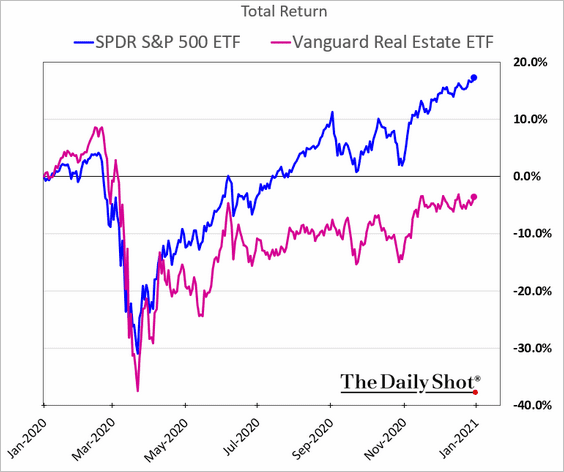
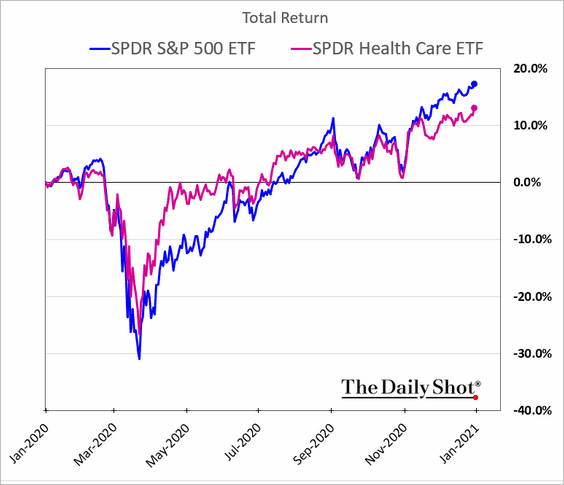
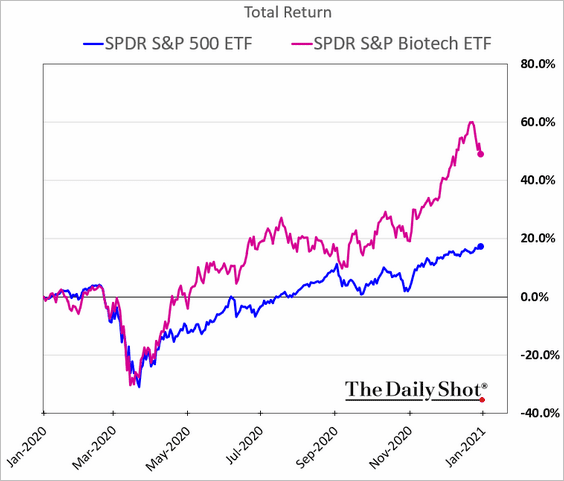
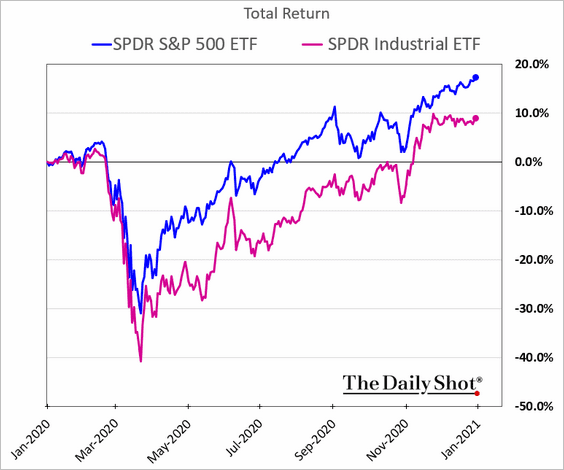
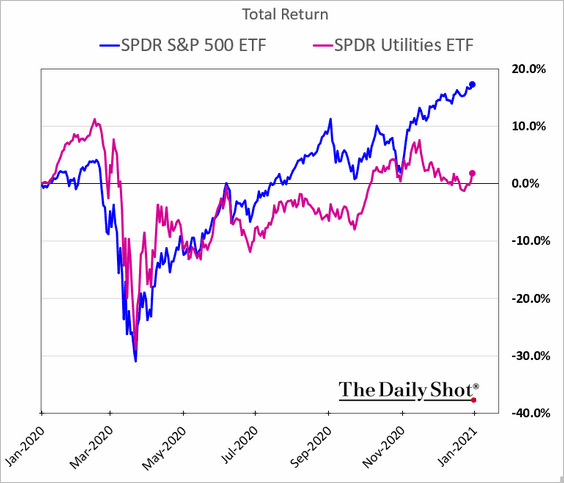
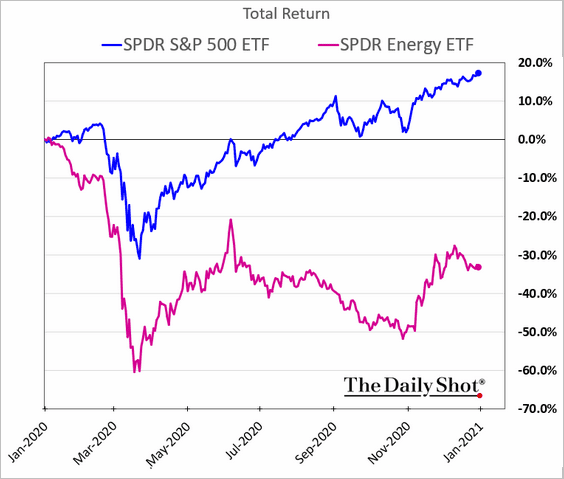
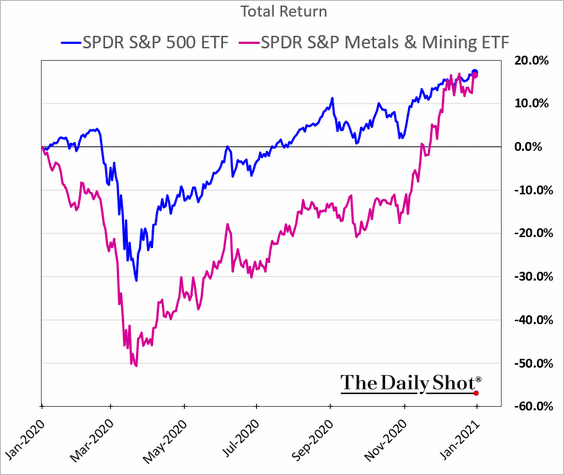
7. Next, we have some sector performance data for 2020.
• Contributions to the S&P 500 performance:
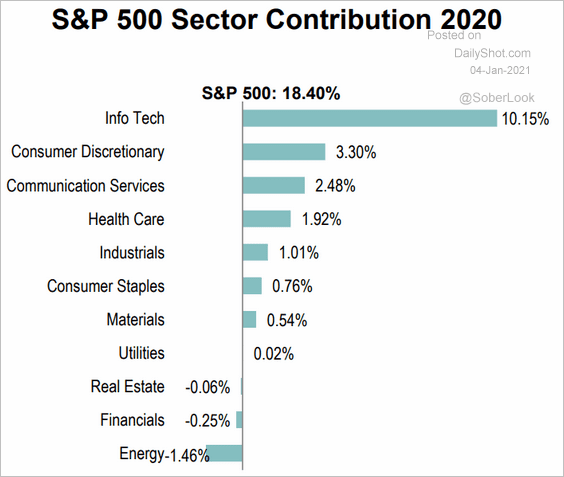 Source: S&P Global Market Intelligence
• Tech:
• Semiconductors:
• Banks:
• REITs:
• Healthcare:
• Biotech:
• Industrials:
• Utilities:
• Energy:
• Metals & Mining:
• Transportation and airlines:
![]()
![]()
——————–
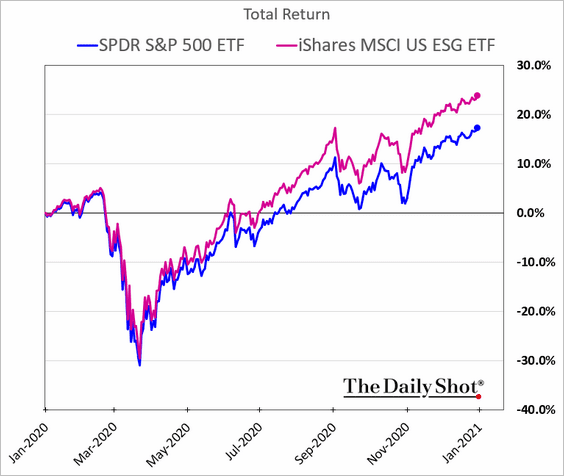
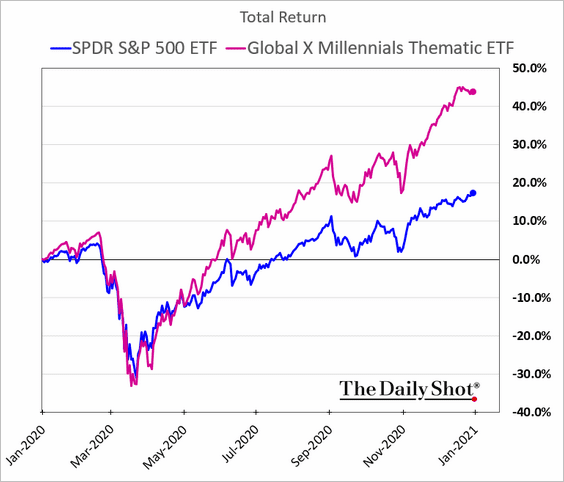
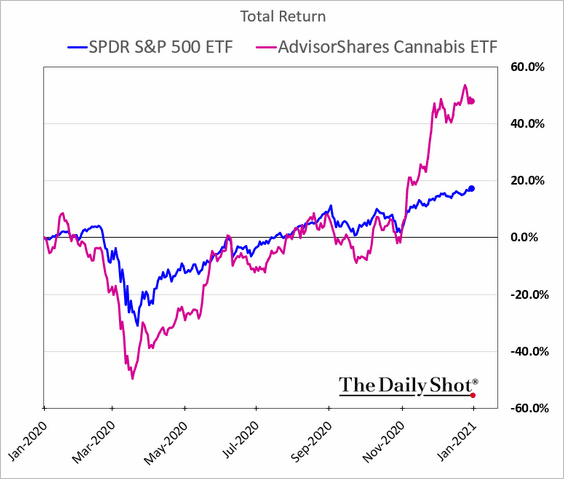
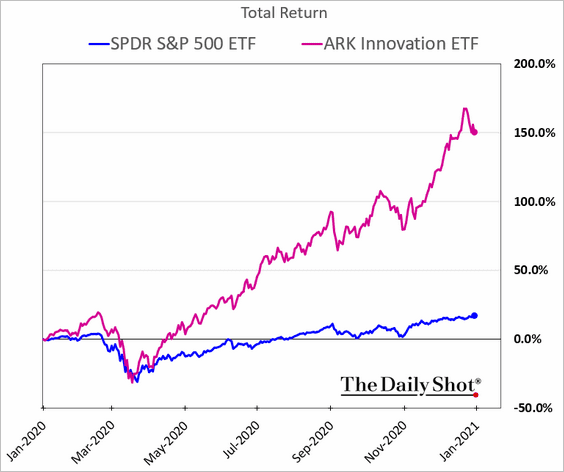
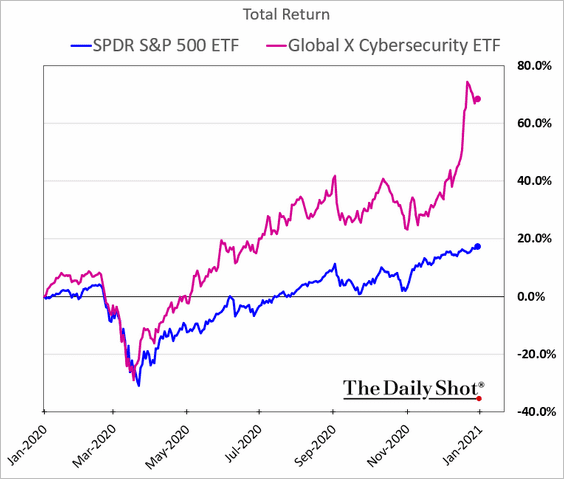
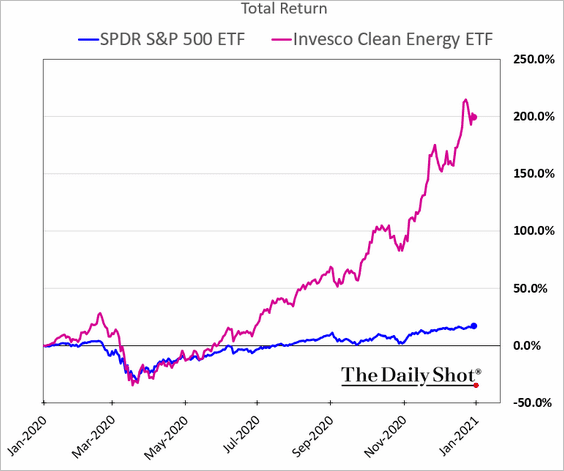
8. Some sub-sectors and “thematic” portfolios experienced tremendous gains in 2020.
• ESG:
• Post-IPO shares:

• Companies with a focus on Millennials:
• Cannabis:
• Innovation ETF:
• Cybersecurity:
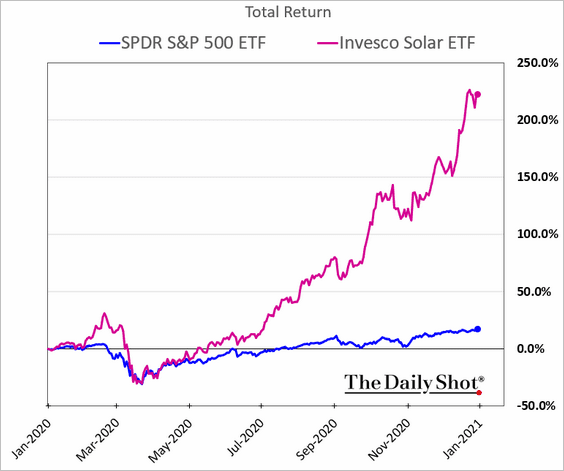
• Clean energy (2 charts):
——————–
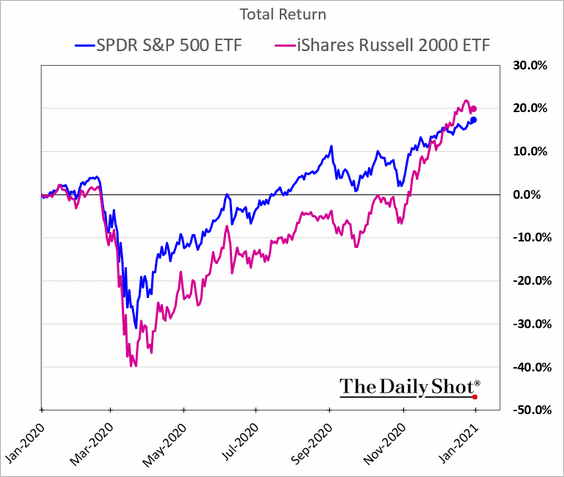
9. Finally, we have some factor/style performance charts.
• Small caps:
• Equal-weight:

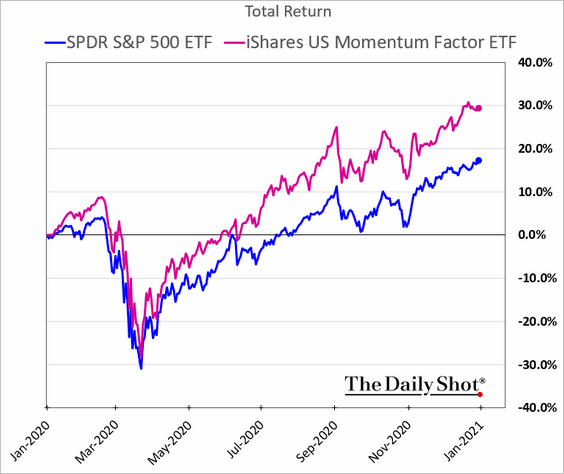
• Momentum:
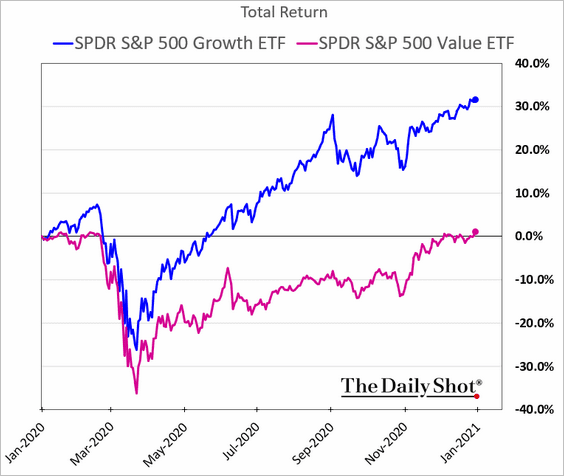
• Growth vs. value:
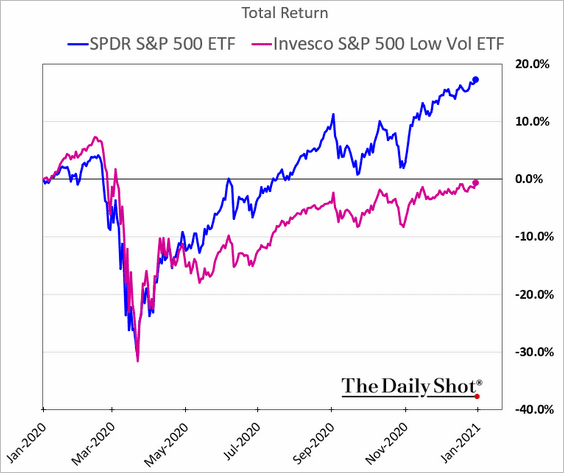
• Low-vol:
Back to Index
Credit
US junk bond yields hit a record low.
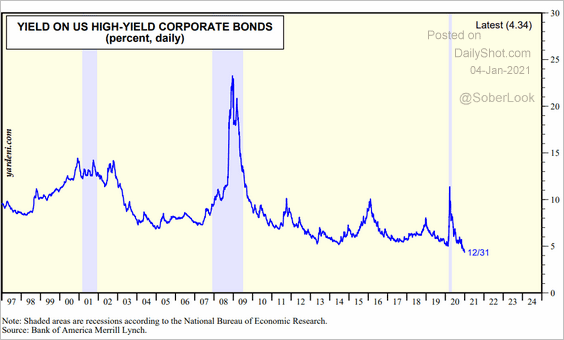 Source: Yardeni Research
Back to Index
Rates
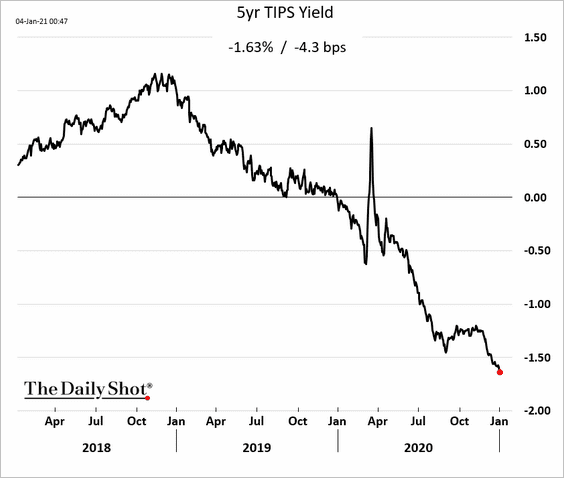
1. US real rates are moving deeper into negative territory as inflation expectations climb.
2. Analysts expect the Fed to hold rates near zero for quite some time.
• Market expectations and the FOMC forecast:
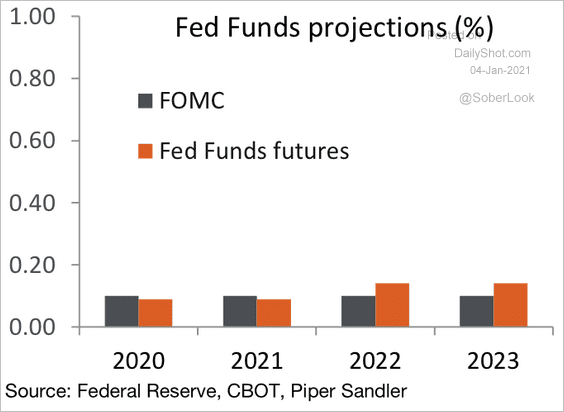 Source: Piper Sandler
• An estimate based on employment and inflation:
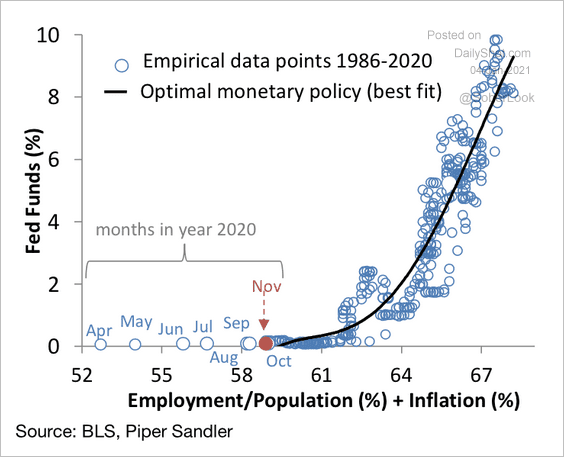 Source: Piper Sandler
Is there a risk of a vaccine-driven economic normalization boosting inflation and triggering a 2013-style taper-tantrum?
——————–
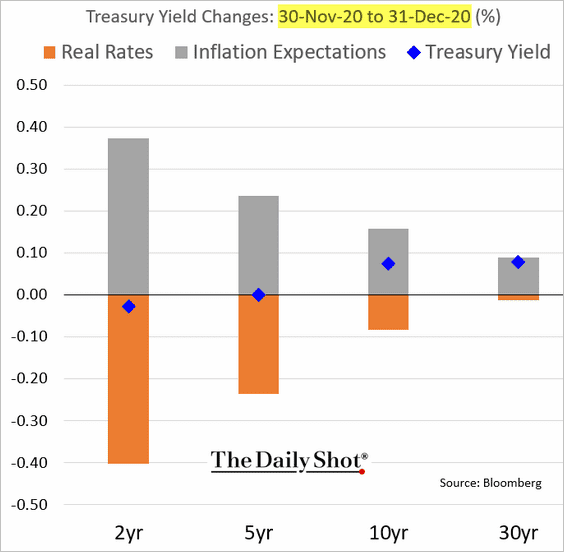
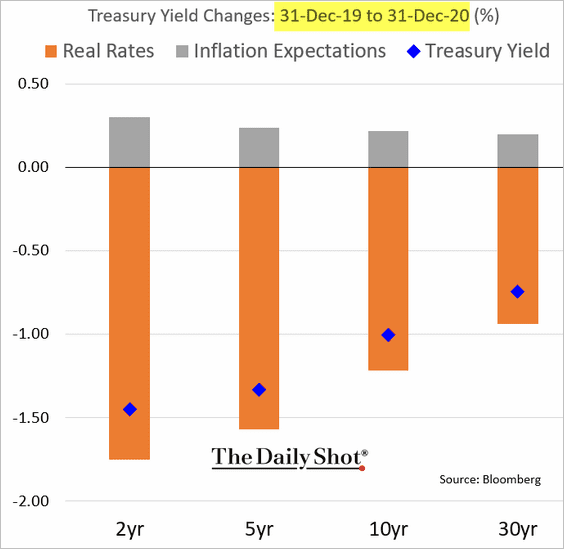
3. Here is the attribution of Treasury yield changes.
• December:
• 2020:
——————–
4. The copper-to-gold ratio continues to point to higher Treasury yields.
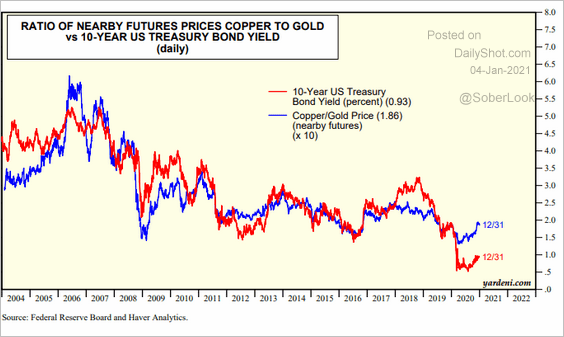 Source: Yardeni Research
5. There was a great deal of focus on symmetrical/average inflation targeting in 2020.
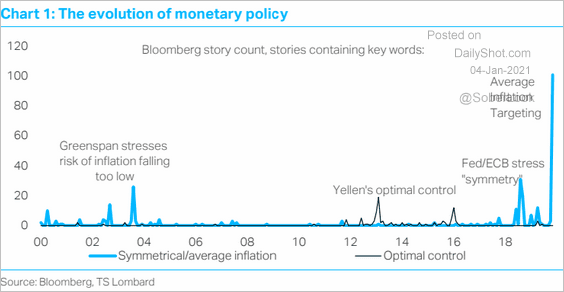 Source: TS Lombard
6. US interest rates have a superior risk/reward profile among developed countries (absent currency risk).
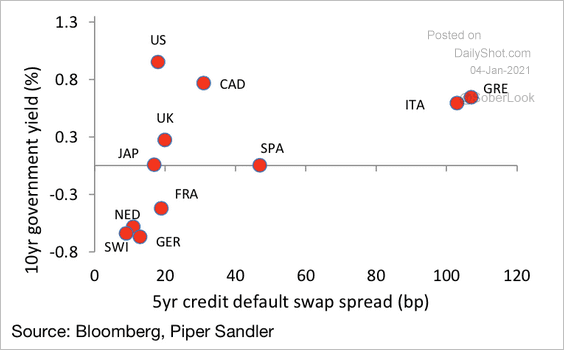 Source: Piper Sandler
Back to Index
Global Developments
How did different asset classes perform in 2020 (2 charts)?
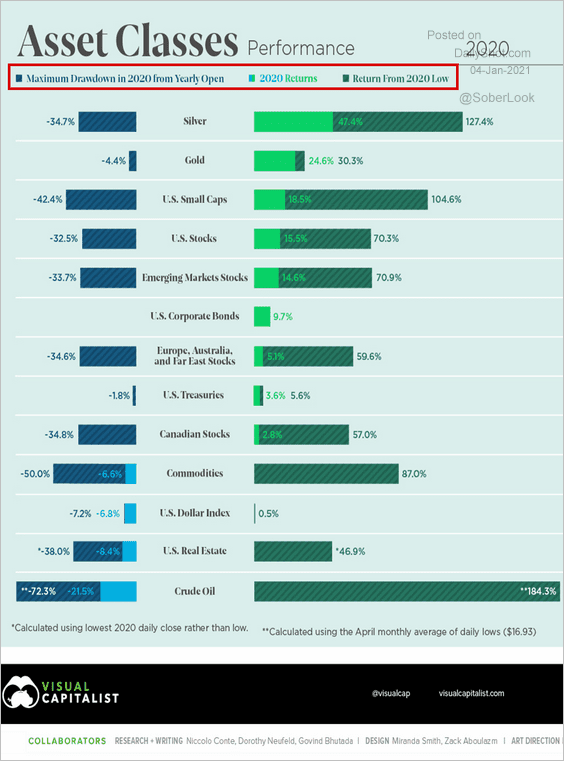 Source: Visual Capitalist Read full article
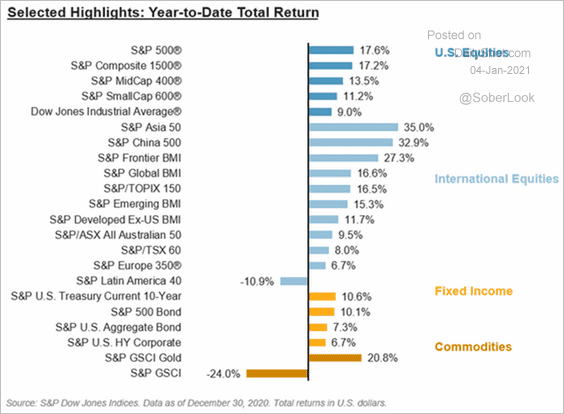 Source: S&P Global Market Intelligence
——————–
Food for Thought
1. Likelihood of eviction:
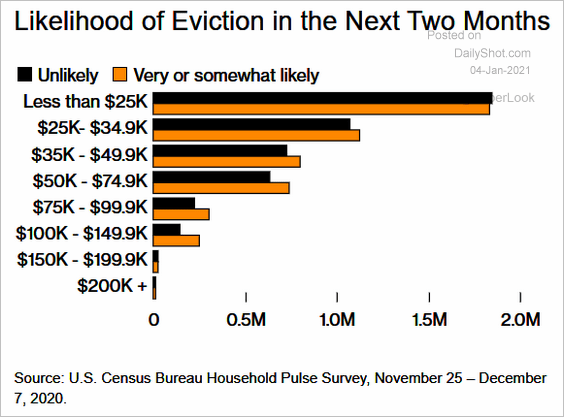 Source: @BW Read full article
2. Financing holiday spending with a personal loan:
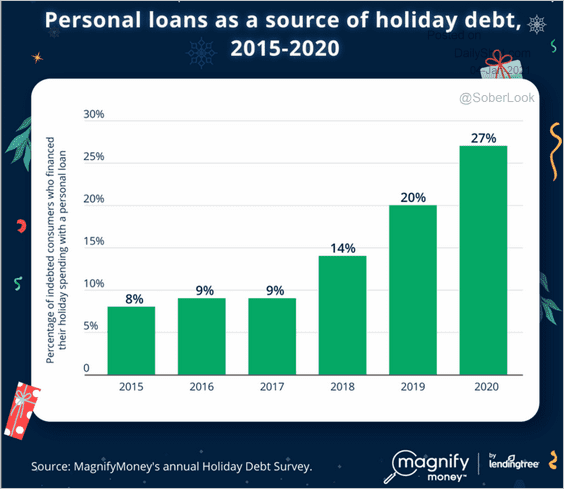 Source: MagnifyMoney Read full article
3. Share of liabilities by generation:
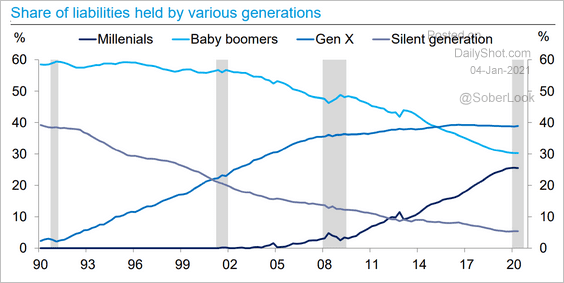 Source: Deutsche Bank Research
4. Probes into tech companies:
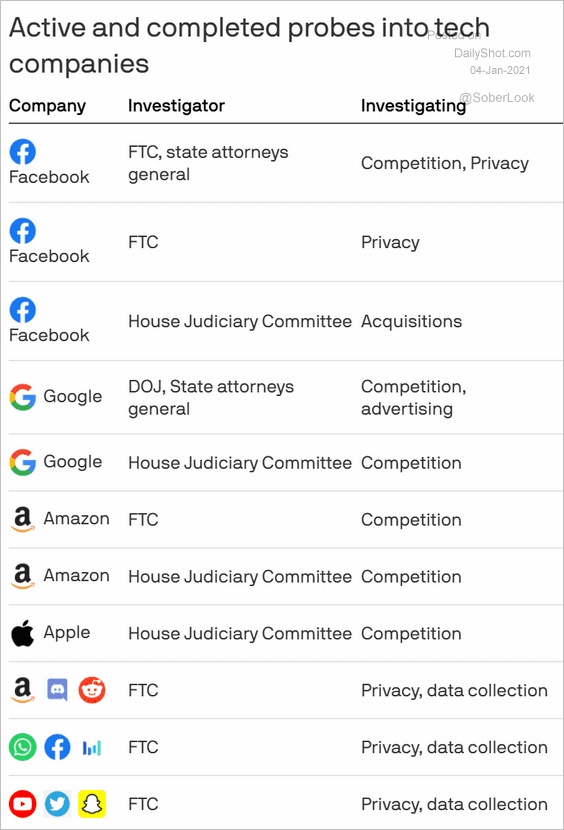 Source: @axios Read full article
5. Wealthiest US zip codes:
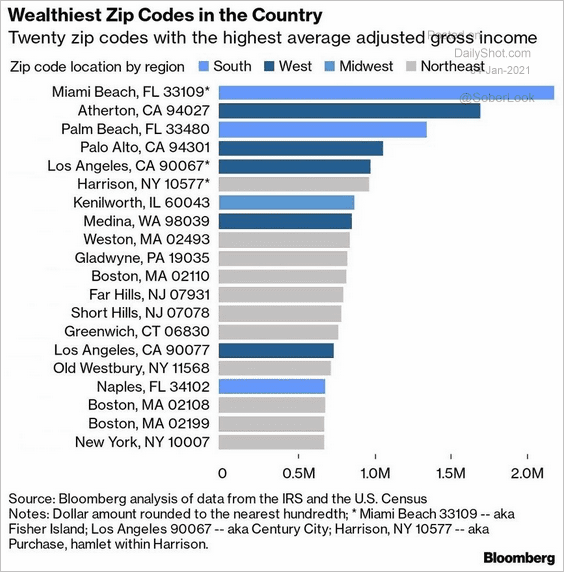 Source: @business Read full article
6. Cities reaching ten million people over the next decade:
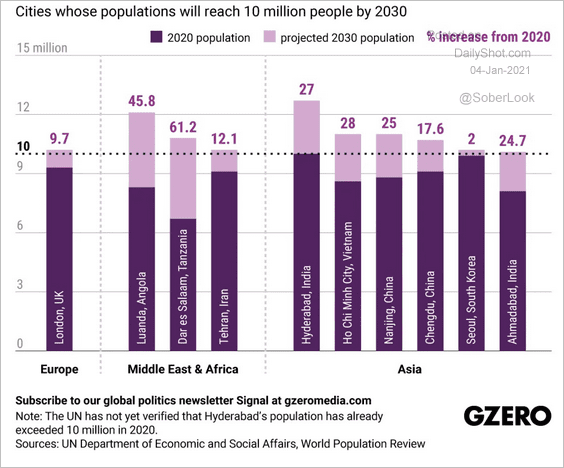 Source: GZERO Media Read full article
7. Vaccinations (2 charts):
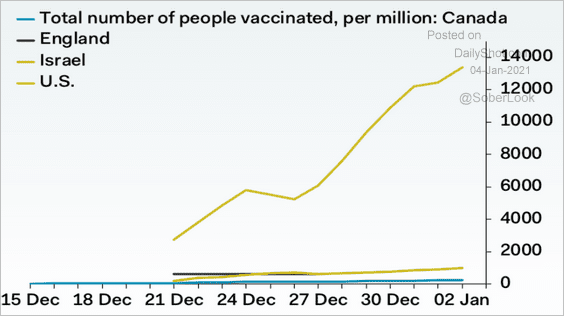 Source: Pantheon Macroeconomics
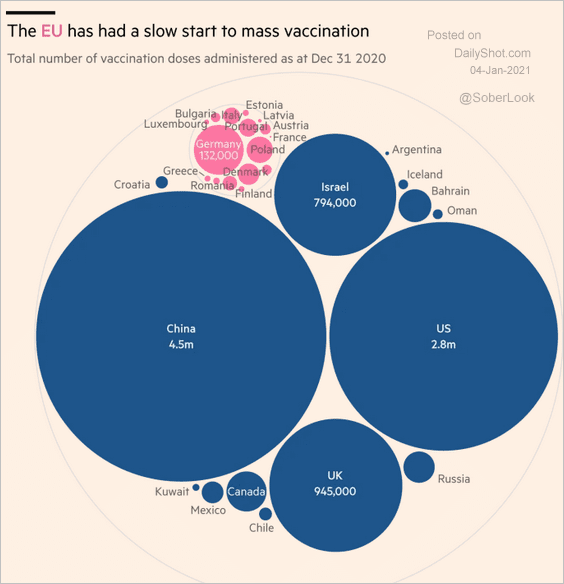 Source: @financialtimes Read full article
——————–
9. Countries most affected by terrorism:
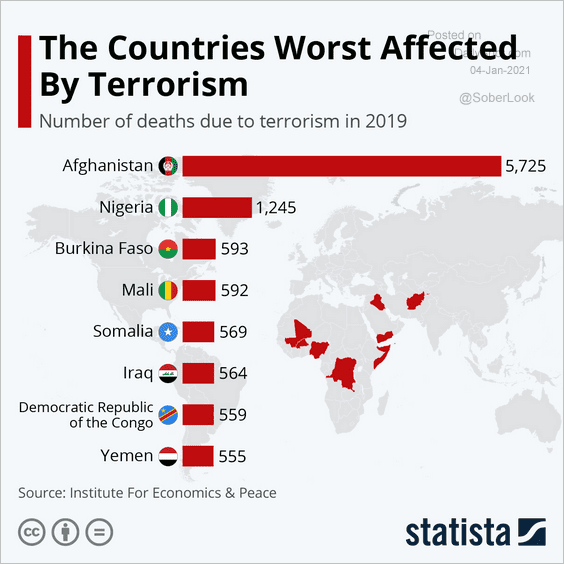 Source: Statista
10. Origins of highly educated migrants in OECD nations:
 Source: Statista
11. 2020 online search activity over time:
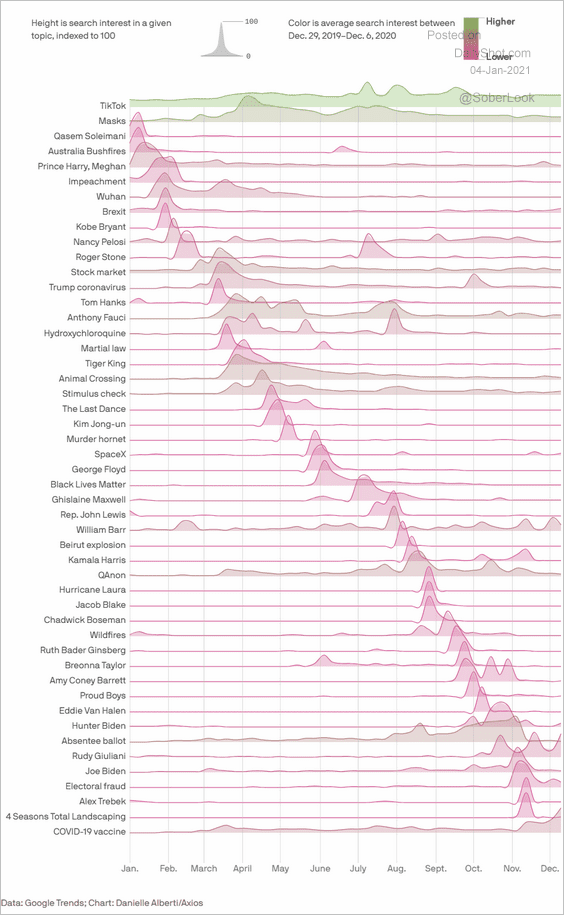 Source: @axios Read full article
——————–
Back to Index