
The Daily Shot: 30-Jun-23
• The United States
• Canada
• The United Kingdom
• The Eurozone
• Europe
• Japan
• Asia-Pacific
• China
• Emerging Markets
• Cryptocurrency
• Energy
• Equities
• Alternatives
• Credit
• Rates
• Global Developments
• Food for Thought
The United States
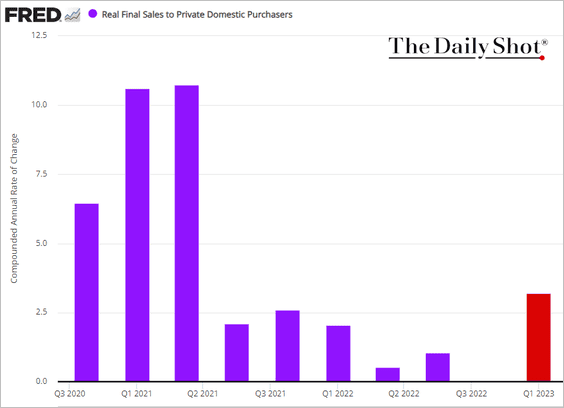
1. The Q1 GDP growth was revised sharply higher, …

… boosted by trade and consumer spending.

• Here are the contributions to GDP growth.

• This chart shows the growth in real final sales to private domestic purchasers (the “core” GDP).
——————–
2. Initial jobless claims unexpectedly declined last week. Some analysts suggested the drop was just noise and that unemployment applications will rebound in the weeks ahead.


Layoff indicators keep trending higher.
 Source: Pantheon Macroeconomics
This chart shows continuing claims.

——————–
3. Pending home sales were lower than expected last month, …

… pointing to softer existing home sales in June.
 Source: Pantheon Macroeconomics
Mortgage rates near 7% …
 Source: Mortgage News Daily
… as well as depressed inventories remain a headwind for the housing market.
 Source: Redfin
——————–
4. The Citi Economic Surprise Index surged this week.

5. Fed officials are talking about two more rate hikes.
 Source: @Jonnelle
• July looks like a done deal. Could we see another increase in September or November?

• The terminal rate is pushing toward 5.5%.


• The 2-year Treasury yield is nearing 5% again.

• The yield curve inversion has been deepening (2 charts).


——————–
6. Recession expectations have been pushed back, according to an investor survey by Deutsche Bank.
 Source: Deutsche Bank Research
Most expect a somewhat shallow recession.
 Source: Deutsche Bank Research
Back to Index
Canada
The CFIB small and medium-sized business sentiment index declined this month.

Below are the CFIB levels by sector …

… and the changes since May.

Back to Index
The United Kingdom
1. Consumer credit softened in May.

But mortgage approvals have stabilized.

——————–
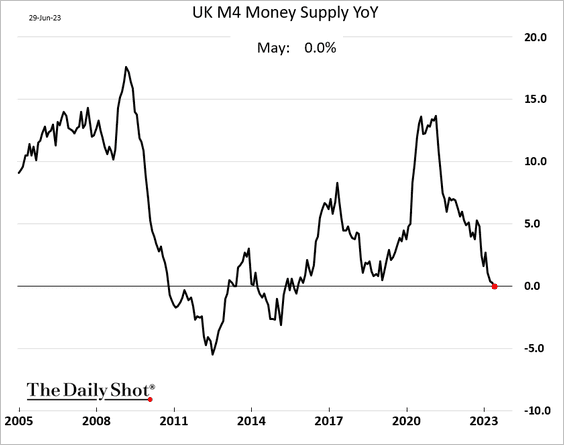
2. The broad money supply is now flat year-over-year (2 charts).
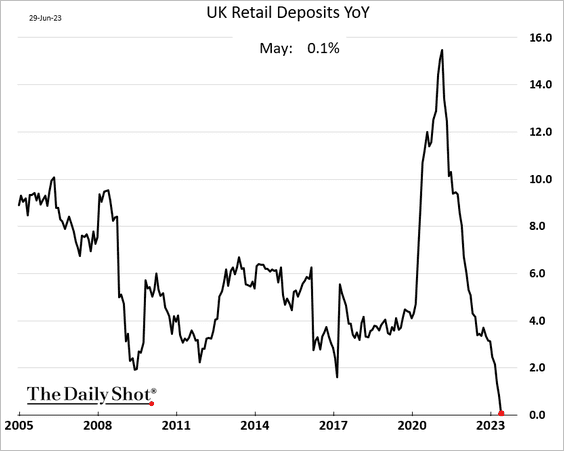
Excess savings are gone on an inflation-adjusted basis.
 Source: Pantheon Macroeconomics
——————–
2. Home prices edged higher this month (relative to May), according to Nationwide. Year-over-year, prices are down 3.5%.

3. The Lloyds Bank business sentiment indicator has been rebounding.

4. Rate hike expectations continue to climb.

The market pricing for February of next year hit 6.21%.

Back to Index
The Eurozone
1. Let’s begin with some inflation data.
• Germany’s CPI edged higher this month.

Import prices were down 9.1% (year-over-year) in May.

• Spain’s CPI dipped below 2%.

 Source: @CraigStirling, @economics Read full article
But core inflation remains elevated (well above forecasts).

• Dutch inflation was lower than expected.

——————–
2. Manufacturing confidence deteriorated in June.

Services sentiment was better than expected.

Price expectations are moderating.

Here is the combined economic sentiment index, which includes consumer confidence.

——————–
3. Will the ECB accelerate QT?
 Source: @WeberAlexander, @jrandow, @economics Read full article
 Source: TS Lombard
——————–
4. Similar to the US, European equities are back near pre-ECB hiking levels.
 Source: SOM Macro Strategies
Back to Index
Europe
1. Let’s begin with Sweden.
• Riksbank increased rates by 25 bps, as expected. The central bank signaled more hikes ahead.

 Source: @WSJ Read full article
– Here are the projected policy rates.
 Source: ING
– Nordea sees Riksbank cutting rates next year.
 Source: Nordea Markets
– Riksbank is accelerating QT.
 Source: Nordea Markets
• Consumer confidence edged higher this month.

Manufacturing sentiment has leveled off.

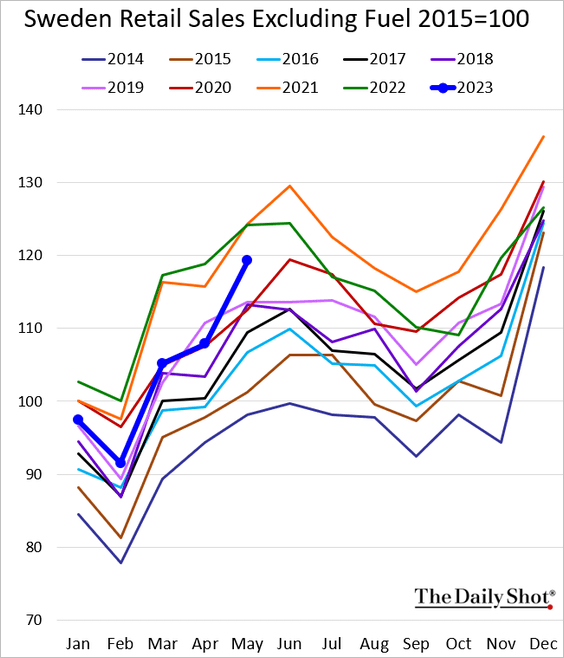
• Sweden’s retail sales were back above pre-COVID levels in May.
——————–
2. Here is a look at the EU’s trading partners.
 Source: Eurostat Read full article
Back to Index
Japan
1. The June Tokyo CPI was below economists’ forecasts. Inflation has been broadening this year.

2. Industrial production declined in May as manufacturing output softened (2nd panel).

 Source: Nippon Read full article
——————–
3. The unemployment rate held steady, but the jobs-to-applicants ratio edged lower.

4. Consumer confidence ticked up this month.

5. Equity fund inflows have been robust.
 Source: BofA Global Research
6. Dollar-yen looks overbought.

Here is the history of Japan’s F/X market interventions.
 Source: Deutsche Bank Research
Back to Index
Asia-Pacific
1. South Korea’s industrial production jumped in May.

2. Australian bond yields climbed today, with e 5-year yield hitting the highest level since late 2011.

Back to Index
China
1. China could face deflation in the months ahead.
 Source: BCA Research
2. Consumption is improving as households utilize savings.
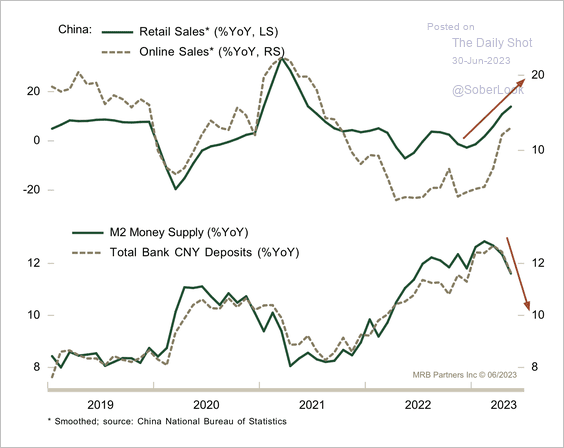 Source: MRB Partners
3. The brief boost in property developer funding is starting to fade.
 Source: Pantheon Macroeconomics
4. Local governments’ land sales have been soft.
 Source: @WSJ Read full article
5. Foreigners are issuing a lot of CNY-denominated bonds.
 Source: @markets Read full article
6. China’s consumers are increasingly willing to boycott foreign brands.
 Source: Morning Consult Read full article
• This chart shows last year’s changes in foreign carmakers’ sales.
 Source: @financialtimes Read full article
Back to Index
Emerging Markets
1. Let’s begin with Brazil.
• Here is Brazil’s broad price index covering wholesale, consumer, and construction price trends (year-over-year):

• Personal loan delinquencies keep climbing.

• Formal job creation surprised to the downside.

——————–
2. Chile’s unemployment rate was lower than expected in May.

3. Argentina’s consumer confidence is rebounding.

4. LatAm stocks have outperformed year-to-date.
 Source: Capital Economics
5. Indian equities have outperformed in recent years, although relative valuations are still above average. (2 charts)
 Source: PGM Global
 Source: PGM Global
——————–
6. The Russian ruble remains under pressure.

7. How much will EM central banks cut rates this year and in 2024? Here is a forecast from Capital Economics.
 Source: Capital Economics
Back to Index
Cryptocurrency
1. Bitcoin Cash (BCH) has significantly outperformed crypto peers this week.
 Source: FinViz
• BCH was one of the lucky few tokens chosen to trade on the new EDX exchange, which triggered the rally.
 Source: Decrypt Read full article
• BCH’s cumulative return over the past week is far ahead of popular tokens.
 Source: @TheTieIO
• Recent gains only place BCH back near 2020 price levels, trading in the shadow of BTC.
 Source: @TheTieIO
——————–
2. Fidelity refiled for a spot-bitcoin ETF.
 Source: CoinDesk Read full article
3. Next, we have bitcoin’s correlation to semiconductor stocks.
 Source: FTSE Russell
4. Here is the status of central bank-issued digital currencies.
 Source: Statista
Back to Index
Energy
1. This chart shows Russian LNG exports by destination.
 Source: Bruegel Read full article
2. Uranium demand is expected to surge.
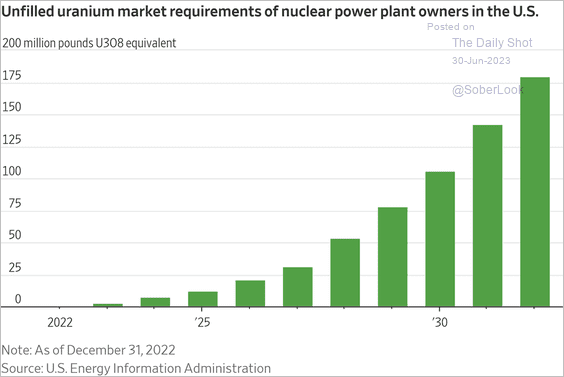 Source: @WSJ Read full article
Back to Index
Equities
1. Retail investors remain bullish.
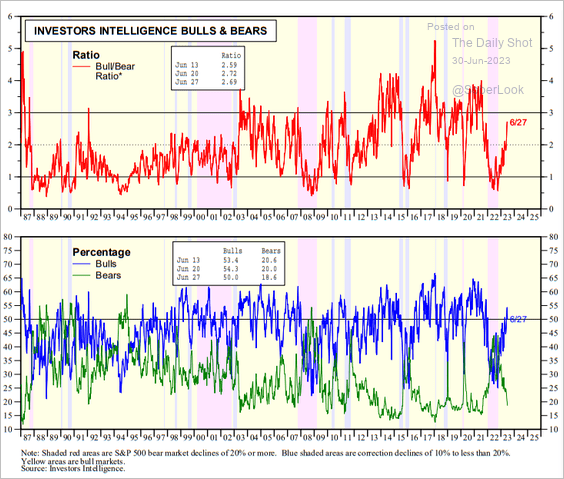 Source: Yardeni Research
This chart shows retail positioning (a big component of this is Tesla).
 Source: Vanda Research
——————–
2. US equities are back near pre-rate-hike levels and have recently diverged from rising yields.
 Source: SOM Macro Strategies
3. The S&P 500 risk premium is nearing the 2007 lows. This trend does not bode well for the market’s longer-term performance.

4. The equal-weight S&P 500 index is having one of the weakest bear market recoveries on record.
 Source: @3F_Research
• Has the equal-weight index underperformance bottomed? Will the rally broaden?

——————–
5. The NYSE Composite Index exhibits positive breadth.
 Source: @McClellanOsc
6. The S&P 500’s six-month performance is near the top quintile, which typically precedes further gains over the next six months.
 Source: @Todd_Sohn
7. Finally, we have portfolio holdings of some high-profile managers.
 Source: Visual Capitalist Read full article
Back to Index
Alternatives
1. VC deals are increasingly investor-friendly.
 Source: PitchBook
2. Middle-market private equity share of fundraising surged this year.
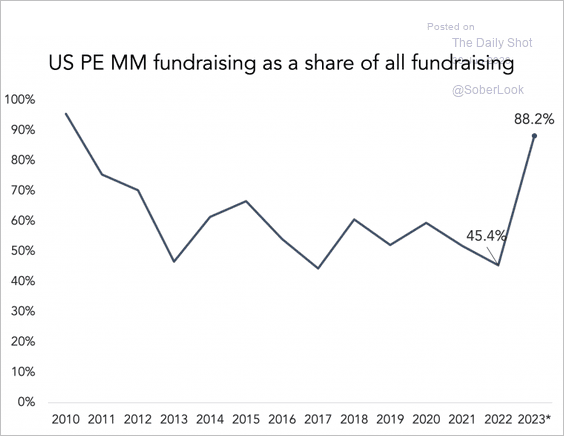 Source: PitchBook; @theleadleft
3. Total Q1 investment in the space economy was concentrated in growth-stage (series B&C) companies.
 Source: Space Capital
Investments in launch and satellites have been driven by late-stage rounds, highlighting the capital nature of these industries.
 Source: Space Capital
Back to Index
Credit
1. Default risks ticked up in several sectors, according to S&P Global.
 Source: S&P Global Market Intelligence
2. High-yield borrowers’ leverage has been trending lower.
 Source: JP Morgan Research; III Capital Management
3. Tigher liquidity points to wider high-yield spreads ahead, …
 Source: Pantheon Macroeconomics
… and so do rising bankruptcies.
 Source: Simon White, Bloomberg Markets Live Blog
——————–
4. 30% of Russell 2000 companies’ debt is floating.
 Source: Goldman Sachs; @dailychartbook
Back to Index
Rates
1. Inflation-linked Treasury (TIPS) funds have been seeing persistent outflows (2 charts).

 Source: BofA Global Research
• With demand for these securities falling, the 5-year TIPS yield hit the highest level since 2008. This trend is a headwind for growth equities.

——————–
2. Soft manufacturing activity points to downside risks for Treasury yields.
 Source: JP Morgan Research; @dailychartbook
Back to Index
Global Developments
1. Global real goods trade declined over the past nine months.
 Source: Capital Economics
2. This chart shows food inflation around the world.
 Source: Scotiabank Economics
3. Next, we have the harmonized inflation trends in advanced economies.
 Source: The White House Read full article
4. This scatterplot shows inflation and GDP growth forecasts.
 Source: TS Lombard
5. The gradual erosion of the US dollar’s reserve status is being offset by the increasing prominence of its allies’ currencies.
 Source: Alpine Macro
——————–
Food for Thought
1. US workers on strike:
 Source: @axios Read full article
2. Job postings in occupations with high vs. low remote-work share:
 Source: Indeed
3. Women’s right to vote (globally):
 Source: @IAmClintMurphy
4. Transgender people targeted in crimes:
![]() Source: Statista
Source: Statista
5. US public support for national spending:
 Source: @GSS_NORC
6. US and UK consumption of and trust in news by source:
 Source: @financialtimes Read full article
7. The rebound in foreign-born population growth across advanced economies:
 Source: The Economist Read full article
8. COVID-related test score declines in reading and math:
 Source: @TheDailyShot
9. US births and deaths:
 Source: @WSJ Read full article
• US fertility rate:
 Source: @WSJ Read full article
——————–
10. Doughnut shop brands:
 Source: @alyssafowers Read full article
• Doughnut shop density:
 Source: @alyssafowers Read full article
• Doughnut shop variety and density:
 Source: The Washington Post Read full article
——————–
Have a great weekend!
Back to Index