
The Daily Shot: 03-Jul-23
• The United States
• Canada
• The United Kingdom
• The Eurozone
• Japan
• Asia-Pacific
• China
• Emerging Markets
• Commodities
• Energy
• Equities
• Credit
• Rates
• Global Developments
• Food for Thought
The United States
1. Real consumer spending stalled in May.
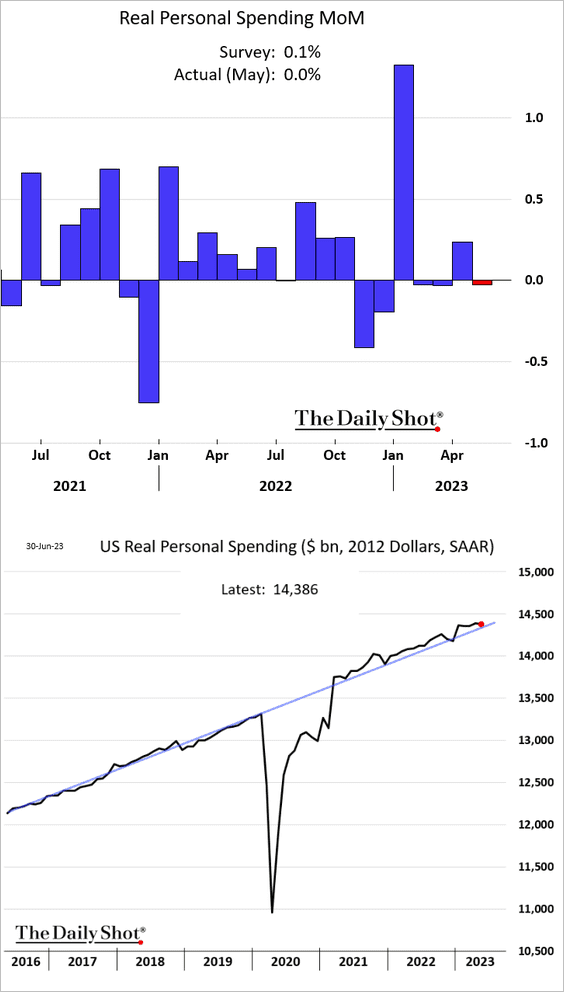
 Source: @MollySmithNews, @readep, @economics Read full article
But spending on services keeps trending higher.
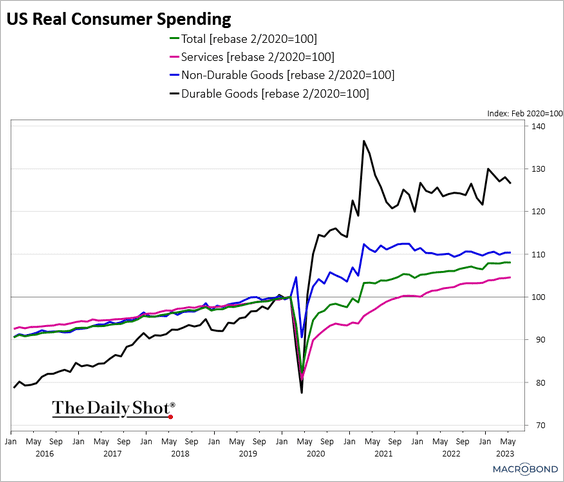 Source: Chart and data provided by Macrobond
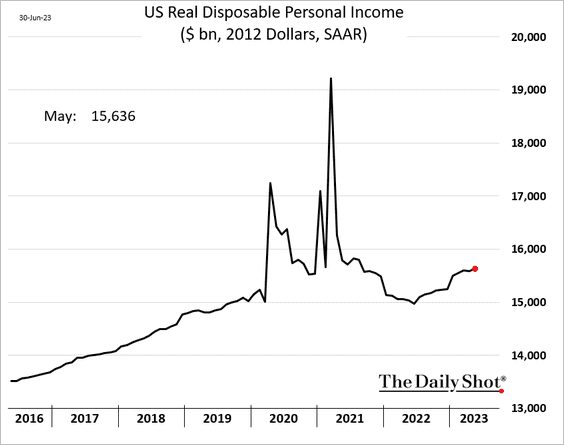
• Real personal income indicators continue to improve.
– Real income excluding government payments:
![]()
– Real disposable personal income:
• Personal savings as a share of disposable income edged higher.
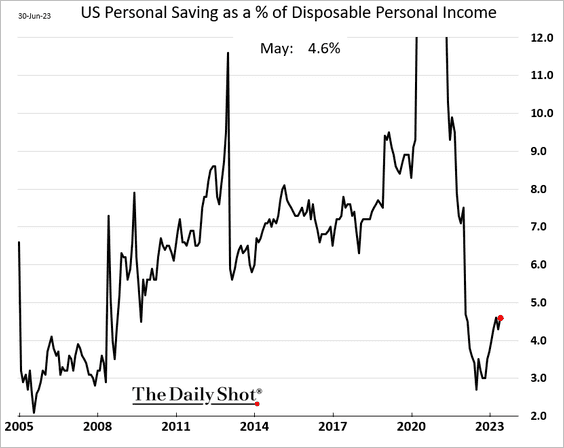
– This chart shows excess savings relative to the pre-COVID trend.
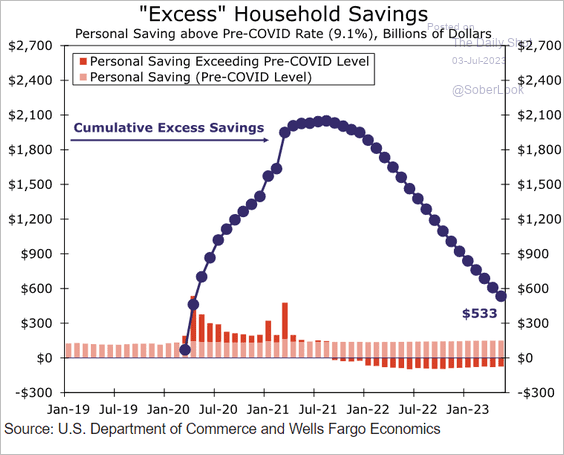 Source: Wells Fargo Securities
——————–
2. Spending on services and inventory rebuilding sent the GDPNow model Q2 growth estimate back above 2% (annualized).
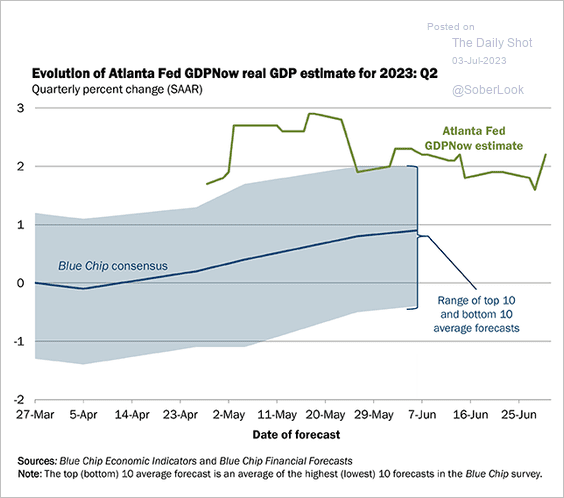 Source: Federal Reserve Bank of Atlanta
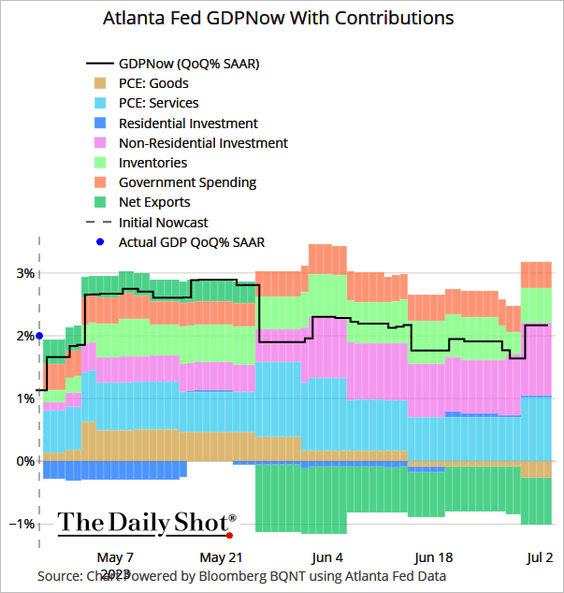 Source: @TheTerminal, Bloomberg Finance L.P.
——————–
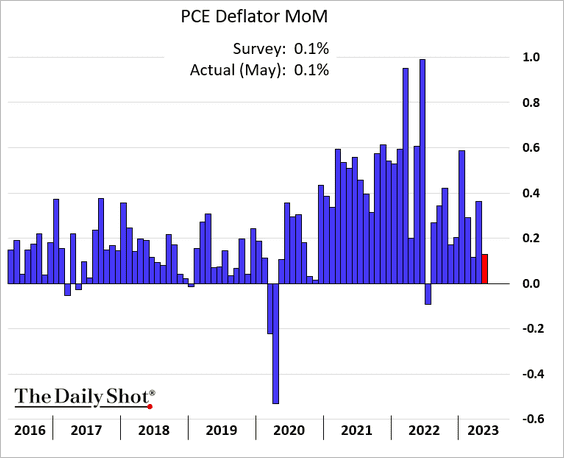
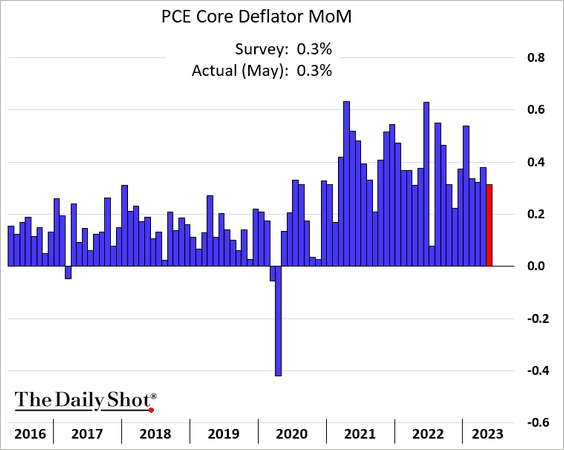
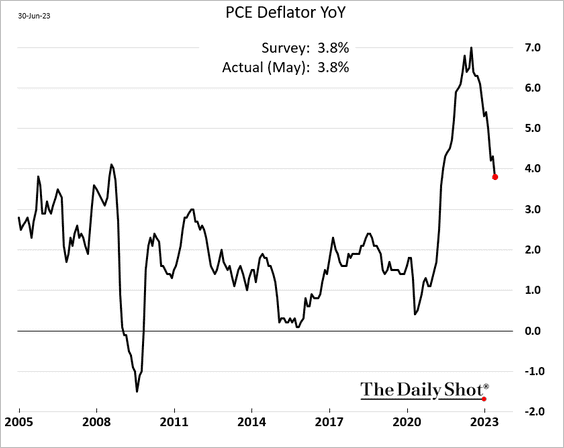
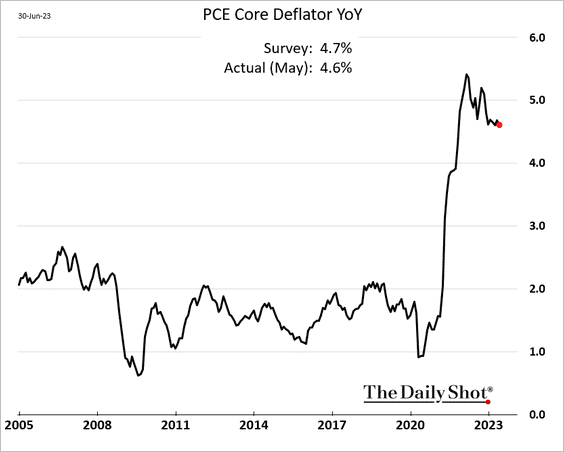
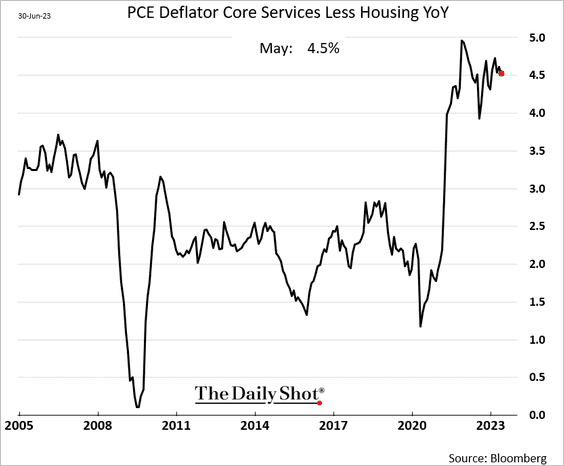
3. The PCE inflation report showed slower price gains. But core inflation remains sufficiently high to warrant a Fed rate hike this month.
• Monthly changes:
• Year-over-year:
• The supercore inflation measure slowed in May, …
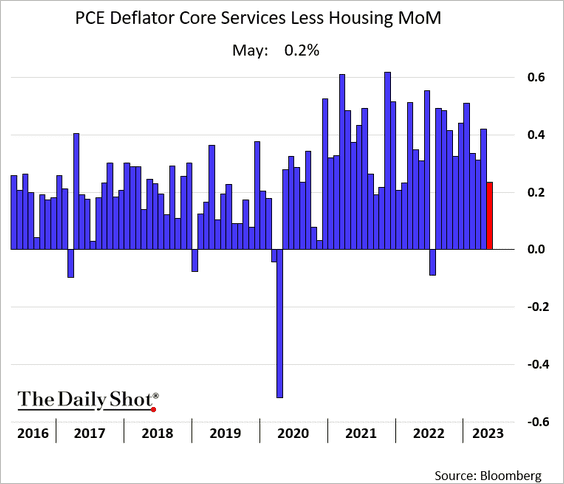
… but remains elevated on a year-over-year basis.
 Source: Barron’s Read full article
——————–
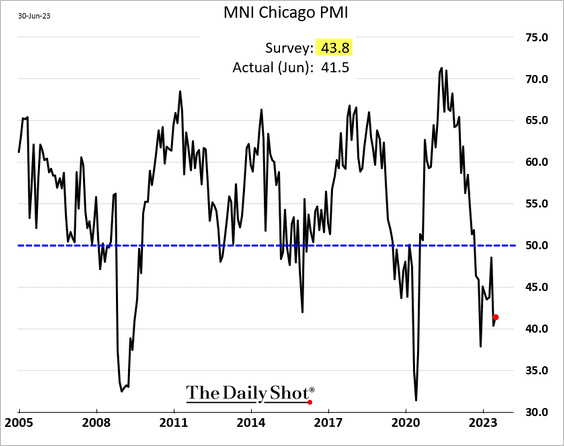
4. The Chicago PMI index continues to signal soft manufacturing activity in the Midwest.
5. The updated U. Michigan consumer sentiment index showed an improvement in consumer outlook.
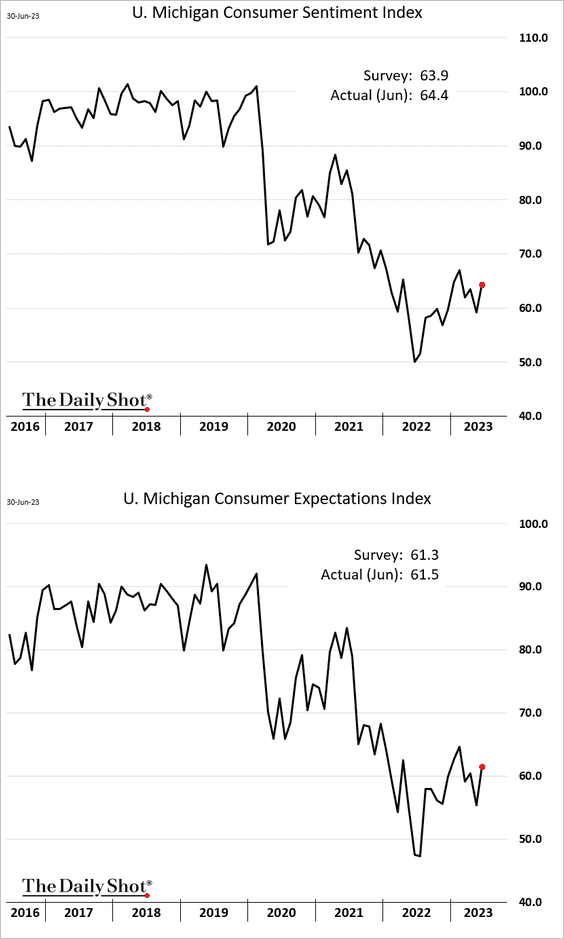
Here are the consumer inflation expectations measures.
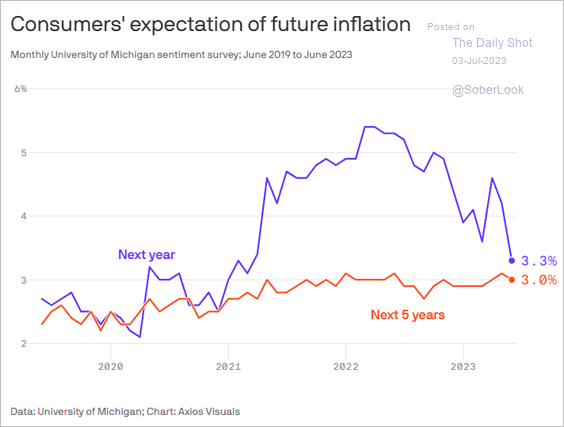 Source: @axios Read full article
Back to Index
Canada
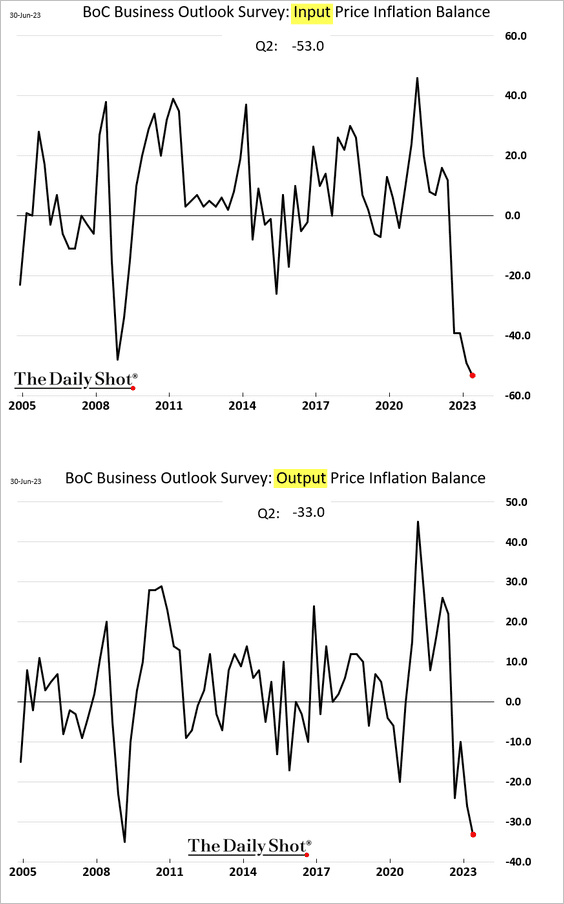
1. the BoC business outlook indicator deteriorated further in Q2, …
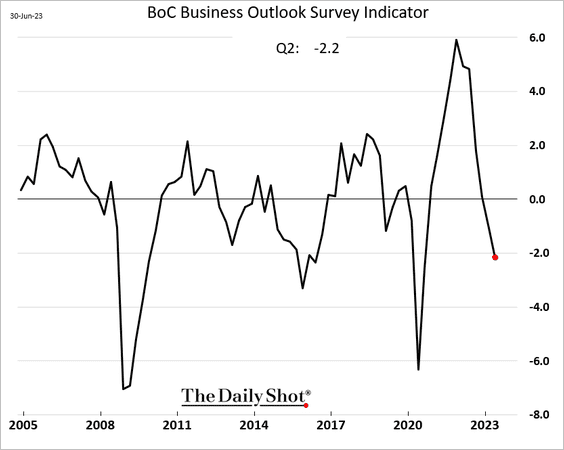
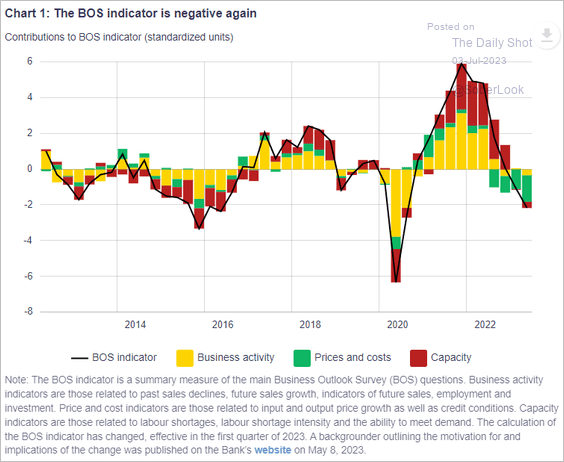 Source: BoC
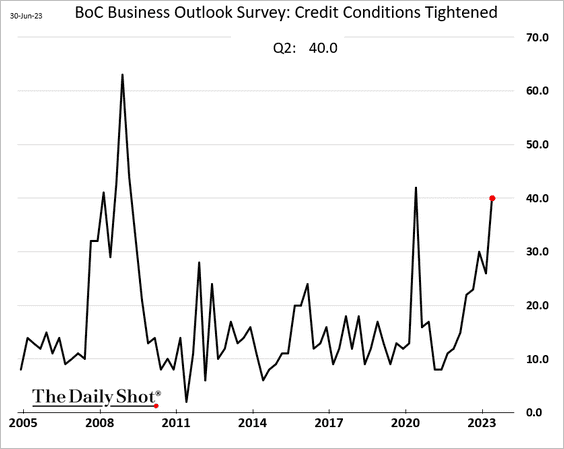
… as credit conditions tighten.
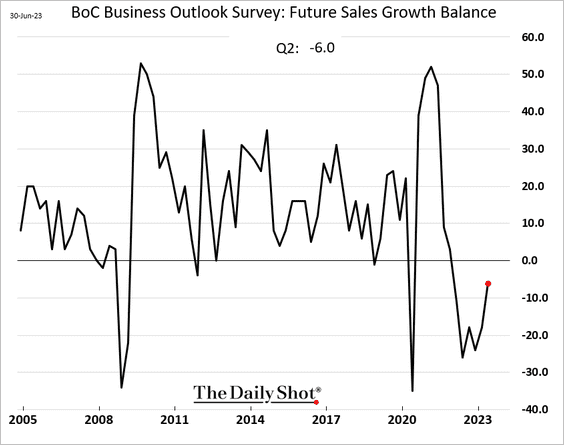
• But future sales growth expectations are improving.
• Inflation outlook indicators are tumbling.
Here are some additional data points on inflation expectations.
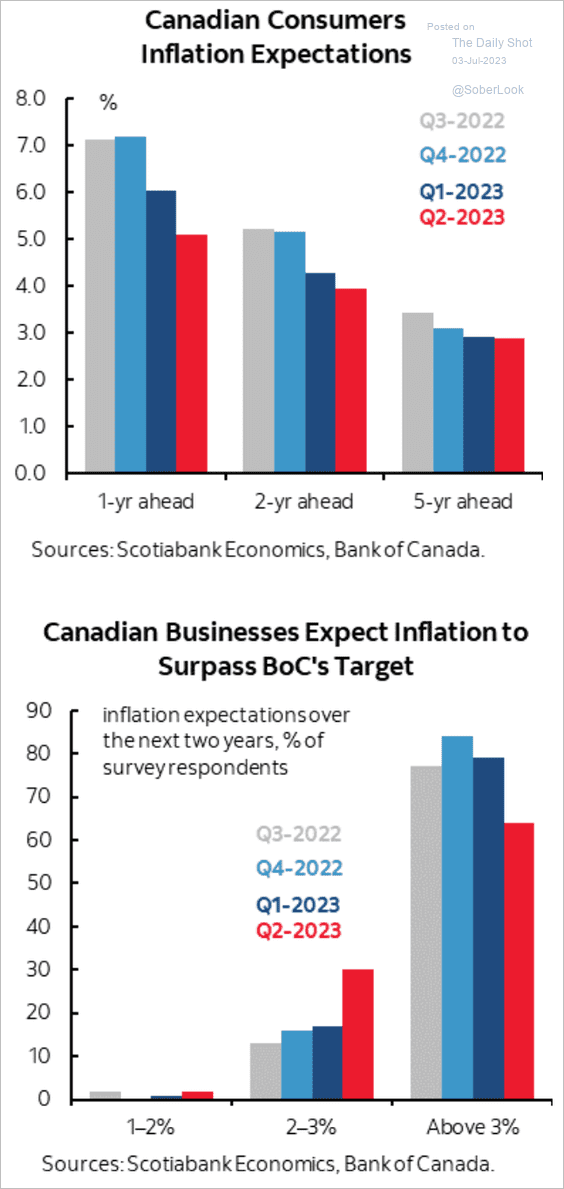 Source: Scotiabank Economics
• CapEx intentions are trending lower.
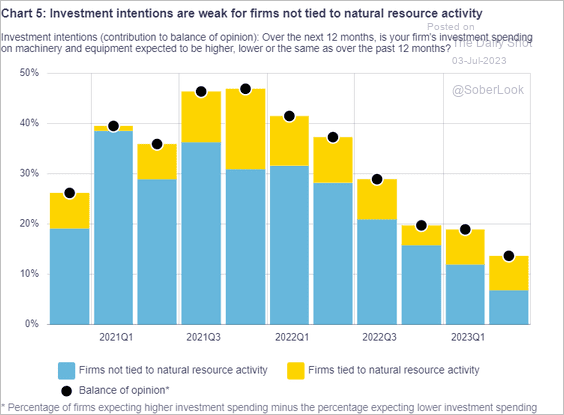 Source: BoC
——————–
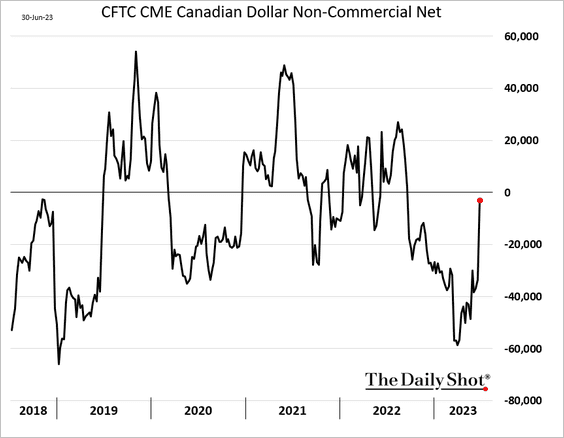
2. Speculative accounts sharply reduced their bets against the loonie last week.
Back to Index
The United Kingdom
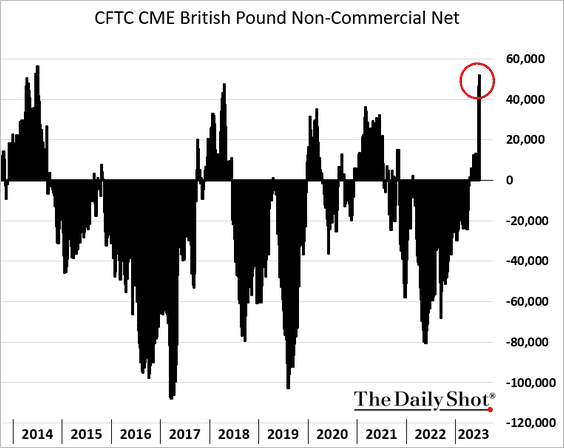
1. Speculative bets on the pound hit the highest level since 2014.
Here is the pound’s REER.
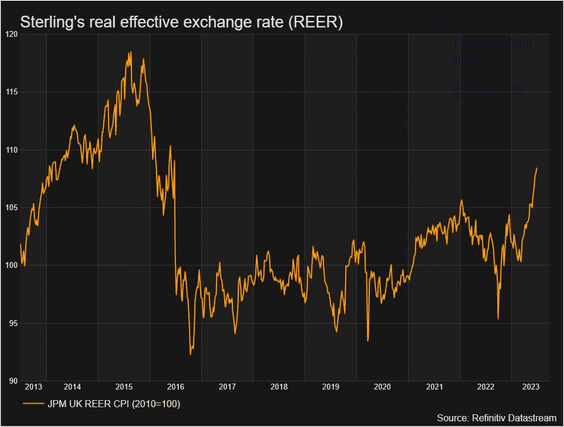 Source: @ReutersCommods, @ReutersJamie Read full article
——————–
2. Improving consumer confidence signals stronger retail sales ahead.
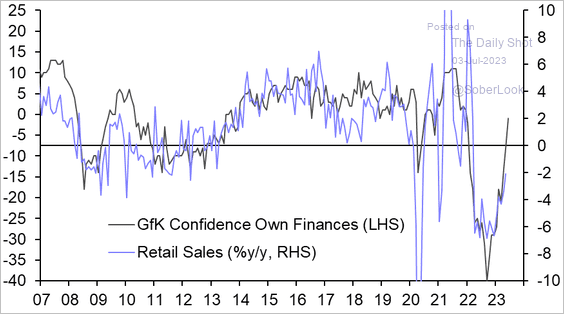 Source: Capital Economics
3. Reduced immigration from the EU constrained labor force growth, boosting inflation.
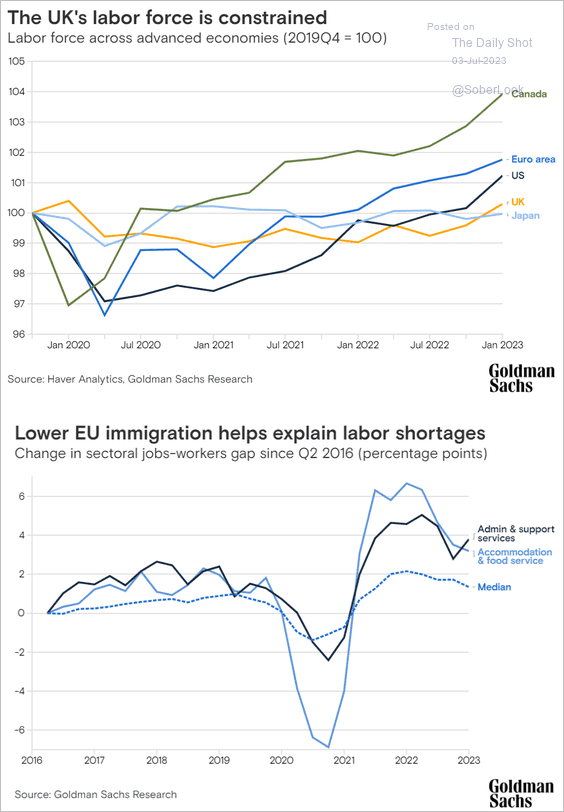 Source: Goldman Sachs
Back to Index
The Eurozone
1. Inflation continues to moderate, but the core CPI remains sticky.
• France:
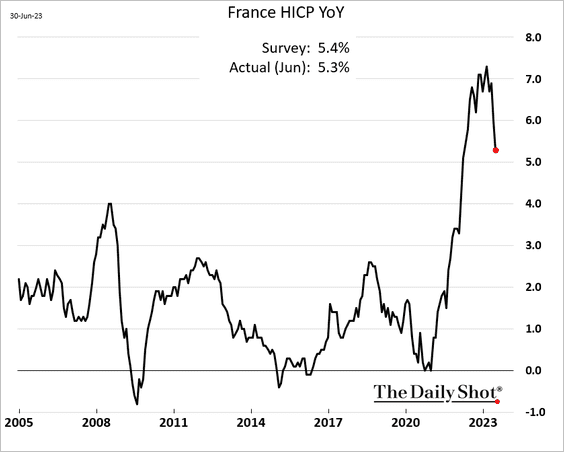
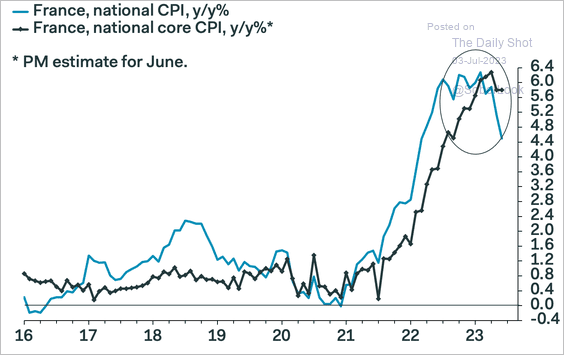 Source: Pantheon Macroeconomics
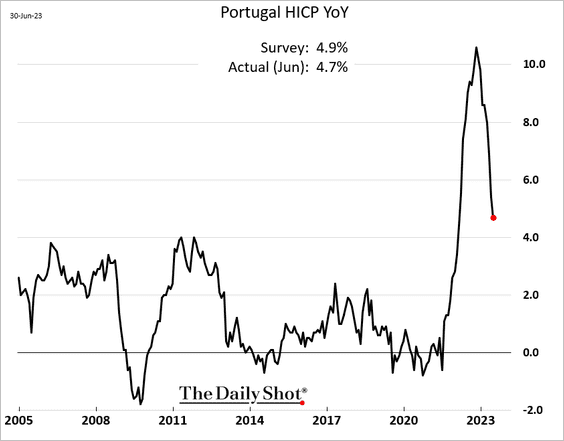
• Portugal:
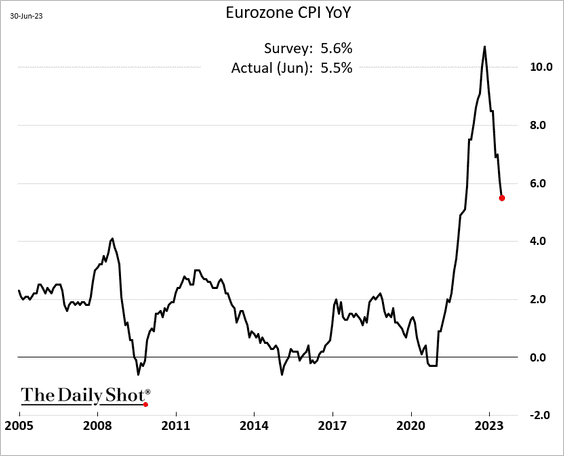
• The Eurozone:
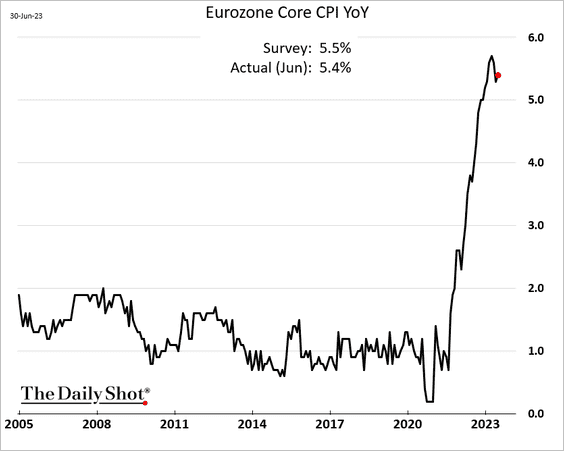
• Attribution:
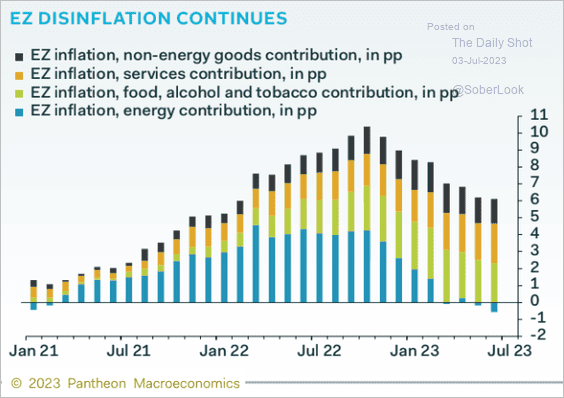 Source: Pantheon Macroeconomics
——————–
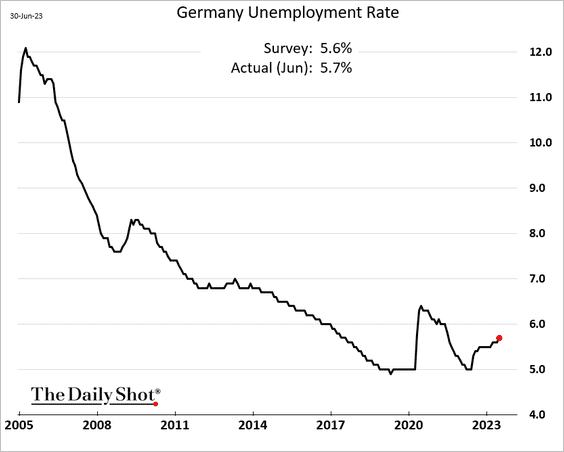
2. Germany’s unemployment increased in June.
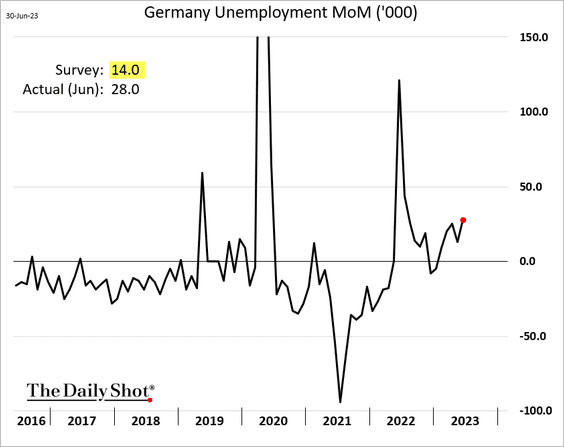
 Source: Reuters Read full article
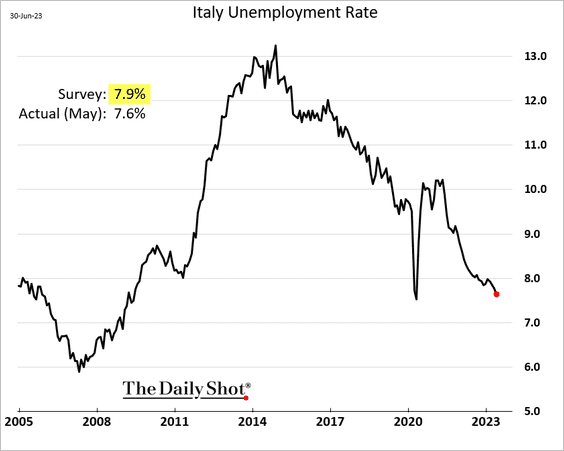
• Italian unemployment rate surprised to the downside.
• Here is the unemployment rate at the Eurozone level:
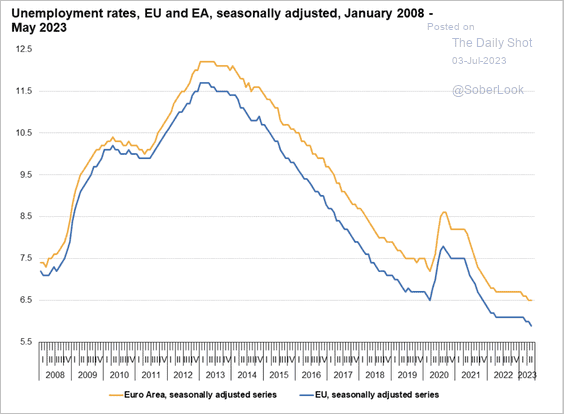 Source: Eurostat Read full article
——————–
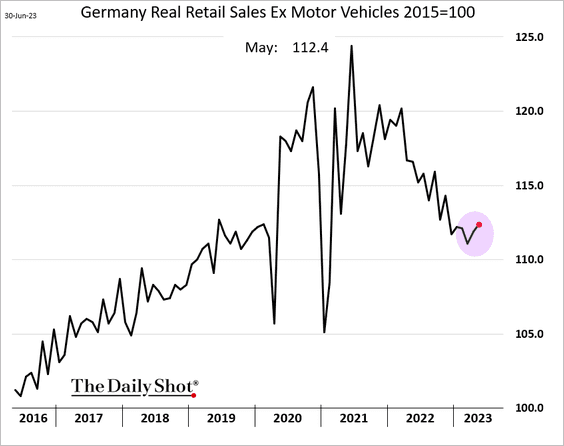
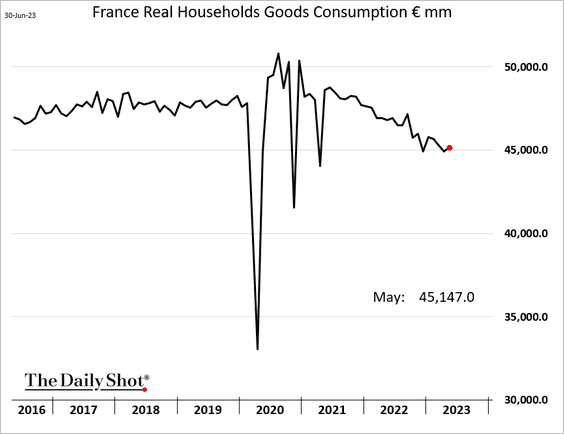
3. Retail sales edged higher in May.
• Germany:
• France (goods consumption):
Back to Index
Japan
1. The Tankan report showed Japan’s factory outlook rebounding in Q2.
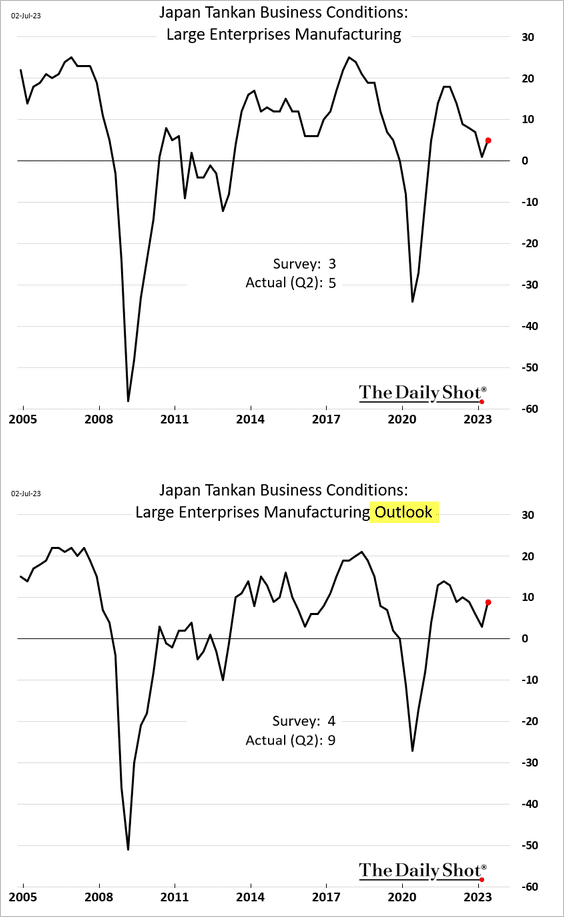
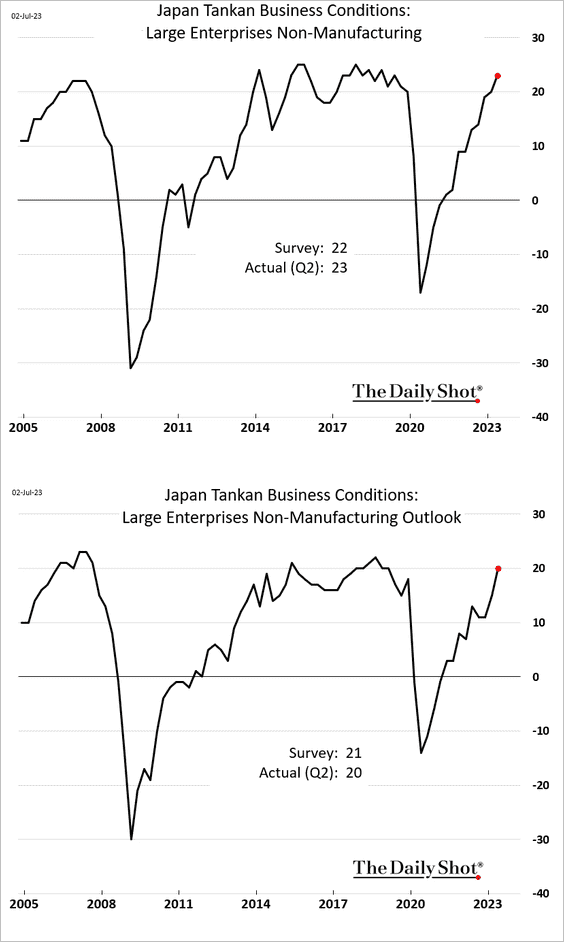
The non-manufacturing sector activity continues to expand.
——————–
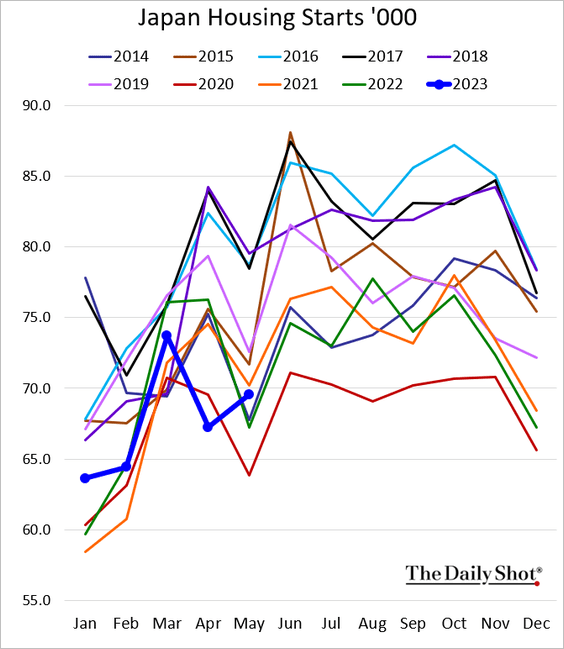
2. Housing starts improved in May.
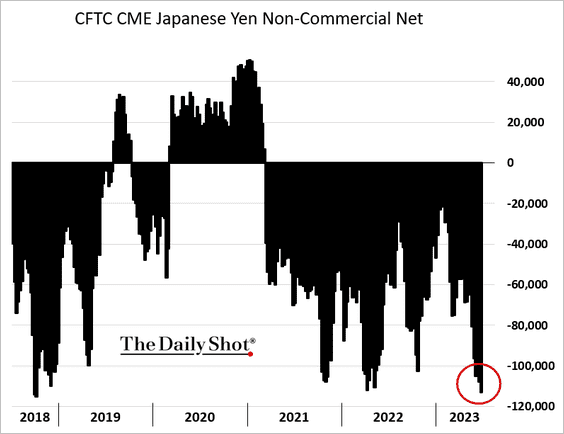
3. The yen positioning remains bearish.
Back to Index
Asia-Pacific
1. Taiwan’s factory activity remains in contraction mode, according to the June PMI report.
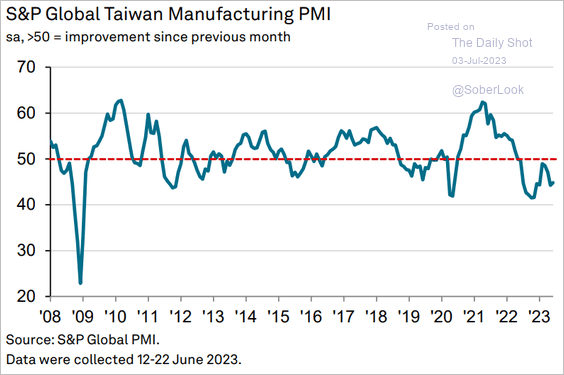 Source: S&P Global PMI
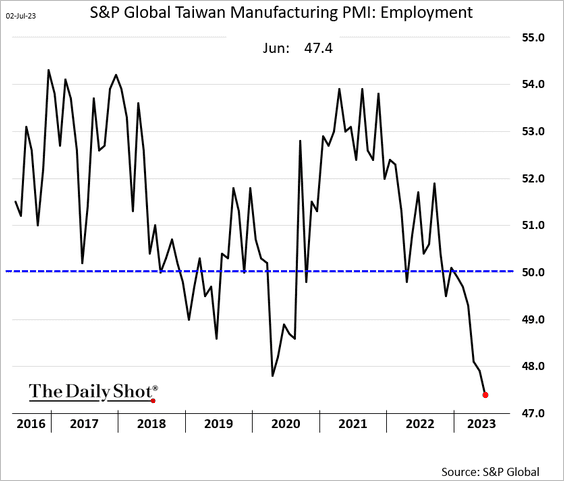
Factories are rapidly reducing staff.
——————–
2. South Korea’s PMI also shows declining manufacturing activity.
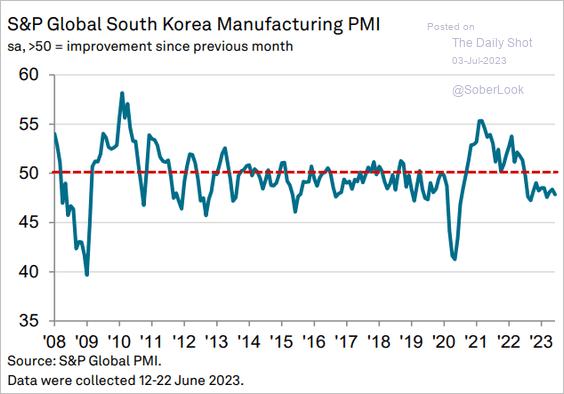 Source: S&P Global PMI
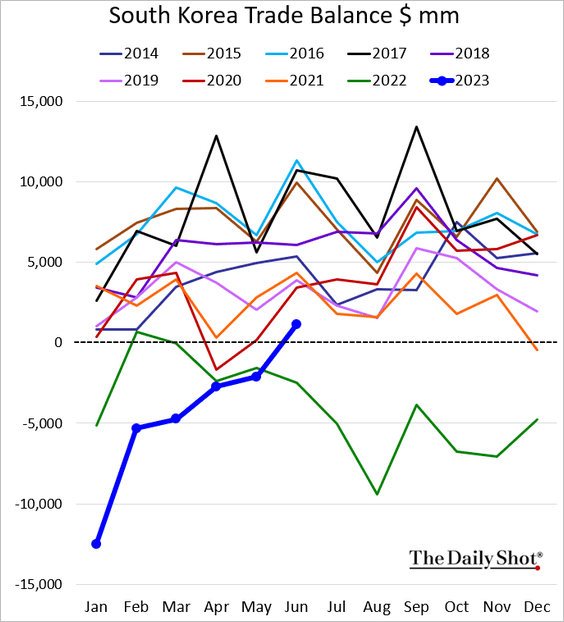
South Korea’s trade balance is back in surplus.
——————–
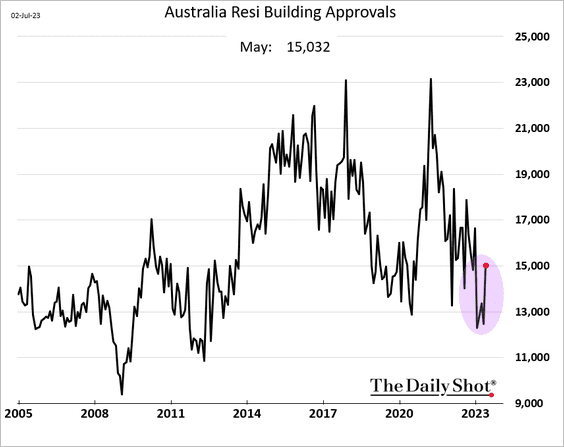
3. Australia’s residential building approvals rebounded in May.
Home prices continue to rise.
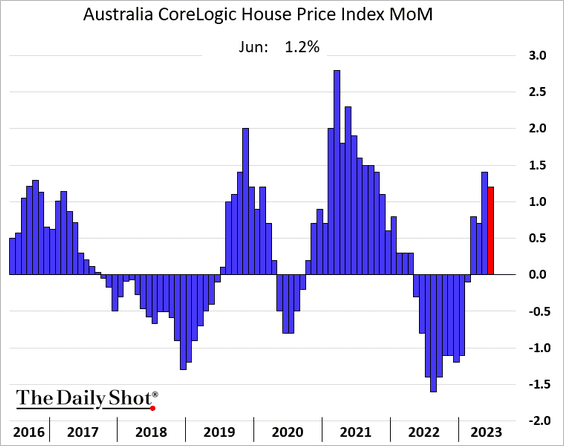
 Source: Reuters Read full article
Back to Index
China
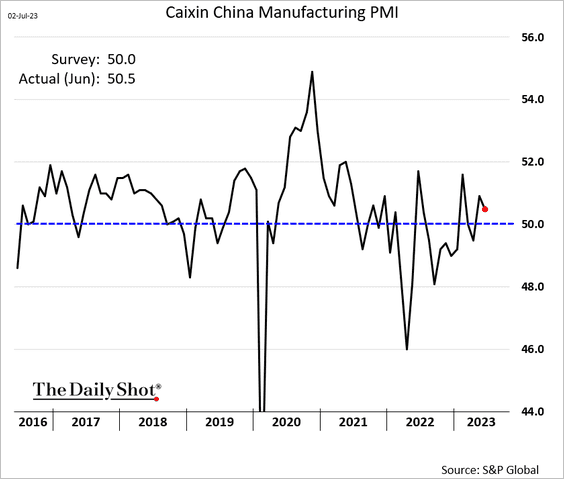
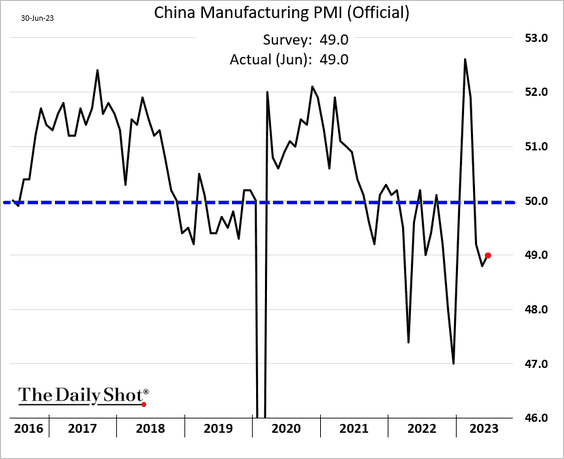
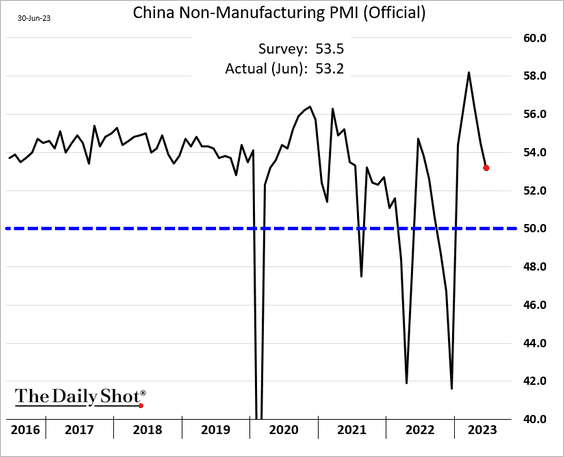
1. China’s PMI reports were mixed.
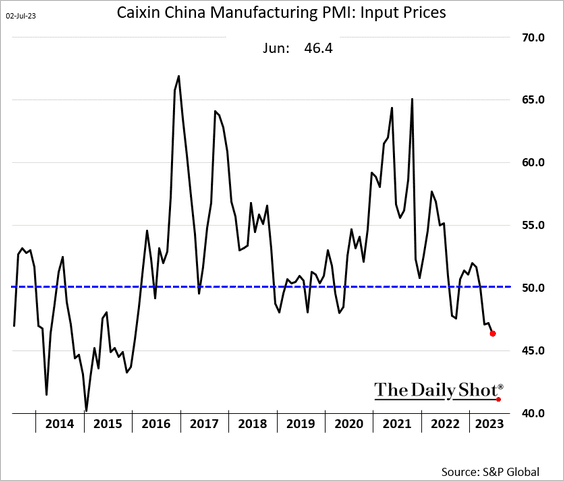
• S&P Global’s manufacturing PMI (modest growth):
Input prices are falling.
• Official manufacturing PMI (ongoing contraction):
• Official non-manufacturing PMI (robust growth):
——————–
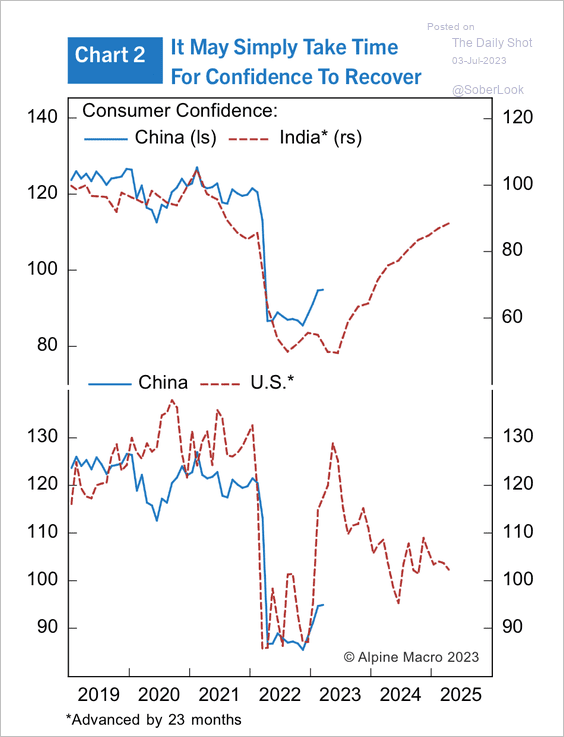
2. Similar to the US and India, it may take some time for consumer confidence to recover after the COVID-19 shock.
 Source: Alpine Macro
Back to Index
Emerging Markets
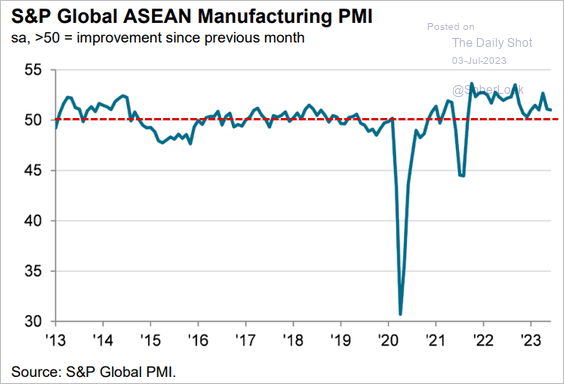
1. Here is a look at Asian PMI indicators for June.
• ASEAN (modest growth):
 Source: S&P Global PMI
• Indonesia (a rebound):
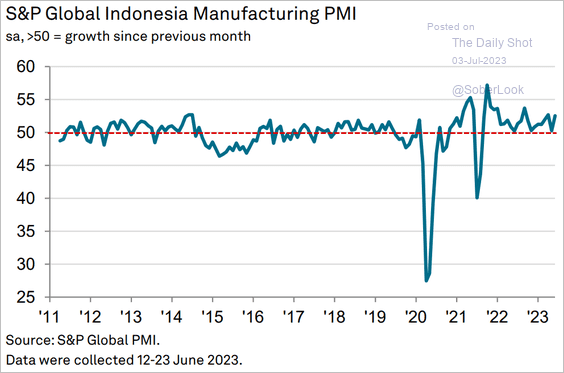 Source: S&P Global PMI
• Malaysia (ongoing contraction):
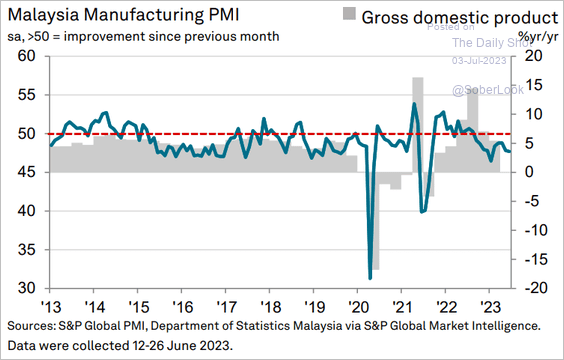 Source: S&P Global PMI
• The Philippines (growth stalling):
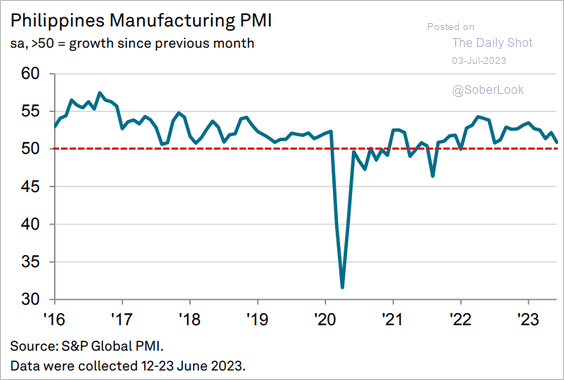 Source: S&P Global PMI
• Thailand (slower but still robust):
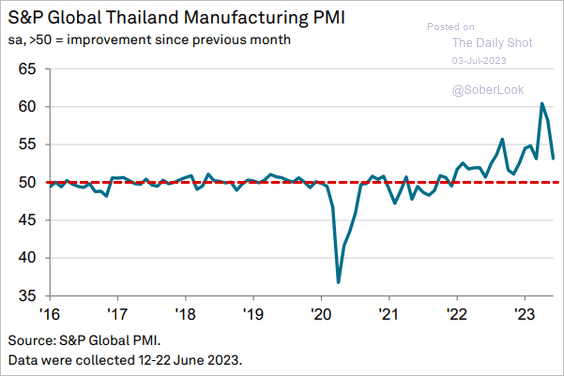 Source: S&P Global PMI
• Vietnam (ongoing contraction):
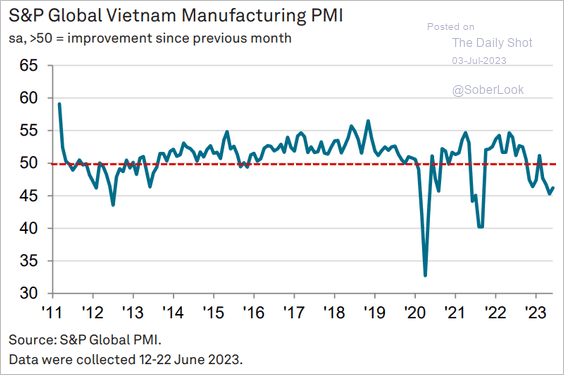 Source: S&P Global PMI
——————–
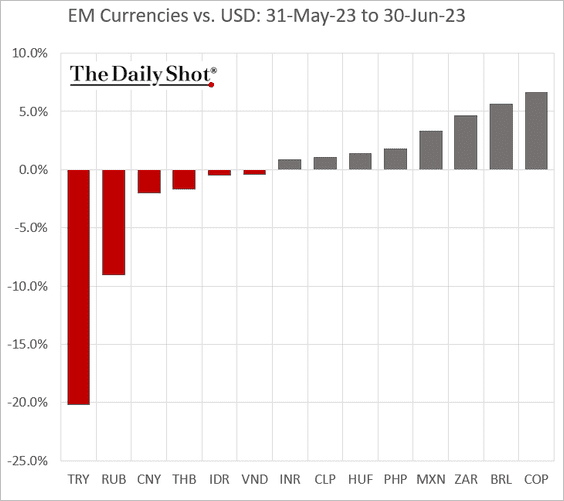
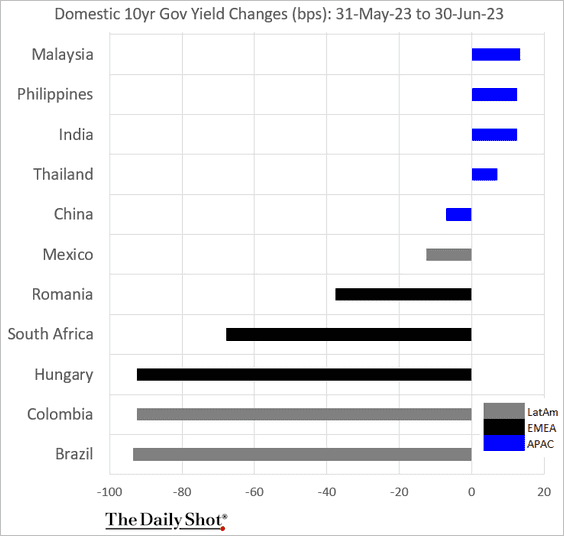
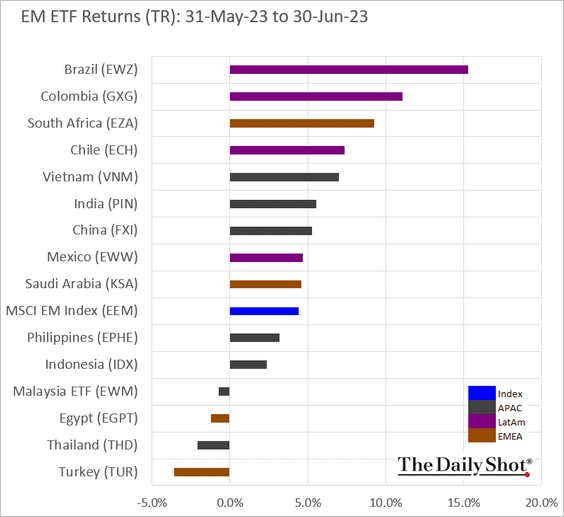
2. Next, we have the June performance data.
• Currencies:
• Bond yields:
• Equity ETFs:
Back to Index
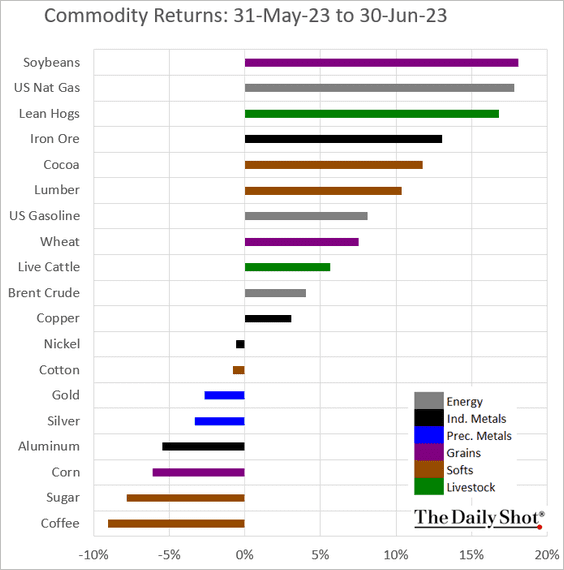
Commodities
Here is the June performance across key commodity markets.
Back to Index
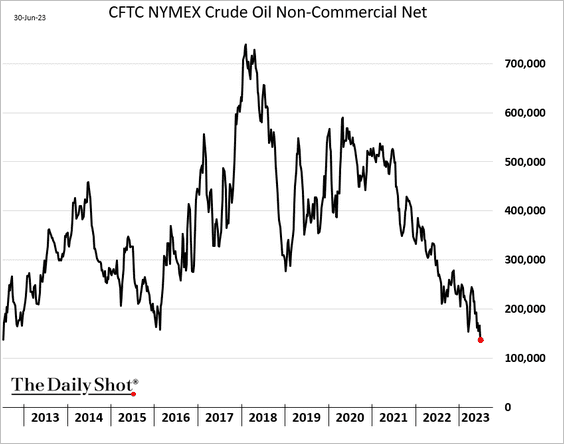
Energy
1. Positioning in WTI crude oil futures is increasingly cautious.
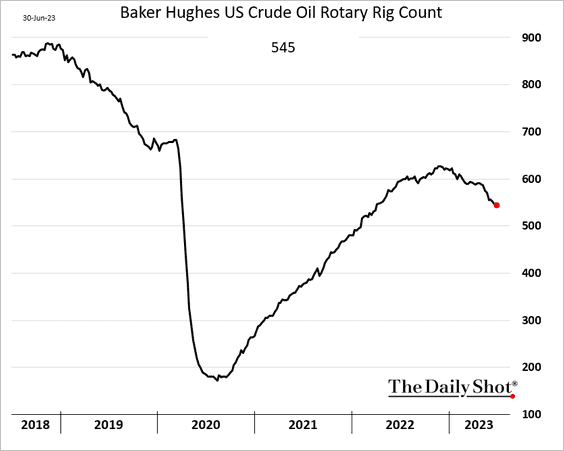
2. US rig count has been trending lower.
Back to Index
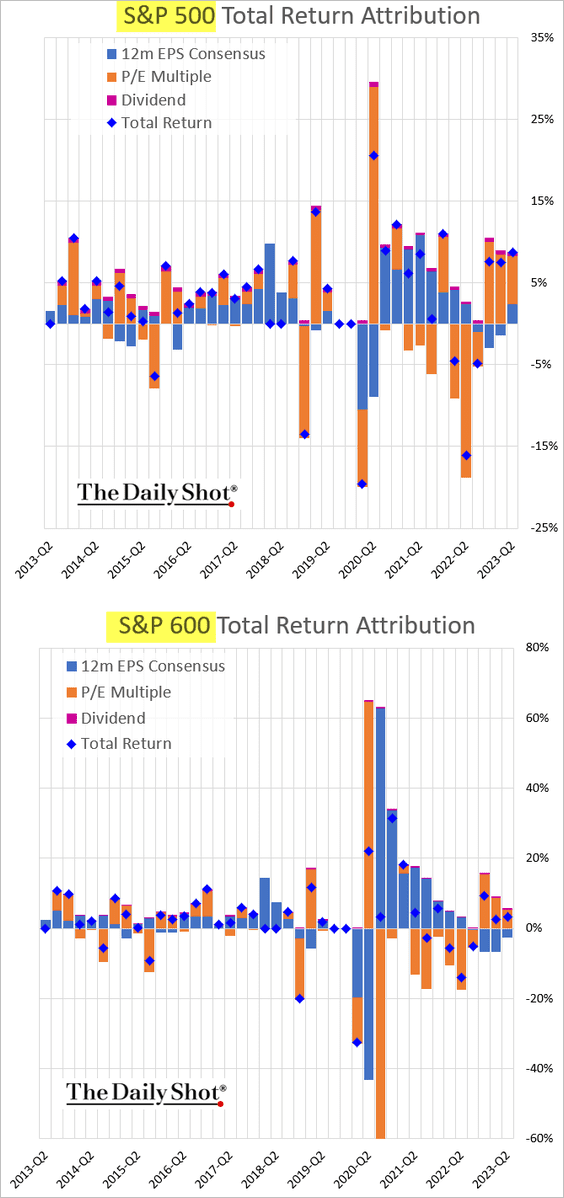
Equities
1. Let’s begin with the quarterly attribution for the S&P 500 and the S&P 600 (small caps).
2. Deutsche Bank’s positioning indicator is increasingly bullish.
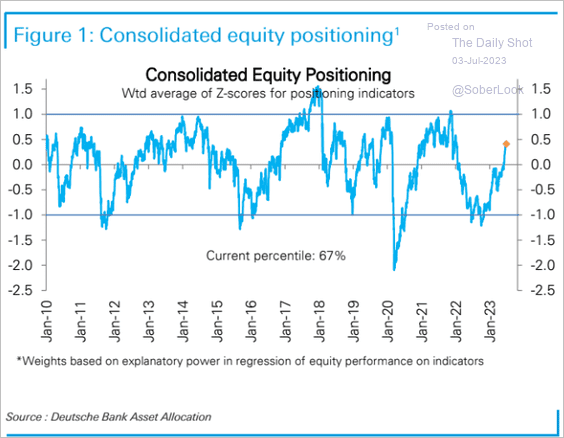 Source: Deutsche Bank Research
3. A strong first half of the year often leads to gains in the second half.
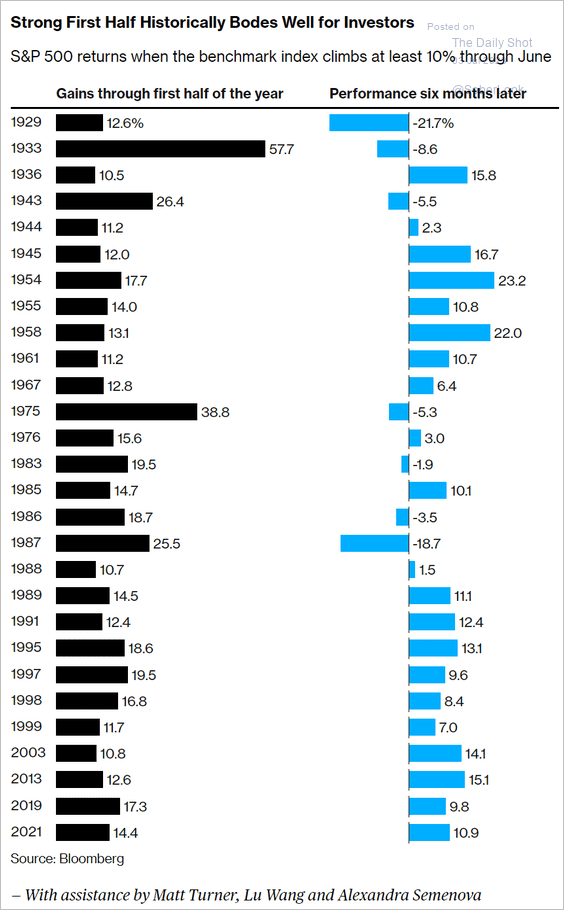 Source: @JessicaMenton, @lena_popina, @markets Read full article
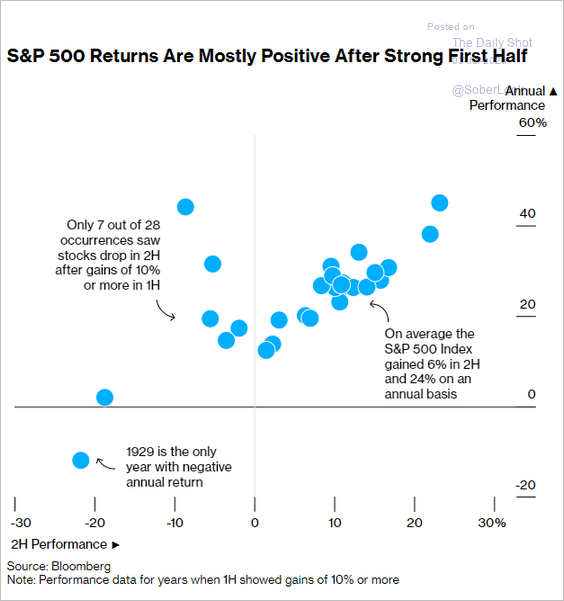 Source: @JessicaMenton, @lena_popina, @markets Read full article
——————–
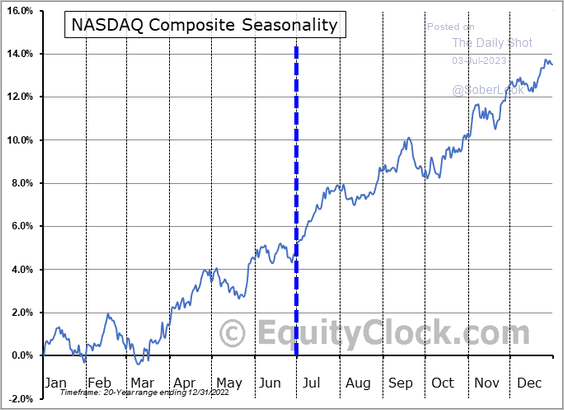
4. Seasonality should be a tailwind for stocks in July.
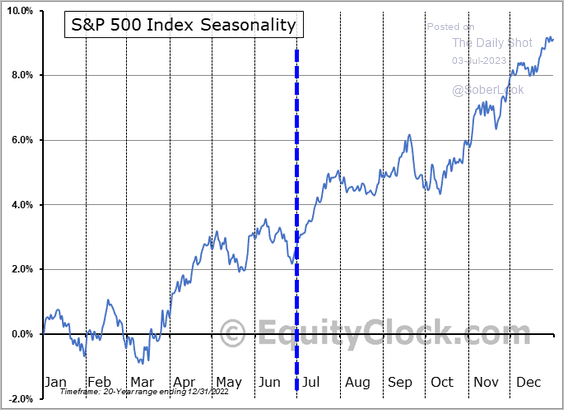 Source: Equityclock.com
 Source: Equityclock.com
——————–
5. Stocks have diverged from reserve balances (liquidity).
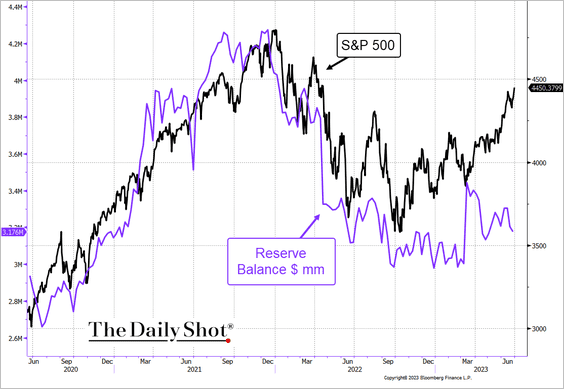 Source: @TheTerminal, Bloomberg Finance L.P.
6. Recent US outperformance versus the global ex-US benchmark has been narrowly based.
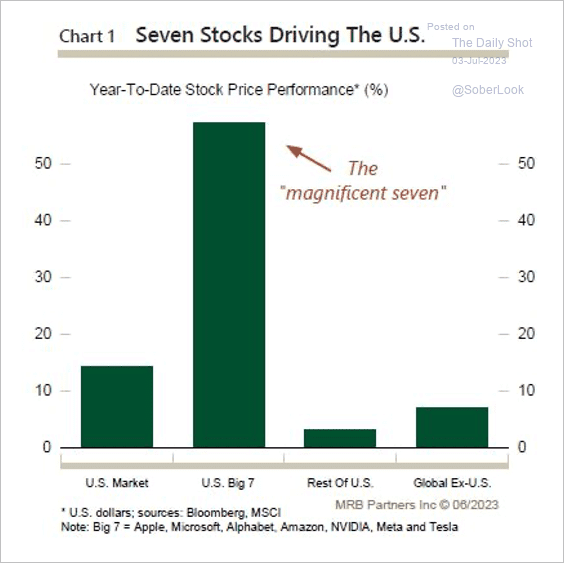 Source: MRB Partners
7. Outside the tech mega-caps, S&P 500 valuations look reasonable.
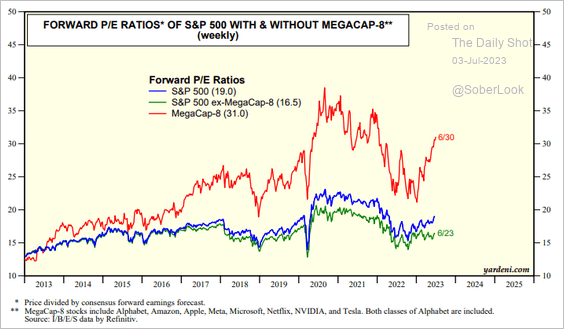 Source: Yardeni Research
8. In recent years, the performance of Russell 1000 stocks (large caps) has become more varied relative to the index.
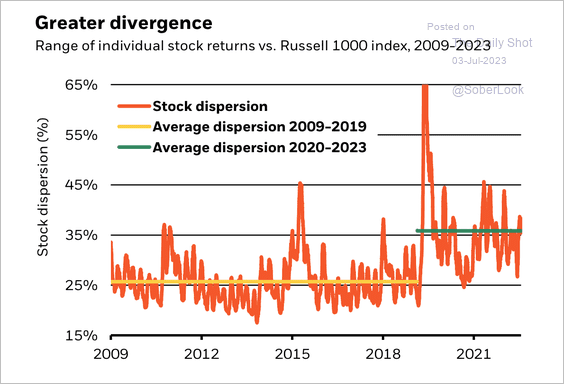 Source: BlackRock Investment Institute
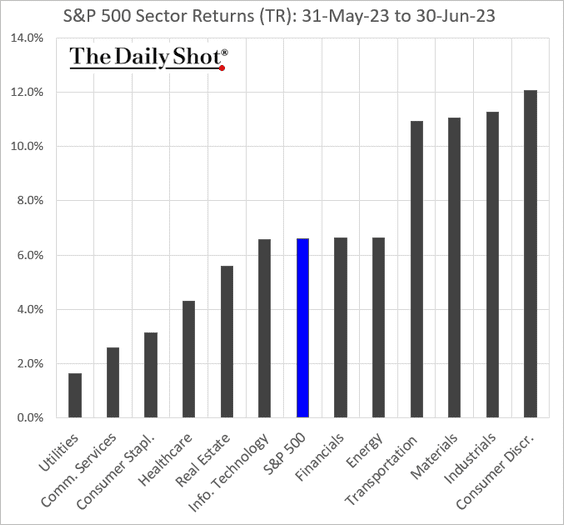
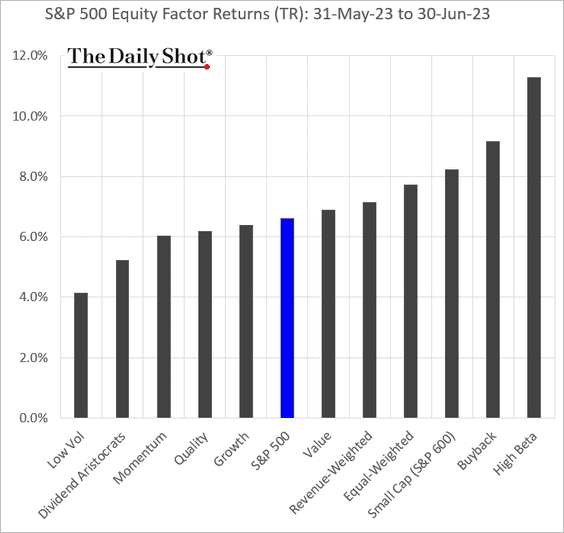
9. Finally, we have some performance data for June.
• Sectors:
• Equity factors:
• Macro basket pairs’ relative performance:
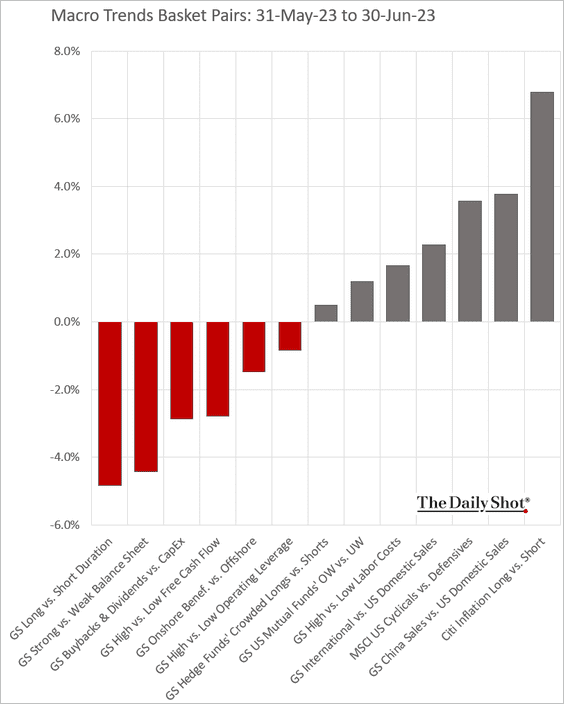
– Inflation-sensitive stocks outperformed.
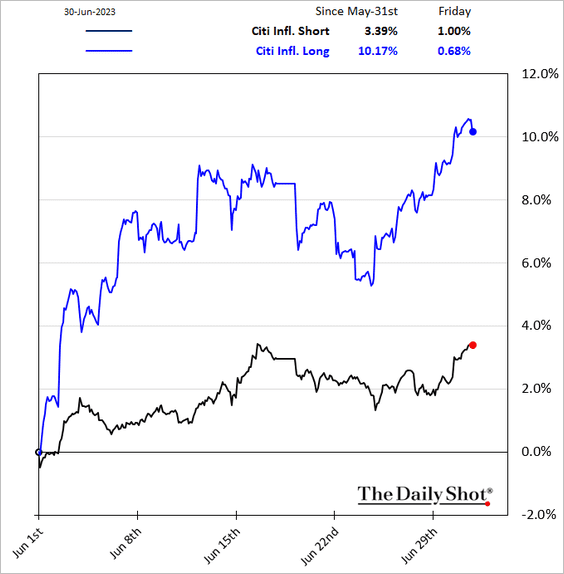
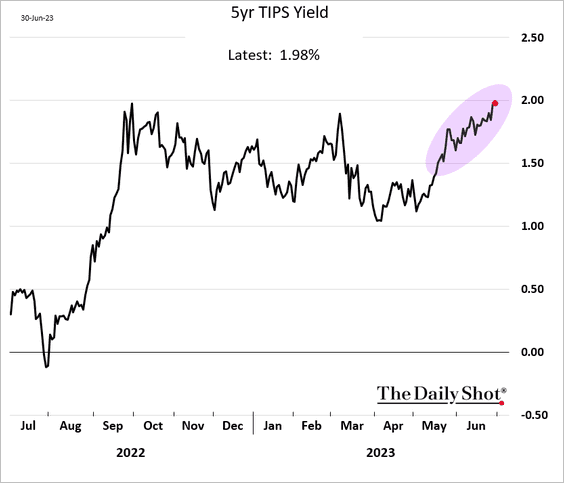
– Long-duration stocks underperformed, …
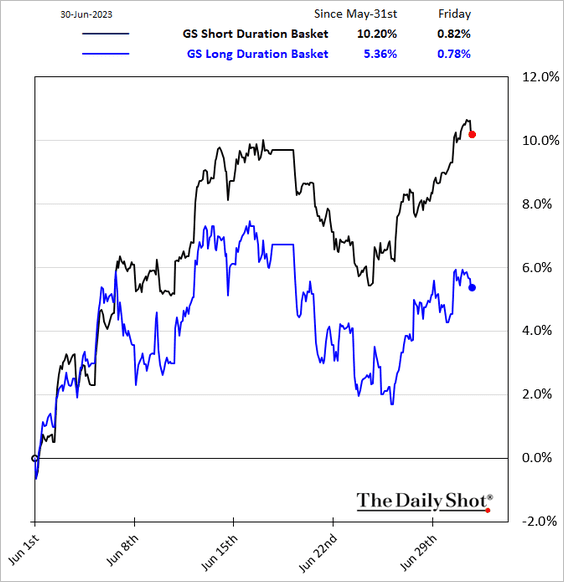
… as real rates jumped.
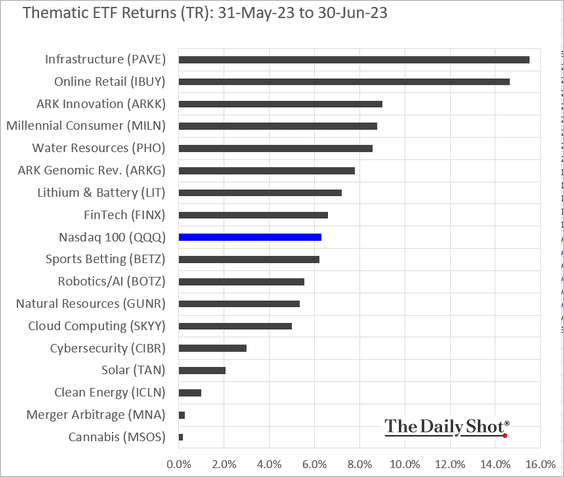
• Thematic ETFs:
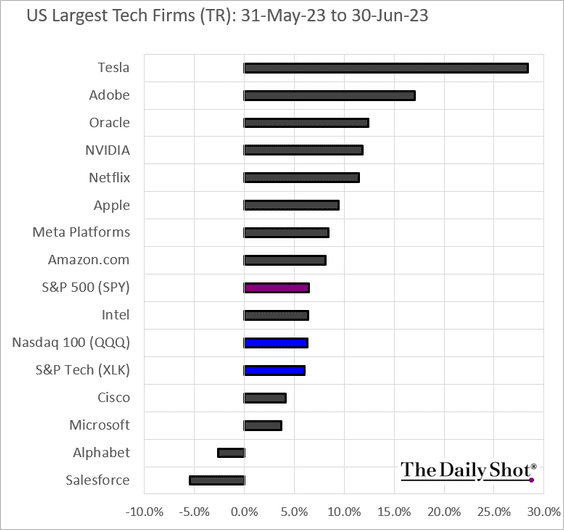
• Largest tech firms:
Back to Index
Credit
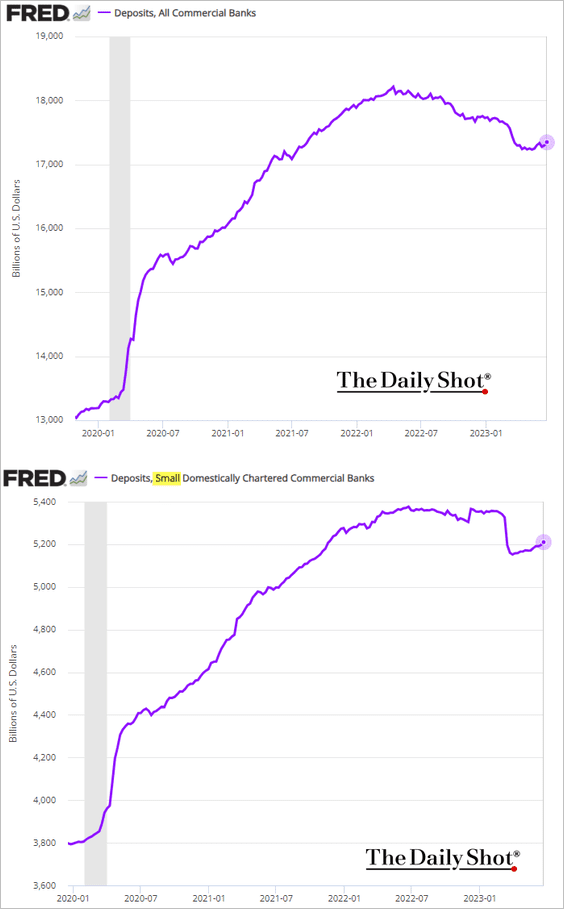
1. Bank deposits have been moving higher as the Fed’s RRP facility usage declined.
But credit conditions remain tight.
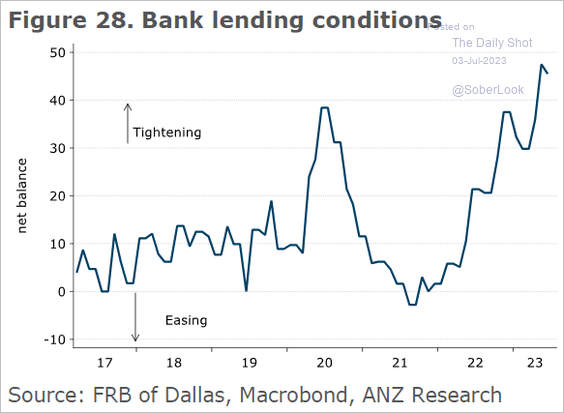 Source: @ANZ_Research
——————–
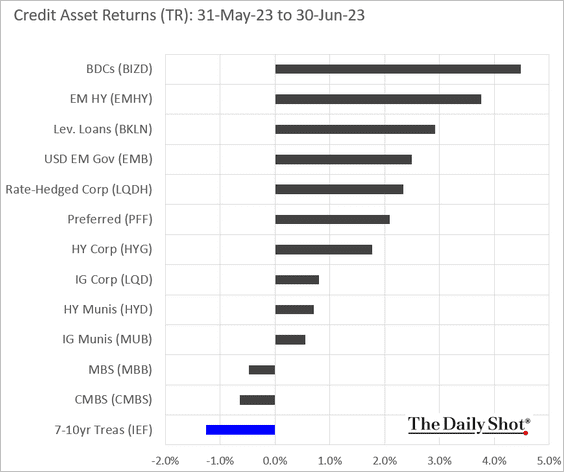
2. Below is last month’s performance across credit asset classes.
Back to Index
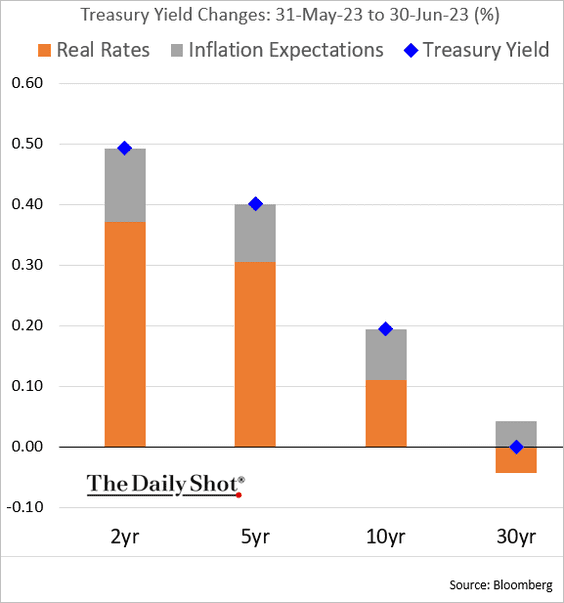
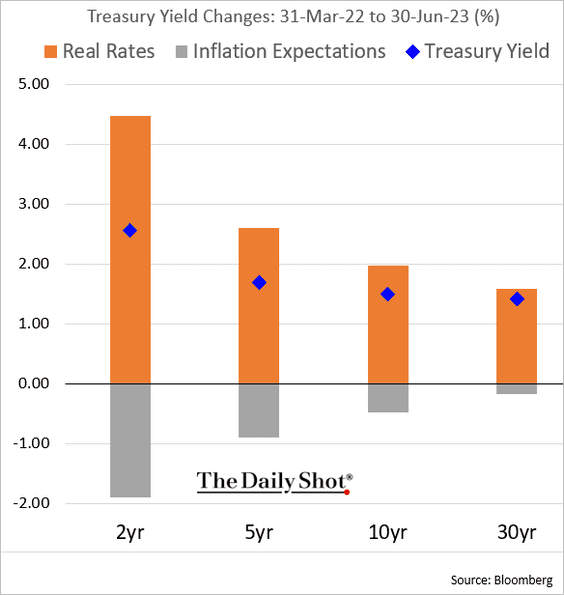
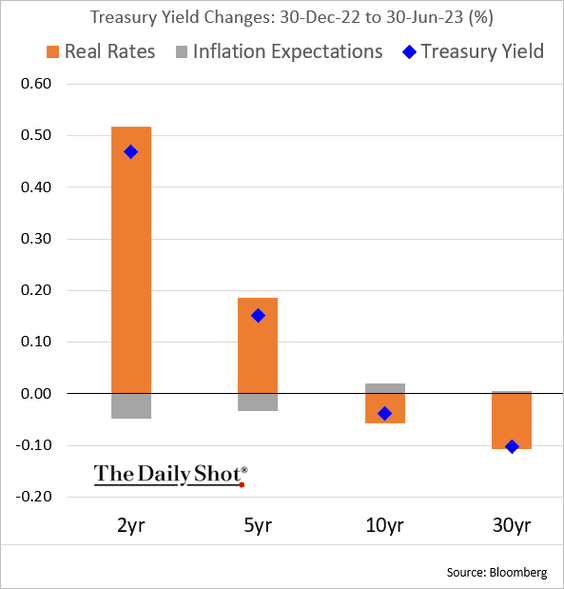
Rates
Here is the attribution of Treasury yield changes.
• June:
• Q2:
• YTD:
Back to Index
Global Developments
1. Here is a look at performance during the first half of 2023, with bonds and stocks improving. However, performance is very narrow over the past 18 months, with some commodities outperforming.
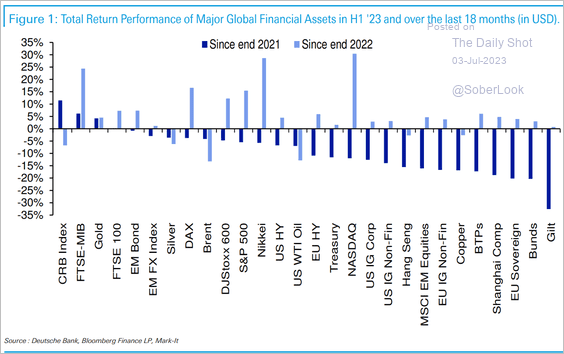 Source: Deutsche Bank Research
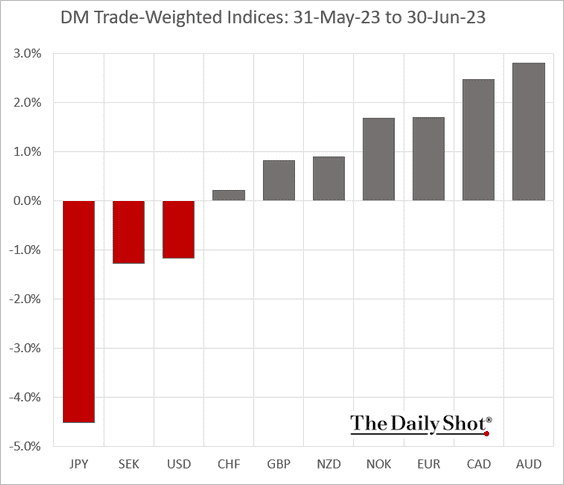
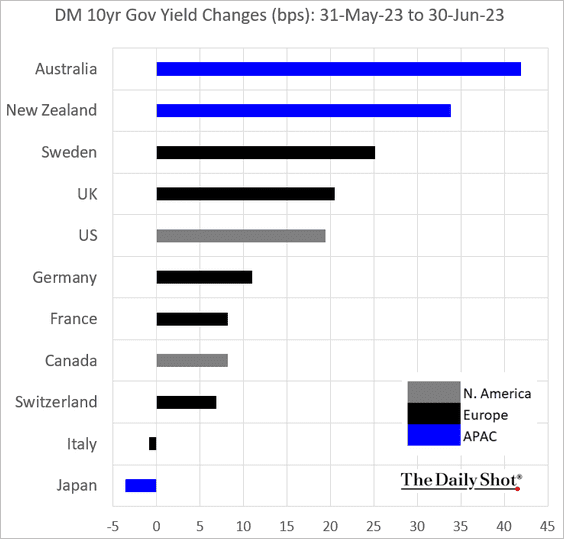
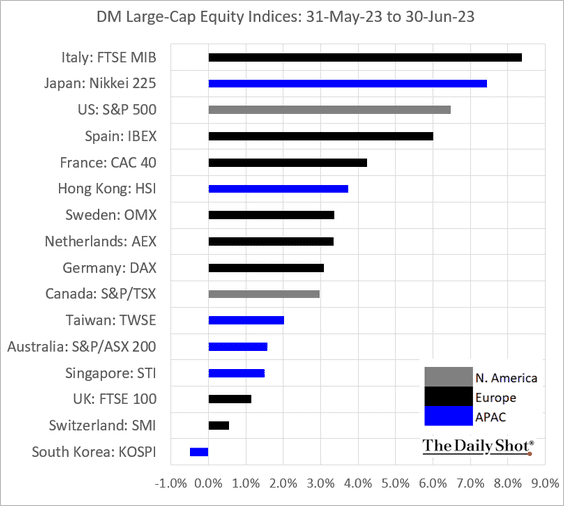
2. Below is the June performance across DM economies.
• Currencies:
• Bond yields:
• Equities:
——————–
Food for Thought
1. Smaller chips cost more to design and manufacture:
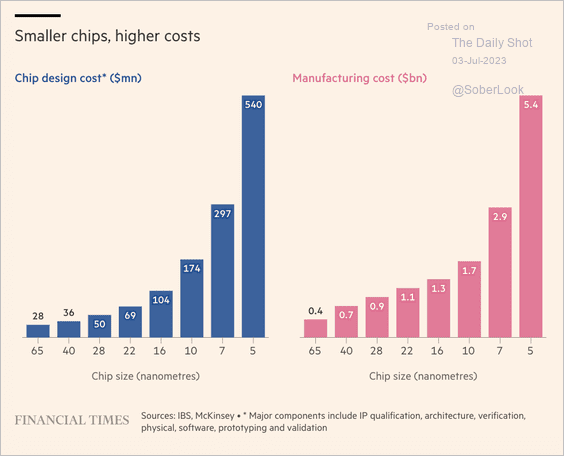 Source: @financialtimes Read full article
2. Modern slavery:
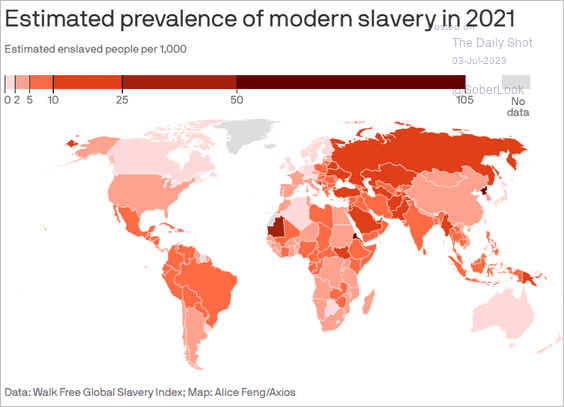 Source: @axios Read full article
3. Percent of children dying before their fifth birthday globally:
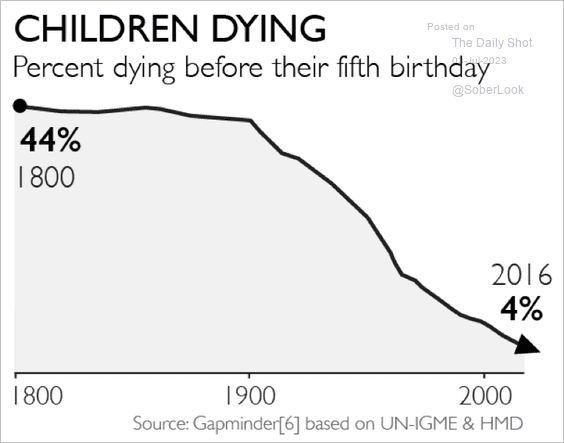 Source: @IAmClintMurphy
4. Asian Americans’ political leanings:
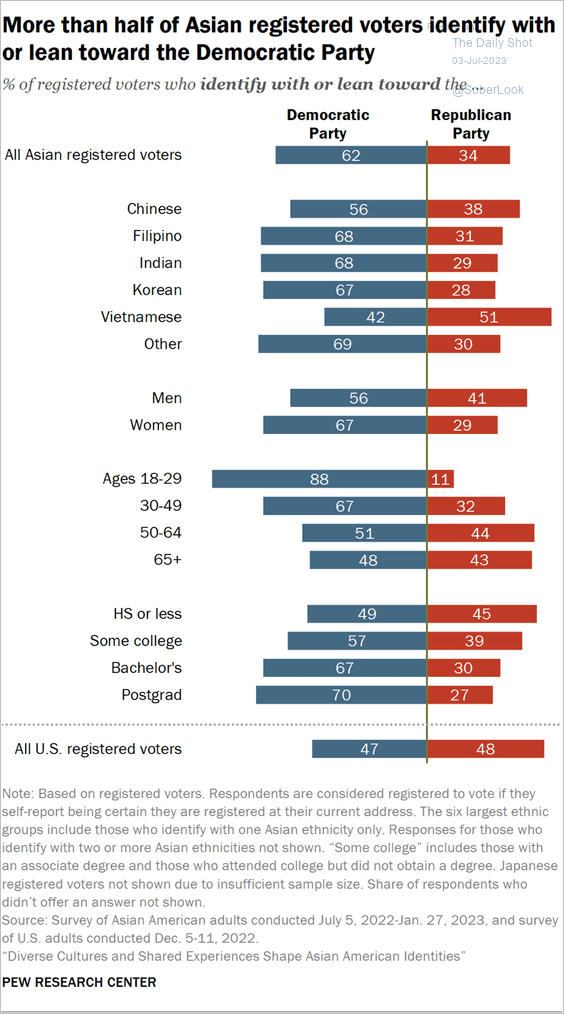 Source: Pew Research Center Read full article
5. The July 4th weekend box office sales:
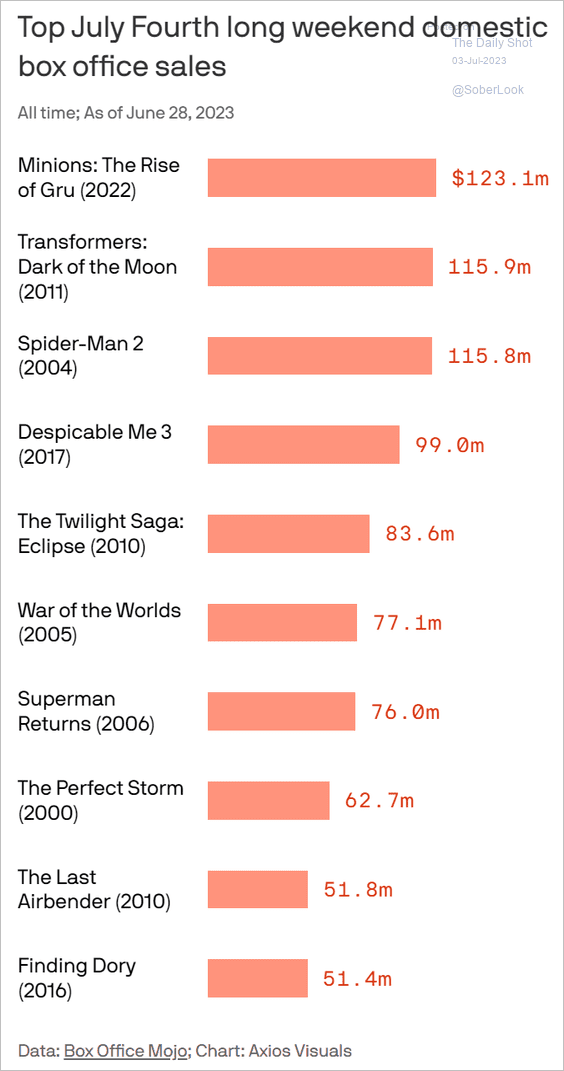 Source: @axios Read full article
6. Planned spending on July 4th food items:
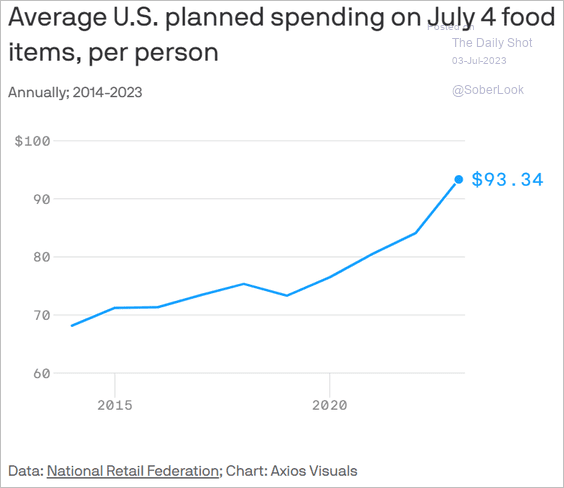 Source: @axios Read full article
7. Fireworks sales:
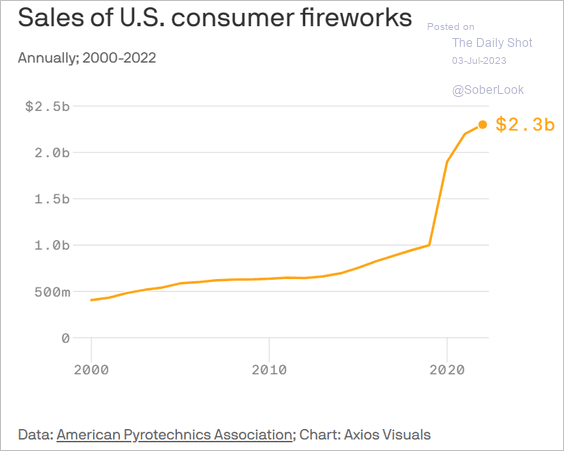 Source: @axios Read full article
——————–
The next Daily Shot will be out on July 5th.
Back to Index