
The Daily Shot: 05-Jul-23
• The United States
• Canada
• The United Kingdom
• The Eurozone
• Europe
• Asia-Pacific
• China
• Emerging Markets
• Cryptocurrency
• Energy
• Equities
• Credit
• Rates
• Global Developments
• Food for Thought
The United States
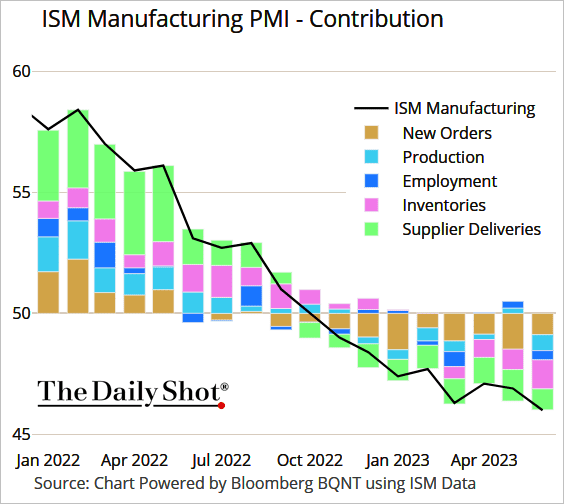
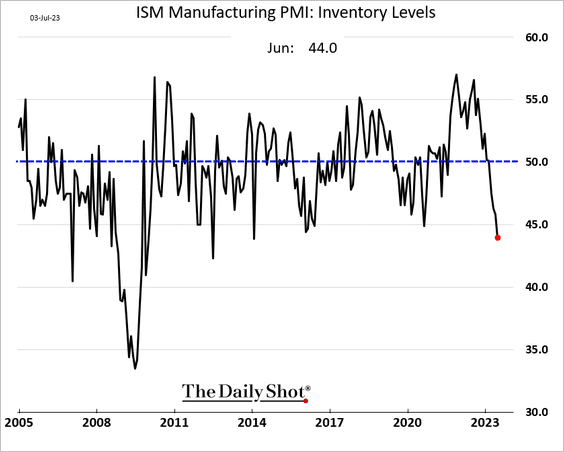
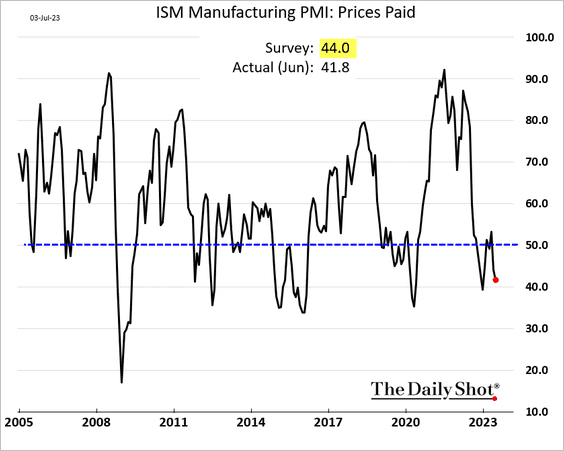
1. The ISM Manufacturing PMI report showed further deterioration in US factory activity last month.
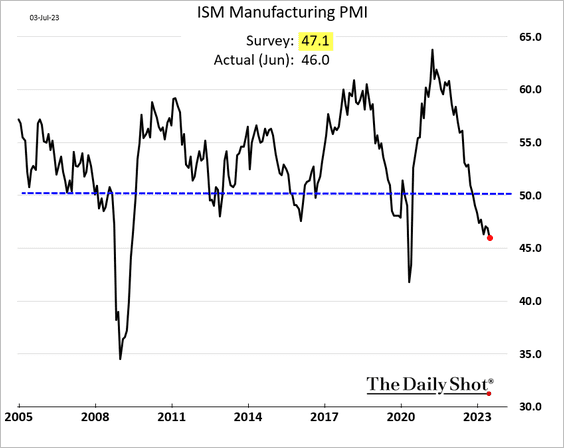
Here are the components.
 Source: @TheTerminal, Bloomberg Finance L.P.
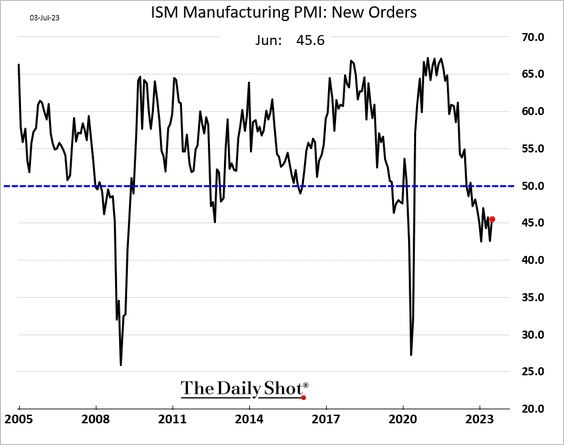
• New orders continue to decline.
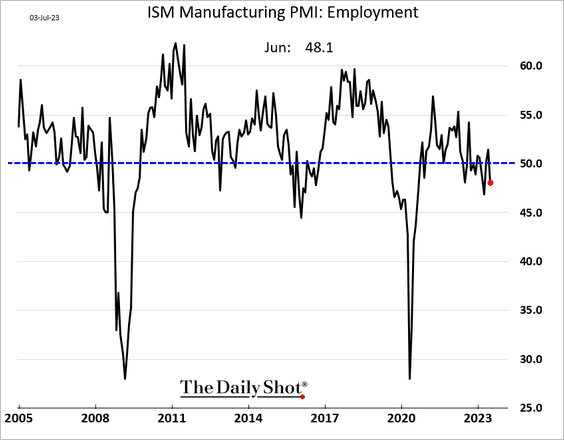
• Employment shifted back into contraction territory.
• Factories are rapidly cutting inventories.
• Input prices are falling.
——————–
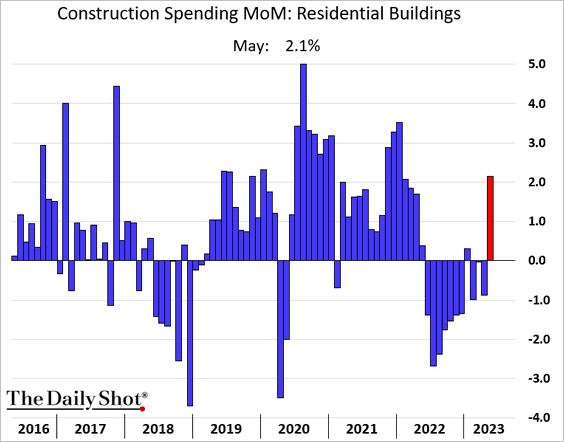
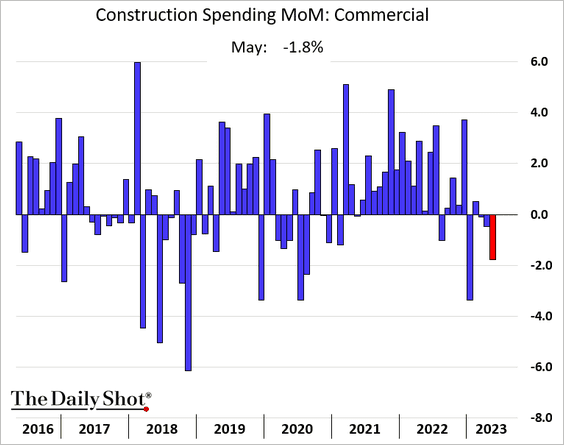
2. Construction spending jumped in May, …
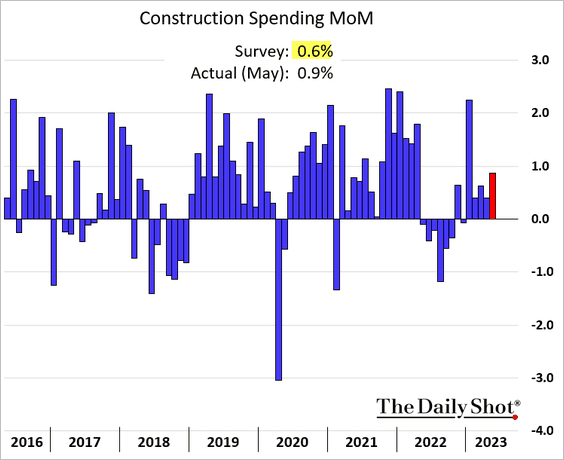
… boosted by a sharp increase in residential investment.
• But spending on commercial real estate construction fell.
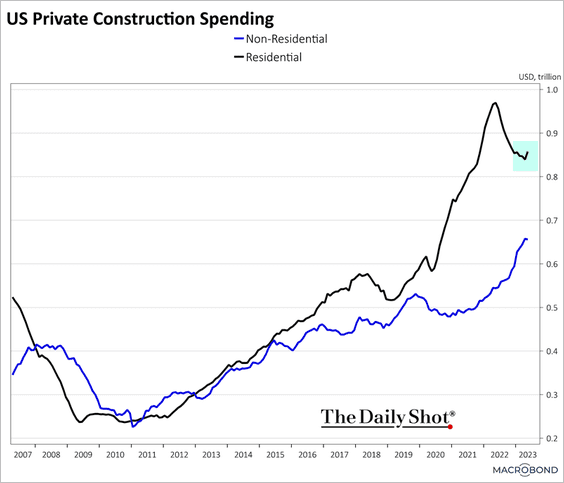
• Below are some additional trends in construction spending.
– Private residential and non-residential construction:
 Source: Chart and data provided by Macrobond
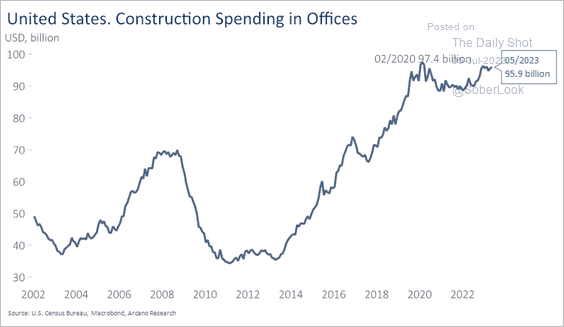
– Spending on office properties (still holding up):
 Source: Arcano Economics
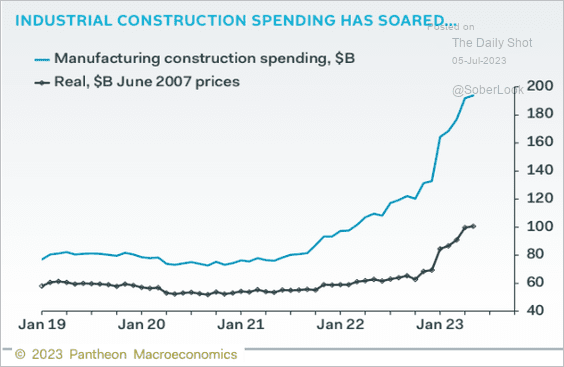
– Manufacturing construction spending:
 Source: Pantheon Macroeconomics
– Architecture billings (growing again):
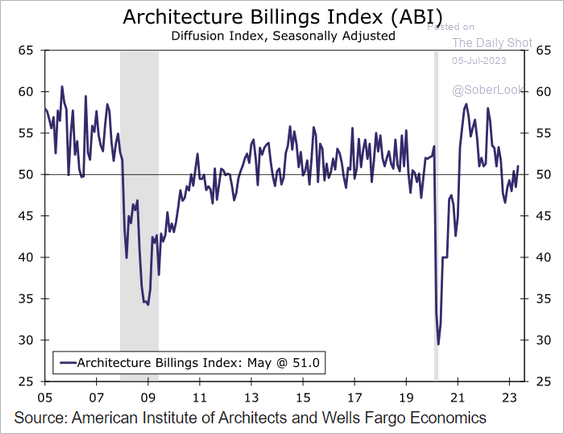 Source: Wells Fargo Securities
——————–
3. According to Apartment List, rental costs continue to climb but are now roughly flat year-over-year (2nd panel).
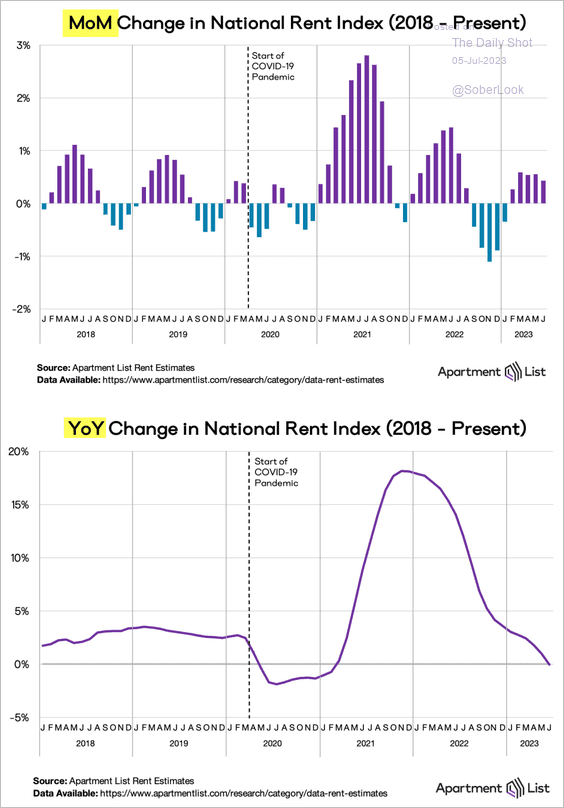 Source: Apartment List
4. Generally, businesses are less concerned about inflation, although labor cost and quality are still an issue.
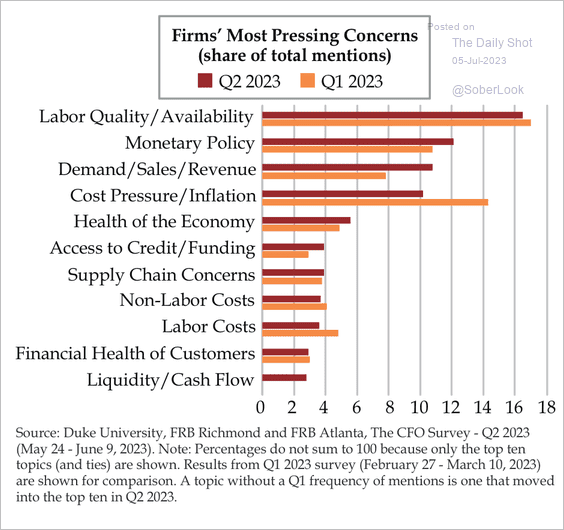 Source: Quill Intelligence
CFOs expect greater revenue and a significant decline in employment growth next year.
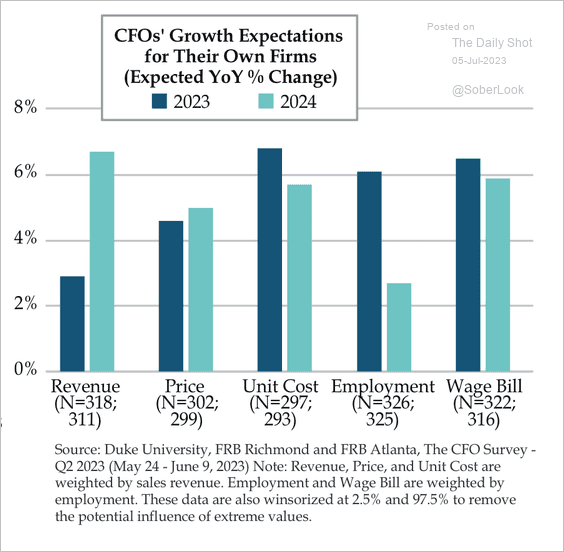 Source: Quill Intelligence
——————–
5. US intermodal shipping traffic is back below 2020 levels.
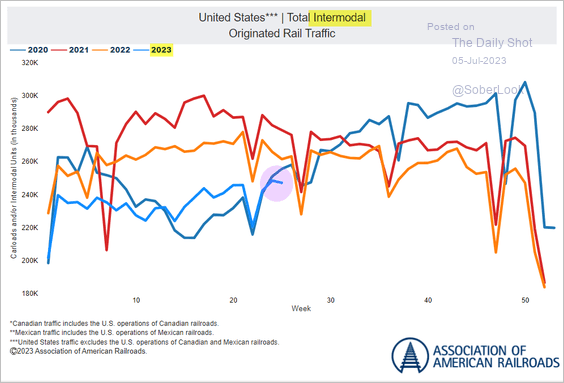 Source: AAR
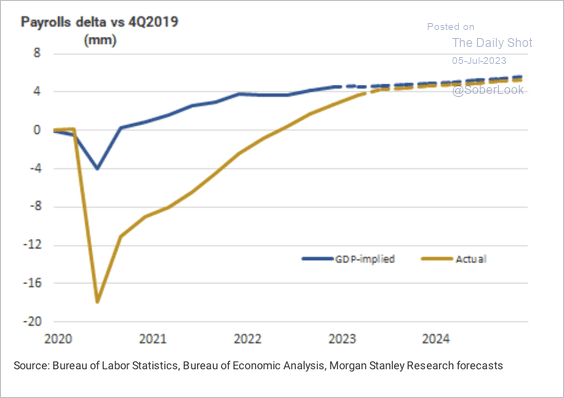
6. According to Morgan Stanley, the backfilling of workers is nearly complete.
 .
.
• Here is Deutsche Bank’s labor market geographic mismatch index.
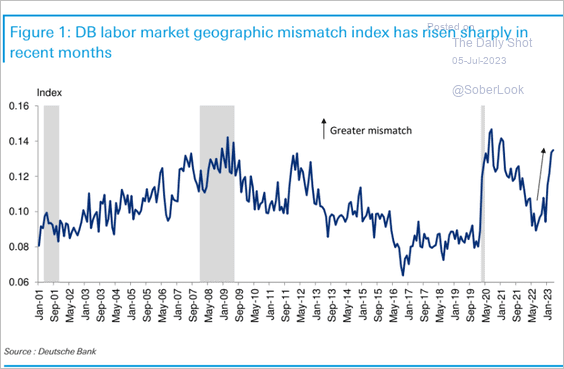 Source: Deutsche Bank Research
——————–
7. Households’ excess savings could run out as soon as September.
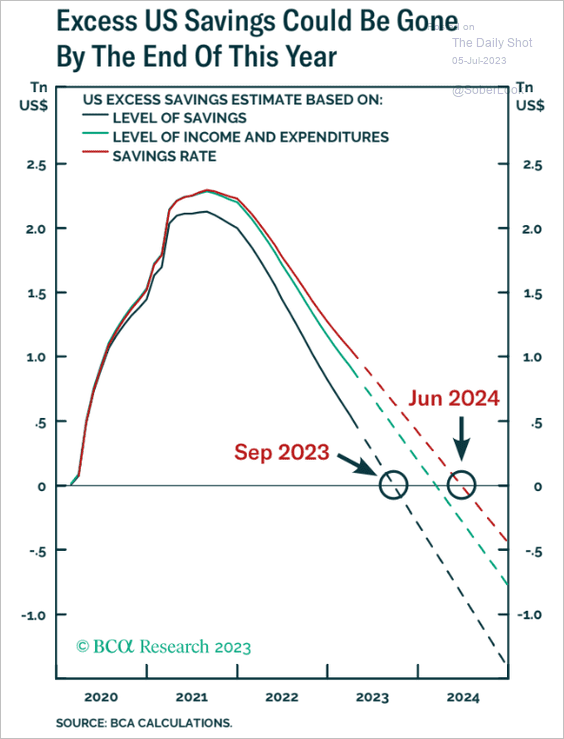 Source: BCA Research
Back to Index
Canada
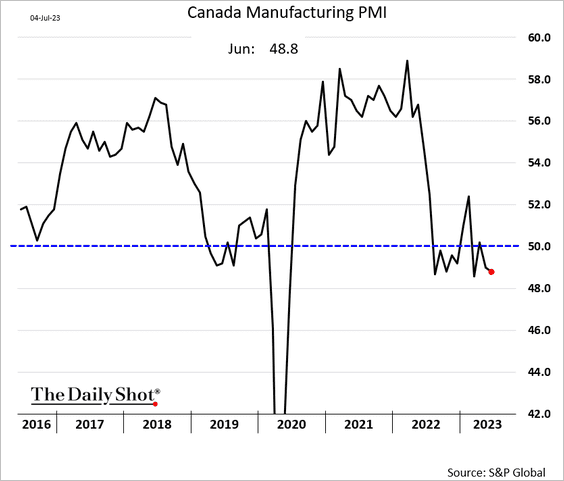
1. Factory activity continues to contract, according to the S&P Global Manufacturing PMI.
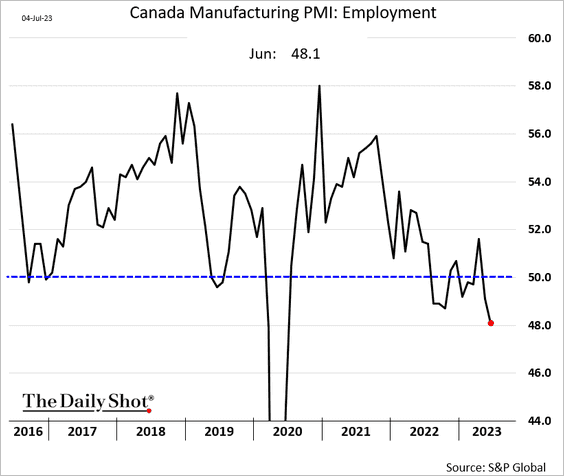
Manufacturers are trimming staff.
——————–
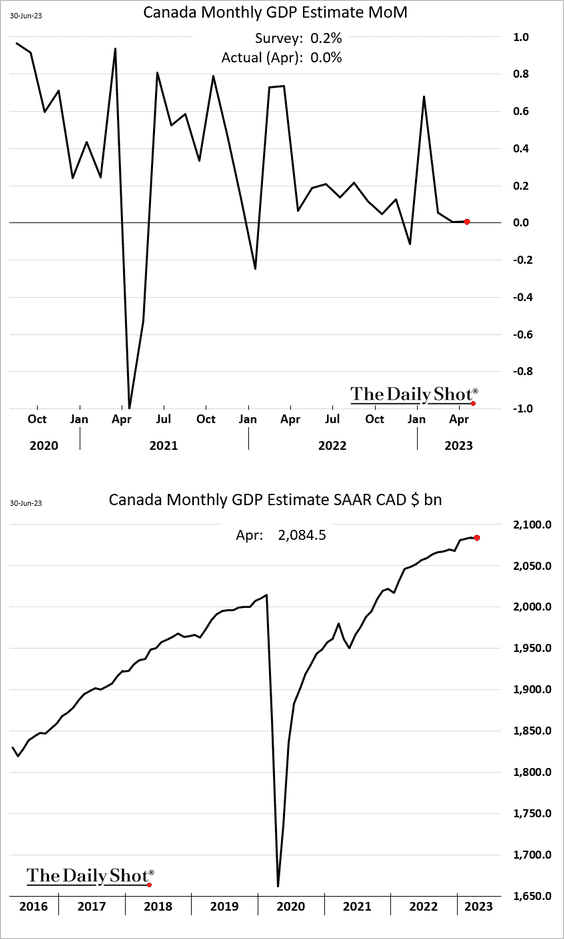
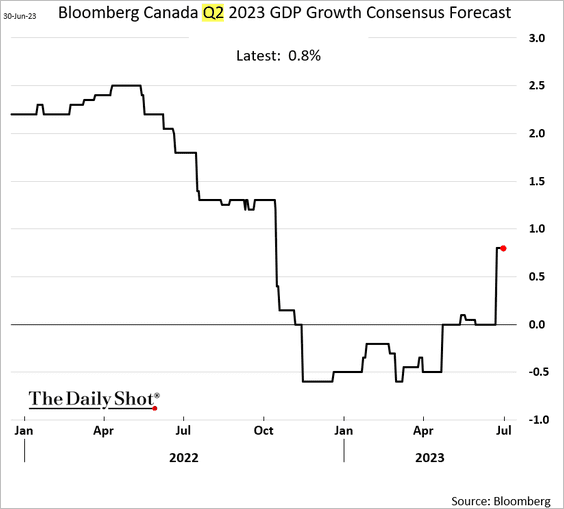
2. Economic growth stalled in April, partially due to the federal civil servant strike.
• Scotiabank’s GDP tracker shows Q2 growth at 1.4%.
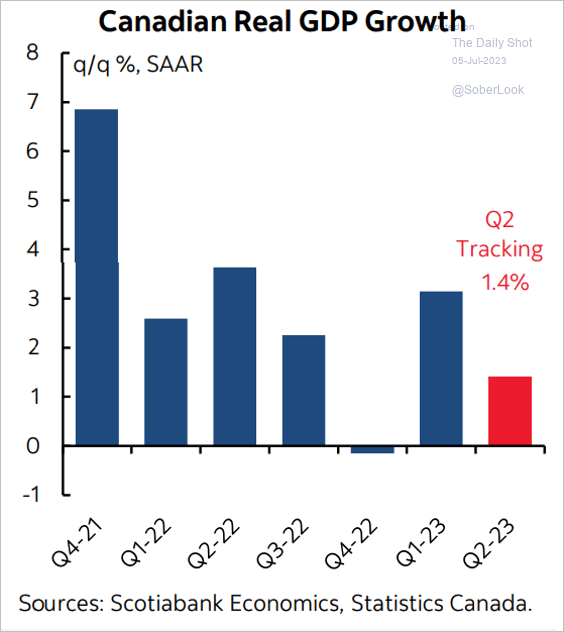 Source: Scotiabank Economics
• The consensus forecast is 0.8%.
Back to Index
The United Kingdom
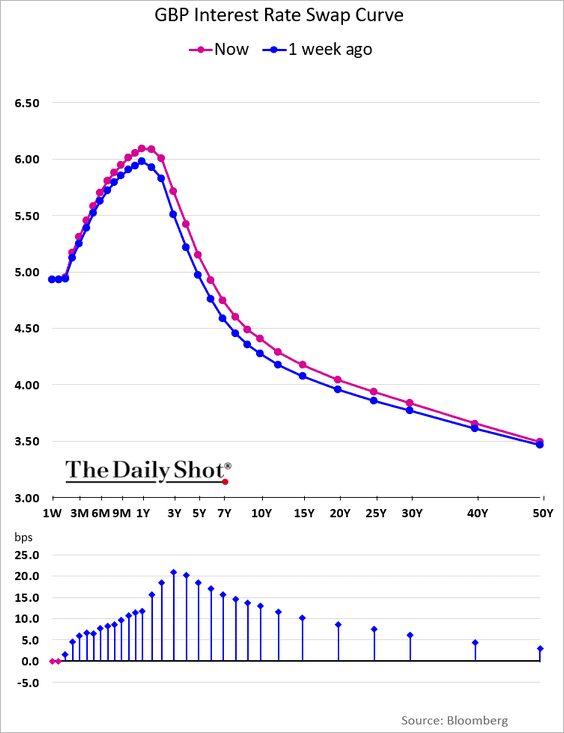
1. The gilt curve hasn’t been this inverted since 2000.
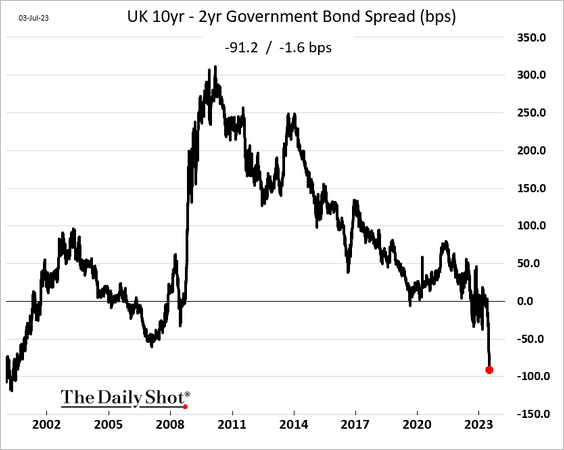
Here is the rate swap curve.
——————–
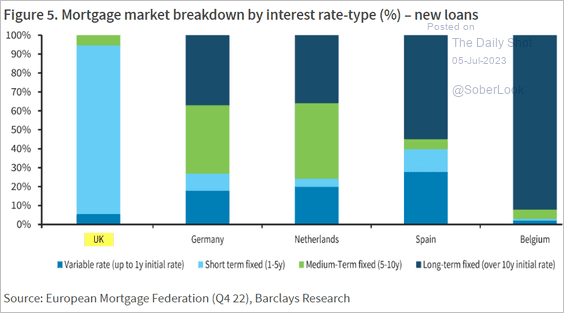
2. UK homeowners are highly exposed to …
 Source: Barclays Research
… elevated mortgage rates.
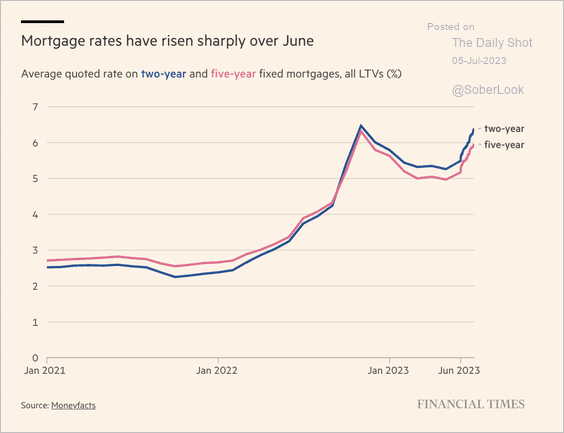 Source: @financialtimes Read full article
——————–
3. The PMI output price index points to declines in producer prices.
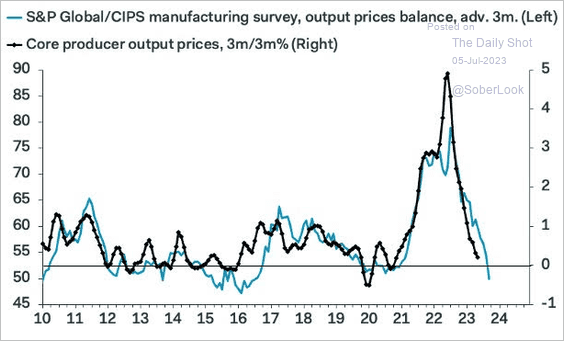 Source: Pantheon Macroeconomics
Back to Index
The Eurozone
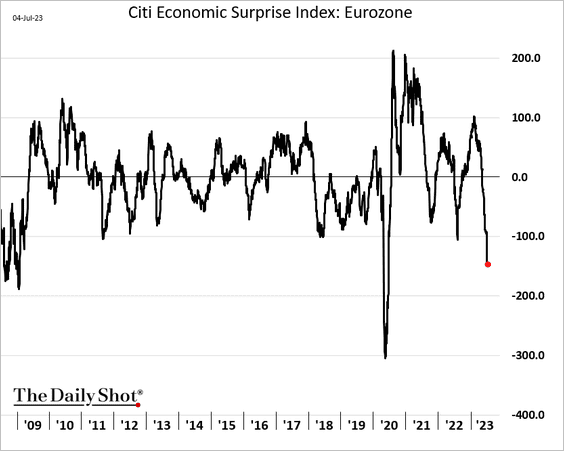
1. The Citi Economic Surprise Index looks recessionary.
2. The final PMI figures showed no improvement from the flash report.
• Italy:
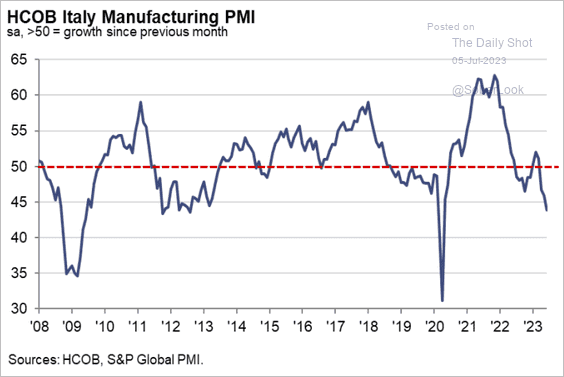 Source: S&P Global PMI
• Germany:
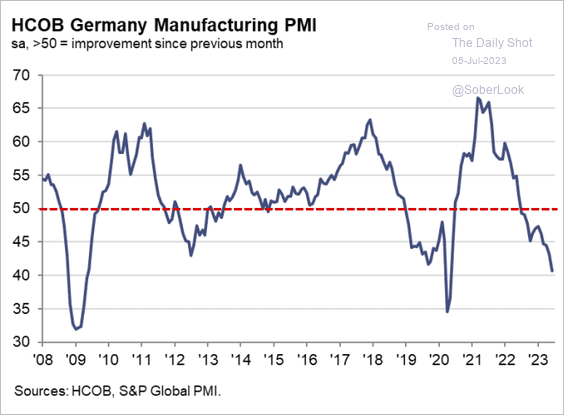 Source: S&P Global PMI
• Eurozone:
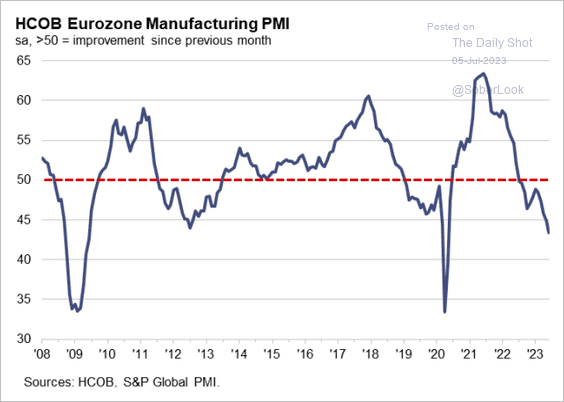 Source: S&P Global PMI
——————–
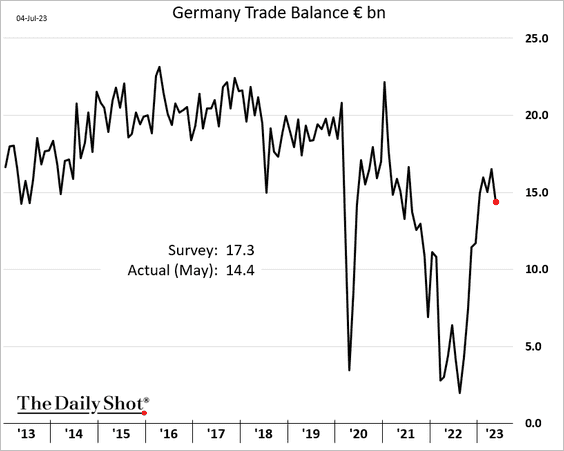
3. Germany’s trade surplus unexpectedly narrowed in May amid sluggish exports.
4. Spain’s unemployment fell to the lowest level since the GFC.
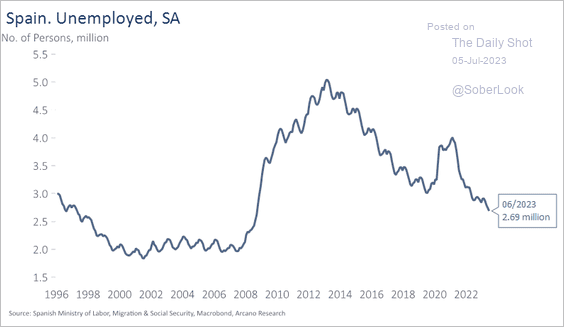 Source: Arcano Economics
5. This chart shows GDP growth by country.
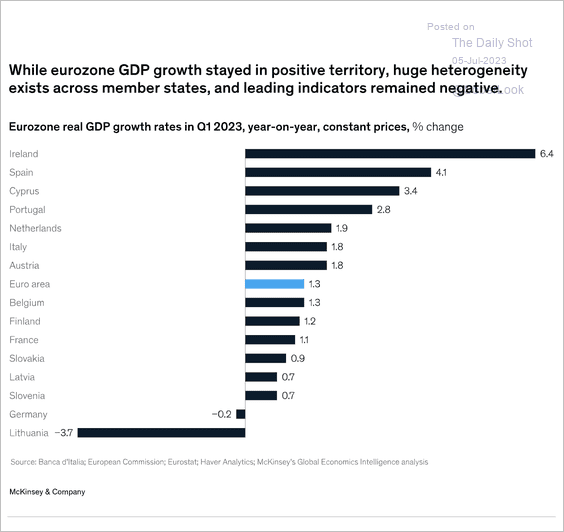 Source: McKinsey & Company Read full article
Back to Index
Europe
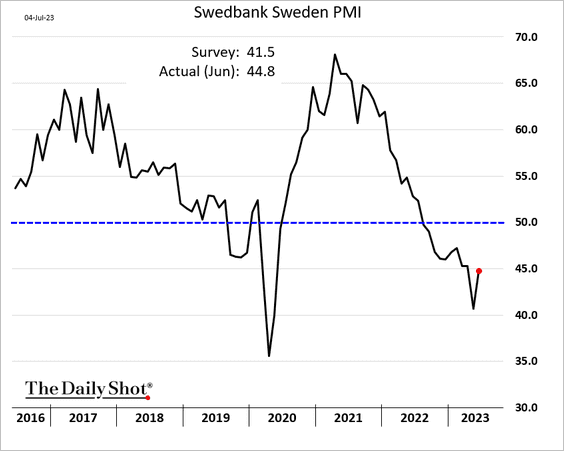
1. Sweden’s manufacturing PMI climbed in June but remained in contraction territory.
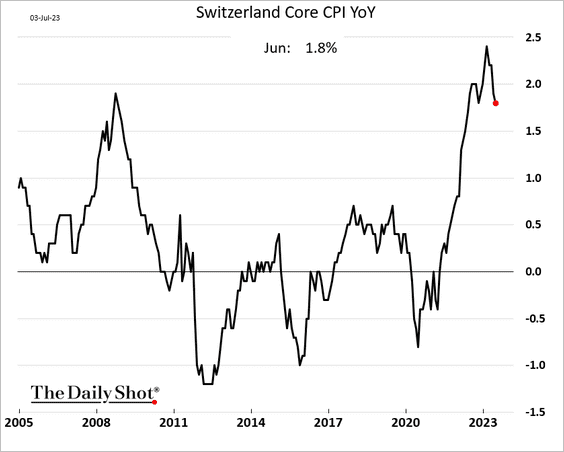
2. The Swiss core CPI is back below 2%.
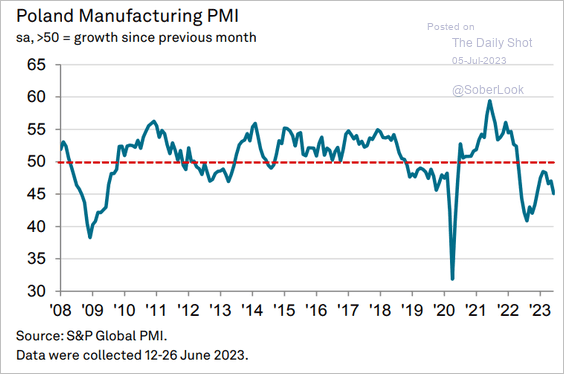
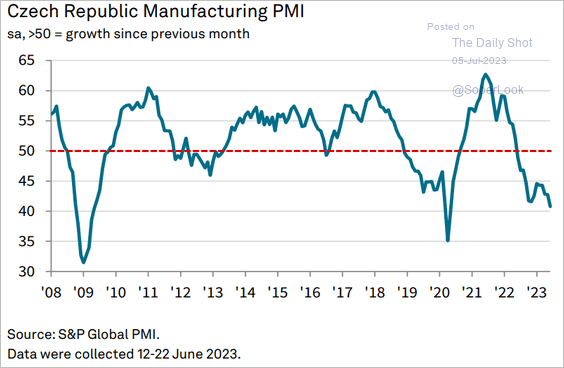
3. Central European manufacturing hubs continue to struggle.
• Poland:
 Source: S&P Global PMI
• The Czech Republic:
 Source: S&P Global PMI
Back to Index
Asia-Pacific
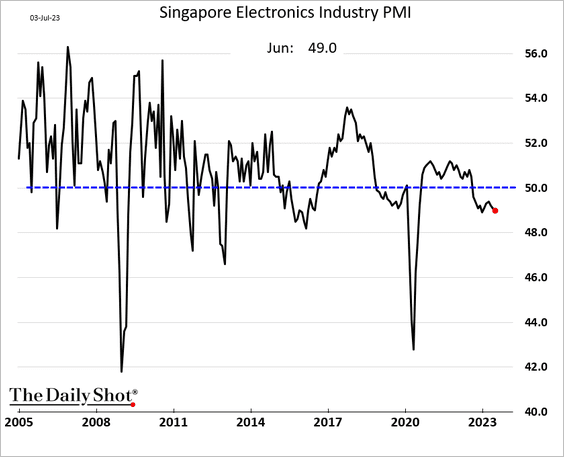
1. Singapore’s electronics sector remains in contraction territory.
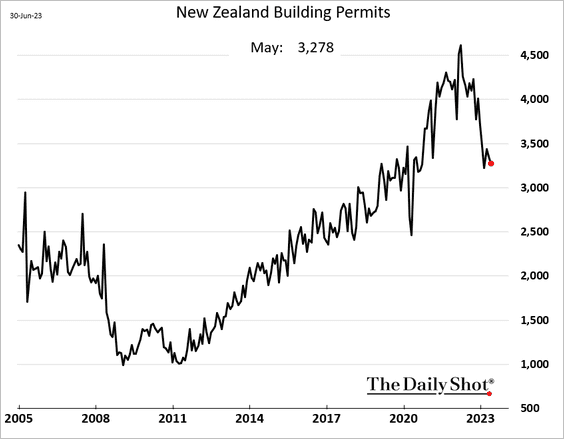
2. New Zealand’s building permits are back at pre-COVID levels.
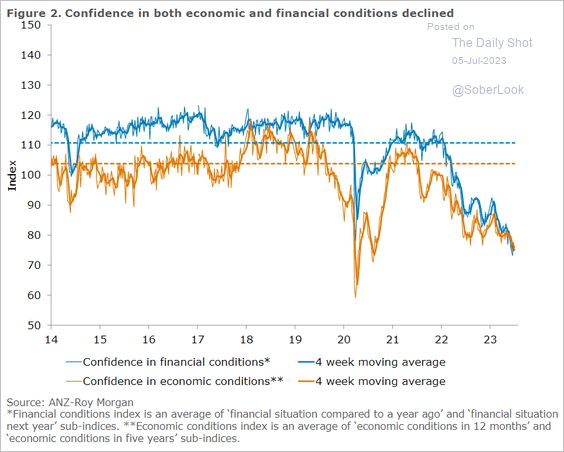
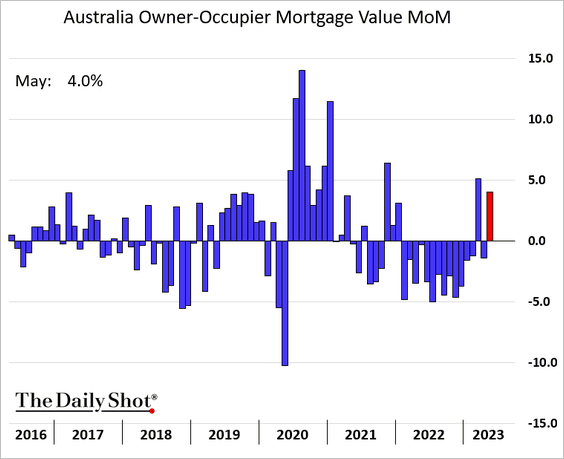
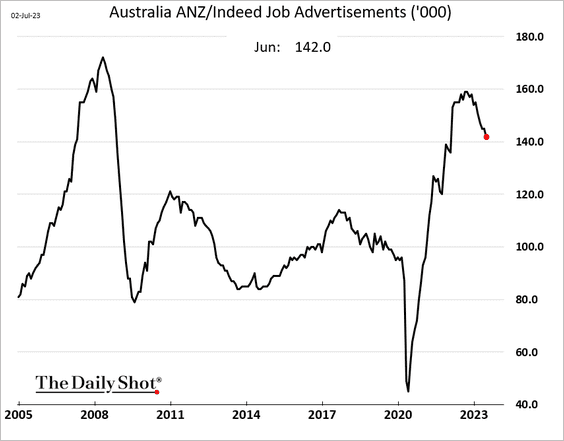
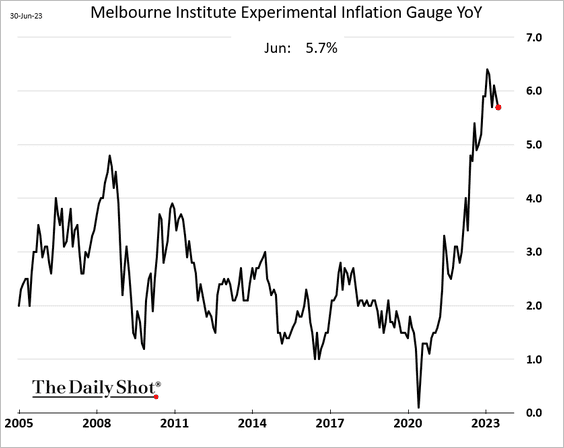
3. Next, we have some updates on Australia.
• Consumer sentiment (still depressed):
 Source: @ANZ_Research
• Mortgage lending:
• Job postings (still elevated):
• Inflation (still running hot):
• Export earnings on commodities:
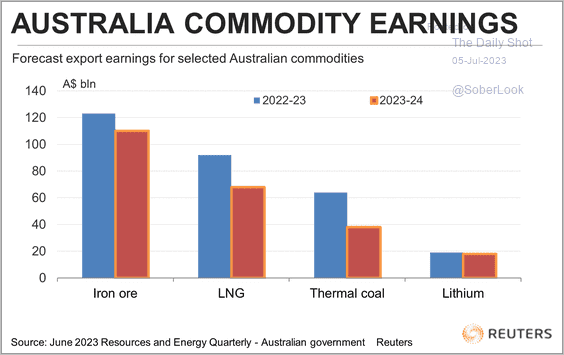 Source: @ClydeCommods Read full article
Back to Index
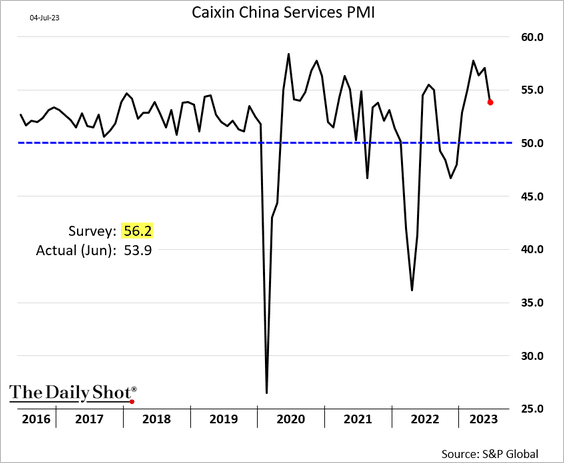
China
1. Although services activity continues to grow, the pace of expansion in June was lower than anticipated.
2. Domestic orders increased in Q2, while as export orders have been soft.
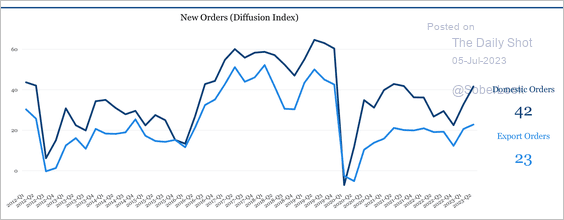 Source: China Beige Book
3. Mortgage loans are down despite lower rates.
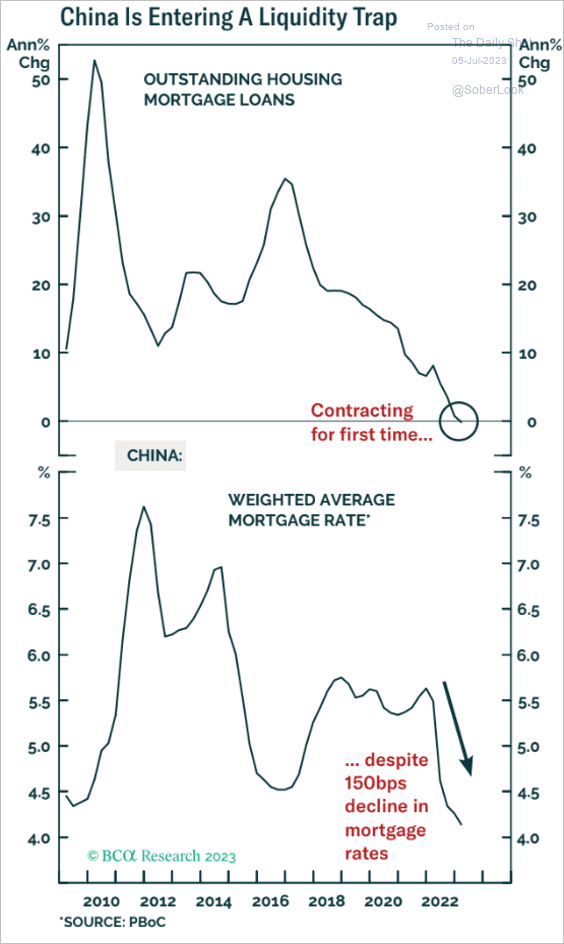 Source: BCA Research
Back to Index
Emerging Markets
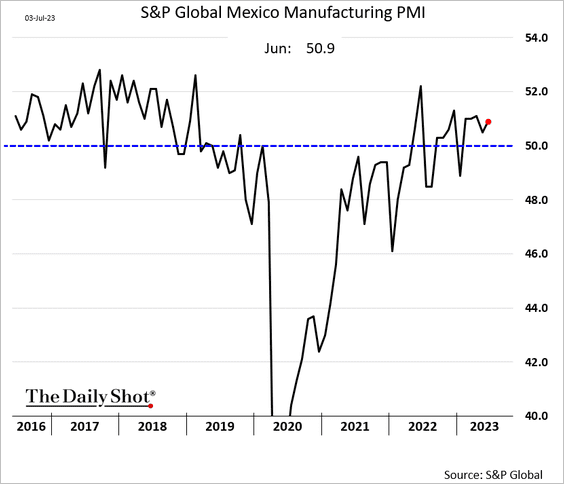
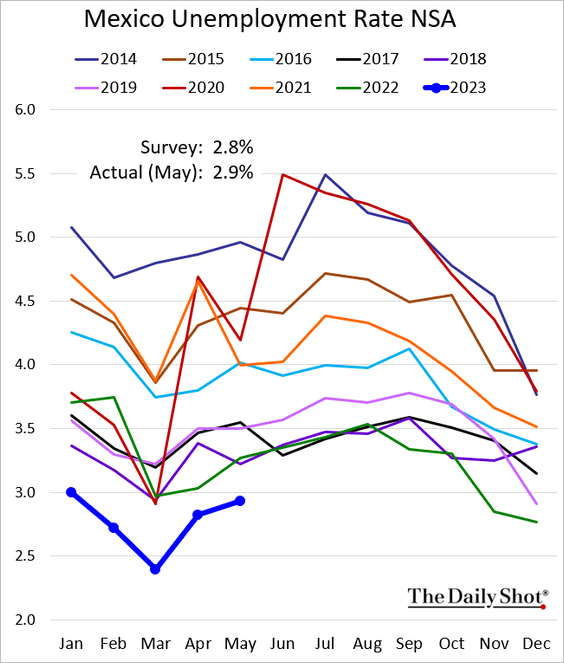
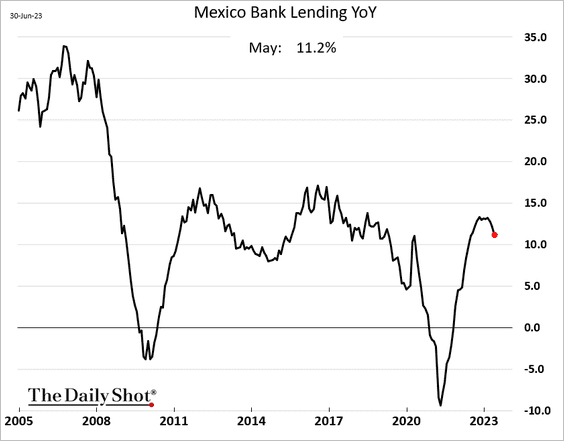
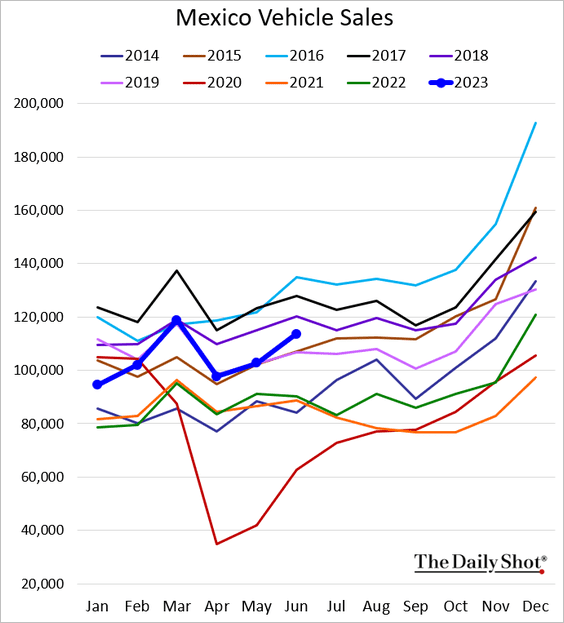
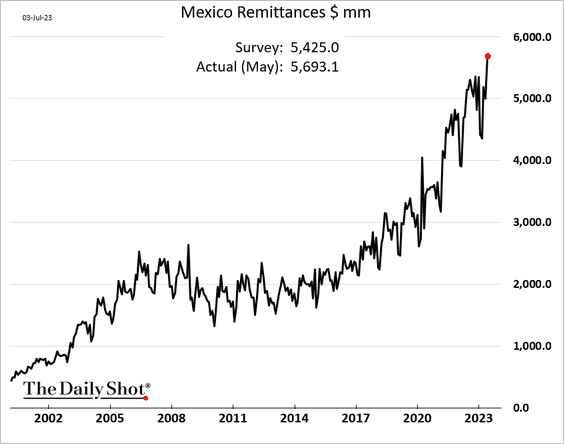
1. Let’s begin with Mexico.
• Manufacturing PMI (growing):
• Unemployment (still low):
• Bank loan growth (rolling over):
• Vehicle sales (improving):
• Remittances (record high):
——————–
2. India’s manufacturing activity continues to expand at a rapid pace.
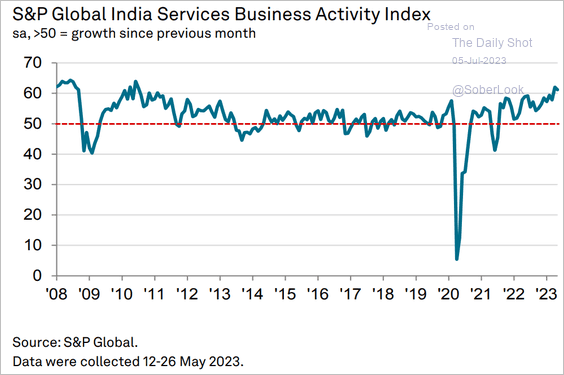 Source: S&P Global PMI
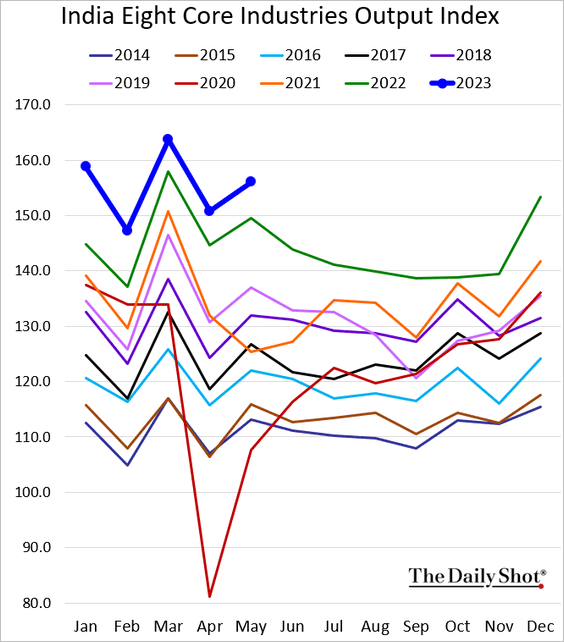
Here is the core industries’ output index.
——————–
3. Pakistani bonds surged as the IMF bailout came through.
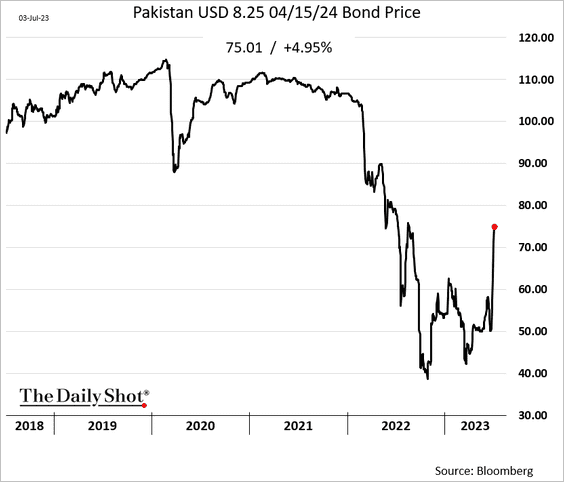
 Source: Reuters Read full article
——————–
4. South Africa’s factory activity is contracting.
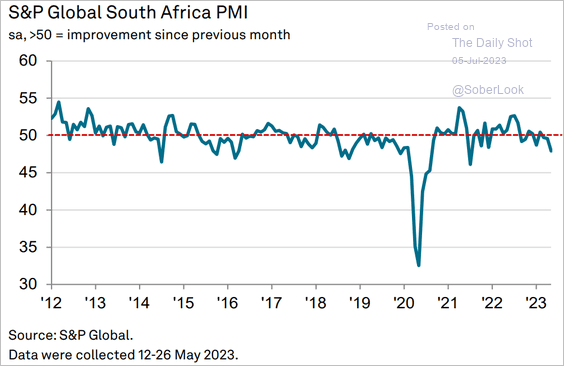 Source: S&P Global PMI
5. Here is a look at EM country and sector valuations.
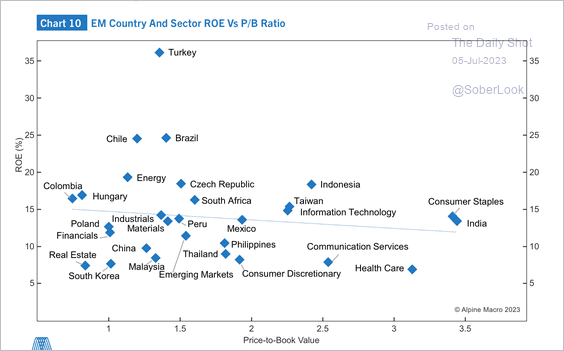 Source: Alpine Macro
Back to Index
Cryptocurrency
1. The Crypto Fear & Greed index remained in “greed” territory over the past week.
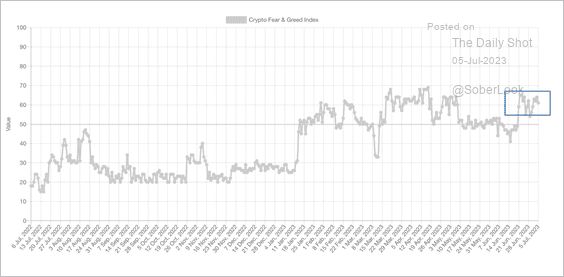 Source: Alternative.me
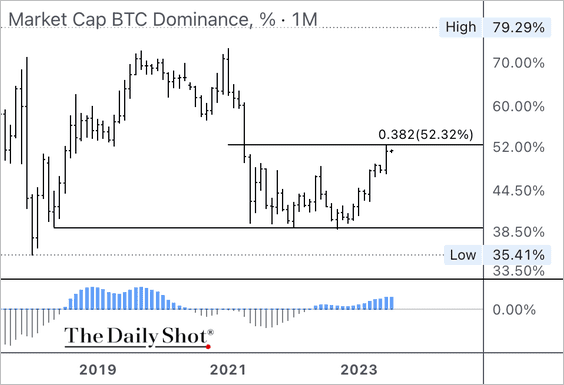
2. Bitcoin’s market cap relative to the total crypto market cap (dominance ratio) is testing long-term resistance, although positive momentum could limit pullbacks. A sustained breakout will likely solidify BTC’s outperformance among crypto peers.
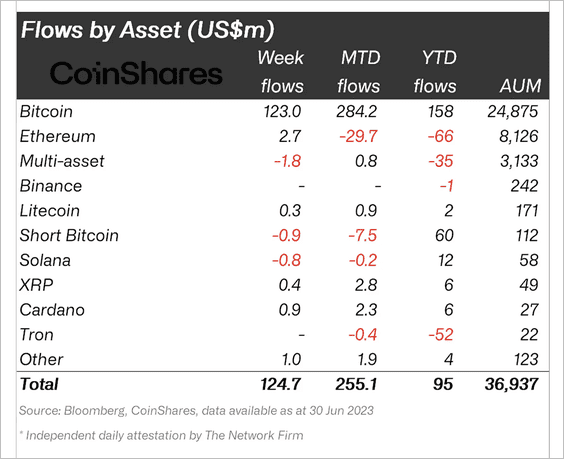
3. Crypto funds saw a second week of inflows led by long-bitcoin products. Short-bitcoin funds continued to see outflows last week. (2 charts)
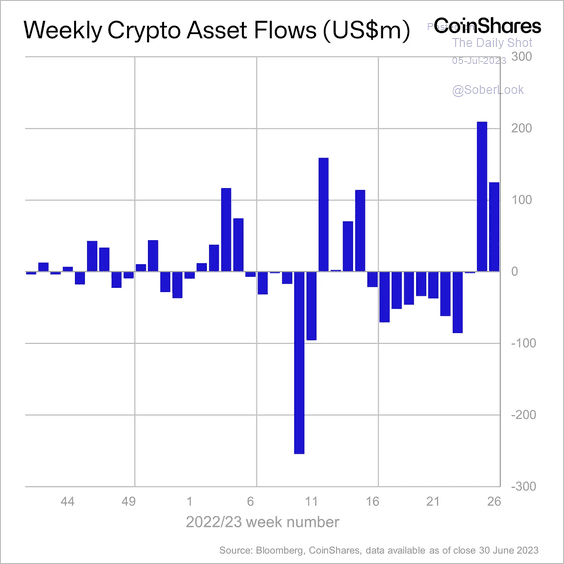 Source: CoinShares Read full article
 Source: CoinShares Read full article
Back to Index
Energy
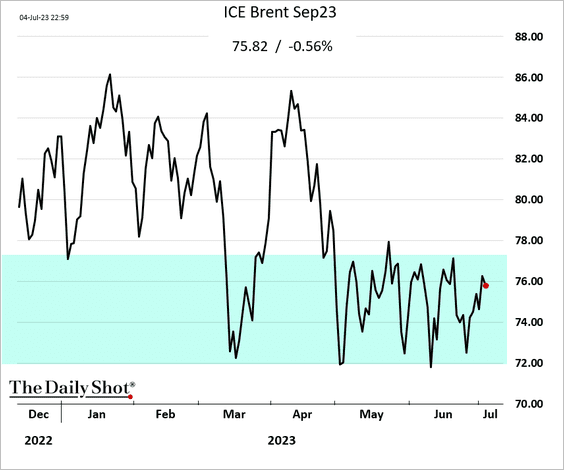
1. Saudi Arabia and Russia announced additional production cuts.
 Source: AP News Read full article
Crude oil gained, but market enthusiasm was muted as US factory activity deteriorates and China’s economic data remains lackluster.
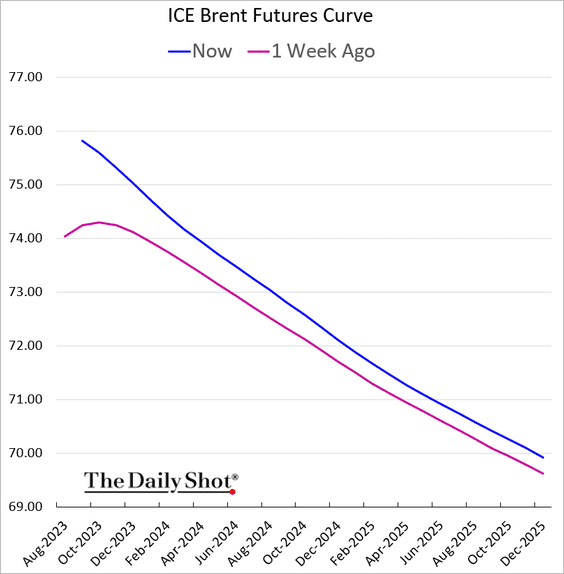
However, the Brent front-end contango is gone.
——————–
2. The crude oil market dwarfs other large commodity markets.
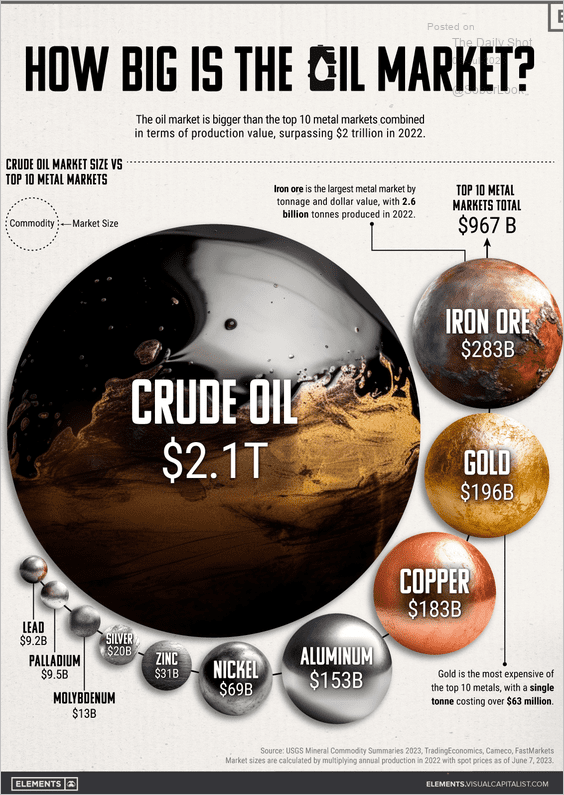 Source: Visual Capitalist Read full article
Back to Index
Equities
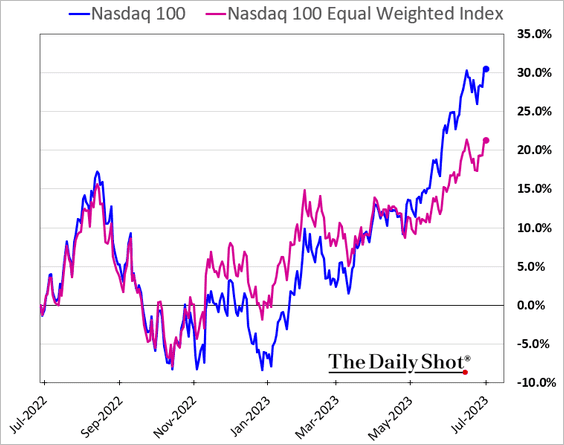
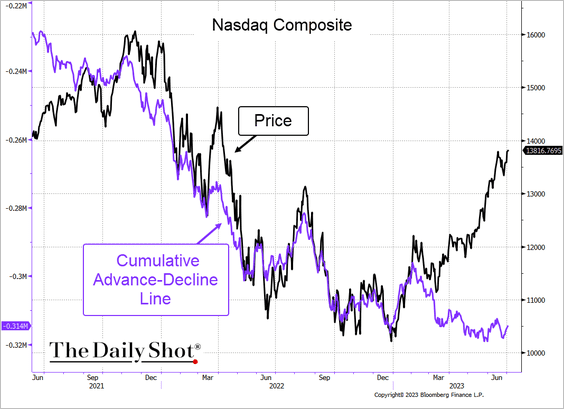
1. The Nasdaq market breadth remains depressed.
• Nasdaq 100 equal-weight index:
• Nasdaq Composite cumulative advance/decline line:
 Source: @TheTerminal, Bloomberg Finance L.P.
——————–
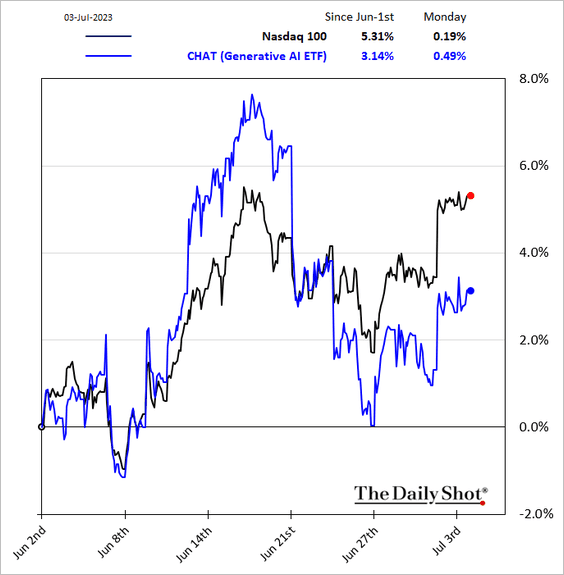
2. AI-exposed stocks are no longer outperforming.
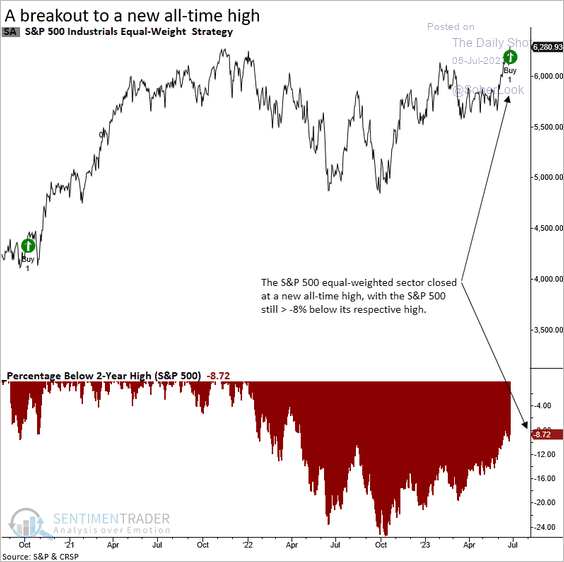
3. On an equal-weight basis, the S&P 500 industrial sector reached an all-time high, outpacing the S&P 500’s drawdown recovery.
 Source: SentimenTrader
Mid- and small-cap industrials are hitting record highs.
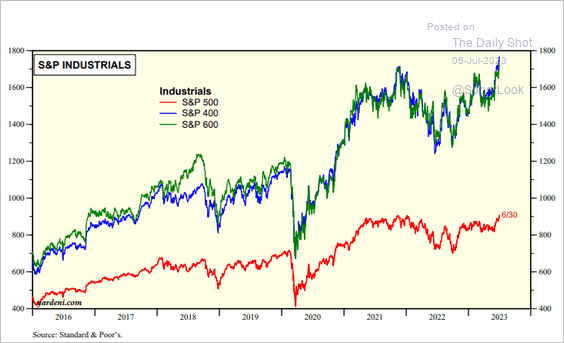 Source: Yardeni Research
——————–
4. According to SentimenTrader, the S&P 500 is more than 8% higher than what strategists, on average, estimated it would be six months from now (3 charts).
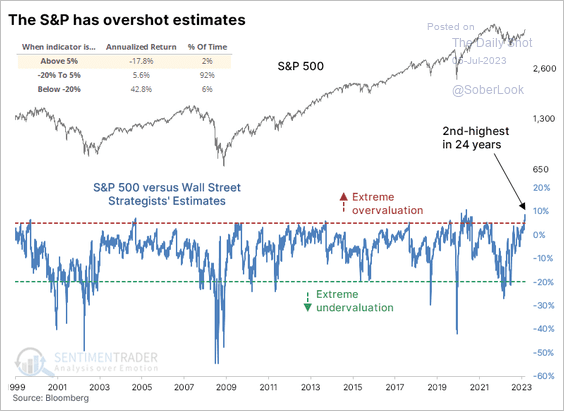 Source: SentimenTrader
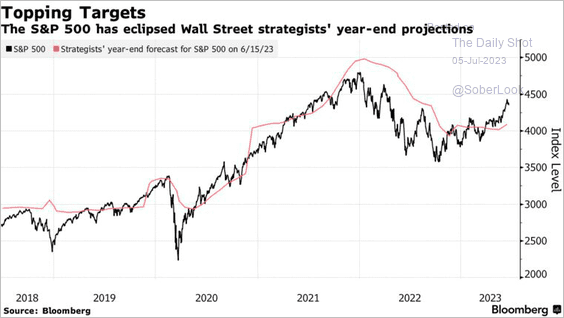 Source: @JessicaMenton, @lena_popina, @markets Read full article
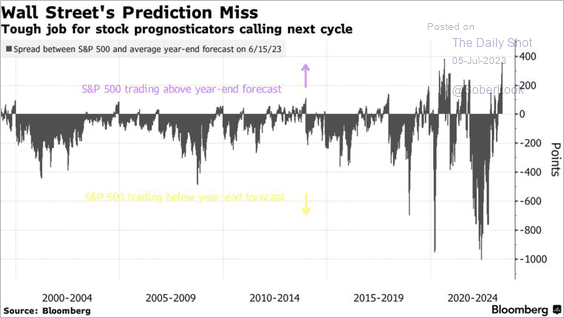 Source: @alexandraandnyc, @markets Read full article
——————–
5. This chart shows cumulative sector fund flows.
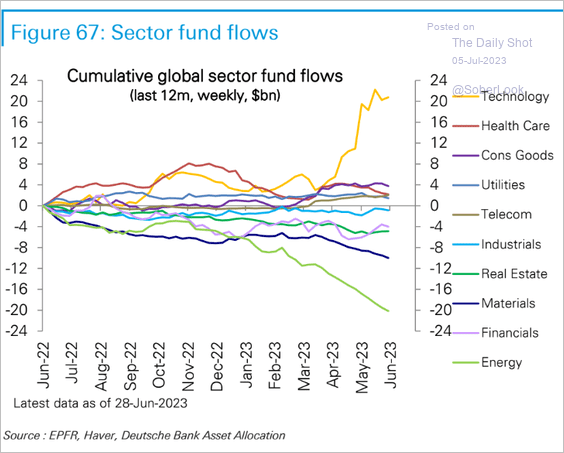 Source: Deutsche Bank Research
6. The US valuation premium to European shares continues to widen.
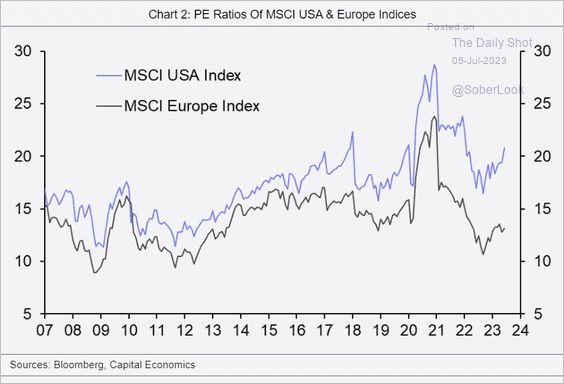 Source: Capital Economics
7. M&A activity has slowed sharply over the past eight quarters.
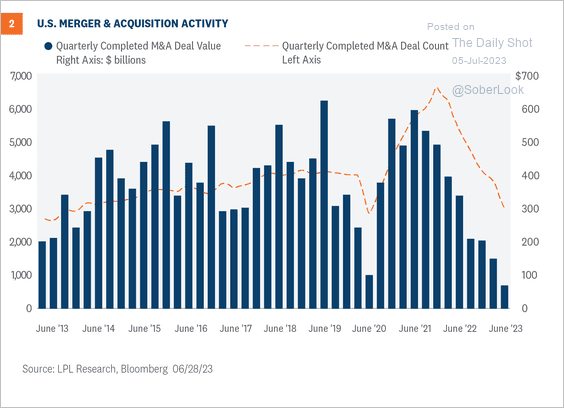 Source: LPL Research
Back to Index
Credit
1. US banks easily passed the Fed’s stress tests.
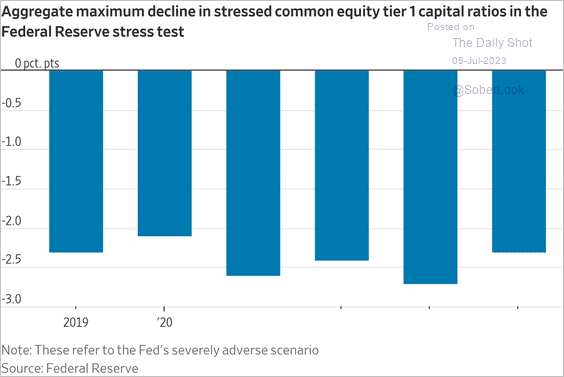 Source: @WSJ Read full article
2. Banks have sold off a large portion of their hung debt.
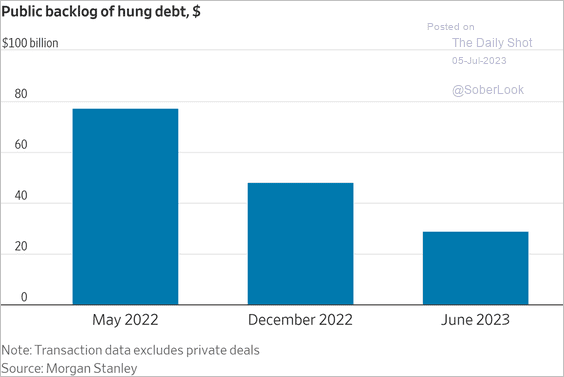 Source: @WSJ Read full article
3. Bankruptcy filings point to higher bank chargeoffs ahead.
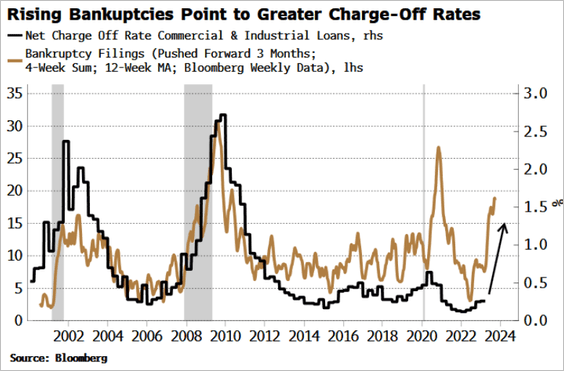 Source: @TheTerminal, Bloomberg Finance L.P.
4. The ISM Manufacturing PMI points to widening HY spreads.
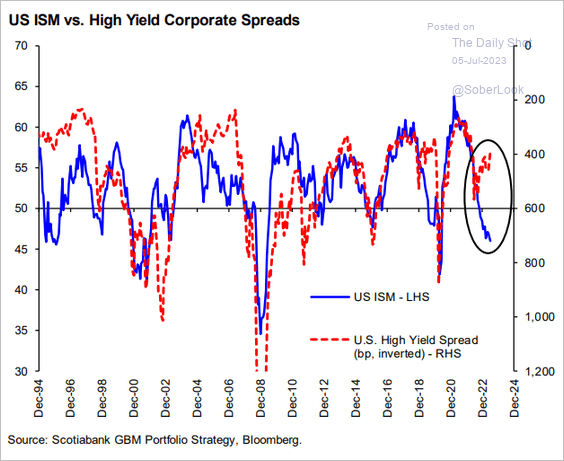 Source: Hugo Ste-Marie, Portfolio & Quantitative Strategy Global Equity Research, Scotia Capital
5. High-yield issuance is rebounding.
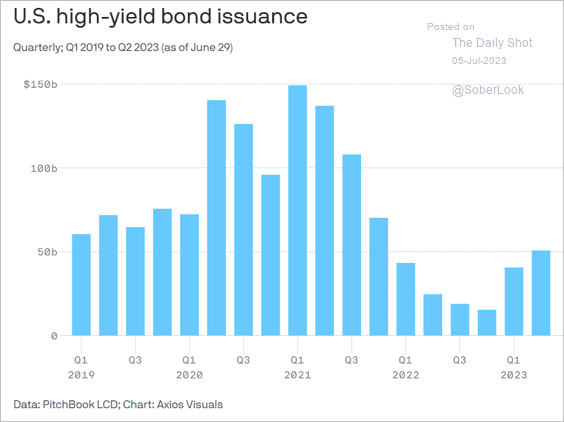 Source: @axios Read full article
Back to Index
Rates
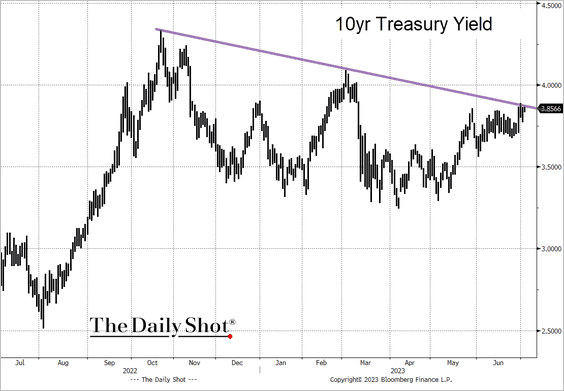
1. The 10-year Treasury yield is at resistance.
 Source: @TheTerminal, Bloomberg Finance L.P.
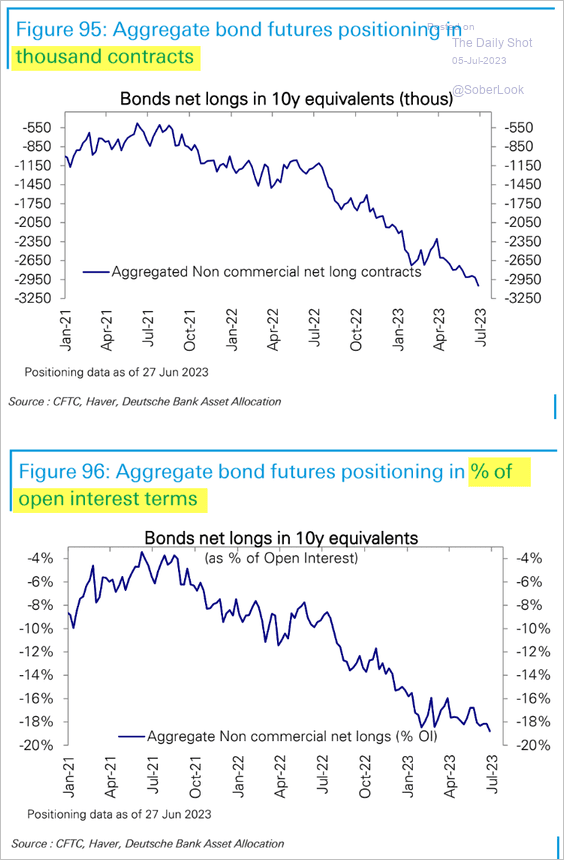
2. Speculative positioning in Treasury futures remains extraordinarily bearish.
 Source: Deutsche Bank Research
Back to Index
Global Developments
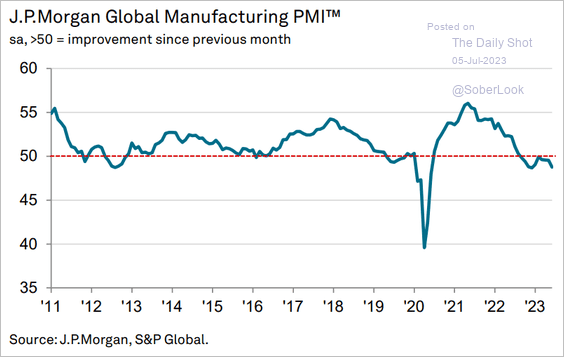
1. Global manufacturing contraction accelerated in June.
 Source: S&P Global PMI
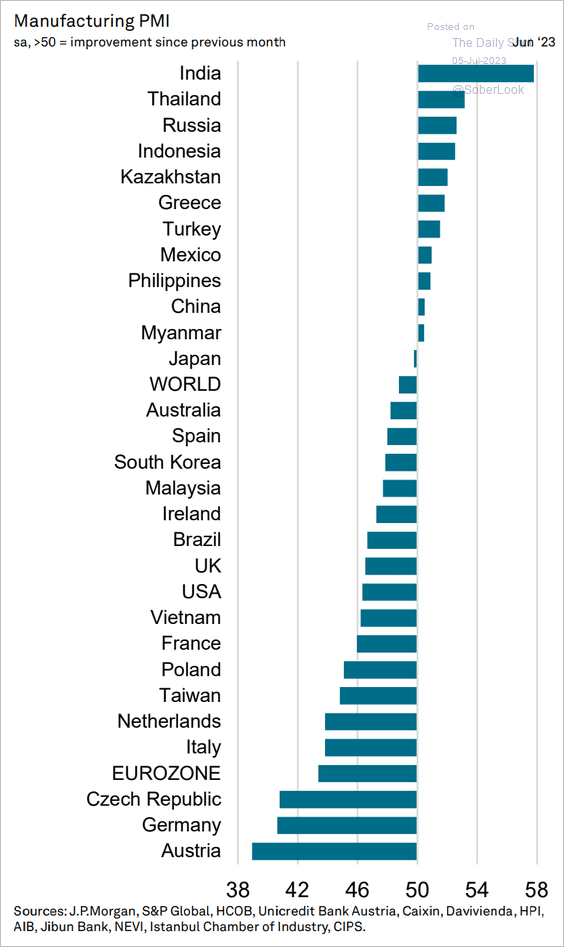
Below are the PMIs by country.
 Source: S&P Global PMI
——————–
2. Next, we have long-term GDP growth projections from Goldman.
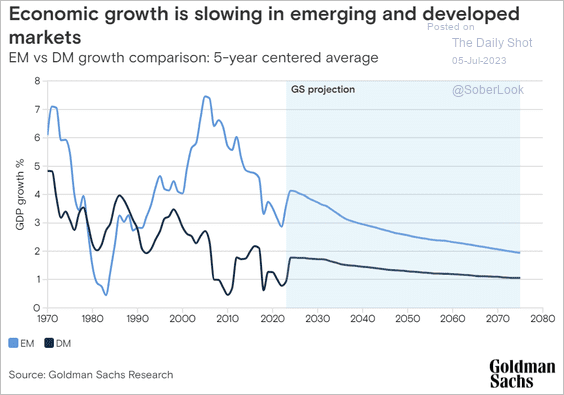 Source: Goldman Sachs
3. This chart shows the composition of private wealth in China, the Eurozone, and the US.
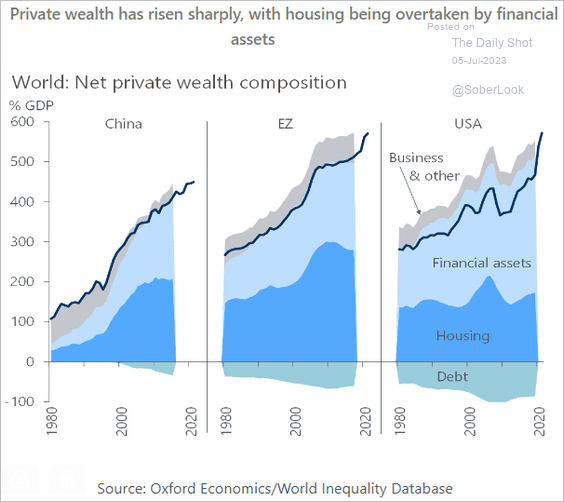 Source: Oxford Economics
4. Aging generally poses a bigger challenge for developed markets than emerging markets.
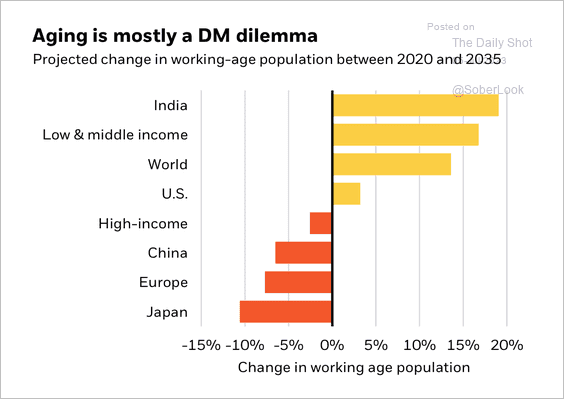 Source: BlackRock Investment Institute
——————–
Food for Thought
1. Market capitalization of US tech mega-caps:
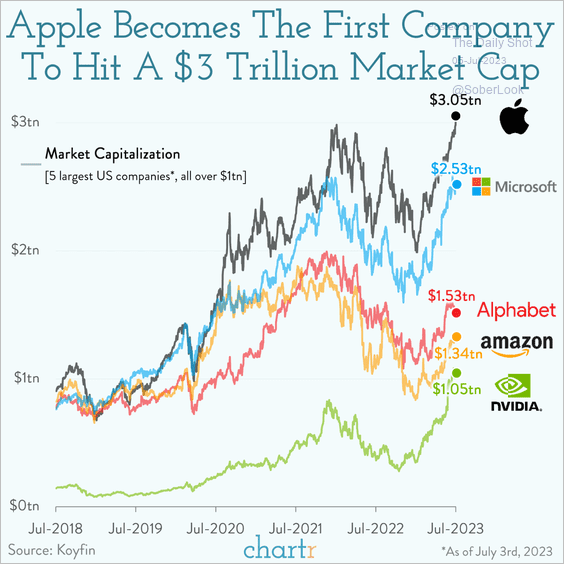 Source: @chartrdaily
2. Tesla vehicle deliveries:
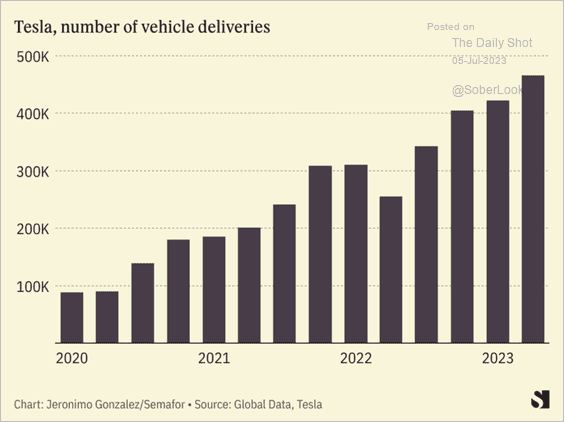 Source: Semafor
3. Losing money in Vegas:
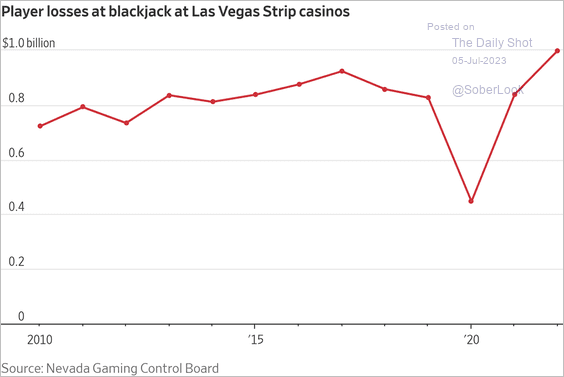 Source: @WSJ Read full article
4. Ordering from fast-food restaurants:
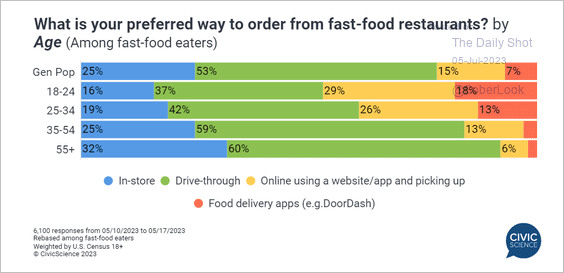 Source: @CivicScience Read full article
5. Top-rated companies by reputation:
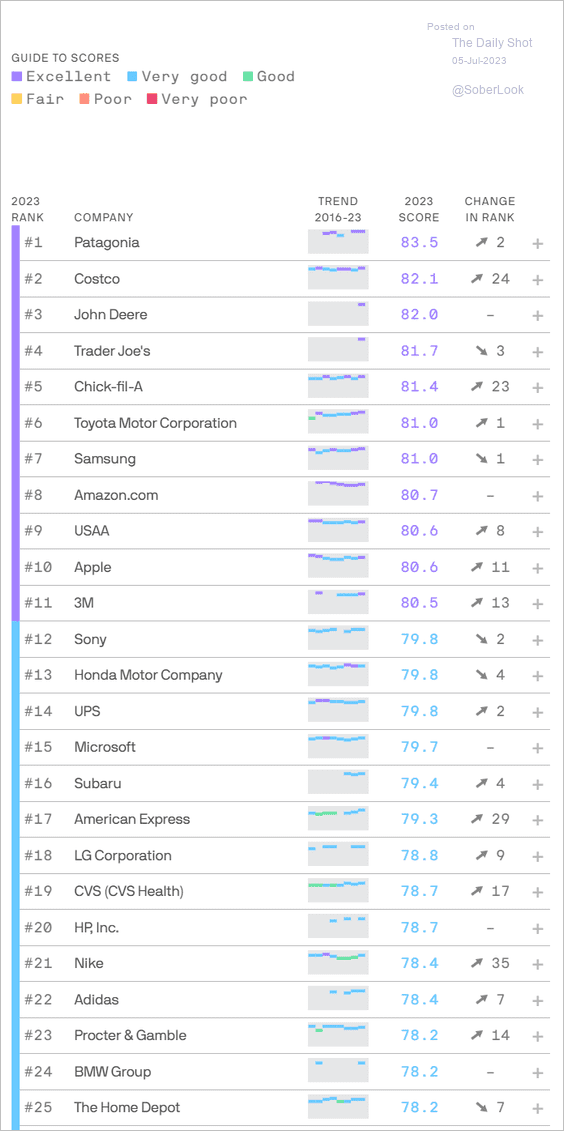 Source: @axios Read full article
6. US goods imports:
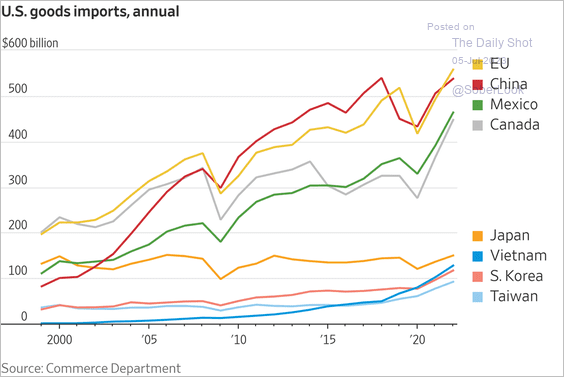 Source: @WSJ Read full article
7. Population loss in large US urban counties:
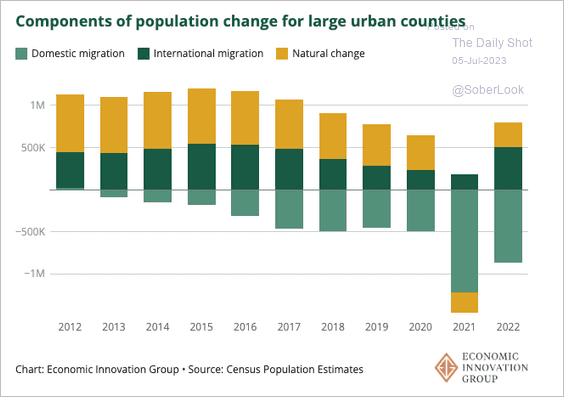 Source: EIG Read full article
8. Young US adults in 1980 and 2021:
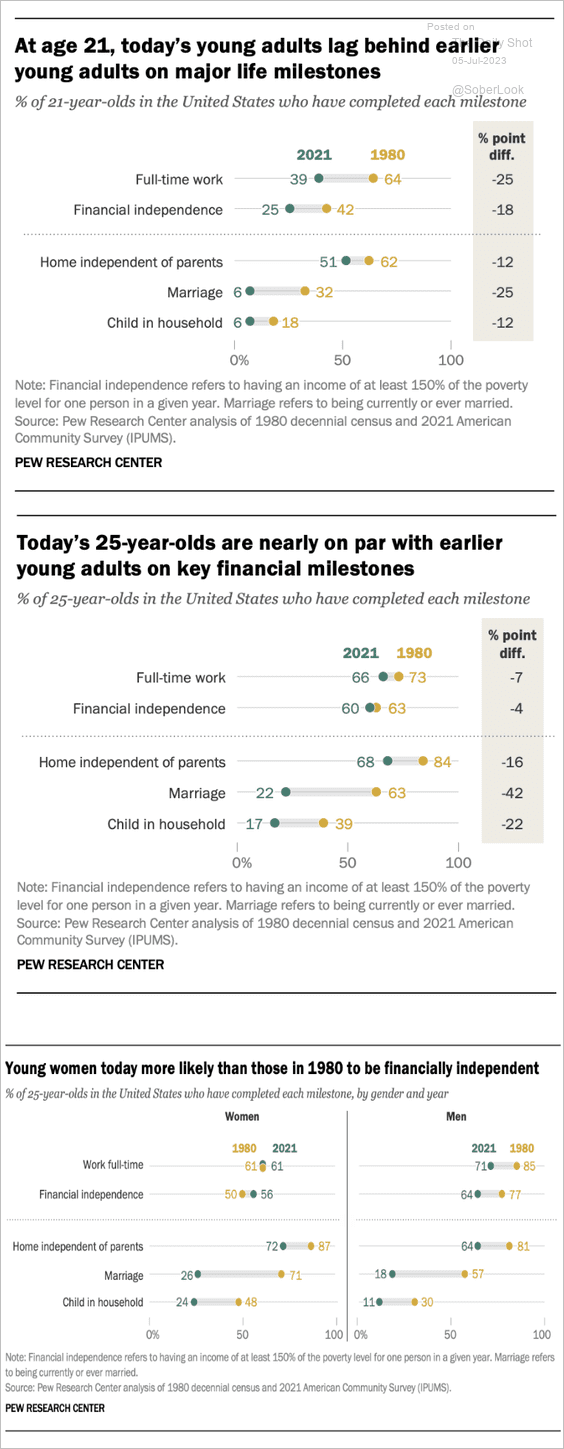 Source: Pew Research Center Read full article
9. Student debt distribution by age:
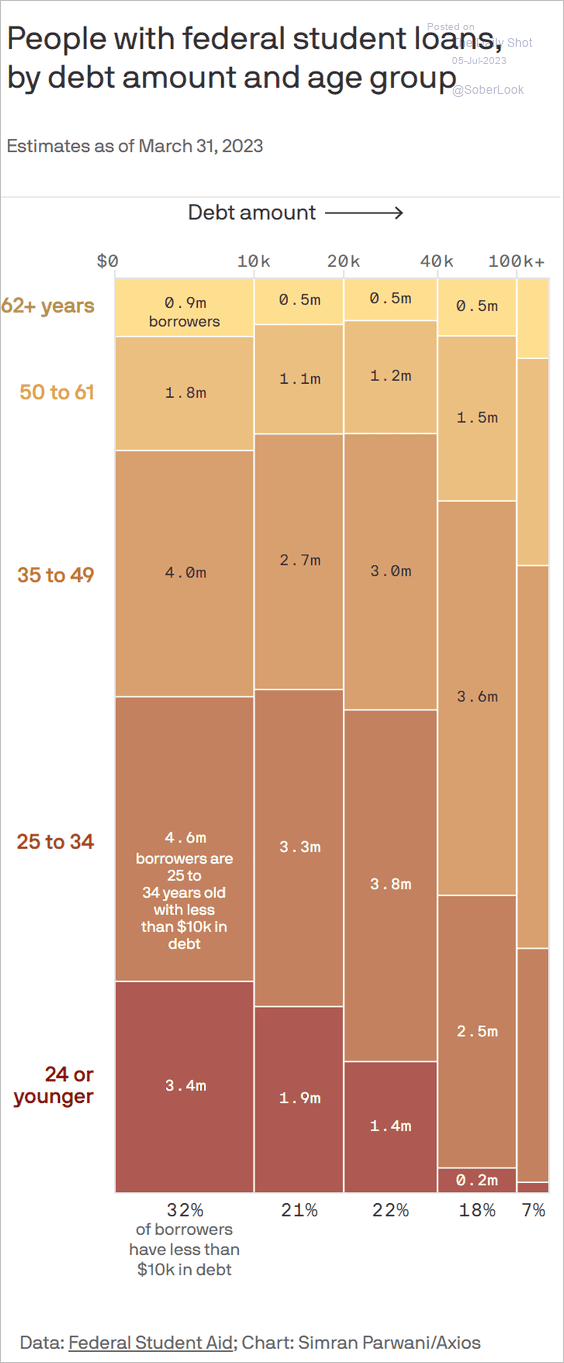 Source: @axios Read full article
10. Kia and Hyundai thefts:
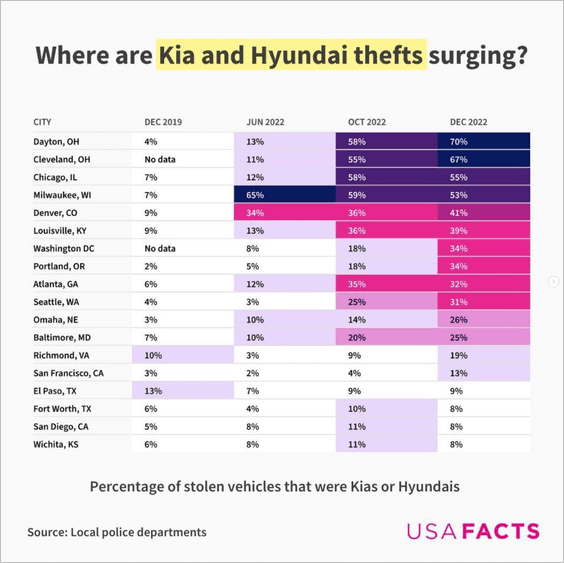 Source: USAFacts
——————–
Back to Index