
The Daily Shot: 06-Jul-23
• The United States
• The United Kingdom
• The Eurozone
• Europe
• Asia-Pacific
• China
• Emerging Markets
• Commodities
• Energy
• Equities
• Credit
• Global Developments
• Food for Thought
The United States
1. The FOMC minutes confirmed a hawkish pause last month. While most participants agreed to hold rates unchanged, some FOMC members wanted to keep hiking.
The economy was facing headwinds from tighter credit conditions, including higher interest rates, for households and businesses, which would likely weigh on economic activity, hiring, and inflation, although the extent of these effects remained uncertain. Against this backdrop, and in consideration of the significant cumulative tightening in the stance of monetary policy and the lags with which policy affects economic activity and inflation, almost all participants judged it appropriate or acceptable to maintain the target range for the federal funds rate at 5 to 5-1/4 percent at this meeting. Most of these participants observed that leaving the target range unchanged at this meeting would allow them more time to assess the economy’s progress toward the Committee’s goals of maximum employment and price stability. Some participants indicated that they favored raising the target range for the federal funds rate 25 basis points at this meeting or that they could have supported such a proposal. The participants favoring a 25 basis point increase noted that the labor market remained very tight, momentum in economic activity had been stronger than earlier anticipated, and there were few clear signs that inflation was on a path to return to the Committee’s 2 percent objective over time.
A July rate increase looks like a done deal, and September is a possibility unless we see the labor market starting to struggle by then.
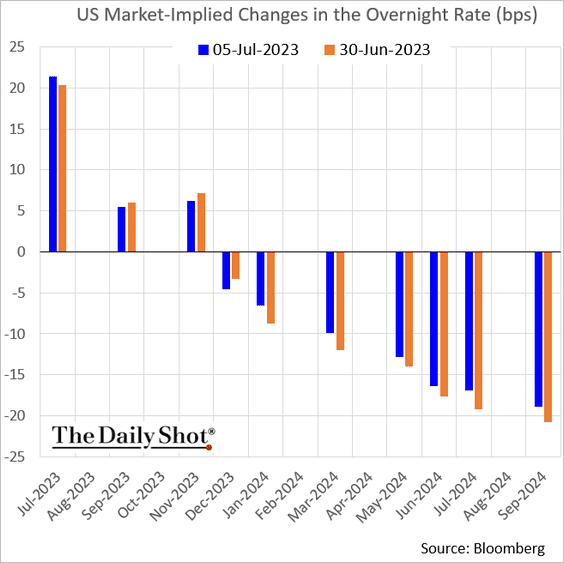
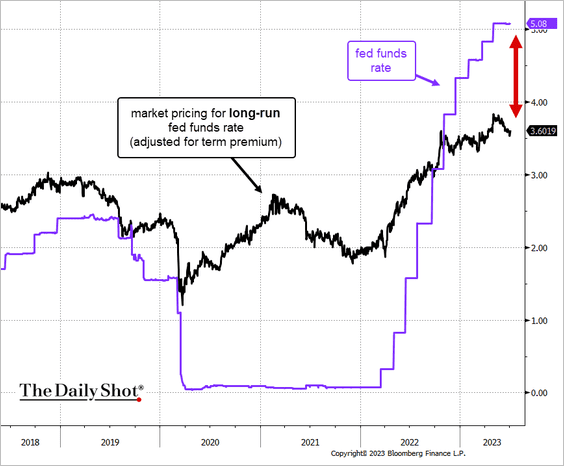
• Based on market pricing, the monetary policy is already fairly restrictive.
 Source: @TheTerminal, Bloomberg Finance L.P.
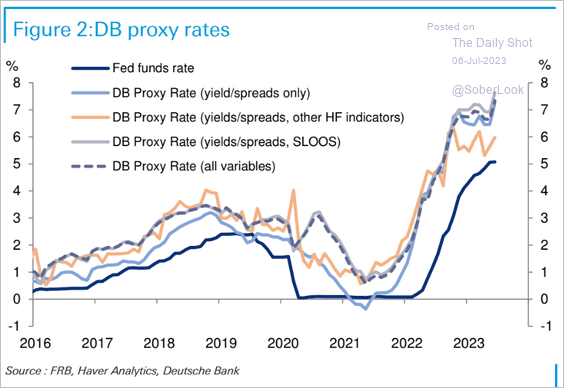
Deutsche Bank’s proxy rates indicate that the Fed’s policy is more restrictive than the fed funds rate suggests.
 Source: Deutsche Bank Research
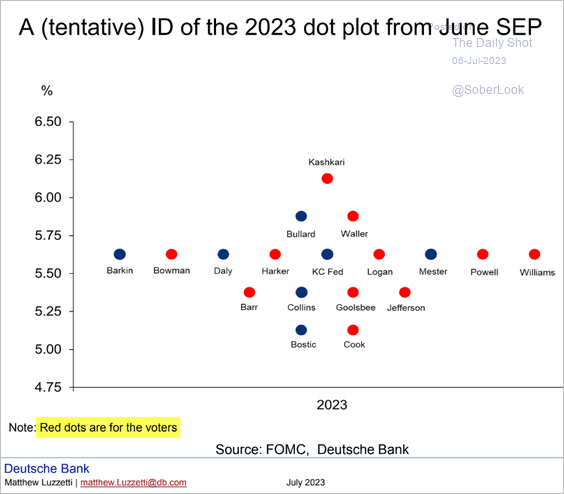
• By the way, who owns the dots in the 2023 (year-end) dot-plot?
 Source: Deutsche Bank Research
——————–
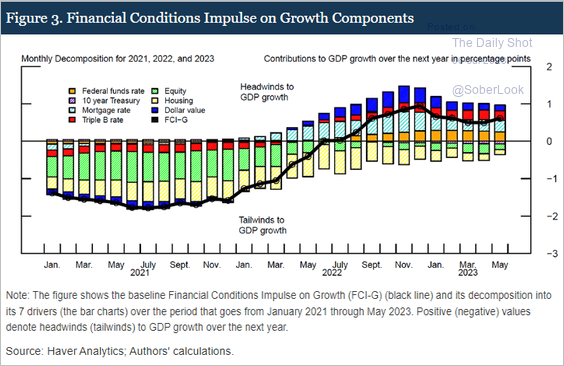
2. The Fed’s indicator continues to signal tight financial conditions (2 charts).
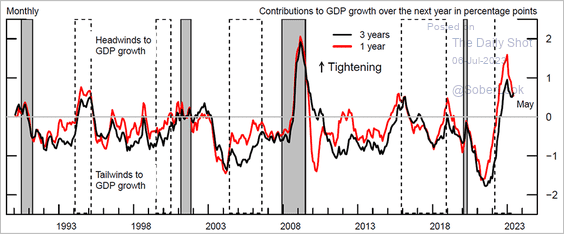 Source: The Federal Reserve Read full article
 Source: The Federal Reserve Read full article
——————–
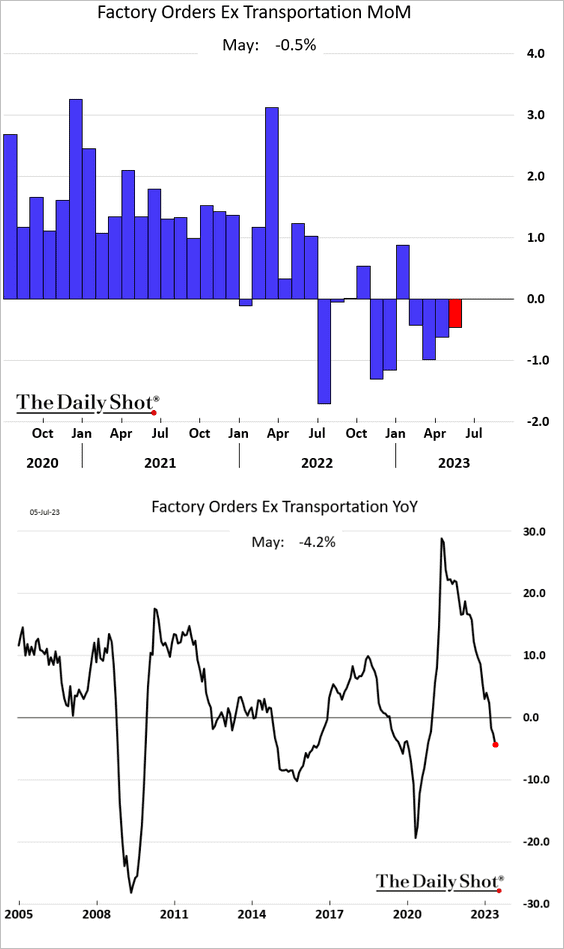
3. Factory orders softened further in May.
 Source: Reuters Read full article
——————–
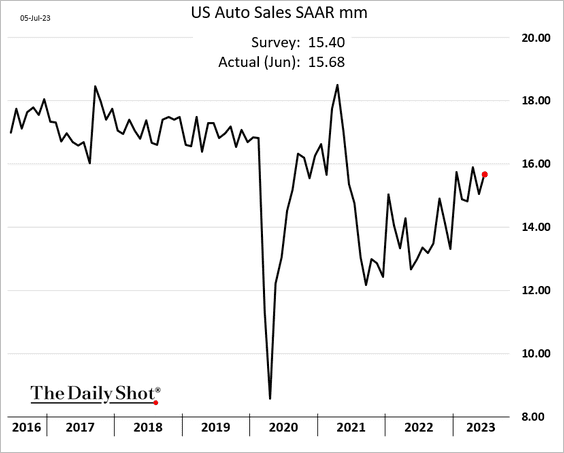
4. Automobile sales increased in June.
 Source: Reuters Read full article
——————–
5. Debit and credit card spending has been slowing.
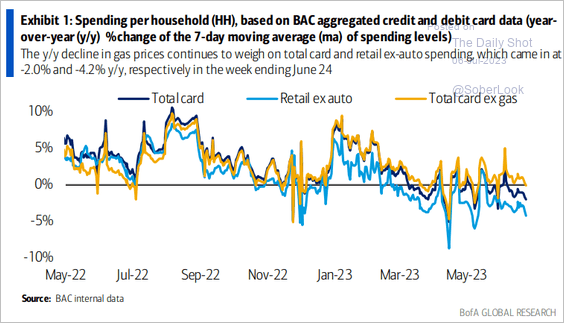 Source: BofA Global Research; @MikeZaccardi
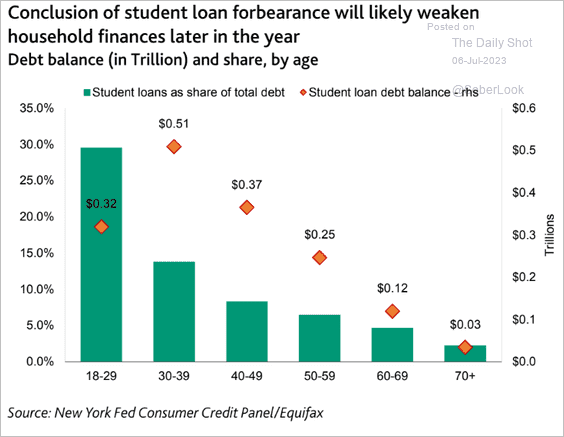
The end of student loan forbearance will put further pressure on household finances later this year.
 Source: Moody’s Investors Service
——————–
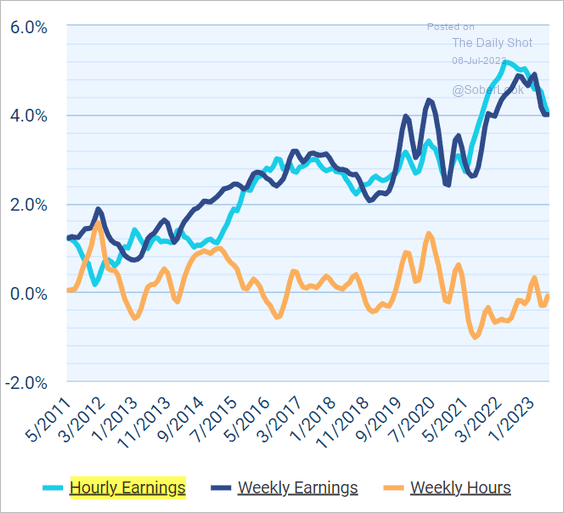
6. Small business wage growth has slowed but remains elevated.
 Source: Paychex. IHS Markit
7. There are more short-term rentals than homes for sale.
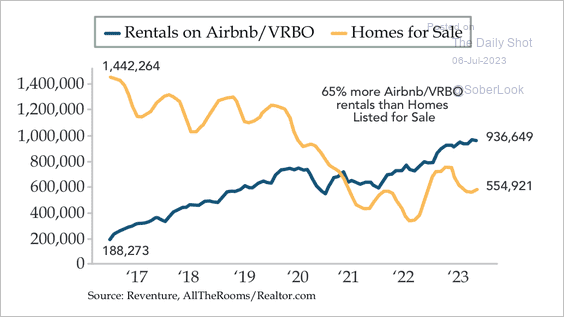 Source: Quill Intelligence
Back to Index
The United Kingdom
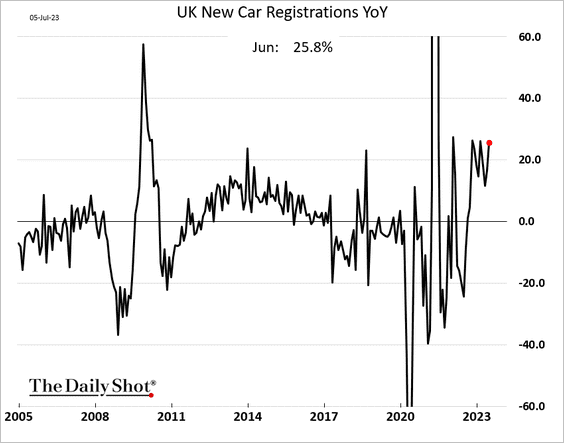
1. Automobile sales are rebounding.
2. Real household disposable income fell in Q1.
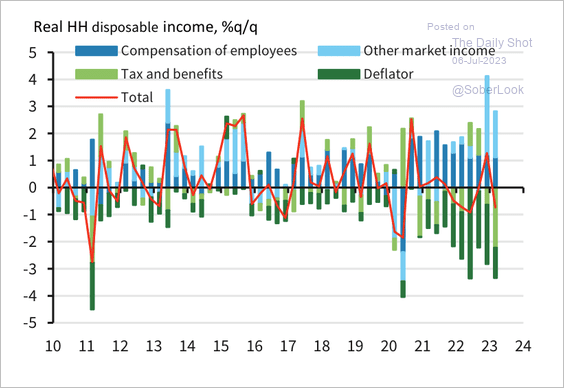 Source: Barclays Research
• Households are starting to utilize savings, evidenced by liquid deposit outflows last month.
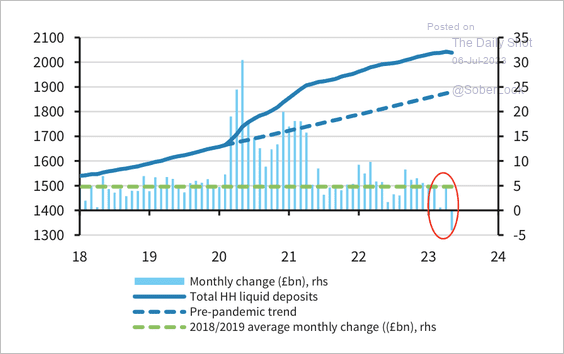 Source: Barclays Research
——————–
3. The PMI report points to sharply lower core services CPI ahead.
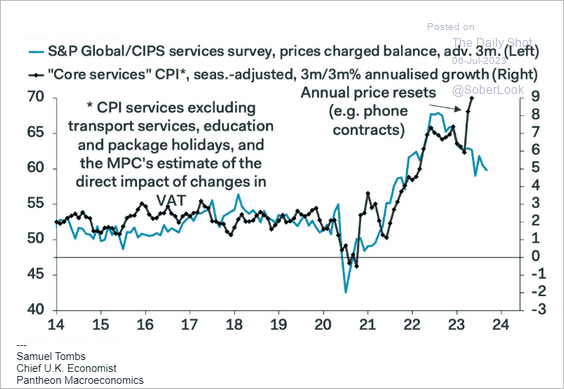 Source: Pantheon Macroeconomics
Back to Index
The Eurozone
1. Inflation has been slowing, …
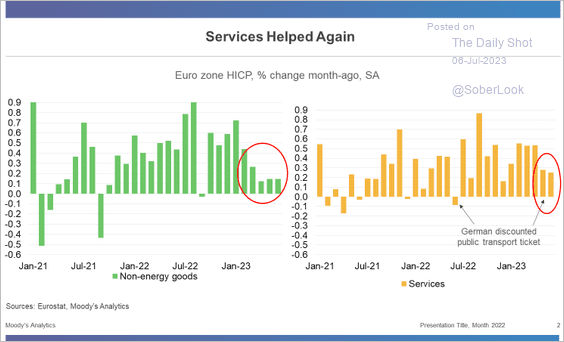 Source: Moody’s Analytics
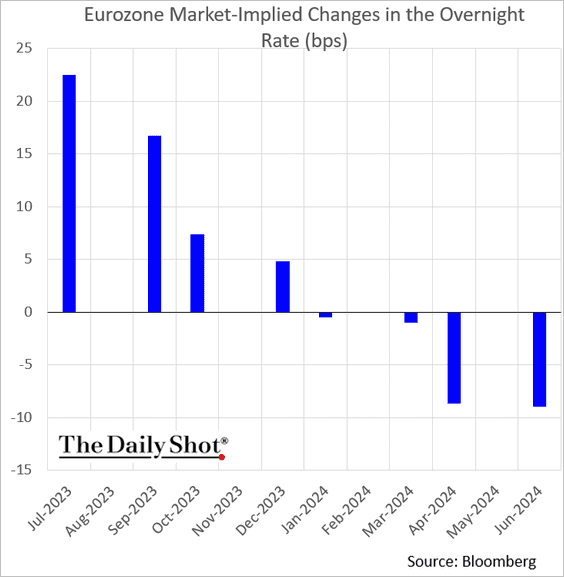
… but the markets are still pricing in at least two more ECB rate hikes.
——————–
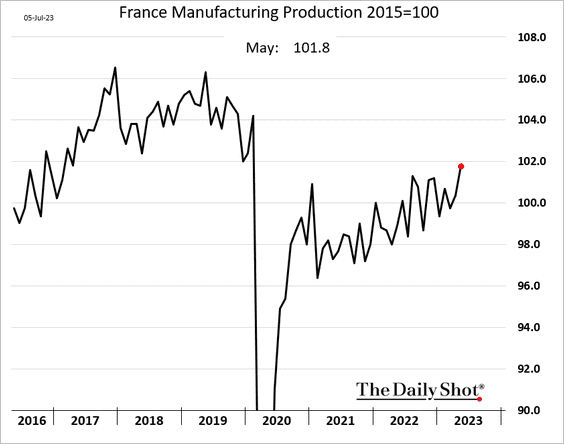
2. French manufacturing output is rebounding to pre-COVID levels.
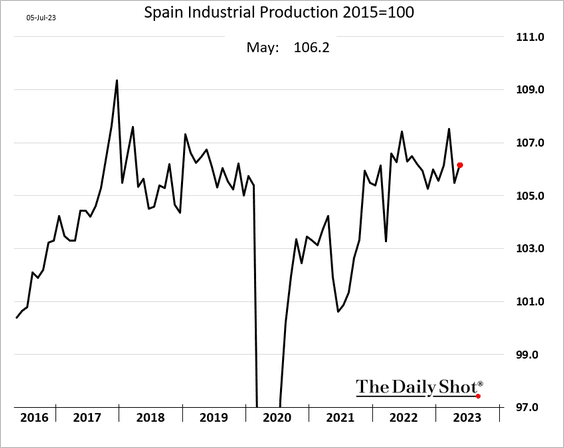
3. Spain’s industrial production improved in May.
4. Euro-area service sector growth slowed sharply in June (2 charts), …
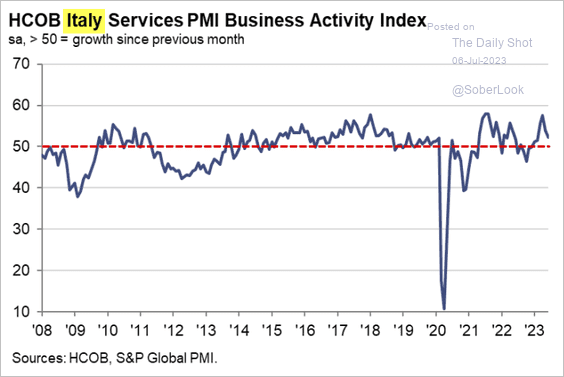 Source: S&P Global PMI
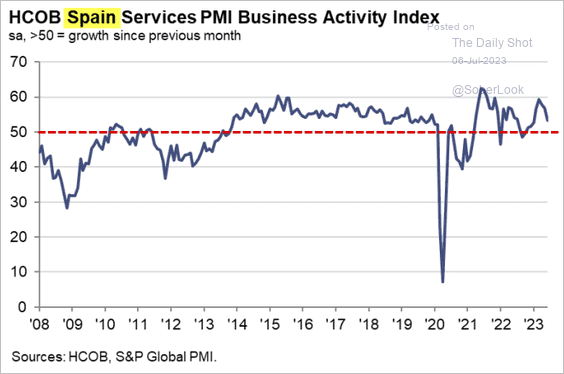 Source: S&P Global PMI
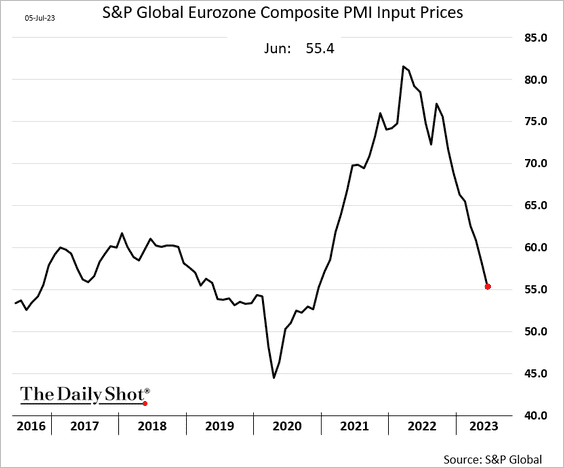
… lowering the composite PMI (2 charts).
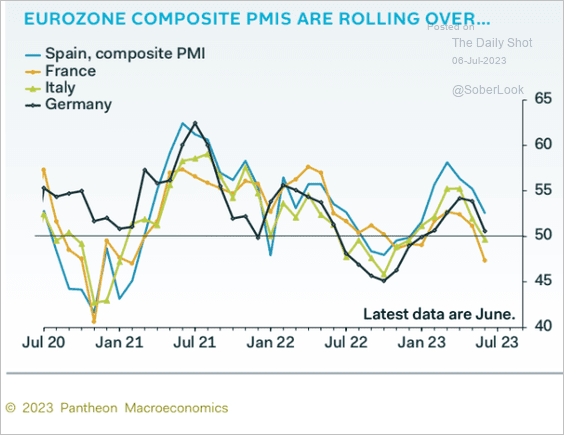 Source: Pantheon Macroeconomics
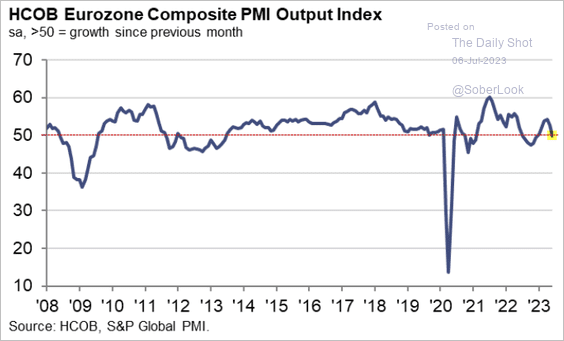 Source: S&P Global PMI
Price pressures continue to ease.
——————–
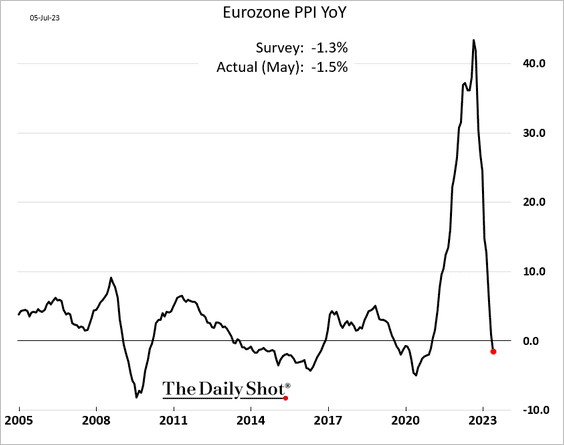
5. The Eurozone PPI is in negative territory on a year-over-year basis.
6. Spain’s tourist spending is running above pre-COVID levels.
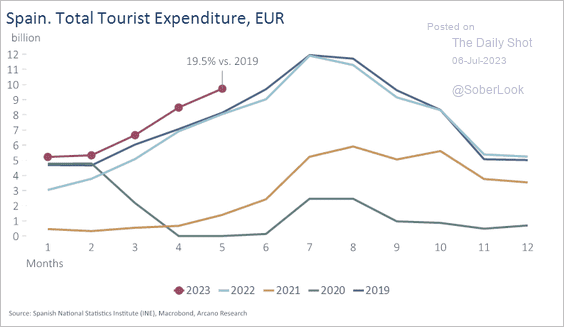 Source: Arcano Economics
Back to Index
Europe
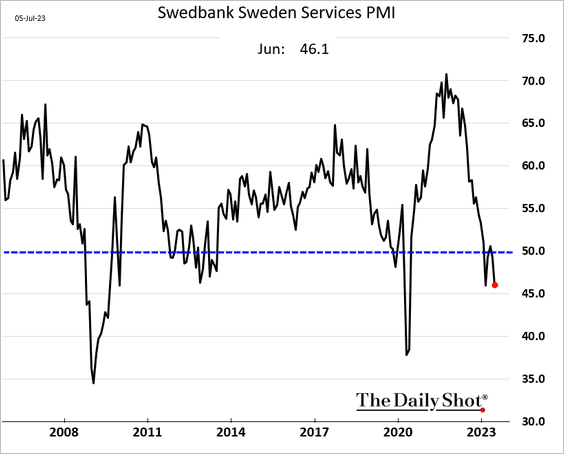
1. Sweden’s services PMI is in recessionary territory.
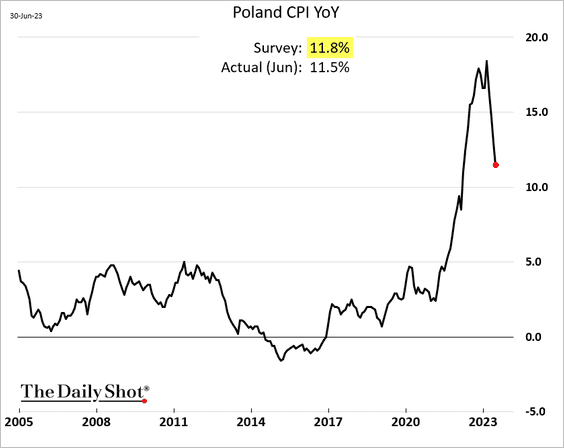
2. Poland’s CPI is dropping sharply.
3. Here is a look at house prices and rents.
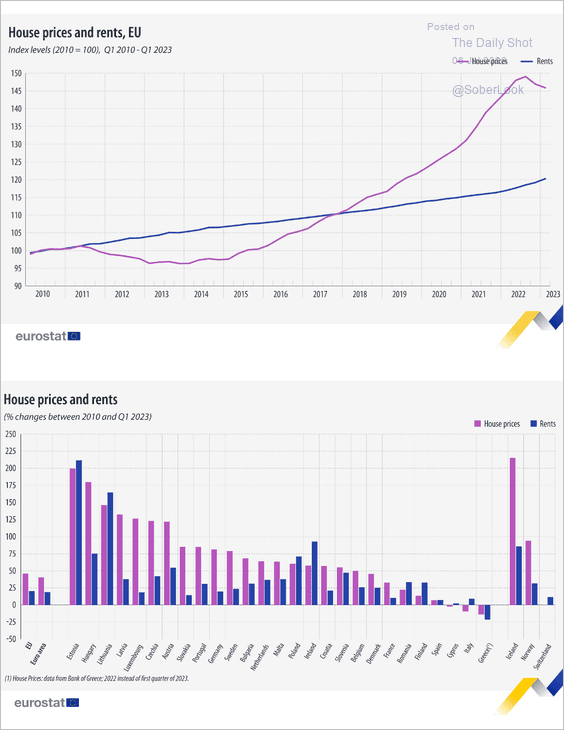 Source: Eurostat Read full article
Back to Index
Asia-Pacific
1. The number of foreign workers in Japan has been climbing.
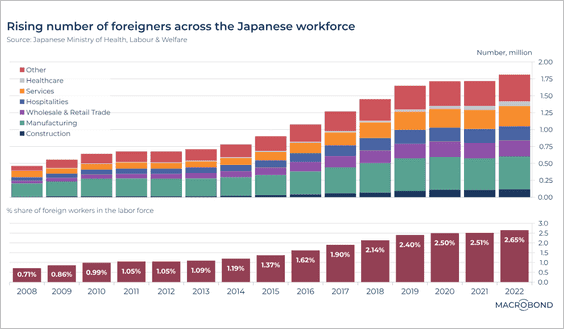 Source: Macrobond
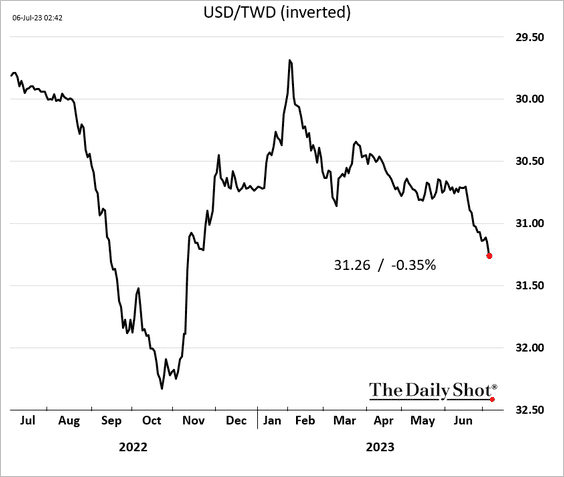
2. The Taiwan dollar continues to sink.
Back to Index
China
1. Property developers are under pressure again.
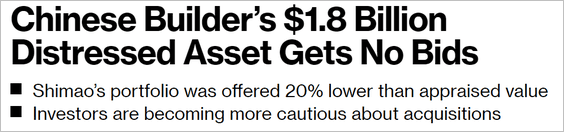 Source: @markets Read full article
This chart shows Sino-Ocean’s dollar bonds.
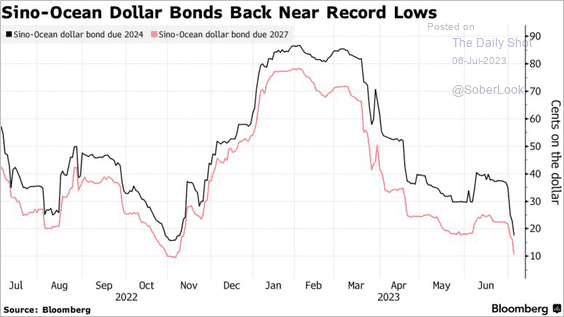 Source: @markets Read full article
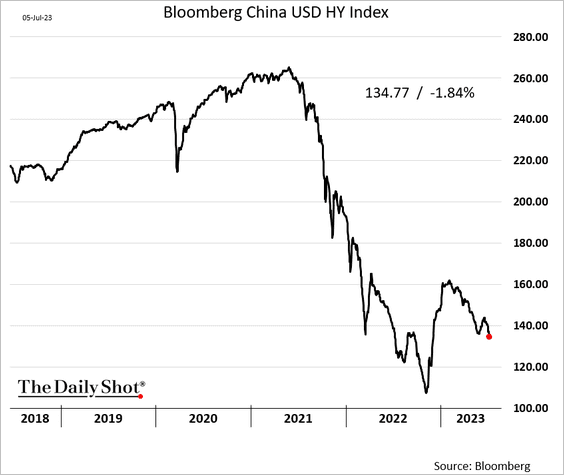
And here is the overall USD-denominated high-yield index (price).
——————–
2. Shares are dropping in Hong Kong, pulled down by financials.
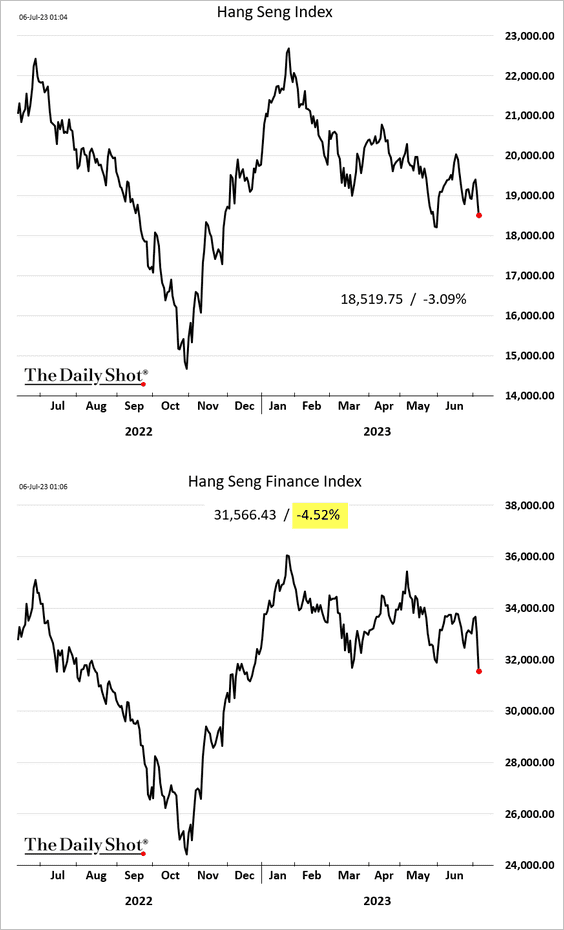
• China’s stocks have underperformed global peers (2 charts).
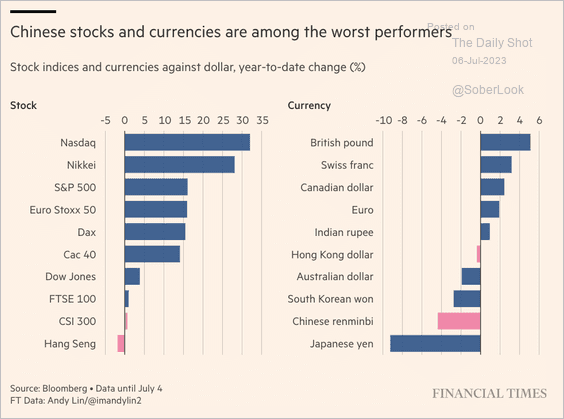 Source: @financialtimes Read full article
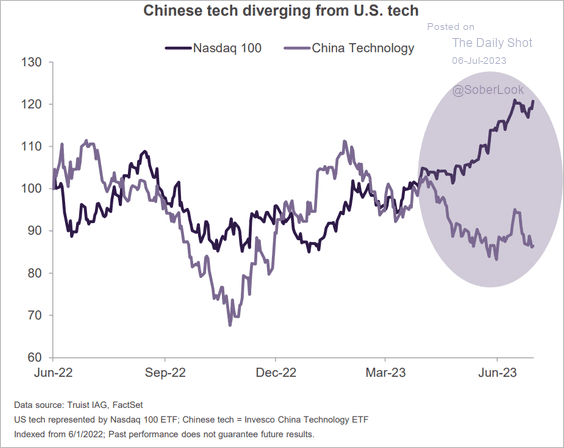 Source: Truist Advisory Services
——————–
3. Hiring has risen at the fastest pace in almost three years, especially in the service sector. (2 charts)
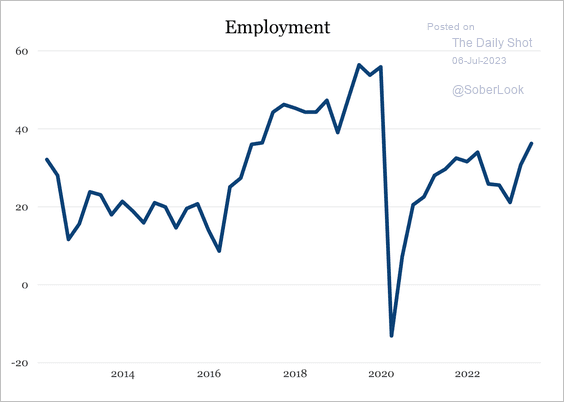 Source: China Beige Book
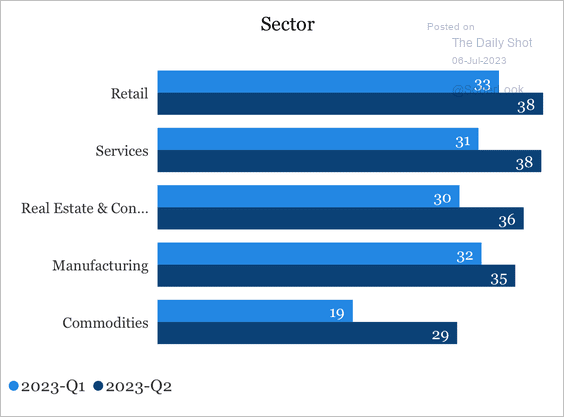 Source: China Beige Book
——————–
4. The US and EU dominate China’s export markets.
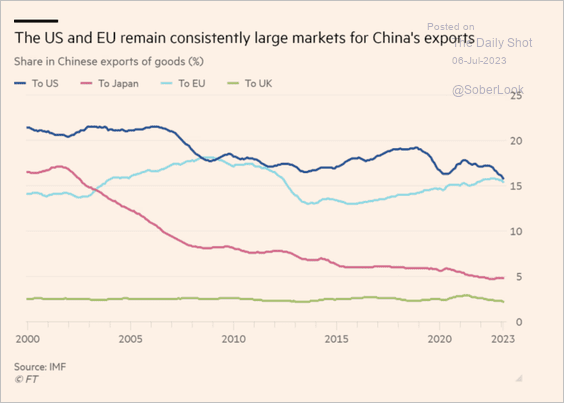 Source: @financialtimes Read full article
Back to Index
Emerging Markets
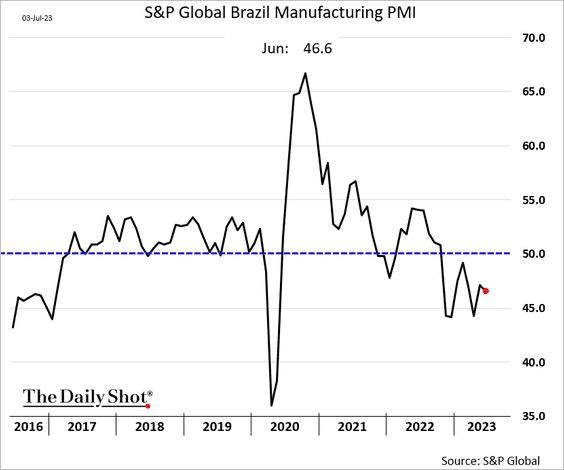
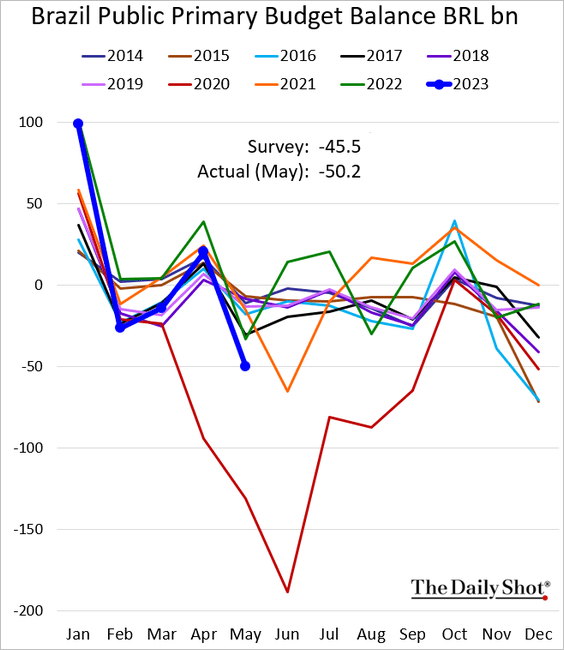
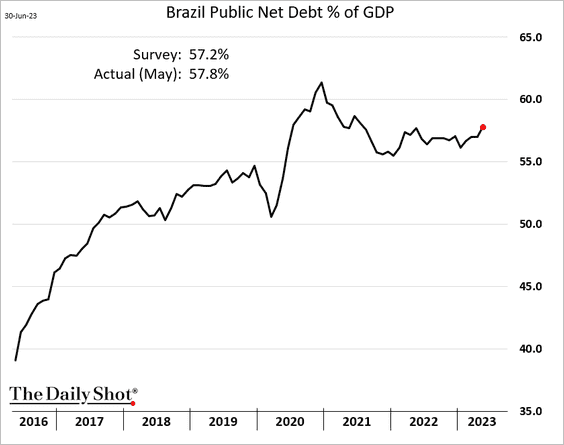
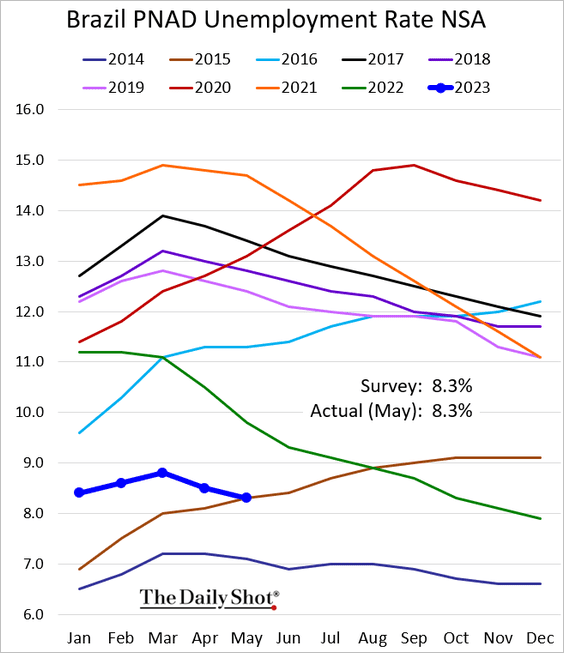
1. Let’s begin with Brazil.
• Manufacturing PMI (contraction continues):
• Services PMI (still in growth territory):
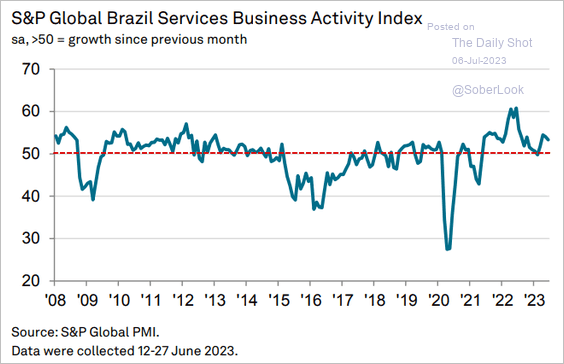 Source: S&P Global PMI
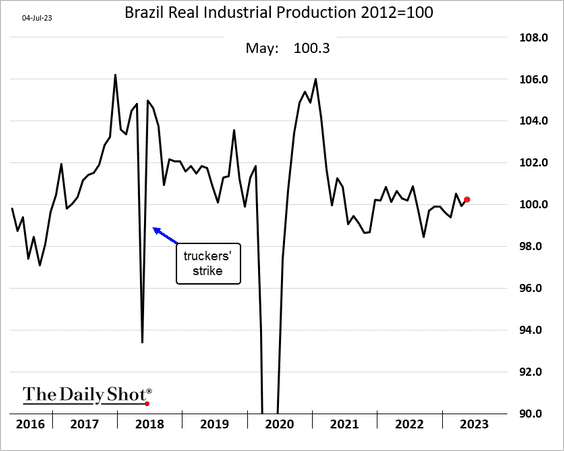
• Industrial production (stronger in May):
• Government budget (deteriorating):
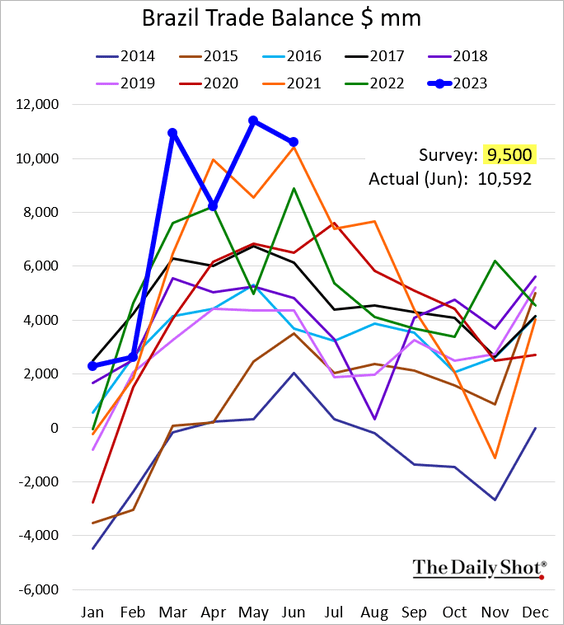
• Trade surplus (still strong):
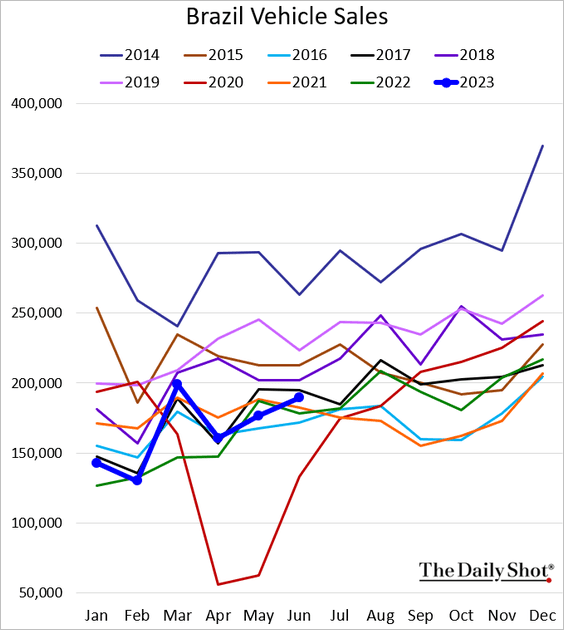
• Vehicle sales (rebounding):
• Unemployment:
——————–
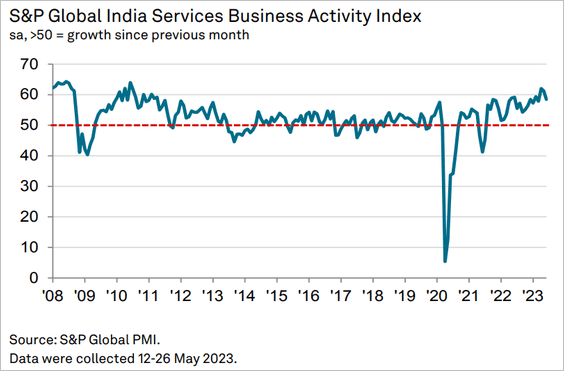
2. India’s services growth remains robust.
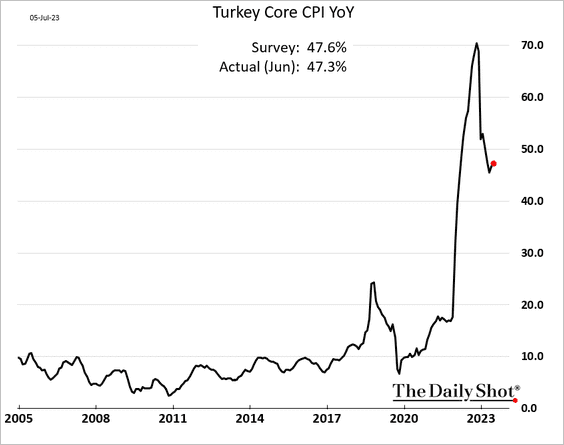
3. Turkey’s core inflation is still above 47%.
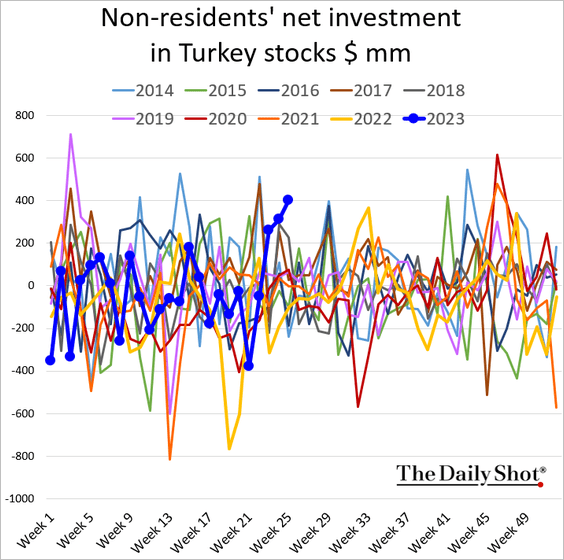
Foreigners have been buying Turkish stocks.
——————–
4. This chart shows inflation changes since the end of 2022.
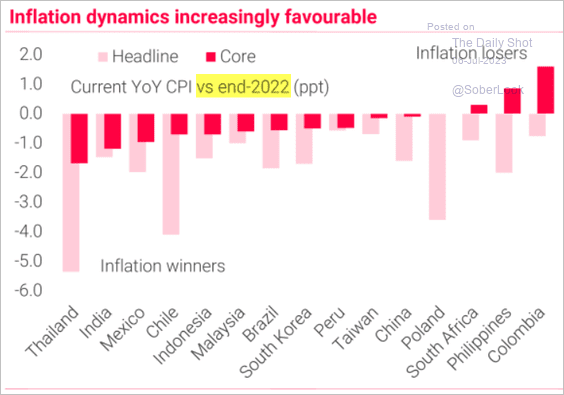 Source: TS Lombard
Back to Index
Commodities
1. The gold/silver ratio is above its long-term average.
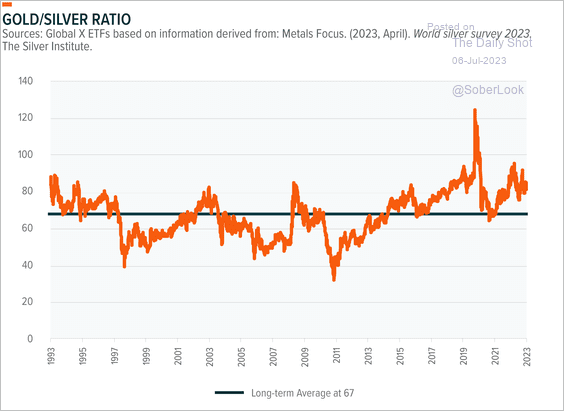 Source: Global X ETFs Read full article
• Global demand for silver significantly outpaced supply last year.
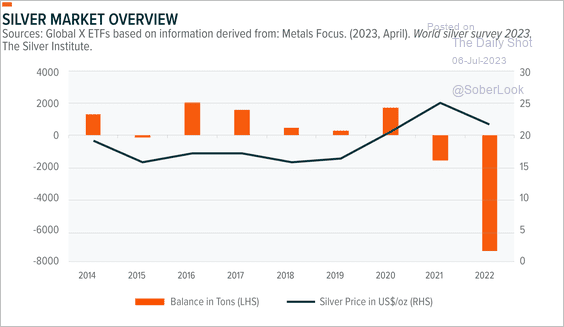 Source: Global X ETFs Read full article
——————–
2. US intermodal grain shipments have slowed sharply.
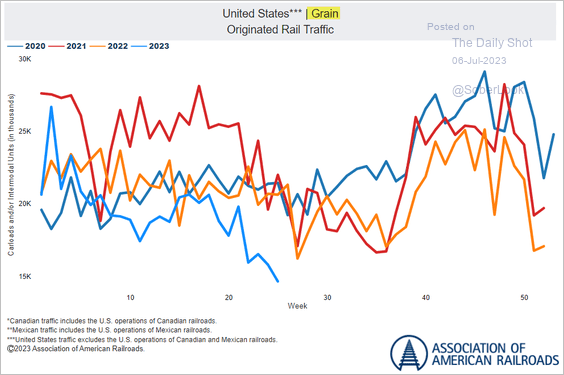 Source: AAR
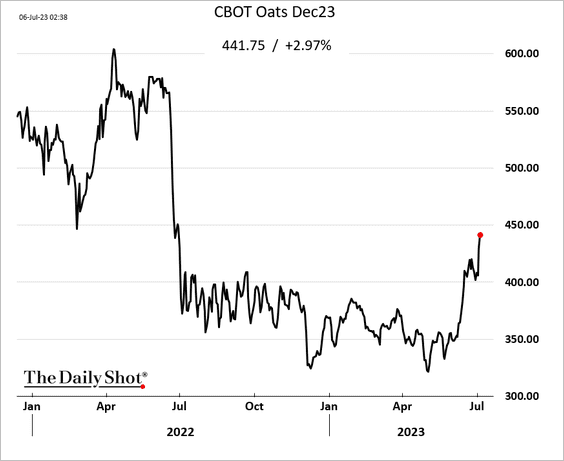
3. Oats prices are rebounding.
Back to Index
Energy
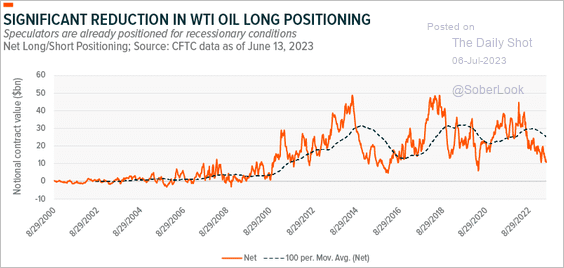
1. Speculators have become less optimistic on the WTI oil futures market. Net long/short positioning is below its long-term average, similar to previous troughs.
 Source: Global X ETFs Read full article
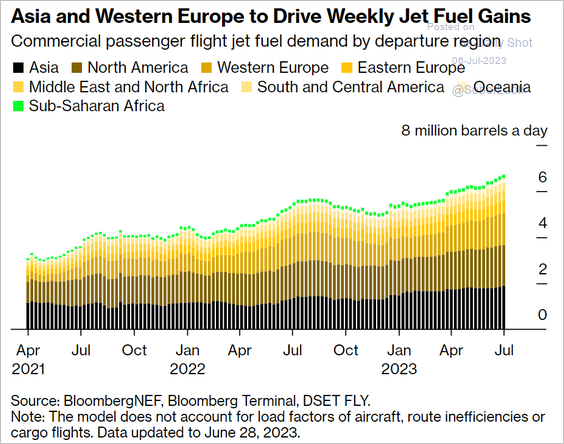
2. Global jet fuel demand continues to climb.
 Source: @crowleykev, @markets Read full article
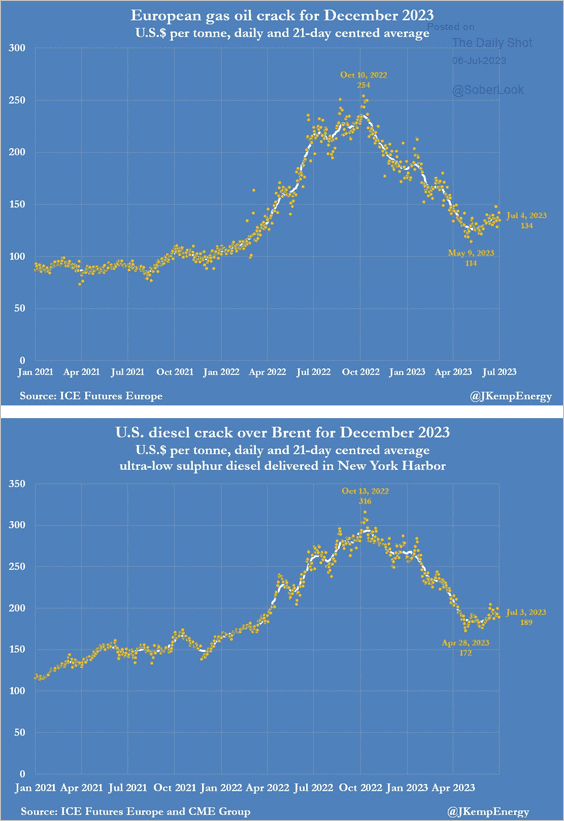
3. Are distillates’ crack spreads rebounding?
 Source: @JKempEnergy
Back to Index
Equities
1. The S&P 500 traded around the low end of its average pre-recession range. Performance typically flattens 6-12 months before a recession begins.
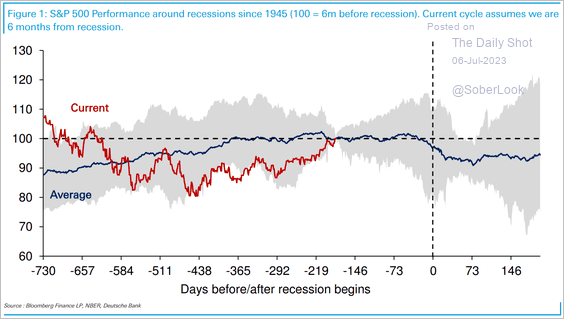 Source: Deutsche Bank Research
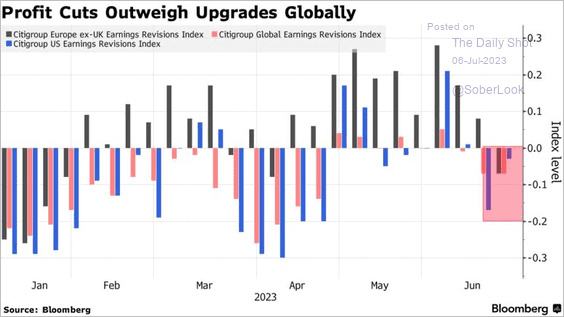
2. Earnings downgrades have been outpacing upgrades.
 Source: @markets, @JPBarnert, @ksengal Read full article
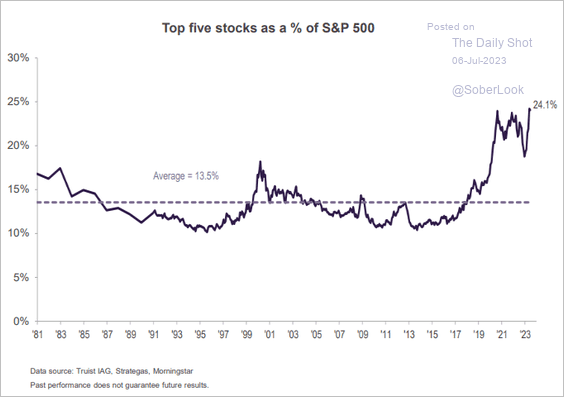
3. The S&P 500 is very concentrated.
 Source: Truist Advisory Services
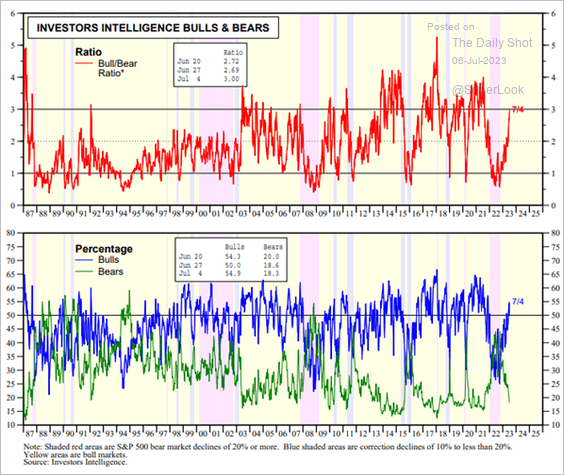
4. Retail investors are increasingly bullish.
 Source: Yardeni Research
5. The S&P 500 has diverged from global central bank liquidity.
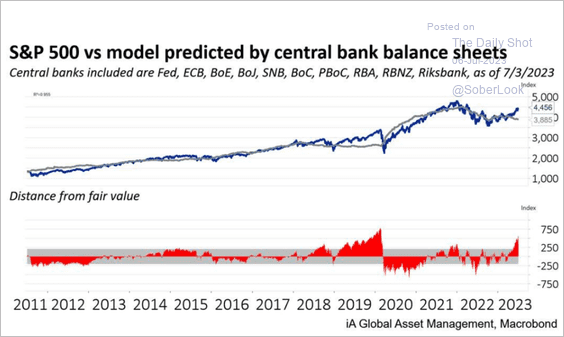 Source: iA Global Asset Management
6. Trading volumes have lagged 2022 levels.
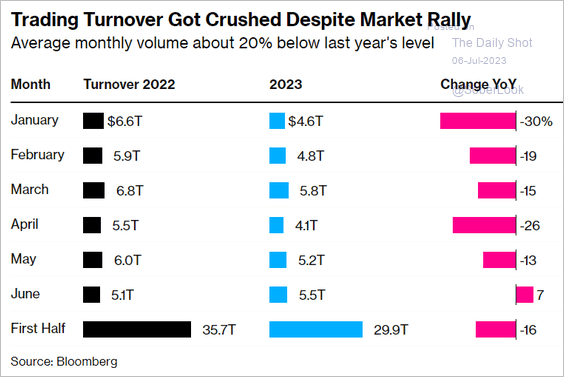 Source: @markets, @JPBarnert, @ksengal Read full article
7. Next, we have detailed equity factor performance in June.
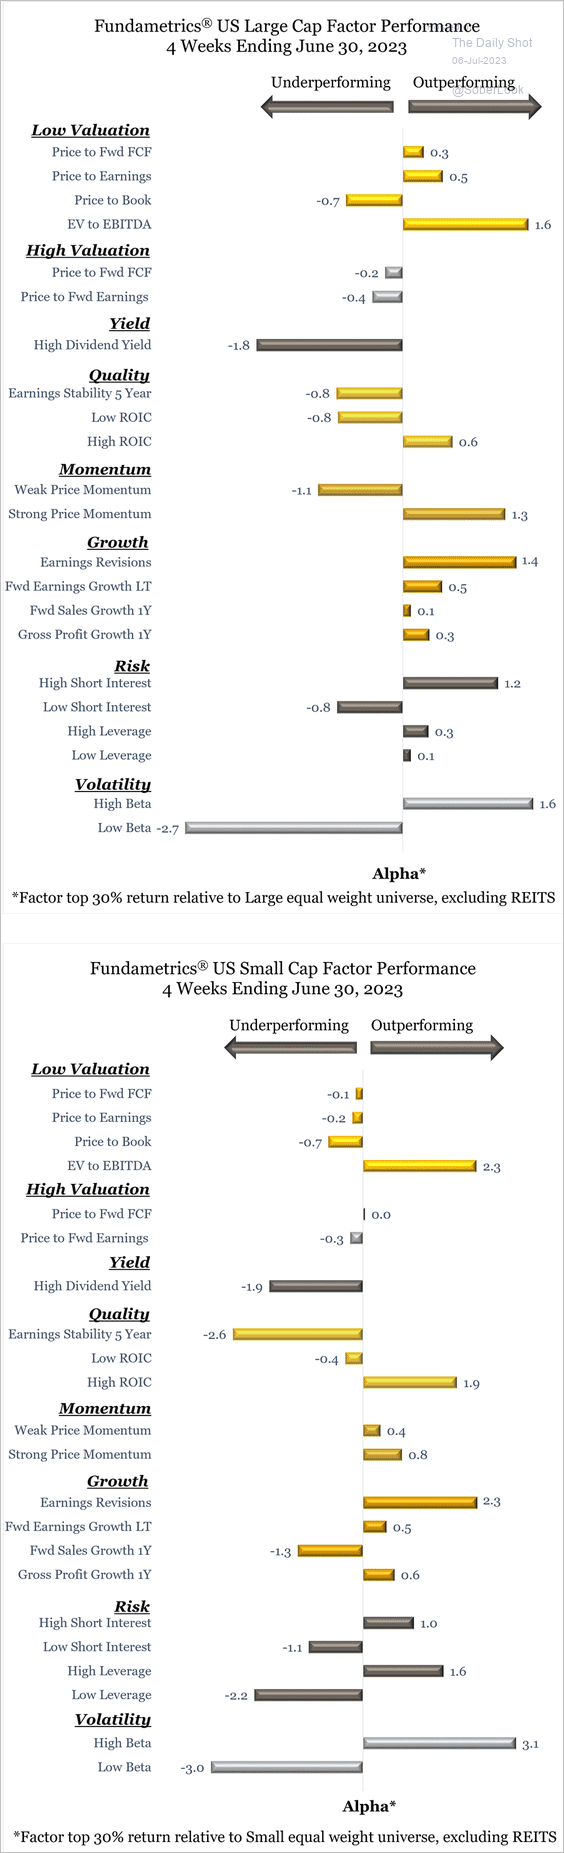 Source: CornerCap Institutional
8. Share buyback announcements have slowed.
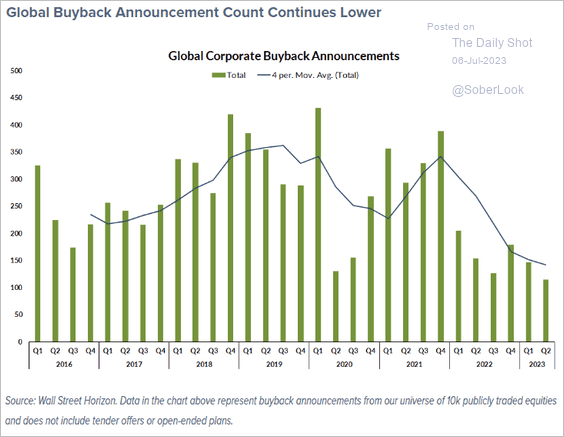 Source: @FactSet Read full article
9. Why have mid- and small-cap indices underperformed?
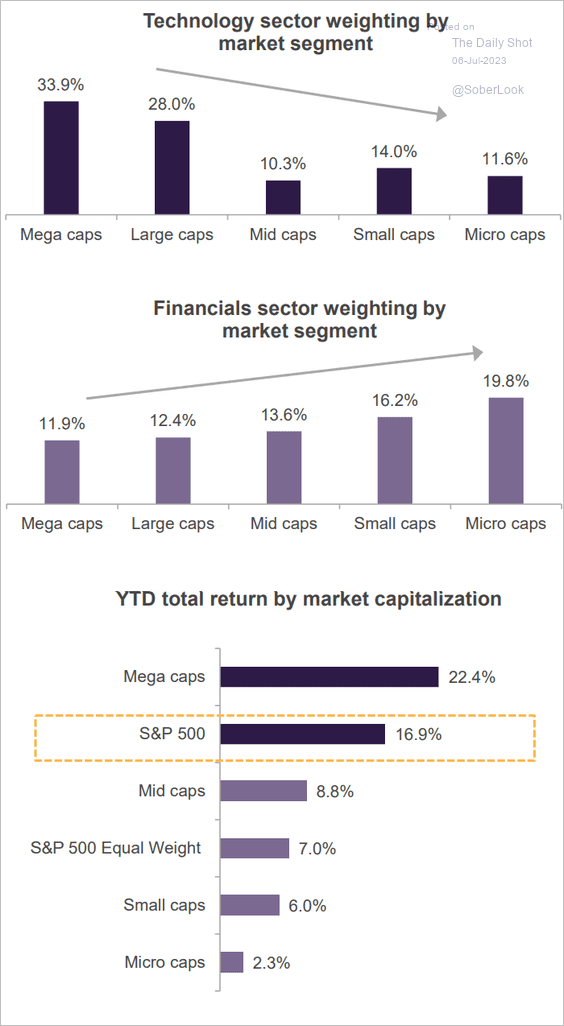 Source: Truist Advisory Services
Back to Index
Credit
1. Here is the evolution of cumulative loss rates in CLOs and CMBS.
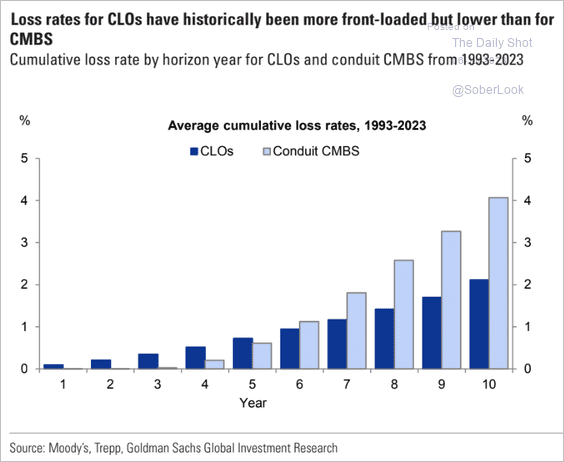 Source: Goldman Sachs
2. Next, we have subprime auto ABS issuance.
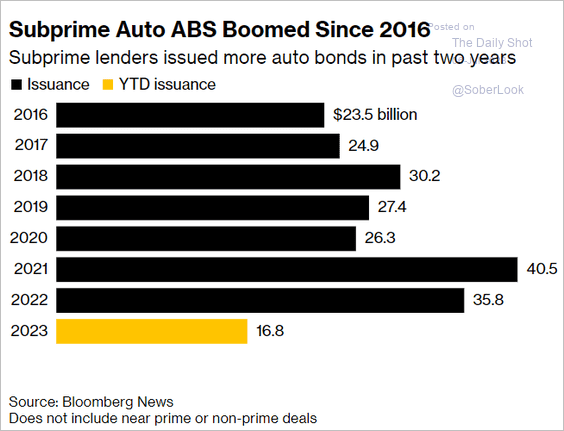 Source: @ArroyoNieto, @markets Read full article
3. Office property prices remain under pressure, which is a headwind for regional and small banks.
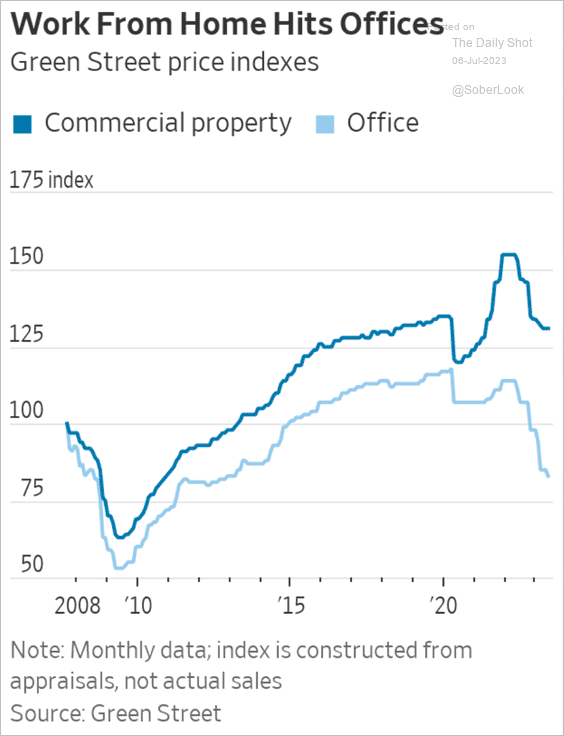 Source: @WSJ Read full article
4. This map depicts state tax revenue growth in the current fiscal year.
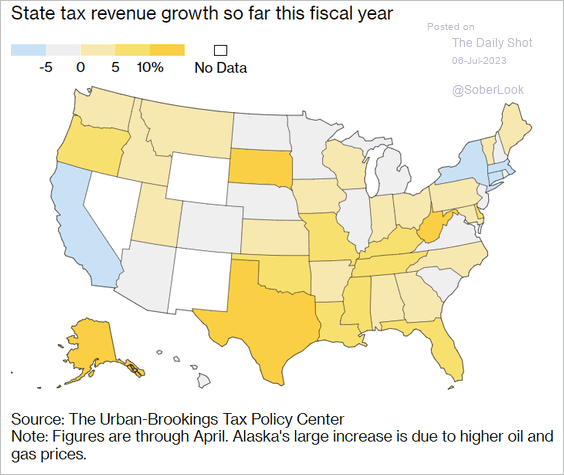 Source: Bloomberg Tax Read full article
Back to Index
Global Developments
1. The surge in trade as a share of global GDP has plateaued since the financial crisis.
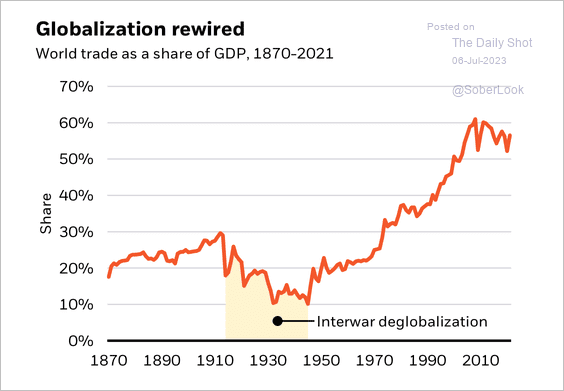 Source: BlackRock Investment Institute
• Advanced economies have steadily diversified their sources of imports.
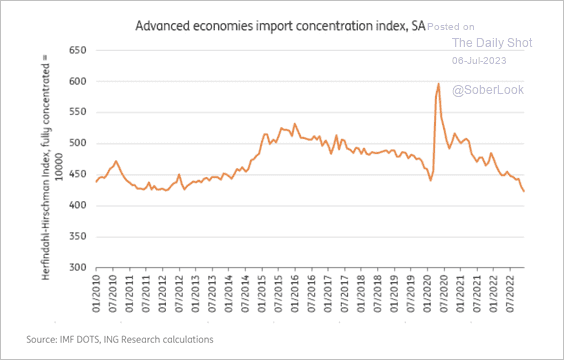 Source: ING
——————–
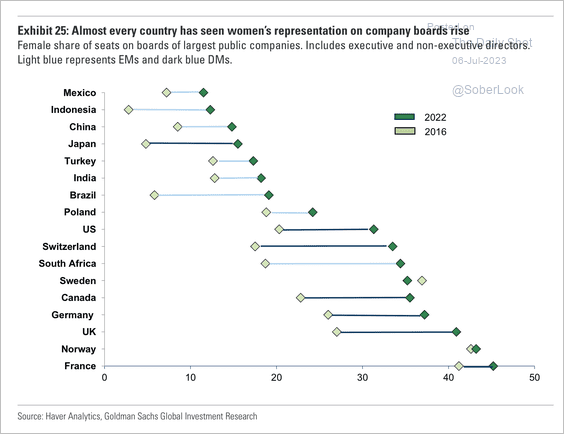
2. The female labor force participation rate has increased across developed and emerging markets over the last 15 years.
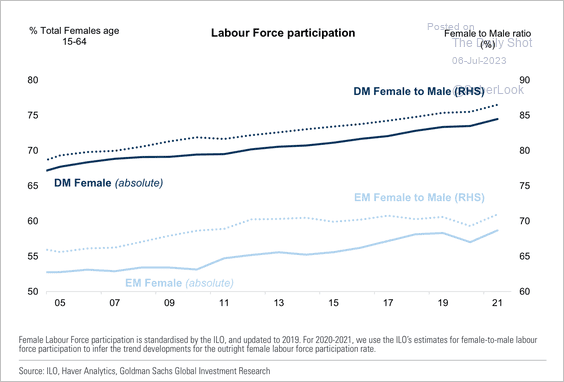 Source: Goldman Sachs
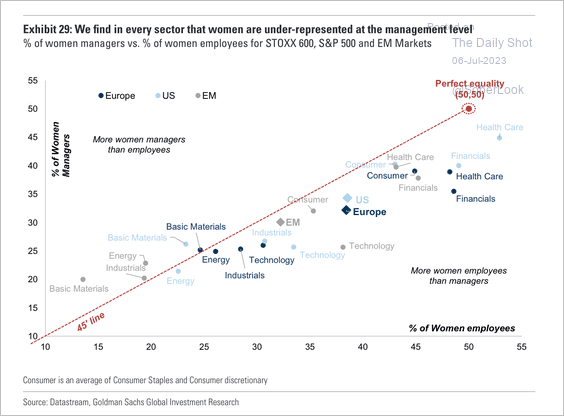
Women are increasingly represented on boards, although more work is needed across leadership positions. (2 charts)
 Source: Goldman Sachs
 Source: Goldman Sachs
——————–
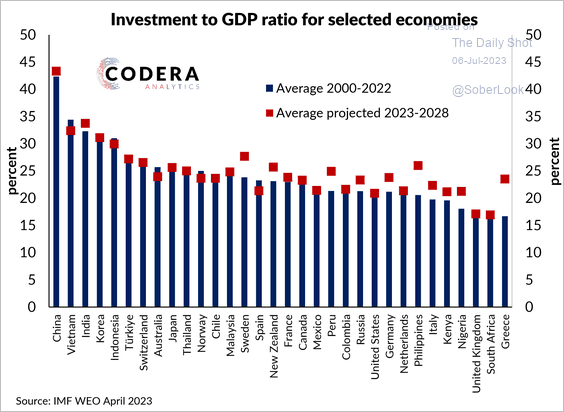
3. Here is a look at investment rates for selected countries.
 Source: Codera Analytics
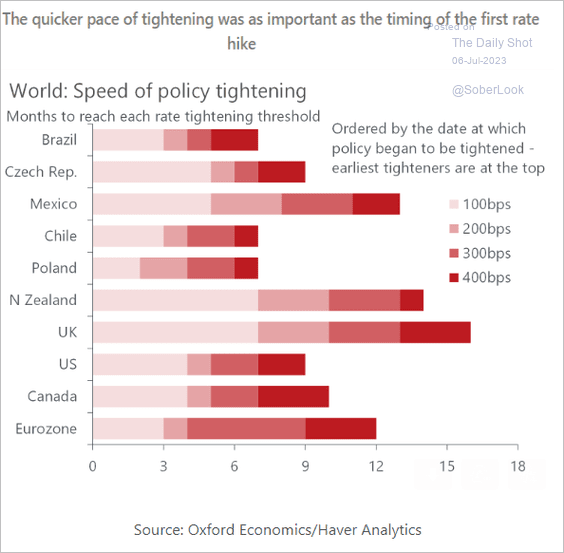
4. This chart shows the pace of policy tightening in several economies.
 Source: Oxford Economics
——————–
Food for Thought
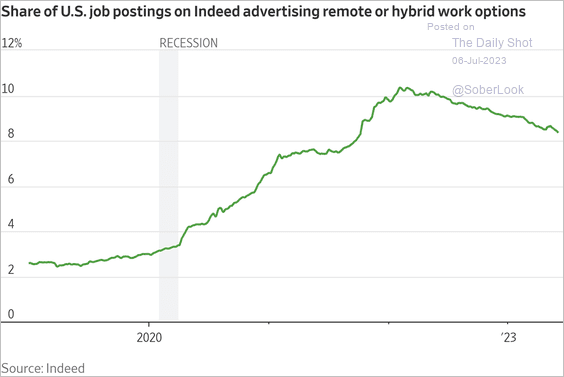
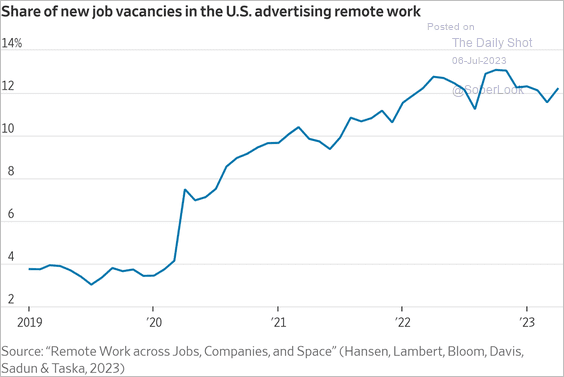
1. Remote or hybrid work postings on Indeed:
 Source: @WSJ Read full article
• The percentage of job postings advertising remote work:
 Source: @WSJ Read full article
——————–
2. Number of transistors per microprocessor:
![]() Source: Alpine Macro
Source: Alpine Macro
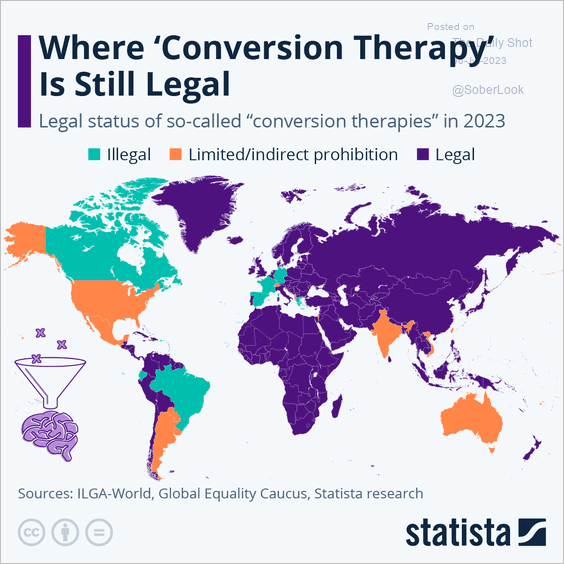
3. Legal status of “conversion therapy”:
 Source: Statista
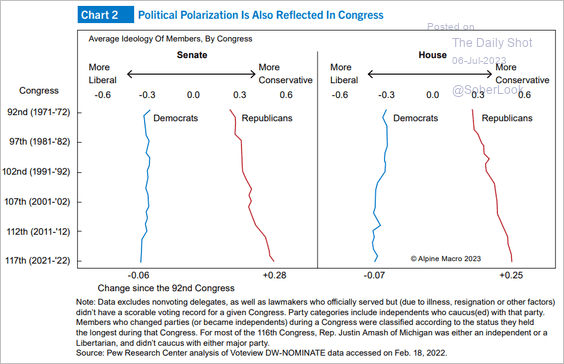
4. Congressional polarization over time:
 Source: Alpine Macro
5. Cities visited by Republican presidential candidates since February:
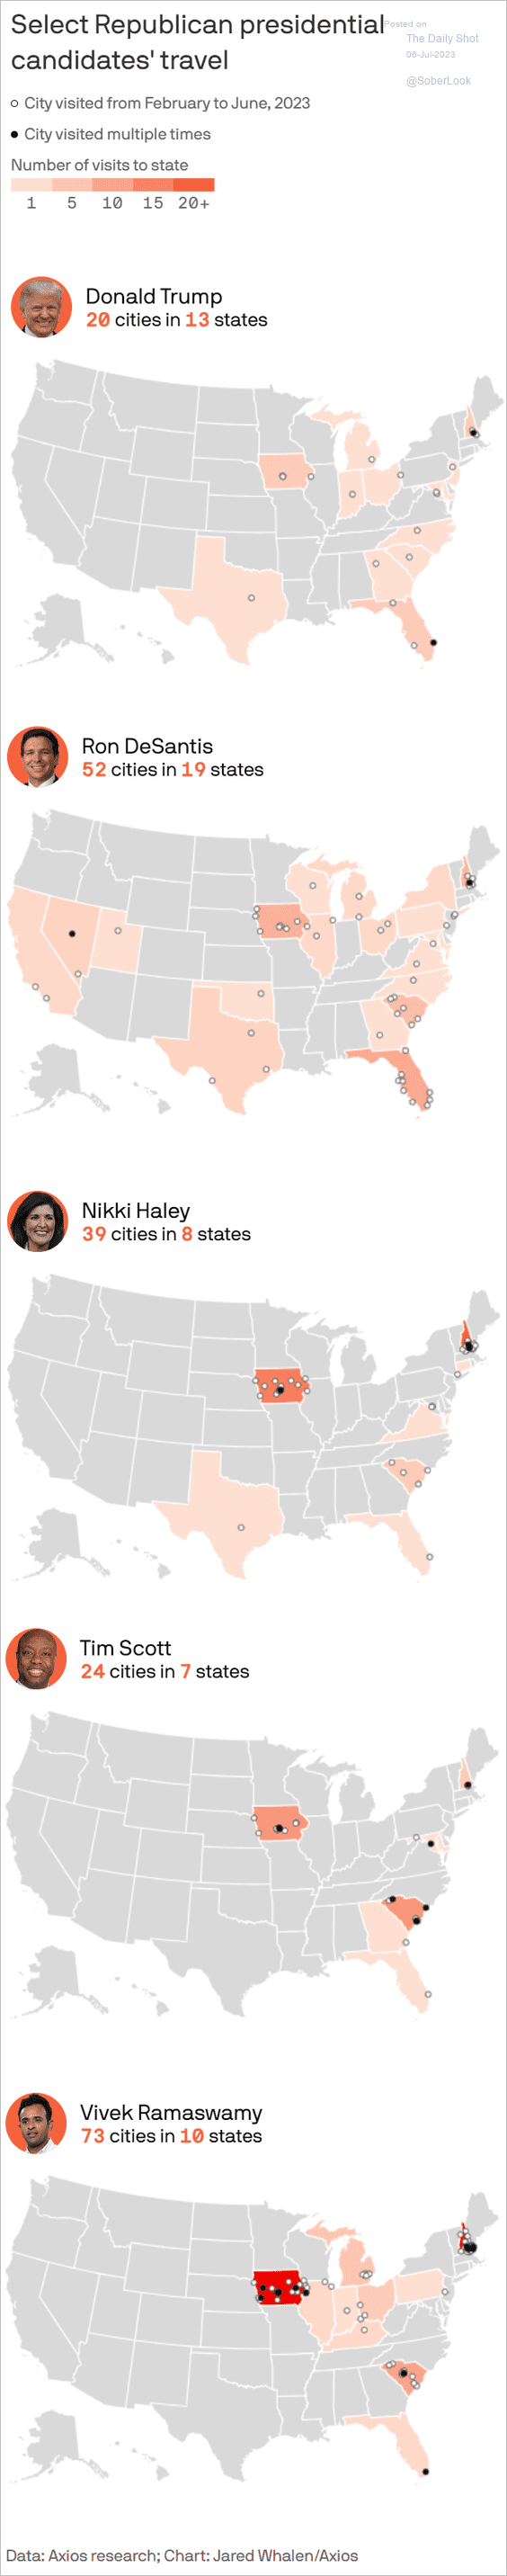 Source: @axios Read full article
6. World consumption of coal:
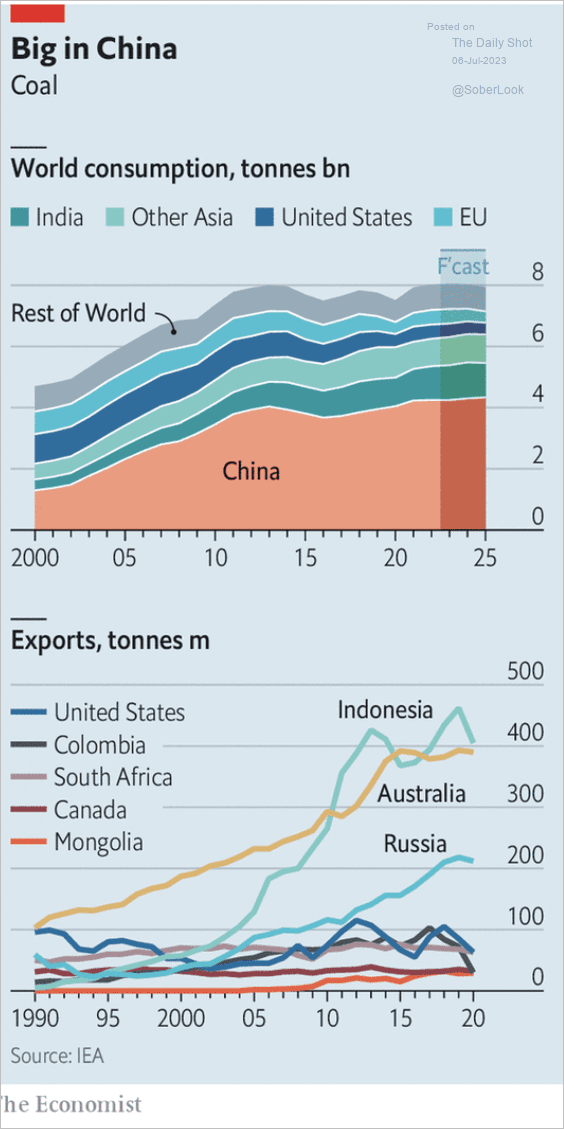 Source: The Economist Read full article
7. A toasty start of July:
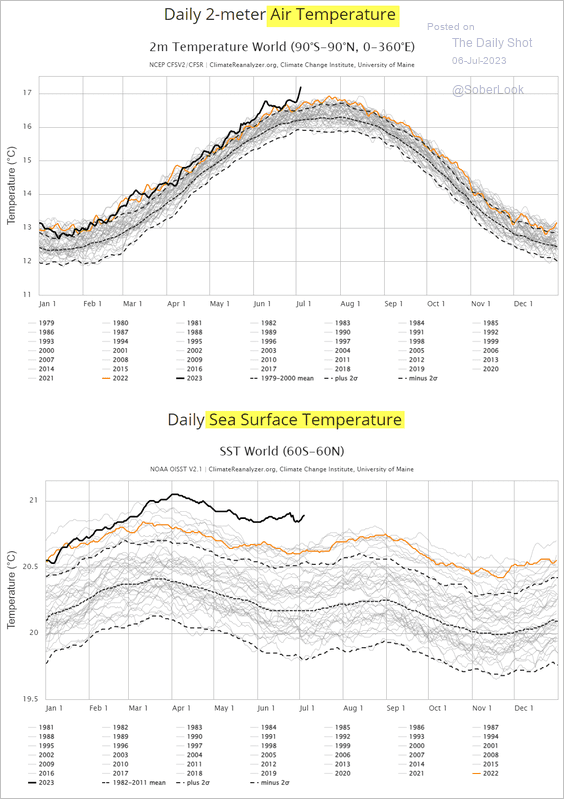 Source: Climate Reanalyzer Read full article
8. NYPD car chases:
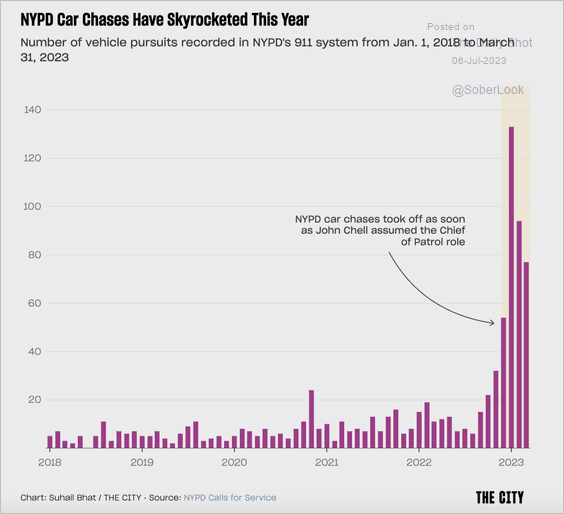 Source: @THECITYNY Read full article
——————–
Back to Index