
The Daily Shot: 07-Jul-23
• Administrative Update
• The United States
• Canada
• The United Kingdom
• The Eurozone
• Asia-Pacific
• China
• Emerging Markets
• Cryptocurrency
• Energy
• Equities
• Rates
• Global Developments
• Food for Thought
Administrative Update
1. As a reminder, redistributing The Daily Shot within your organization violates our terms and conditions. Please note that for most publishers, newsletters are a promotion of their business, but The Daily Shot letter is our business. If you are interested in a group subscription, please email Lisa at [email protected]. Corporate pricing is available here.
2. Aggressive corporate spam filters occasionally block The Daily Shot, sometimes unpredictably. More information on addressing this issue is available here.
3. Gmail truncates The Daily Shot due to its length (you will see this message at the bottom of the page: “[Message clipped] View entire message”). The easiest way to address this issue is to click “View in your browser” at the very top of the newsletter.
Back to Index
The United States
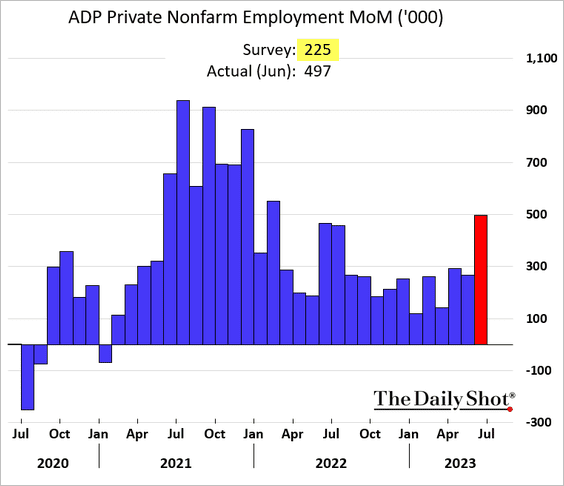
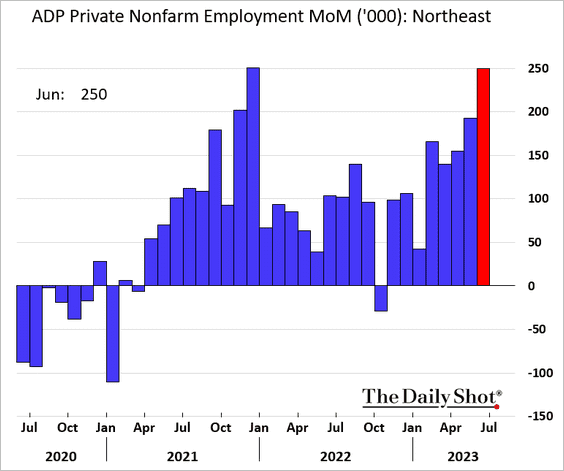
1. The June ADP private payrolls report was remarkably strong, suggesting that the labor market has withstood the Fed’s rate hikes with limited impact.
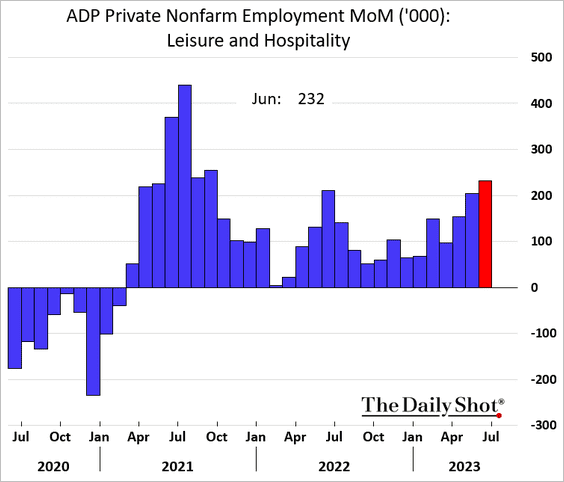
– Hotels and restaurants have accelerated hiring.
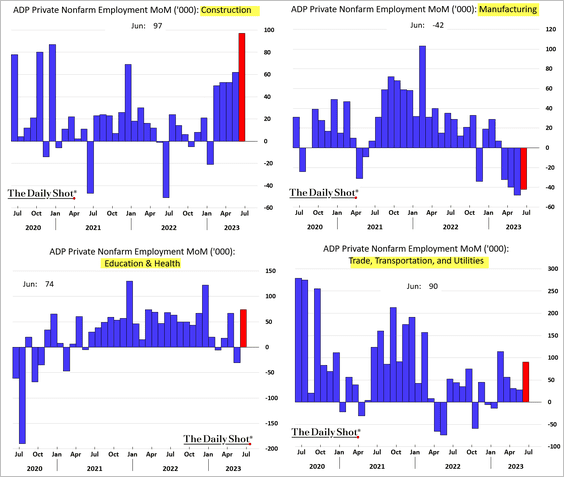
– While factories continue to reduce staff, construction, healthcare, and logistics sectors boosted hiring in June.
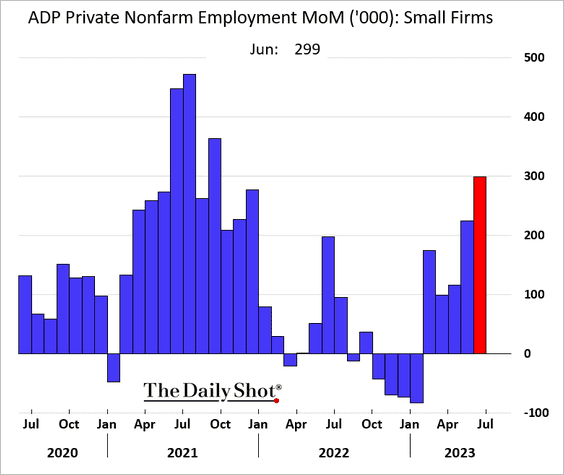
– Small and mid-size businesses accelerated hiring.
– Northeast job gains were particularly strong.
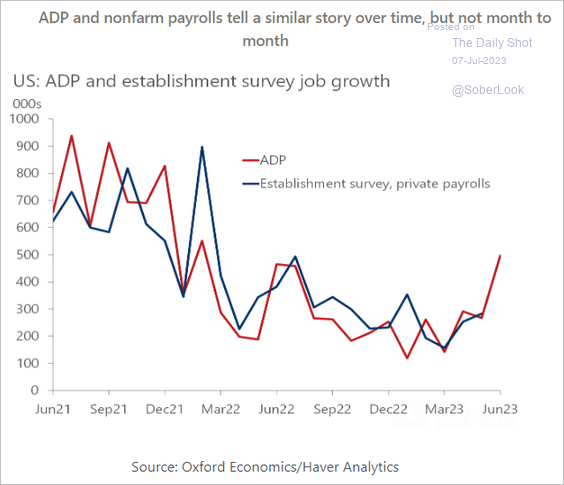
• While the ADP index is not well correlated to the official nonfarm payrolls (Establishment Survey) on a monthly basis, the trends tend to converge over time.
 Source: Oxford Economics
• Treasury yields surged as the Fed struggles to loosen the labor market, with the 2-year rising above 5%.
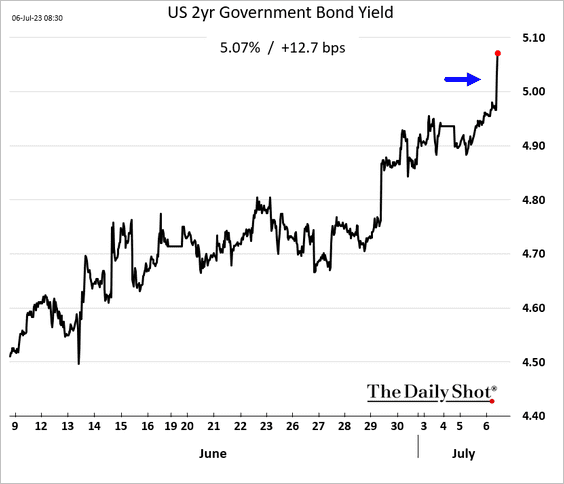
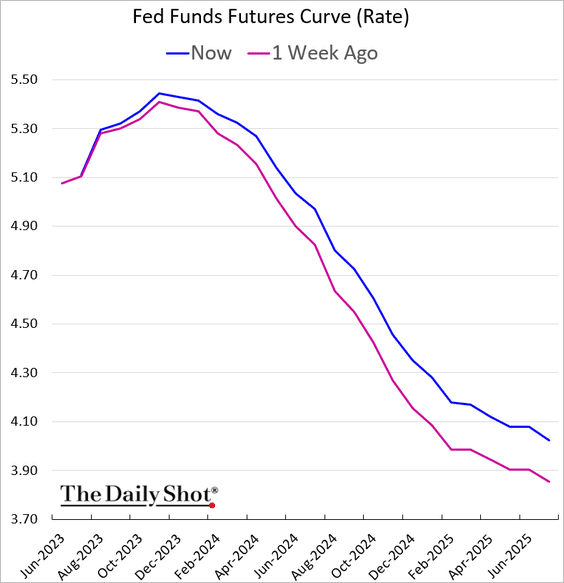
The terminal rate is nearing 5.5%, and the expected pace of rate cuts eased further.
——————–
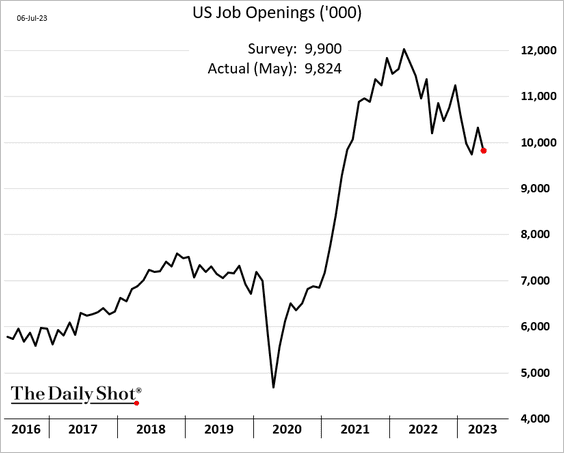
2. Adding fuel to the fire, the job openings report continues to show labor market tightness.
This chart shows the drivers of the June decline in job openings.
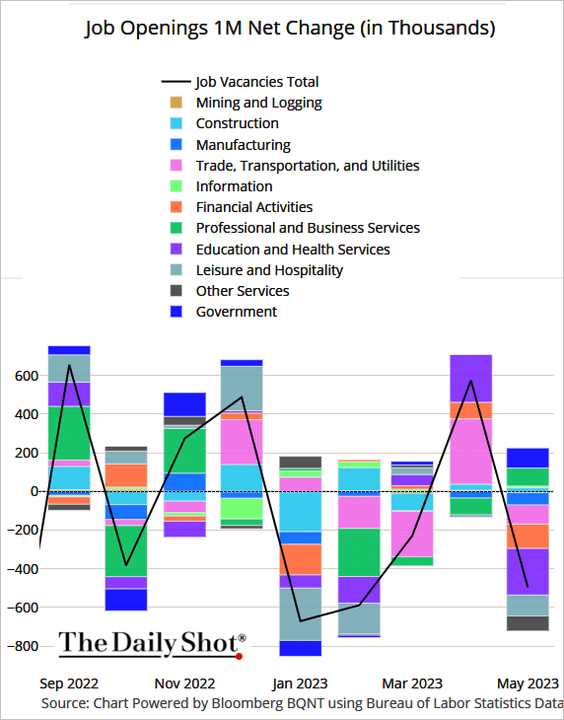 Source: @TheTerminal, Bloomberg Finance L.P.
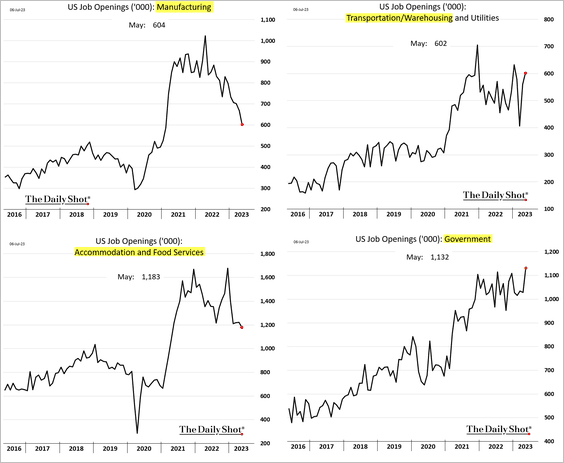
• Here are some vacancy trends by sector. Job openings in logistics (transportation/warehousing) increased again. Government job openings hit a record high, exacerbating competition for labor.
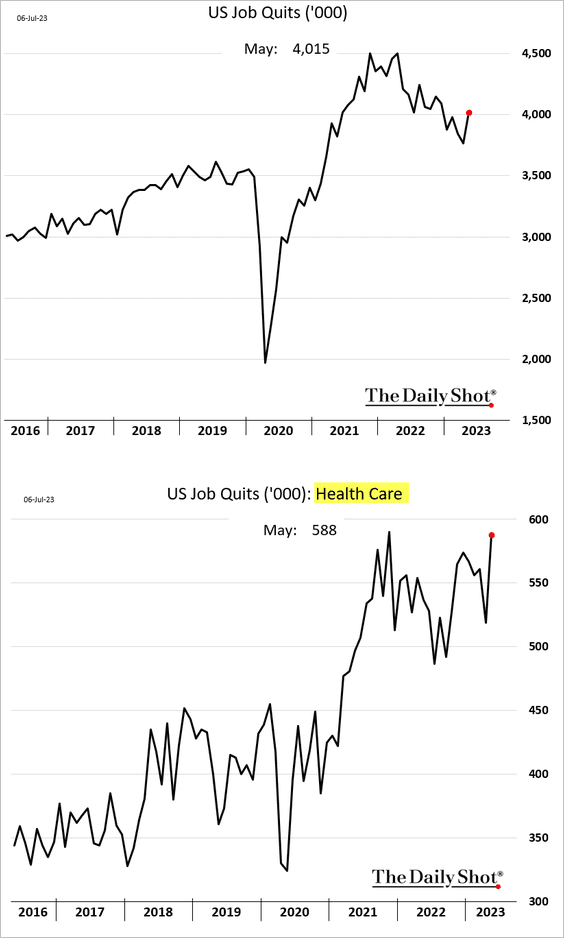
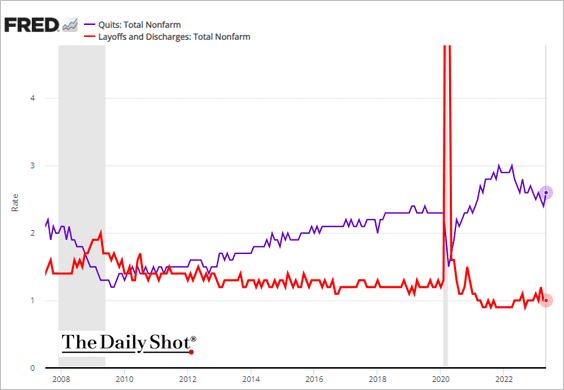
• Voluntary resignations jumped, suggesting that workers are confident in the labor market strength.
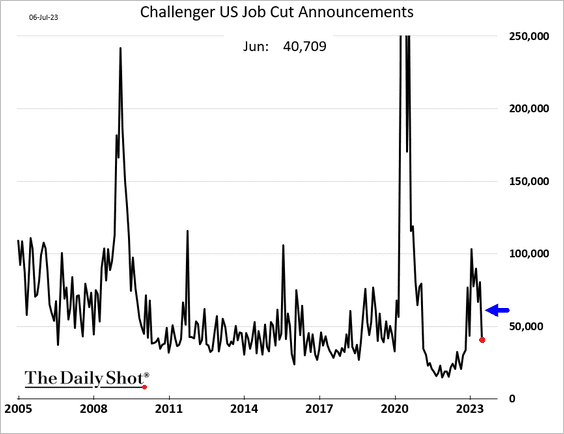
• A separate report shows a sharp decline in job cut announcements.
This chart shows quit and layoff rates.
• We are still looking at 1.6 job openings per unemployed worker, which signals persistent labor market imbalances.
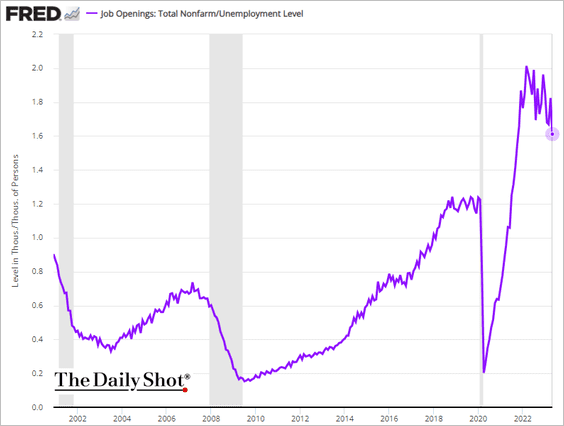
– The factors contributing to labor shortages during the COVID era, like increased retirement rates and restricted immigration, remain unresolved.
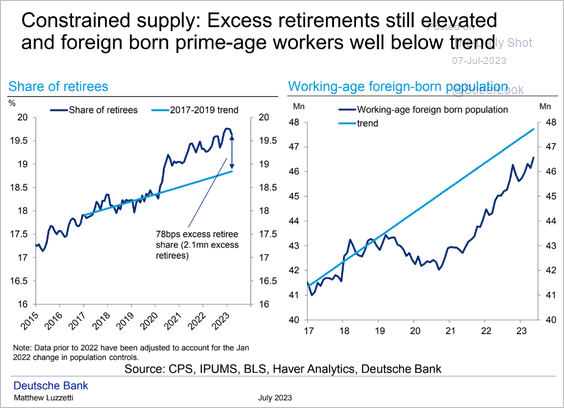 Source: Deutsche Bank Research
• Here is the Beveridge curve.
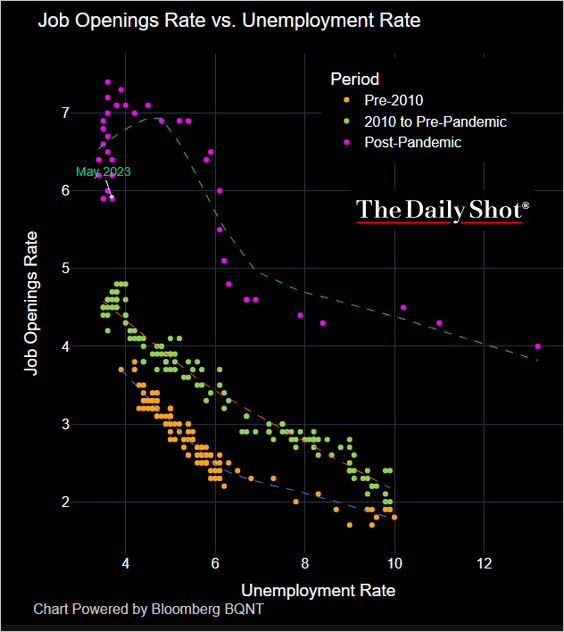 Source: @TheTerminal, Bloomberg Finance L.P.
——————–
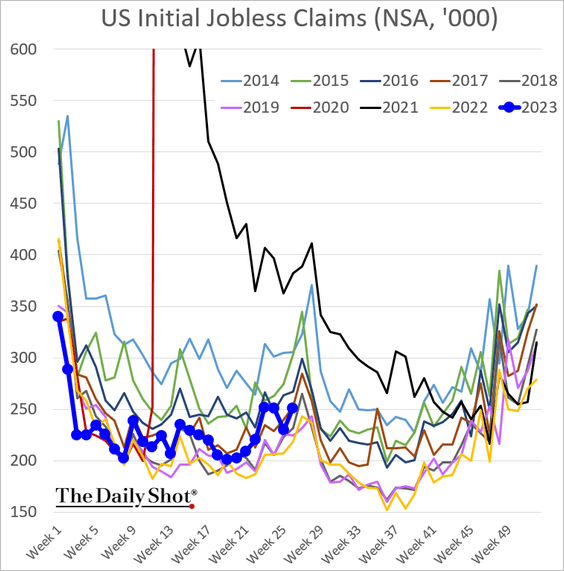
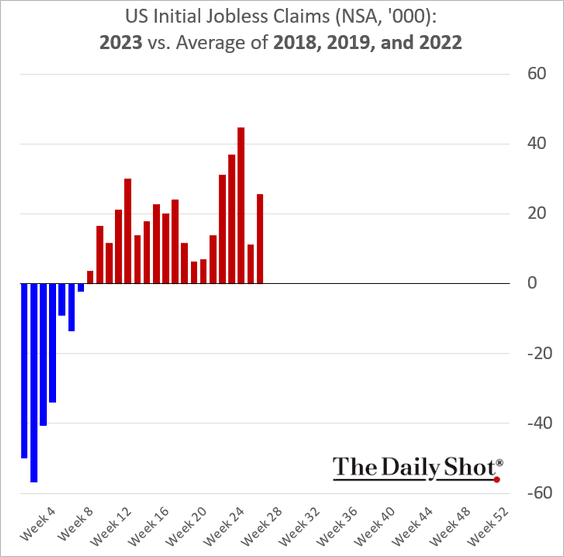
3. Initial jobless claims increased last week.
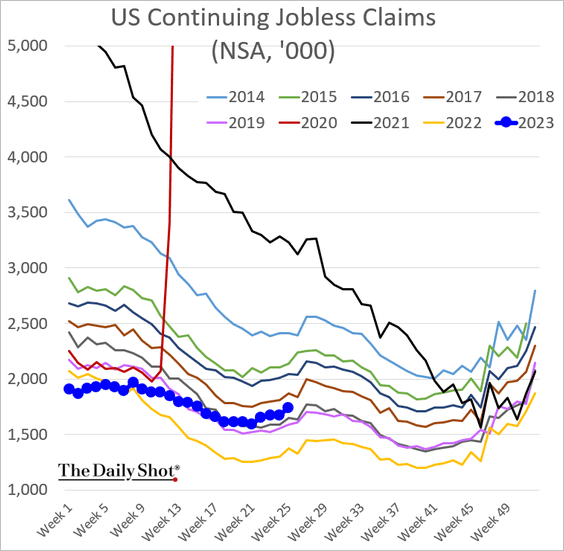
This chart shows the number of Americans receiving unemployment benefits.
——————–
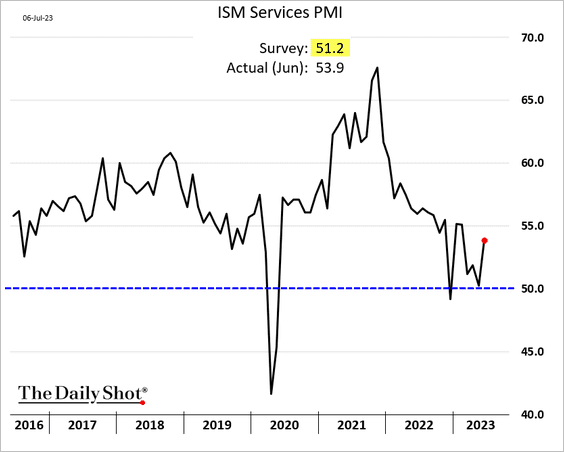
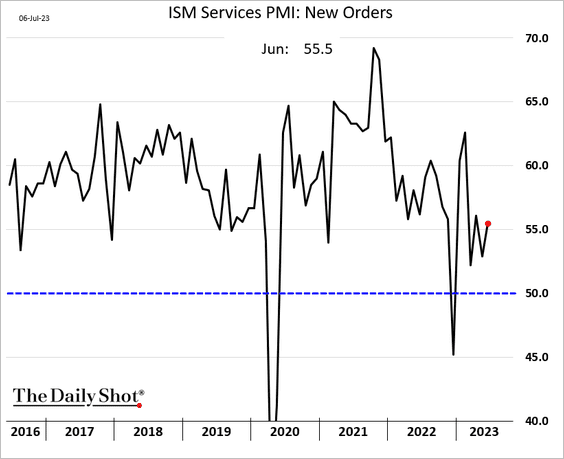
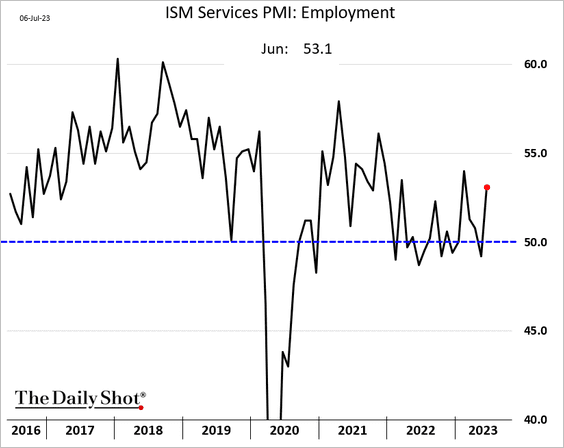
4. The ISM Services PMI surged last month, indicating a brisk uptick in service sector activity
 Source: @gutavsaraiva, @economics Read full article
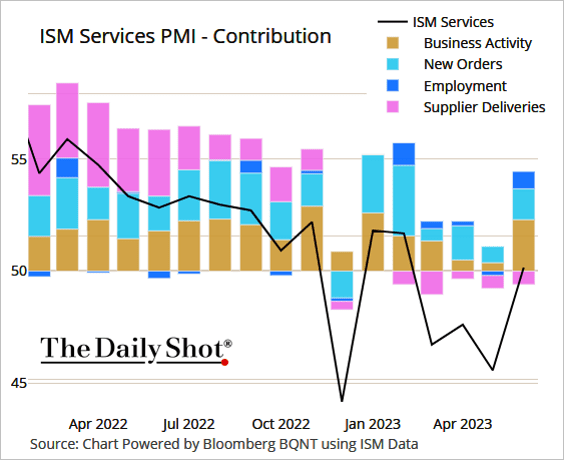
Here are the contributions to the ISM index.
 Source: @TheTerminal, Bloomberg Finance L.P.
• The ISM figure was well above forecasts.
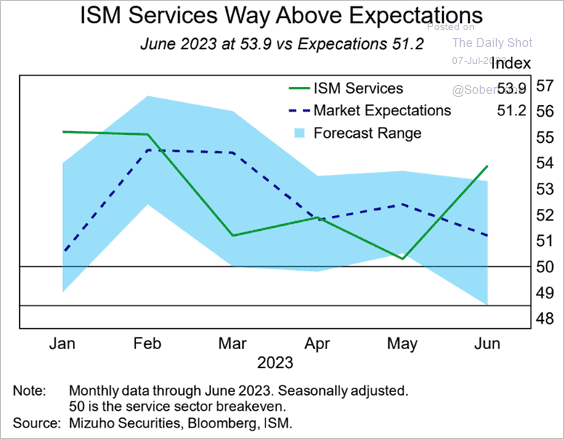 Source: Mizuho Securities USA
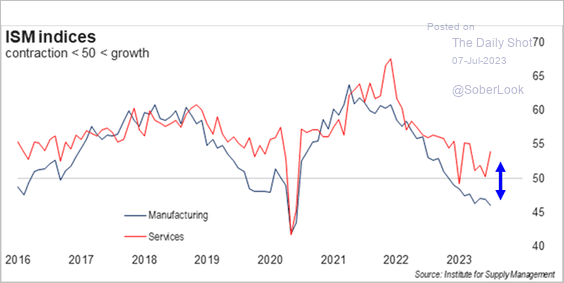
• The divergence between manufacturing and services continues to widen, which is a global phenomenon.
 Source: FHN Financial
• New orders and hiring accelerated.
• Service-sector input price inflation continues to moderate, …
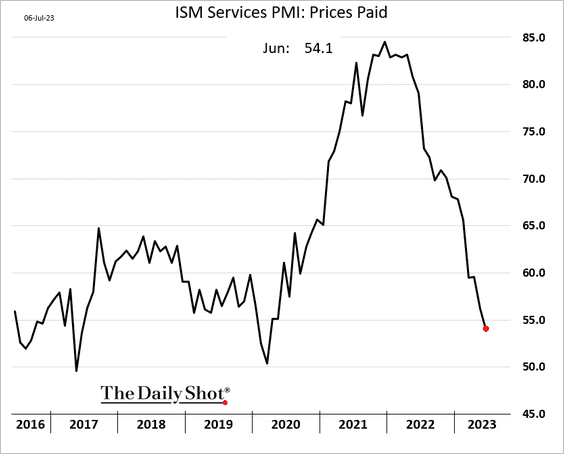
… pointing to slower wage gains ahead.
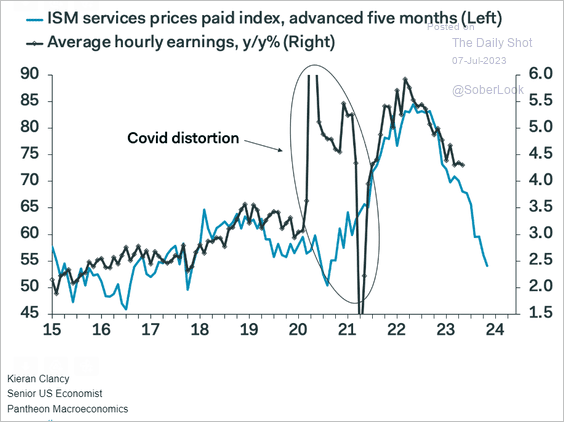 Source: Pantheon Macroeconomics
——————–
5. Mortgage applications increased last week, …
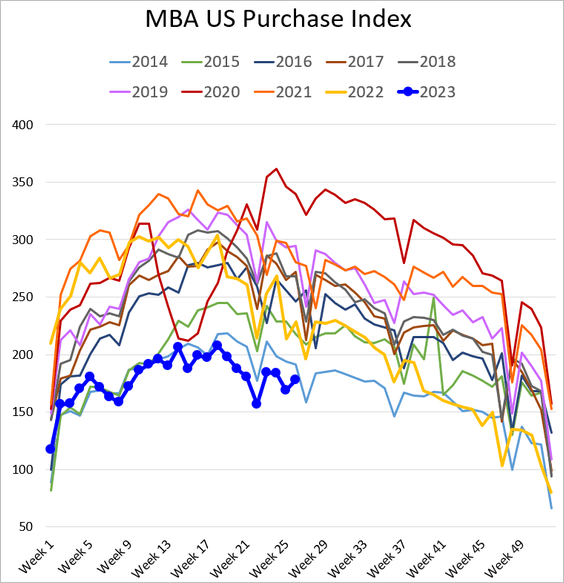
… but we are likely to see those gains reversing as mortgage rates surge past 7%.
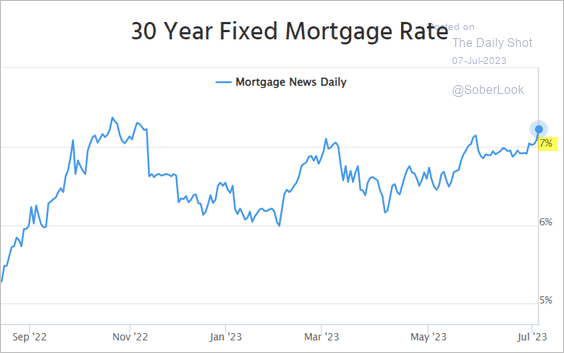 Source: Mortgage News Daily
Back to Index
Canada
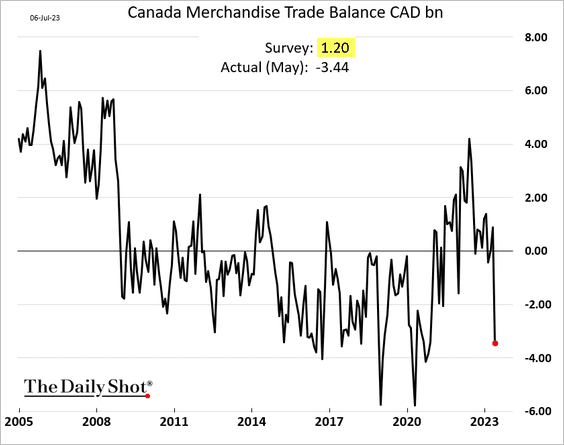
1. The trade balance unexpectedly swung into deficit amid lower commodity prices.
 Source: @rtkwrites, @economics Read full article
——————–
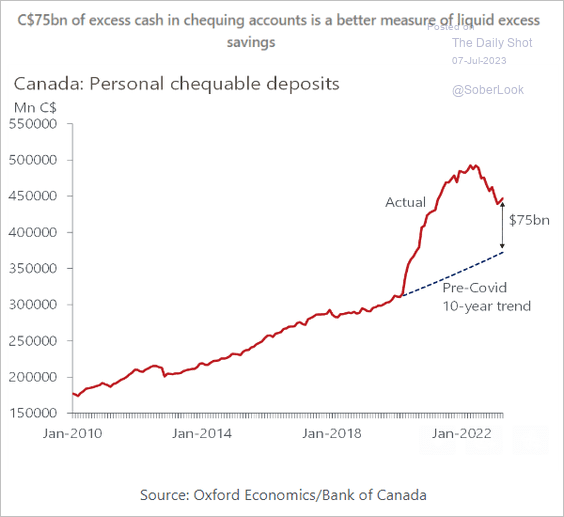
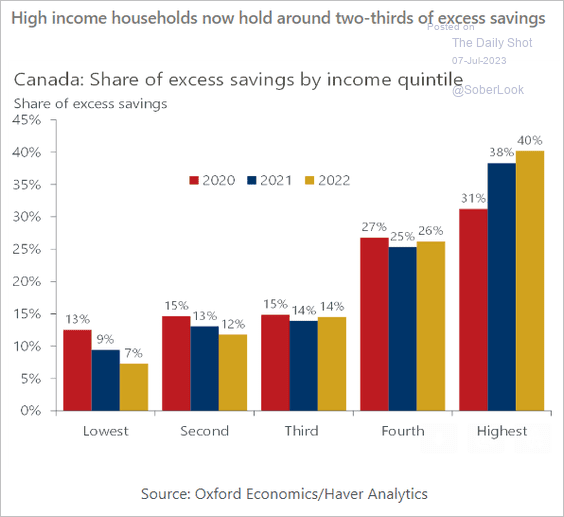
2. Hosueholds’ cash balances remain elevated relative to the pre-COVID trend.
 Source: Oxford Economics
Here is the breakdown of excess cash balances by income quintile.
 Source: Oxford Economics
——————–
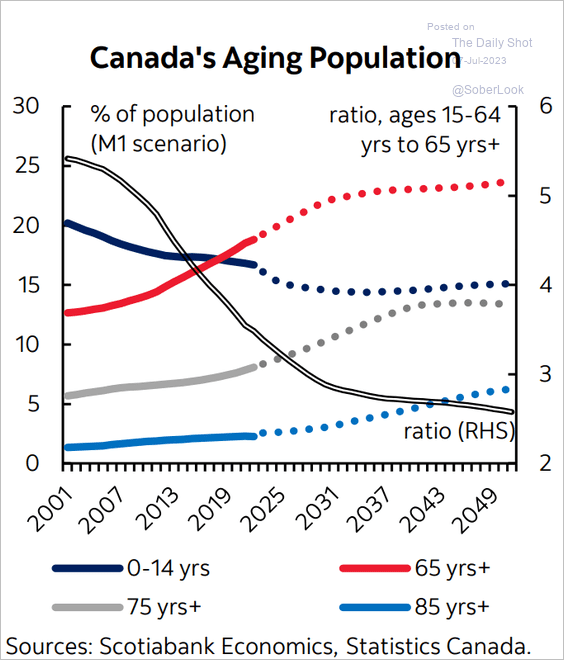
3. Here is a look at Canada’s aging population.
 Source: Scotiabank Economics
Back to Index
The United Kingdom
1. The 2-year gilt yield hit 5.5% for the first time since 2008.
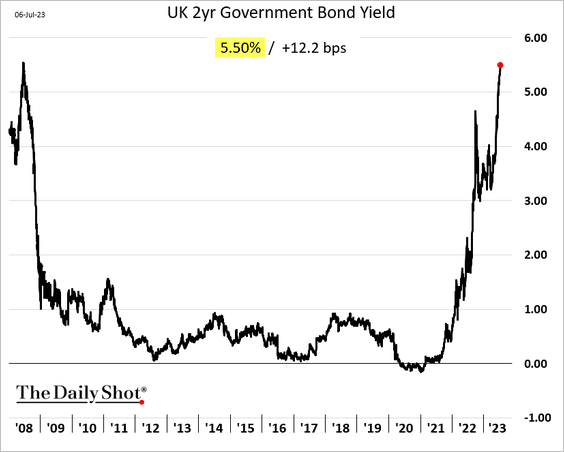
• Rate hike expectations surged as inflation continues to top expectations.
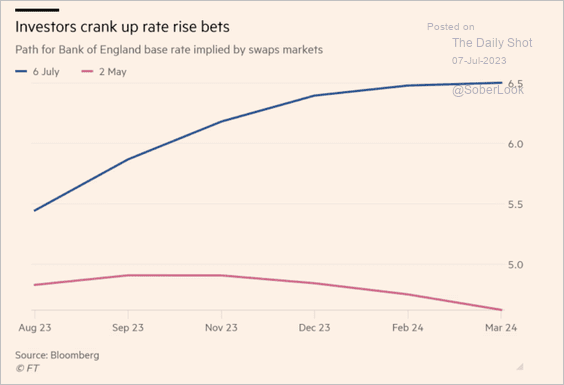 Source: @financialtimes Read full article
• The correlation between bank shares and the 2-year yield has broken down.
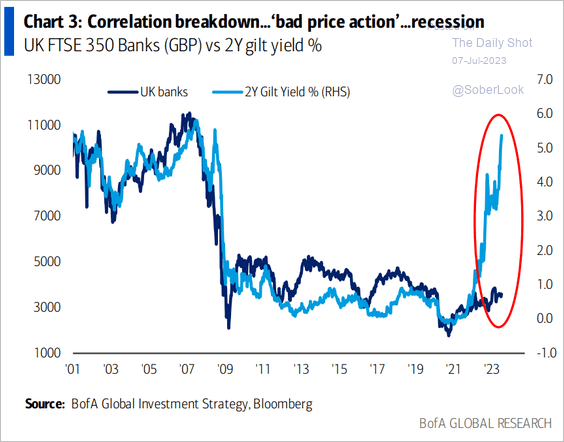 Source: BofA Global Research
——————–
2. Realized inflation has been much higher than inflation expectations.
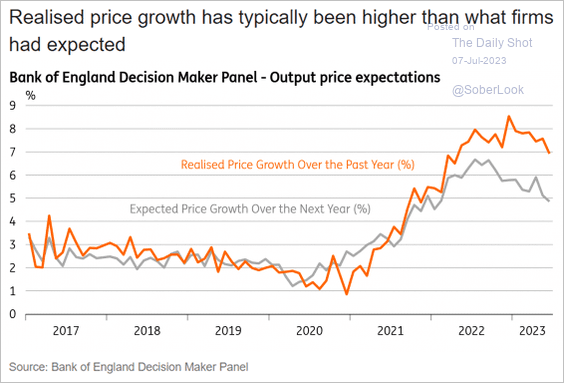 Source: ING
3. Net mortgage lending was negative for two straight months.
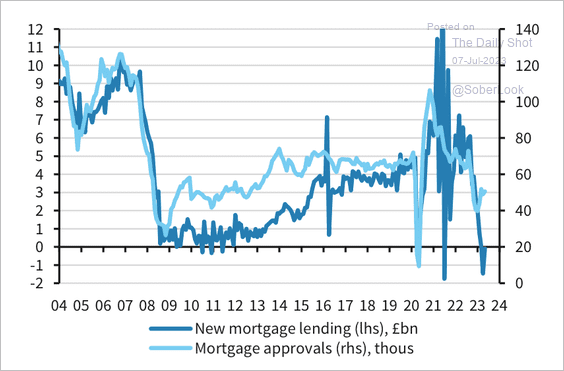 Source: Barclays Research
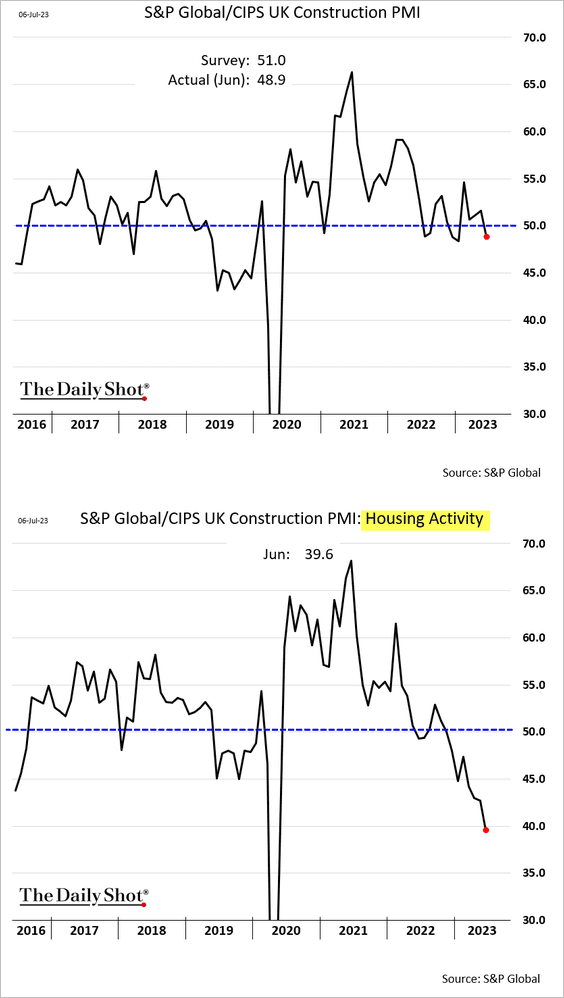
4. Construction activity moved back into contraction territory last month, driven by residential sector performance.
5. Will the debt-to-GDP ratio keep rising?
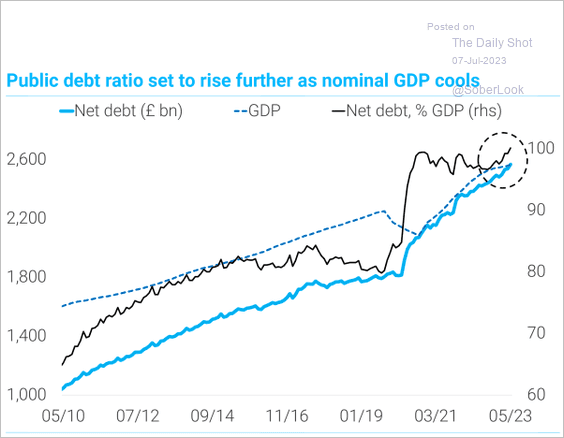 Source: TS Lombard
Back to Index
The Eurozone
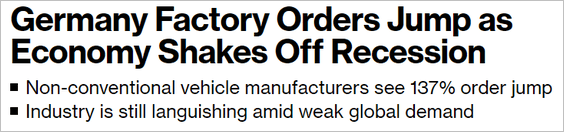
1. Germany’s manufacturing orders jumped in May, topping expectations.
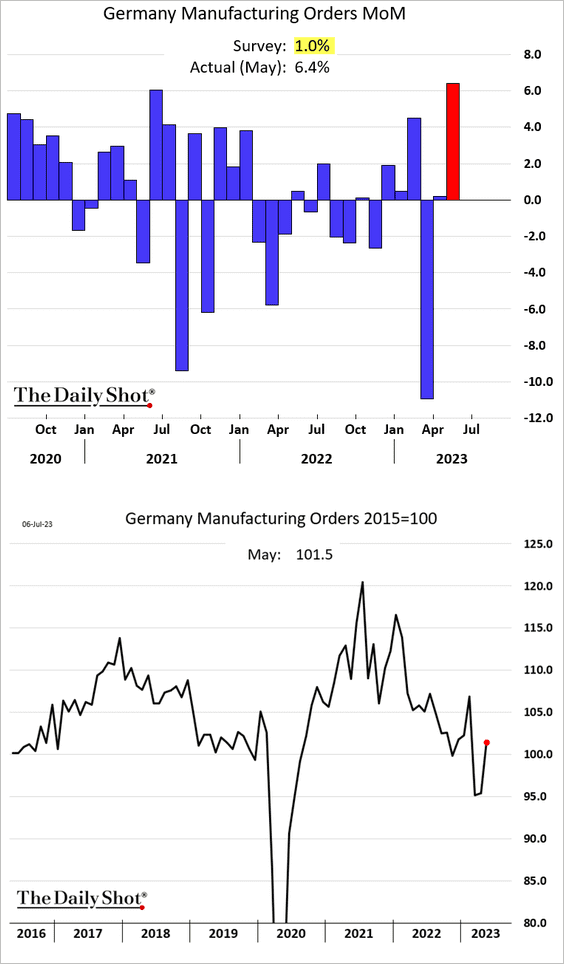
 Source: @WindSonja, @economics Read full article
However, excluding some volatile transportation items, the gain was less impressive.
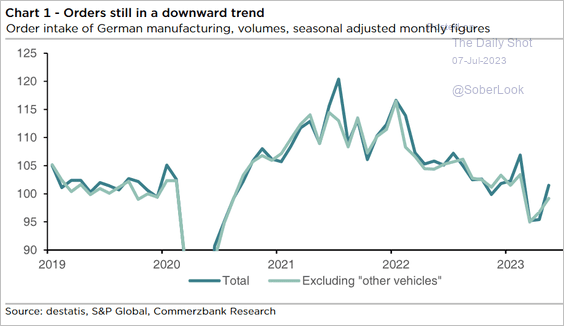 Source: Commerzbank Research
– Industrial production eased, but manufacturing output edged higher.
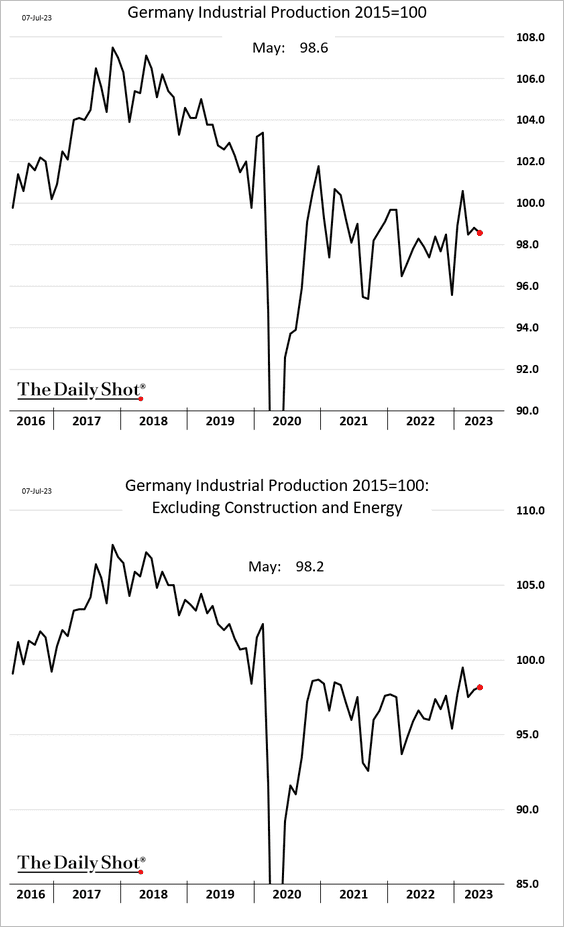
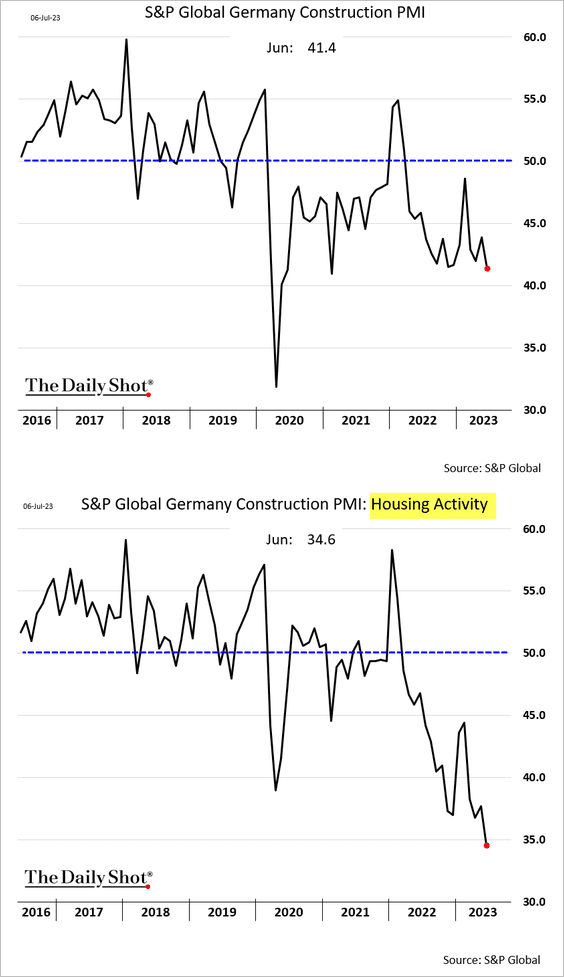
• Germany’s construction activity continues to deteriorate.
——————–
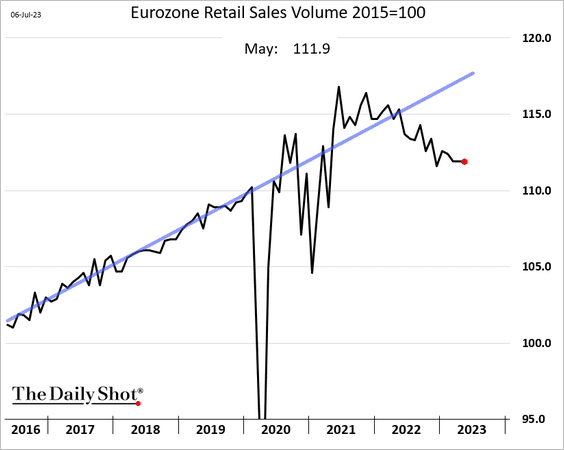
2. Euro-area retail sales were flat in May.
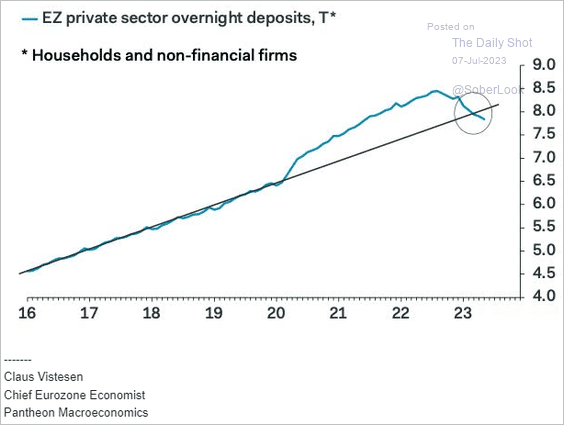
3. Private sector deposits are now below the pre-COVID trend.
 Source: Pantheon Macroeconomics
Back to Index
Asia-Pacific
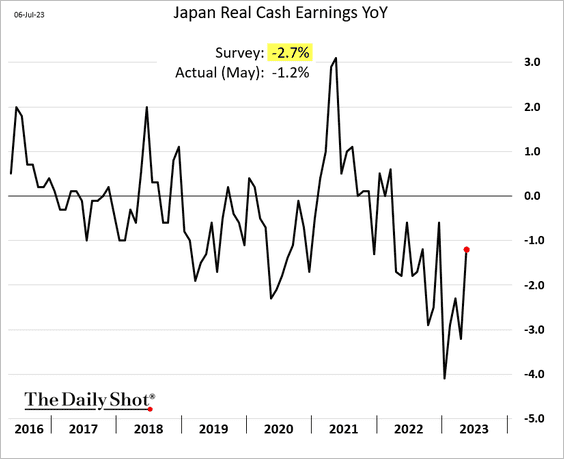
1. Japan’s wages jumped in May, but real wages are still down year-over-year.
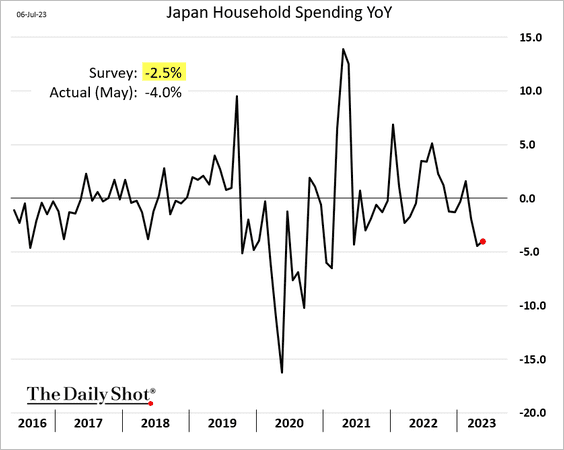
Japan’s household spending was 4% below 2022 levels.
——————–
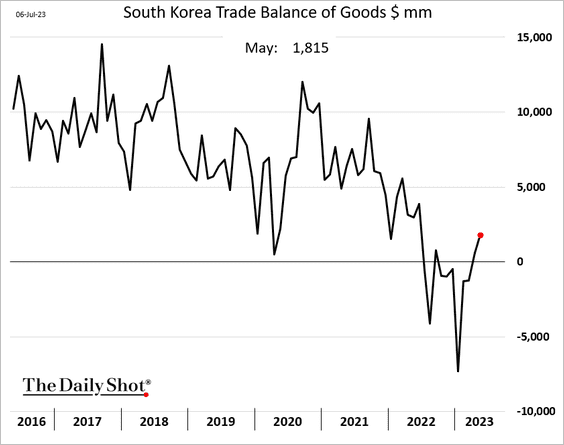
2. South Korea’s goods trade balance is back in surplus.
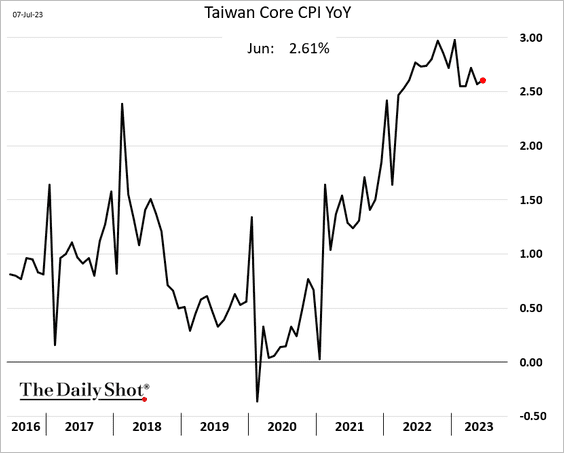
3. Taiwan’s core inflation remains elevated.
Back to Index
China
1. So far, fiscal support has been weak this year.
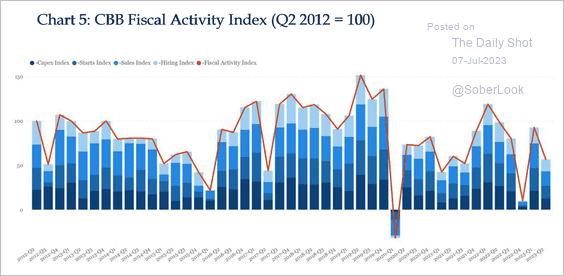 Source: China Beige Book
2. This chart illustrates the convergence of Chinese and US unit labor costs.
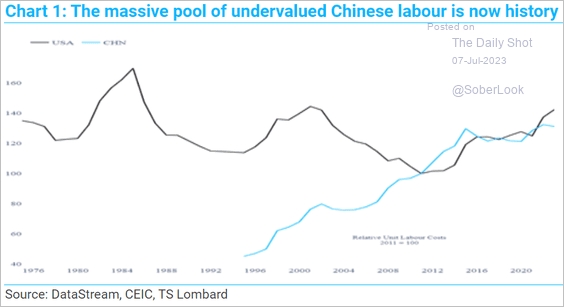 Source: TS Lombard
3. Nominal domestic tourism spending dipped slightly below pre-pandemic levels during the recent Dragon Boat Festival.
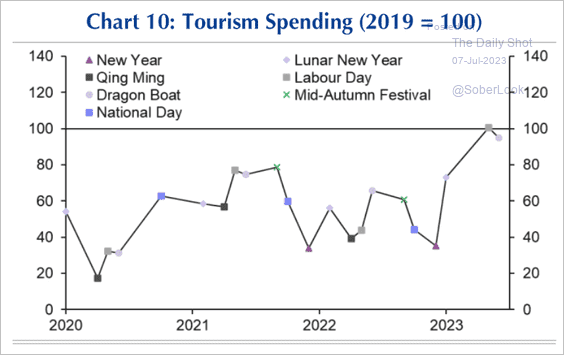 Source: Capital Economics
4. Deflation has been pressuring corporate profits.
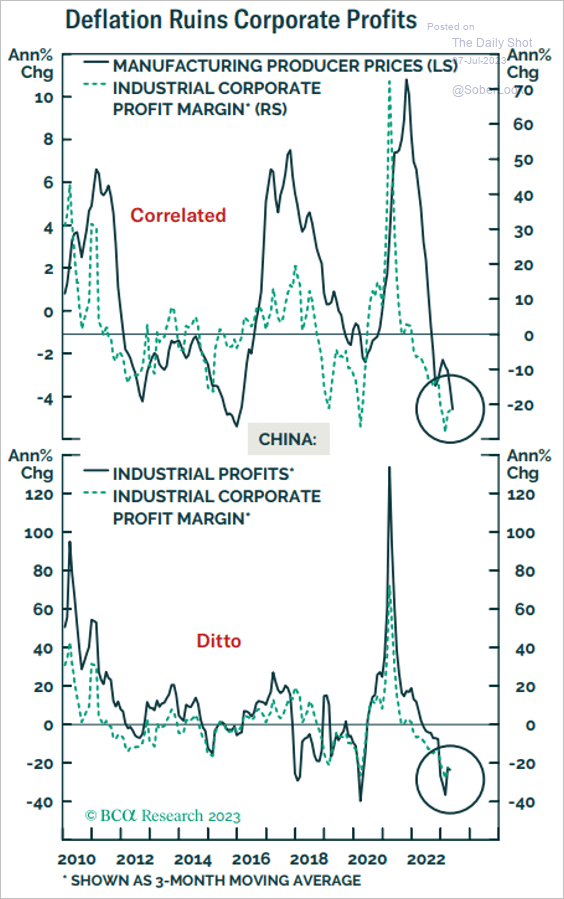 Source: BCA Research
5. China’s scientific and technical publications have accelerated over the past 20 years, far outnumbering other major economies.
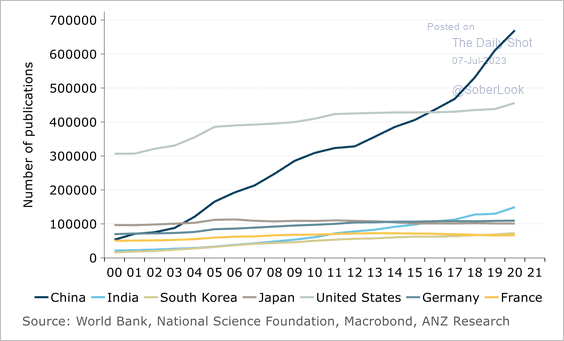 Source: @ANZ_Research
Back to Index
Emerging Markets
1. The rally in LatAm currencies appears to be over.
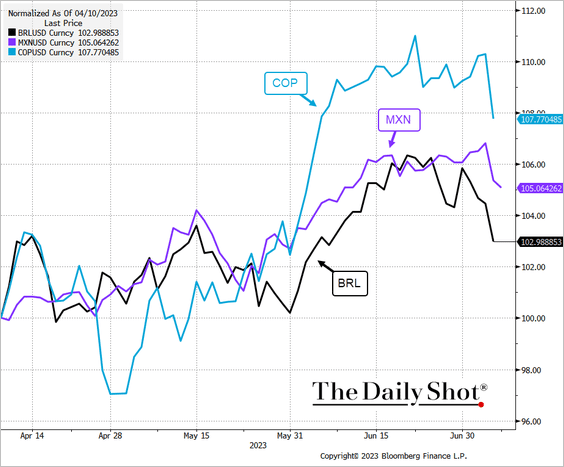 Source: @TheTerminal, Bloomberg Finance L.P.
Will the MXN/JPY carry trade see some unwinding?
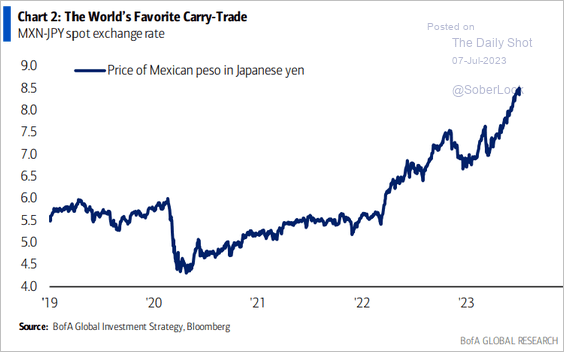 Source: BofA Global Research
——————–
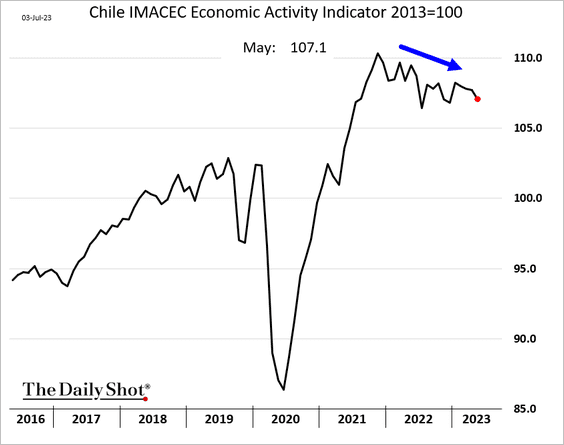
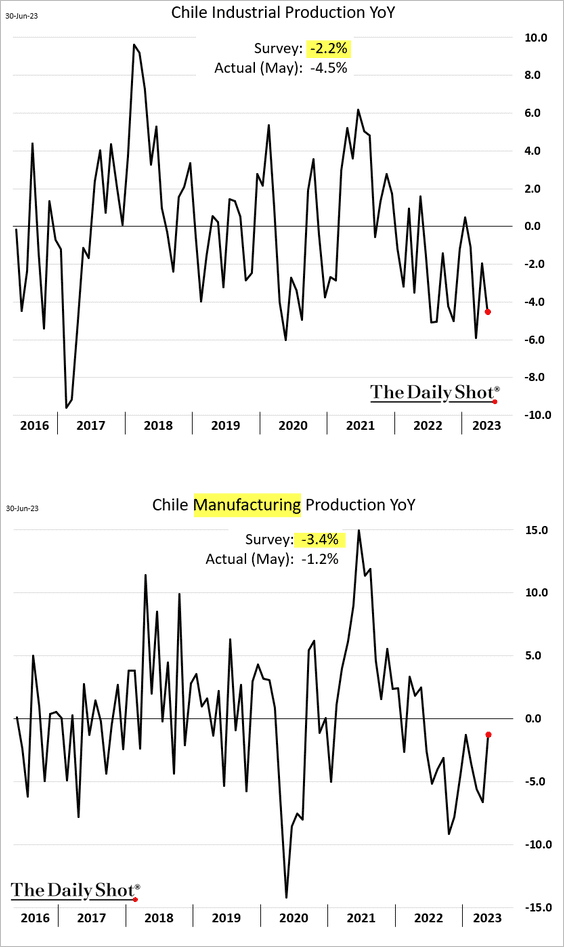
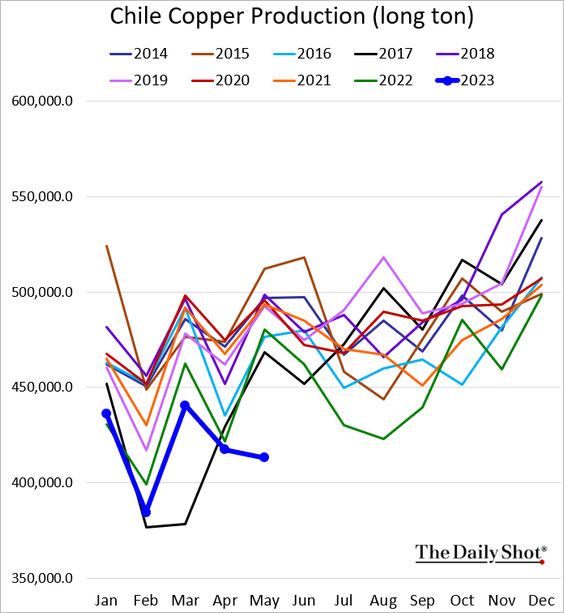
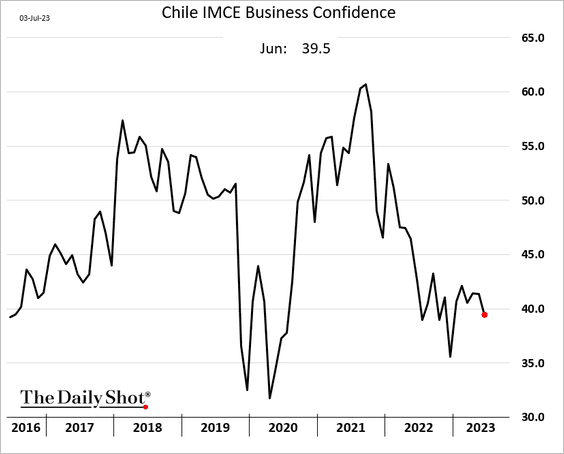
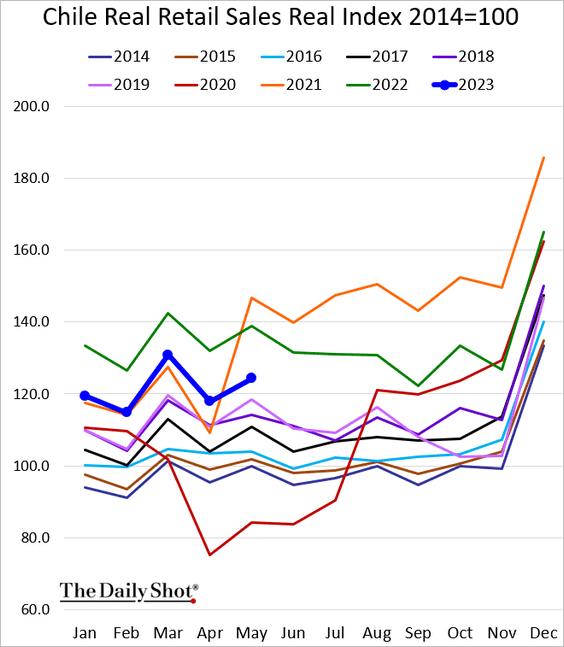
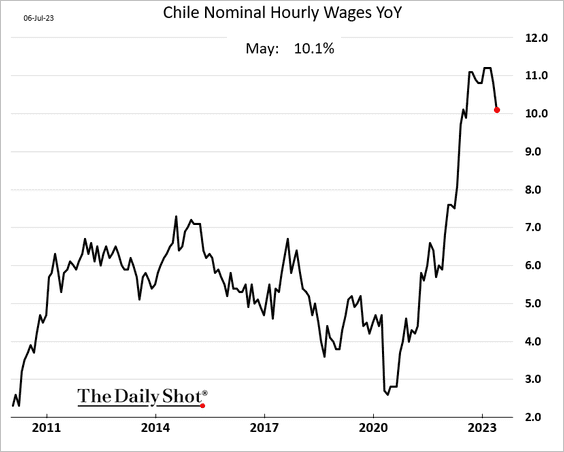
2. Next, we have some updates on Chile.
• Economic activity:
• Industrial production (year-over-year):
• Copper production (multi-year lows):
• Business confidence:
• Retail sales (well below last year):
• Wage growth (peaking):
——————–
3. EM bonds have been outperforming Treasuries.
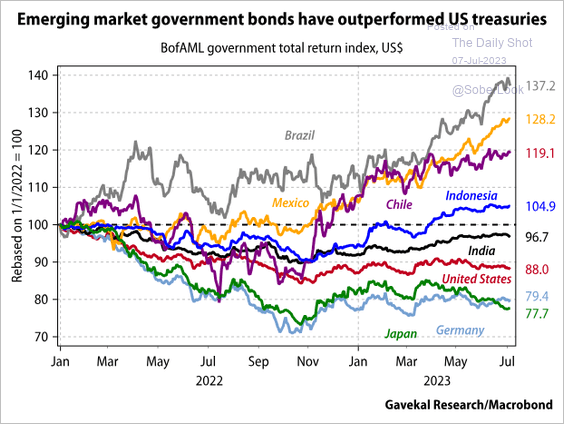 Source: Gavekal Research
4. EM equities typically outperform after US recessions.
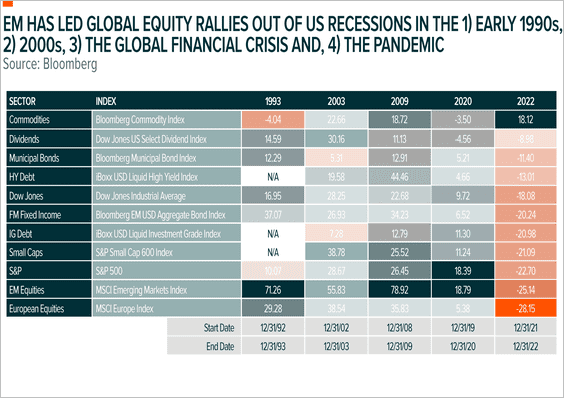 Source: Global X ETFs Read full article
Back to Index
Cryptocurrency
1. It has been a tough week for cryptos, with Litecoin (LTC) underperforming and Bitcoin Cash (BCH) outperforming peers.
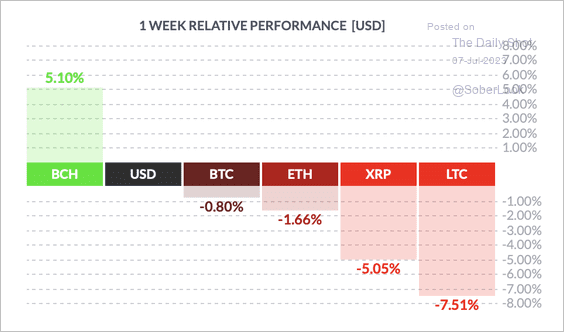 Source: FinViz
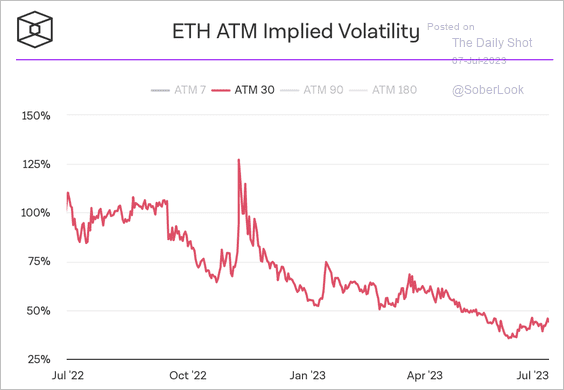
2. Implied volatility in bitcoin and ether options stabilized around historically low levels. (2 charts)
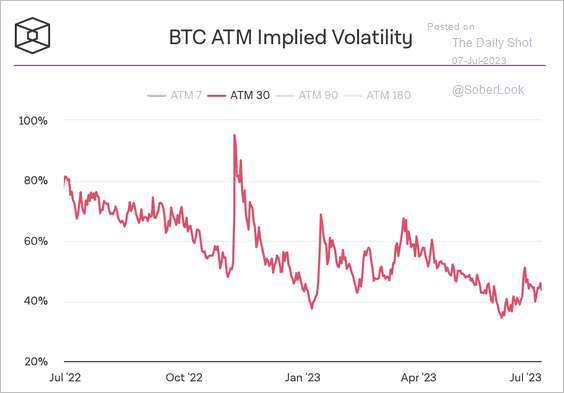 Source: The Block Research
 Source: The Block Research
——————–
3. BTC and ETH’s put/call ratios ticked lower over the past week.
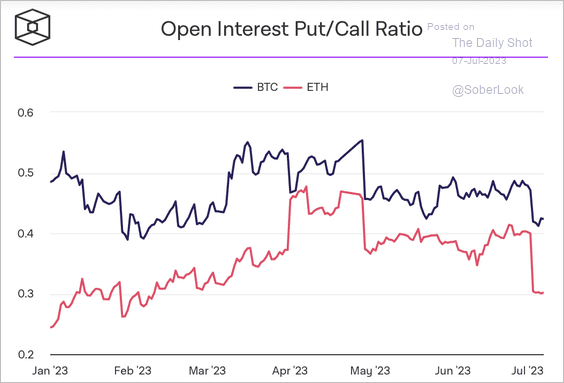 Source: The Block Research
Back to Index
Energy
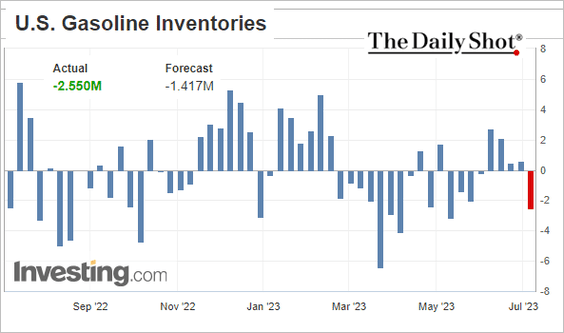
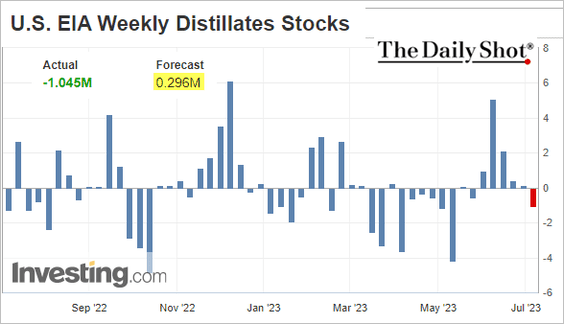
1. US refined product inventories tightened further last week.
– Gasoline (weekly changes):
– Distillates:
• Here are the inventory levels in barrels.
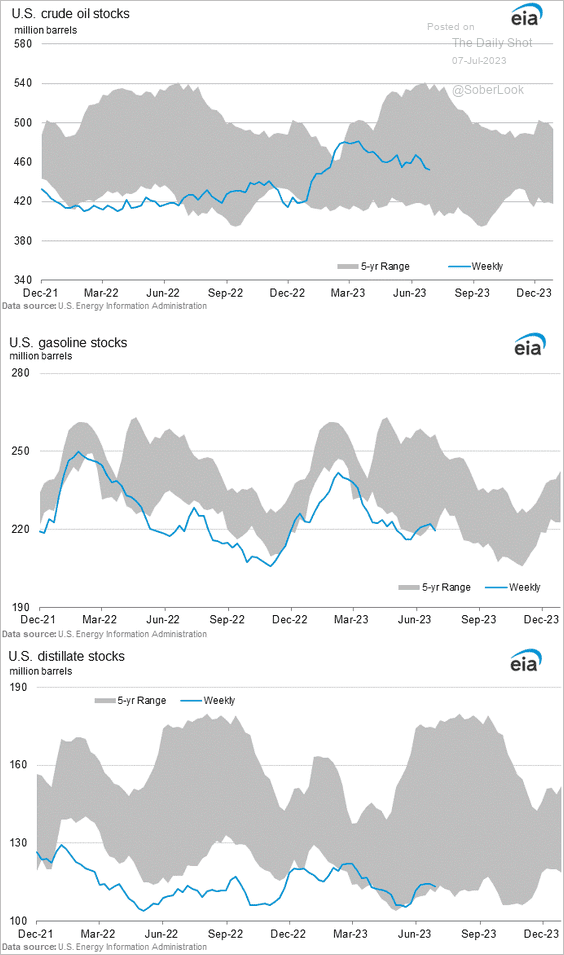 Source: @EIAgov
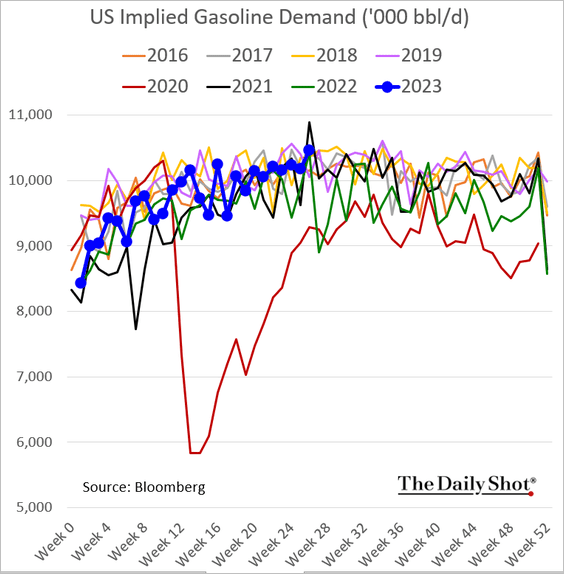
• Gasoline demand jumped going into the July 4th weekend.
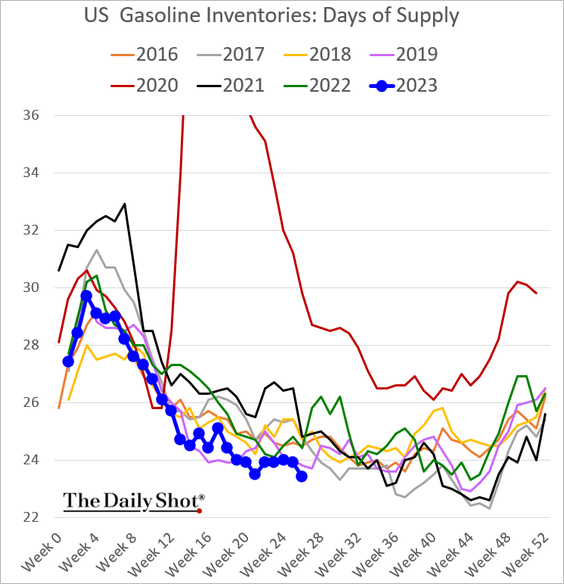
In terms of days of supply, gasoline inventories hit a multi-year low.
——————–
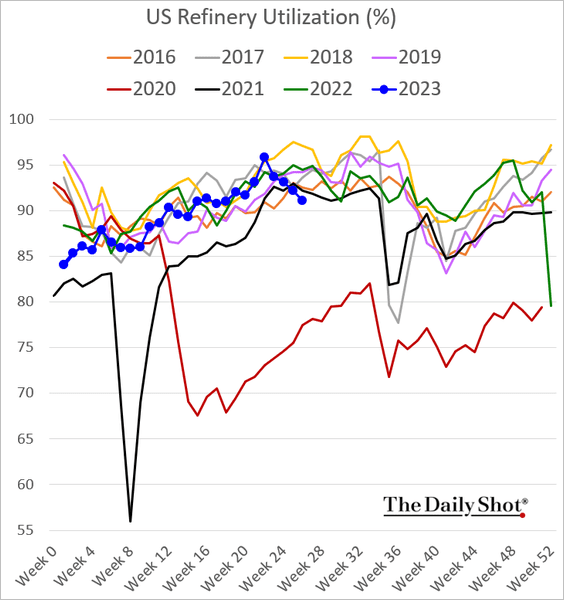
2. US refinery inputs continue to ease.
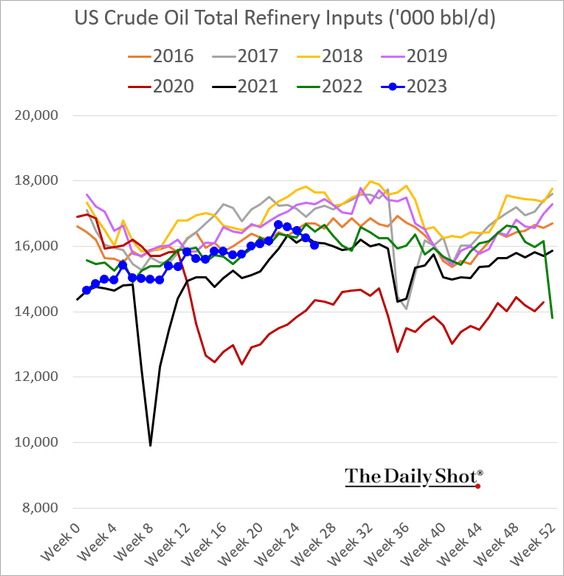
Here is refinery utilization.
——————–
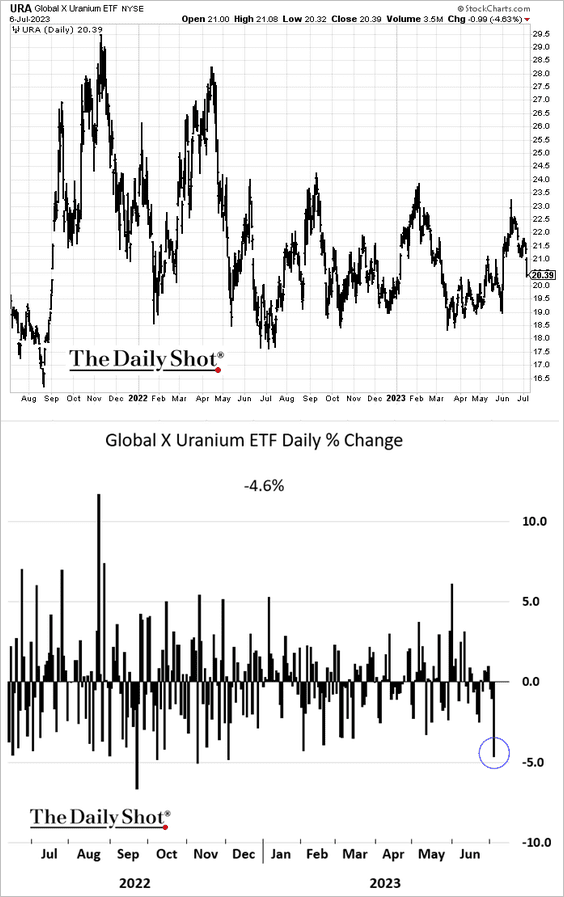
3. Shares of uranium producers are under pressure.
Back to Index
Equities
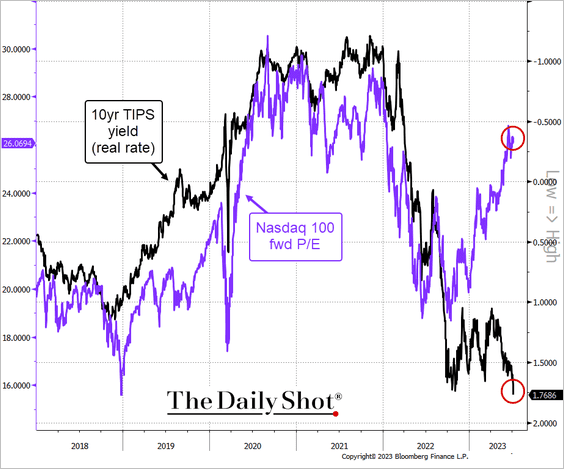
1. Growth stock valuations are inconsistent with surging real yields.
2. Does the ISM manufacturing PMI signal further deterioration in earnings growth?
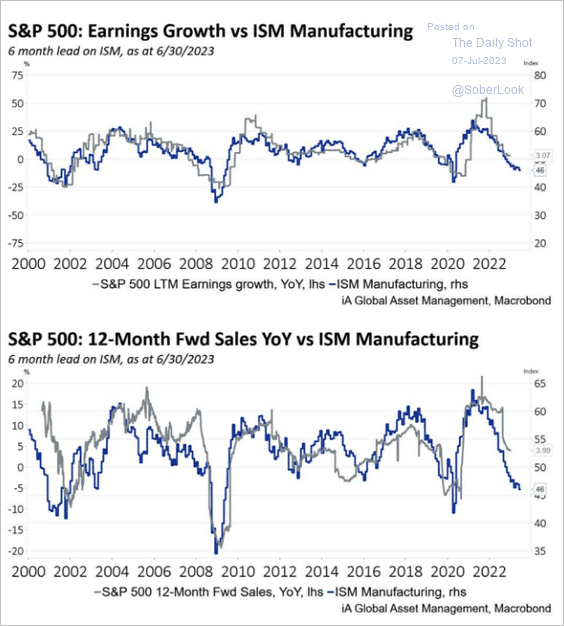 Source: iA Global Asset Management
3. Q2 earnings downgrades have been following a typical trajectory.
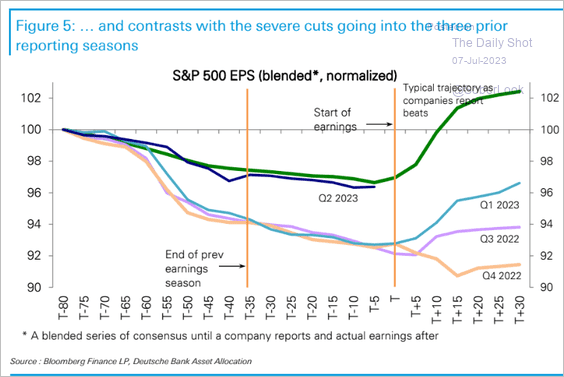 Source: Deutsche Bank Research
Here are the changes in Q2 earnings estimates by sector.
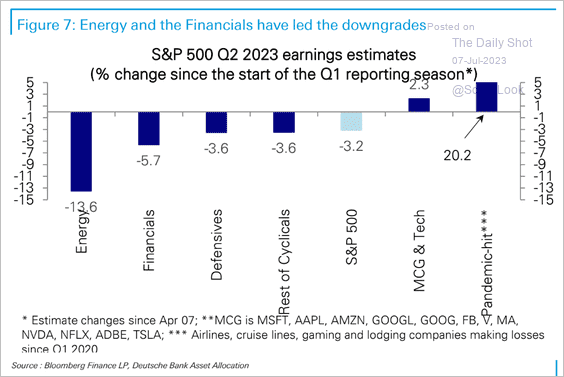 Source: Deutsche Bank Research
——————–
4. Q3 and Q4 earnings estimates are inconsistent with US GDP forecasts.
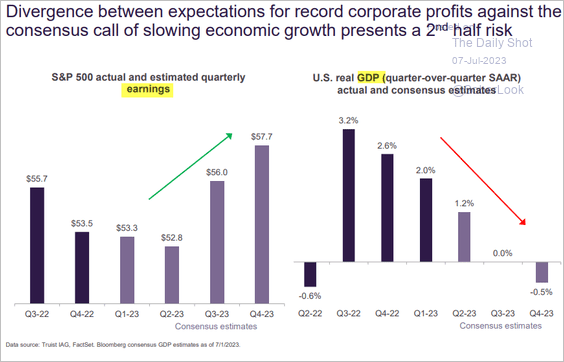 Source: Truist Advisory Services
However, earnings estimates are not as upbeat in real terms.
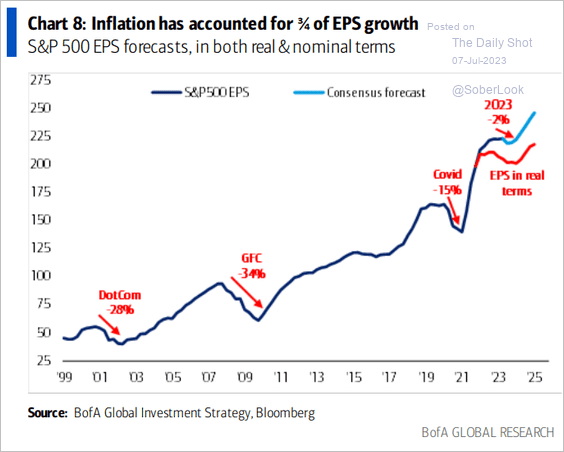 Source: BofA Global Research
——————–
5. This chart shows US index valuations relative to 20-year averages.
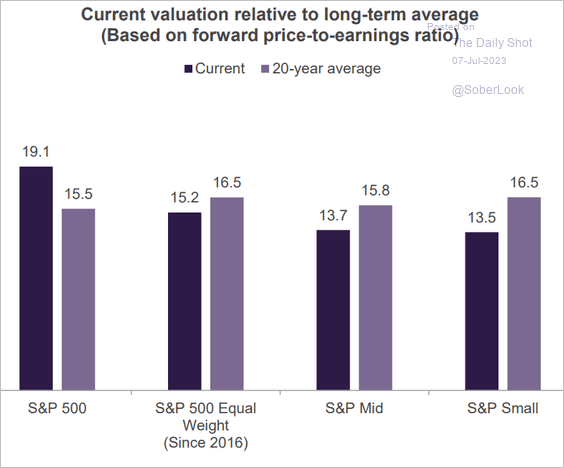 Source: Truist Advisory Services
6. Large-cap funds continue to see inflows.
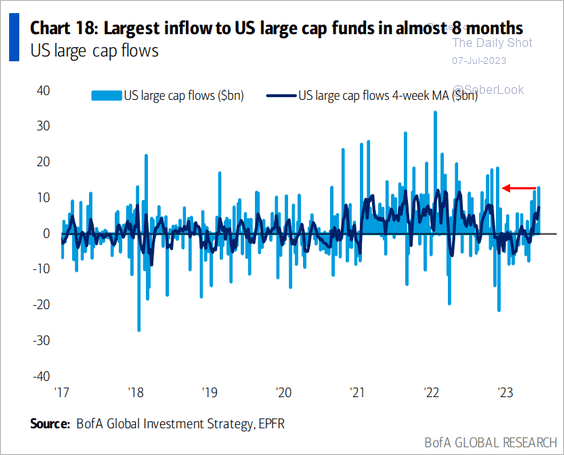 Source: BofA Global Research
7. Value tends to outperform growth when profit growth accelerates.
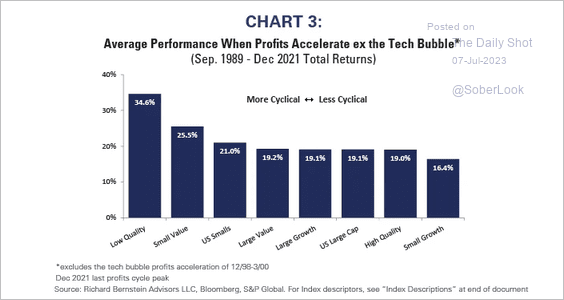 Source: Richard Bernstein Advisors Read full article
And large-cap growth outperforms value and quality when profit growth wanes.
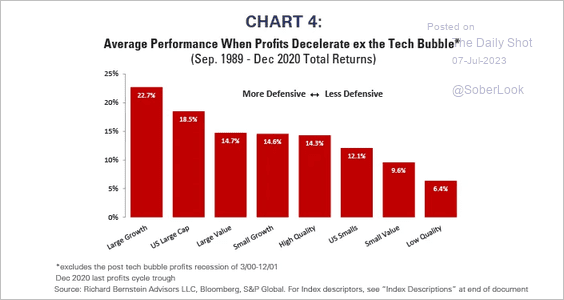 Source: Richard Bernstein Advisors Read full article
——————–
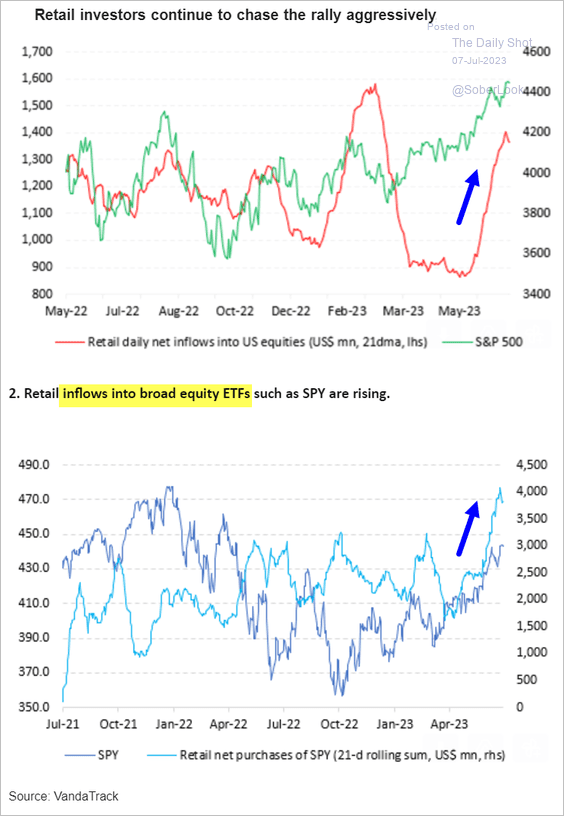
8. Retail investors have been aggressively buying stocks and ETFs.
 Source: Vanda Research
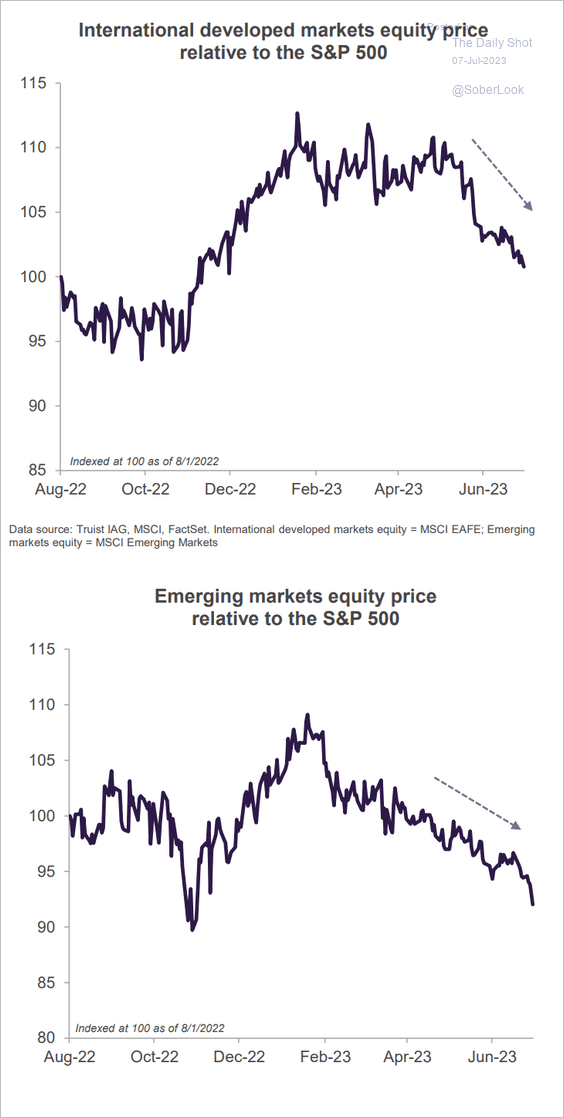
9. International shares continue to underperform the S&P 500.
 Source: Truist Advisory Services
Back to Index
Rates
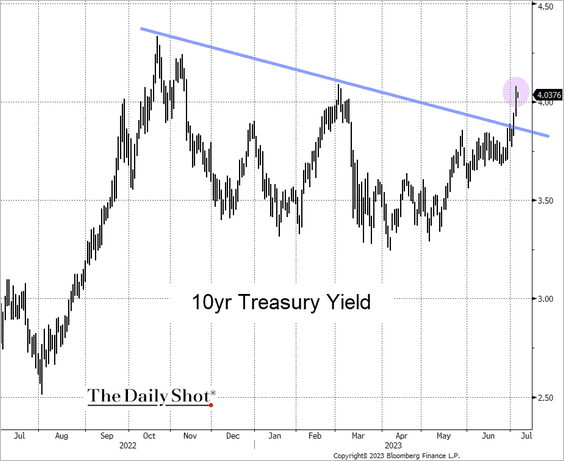
1. The 10-year Treasury yield broke above the downtrend resistance.
 Source: @TheTerminal, Bloomberg Finance L.P.
2. On average, the 2s10s Treasury yield curve re-steepens from its most inverted level six months before a recession starts.
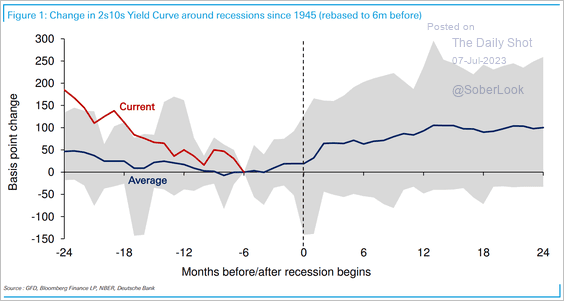 Source: Deutsche Bank Research
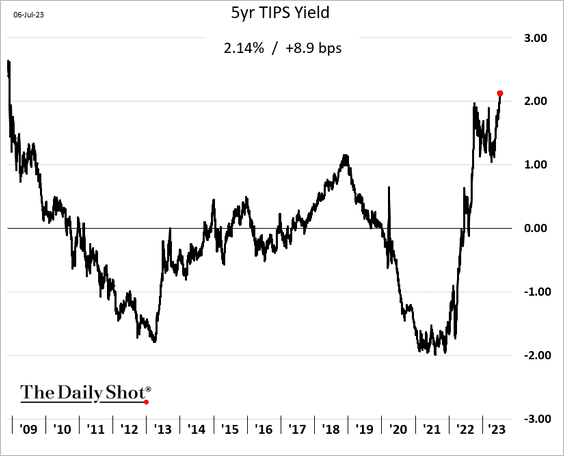
3. TIPS (inflation-linked Treasuries) continue to see outflows (2 charts), …
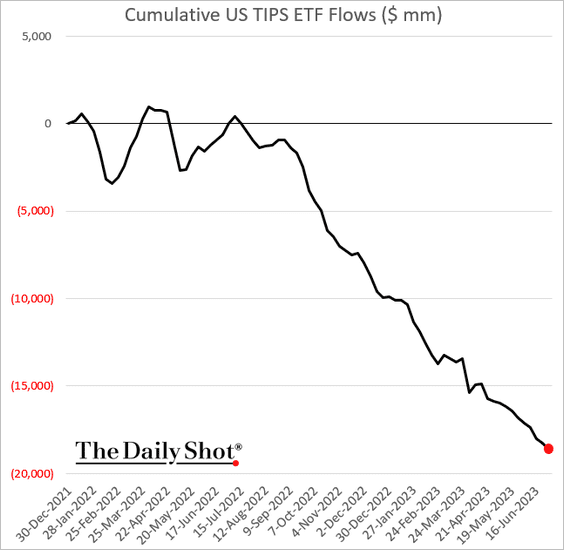
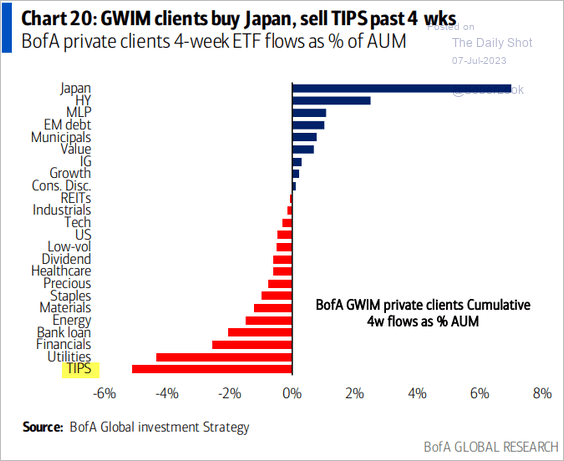 Source: BofA Global Research
… pushing TIPS yields to multi-year highs.
Back to Index
Global Developments
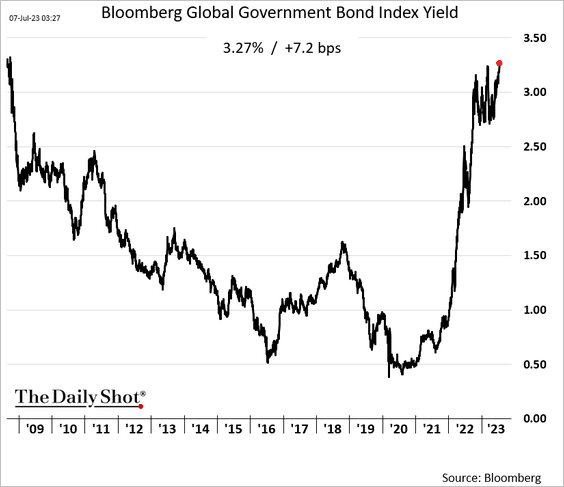
1. The global bond index yield hit the highest level since 2008.
2. Container freight costs from China are running at pre-COVID levels.
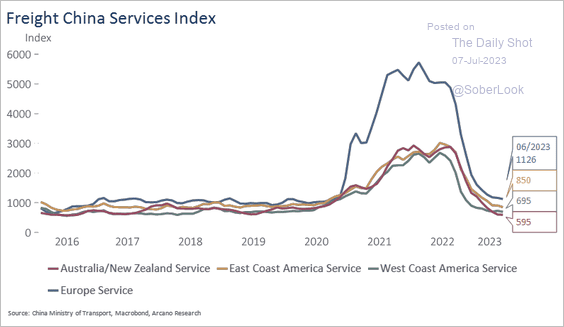 Source: Arcano Economics
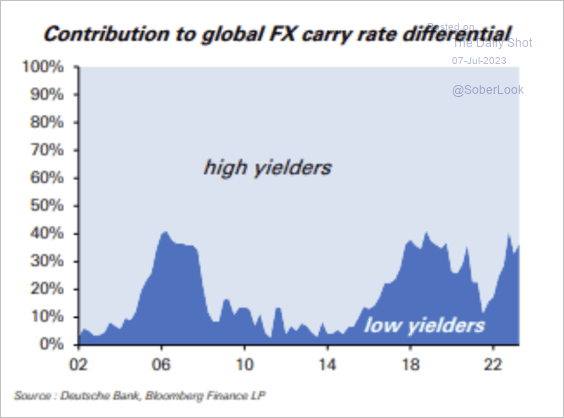
3. Interest rate differentials are at the highest levels since pre-financial crisis, which supports FX carry returns, particularly among high yielders. (2 charts)
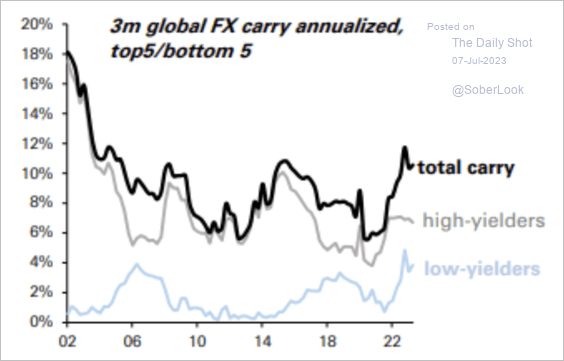 Source: Deutsche Bank Research
 Source: Deutsche Bank Research
——————–
4. The global stock/bond ratio has been climbing as G7 real policy rates still have room to rise.
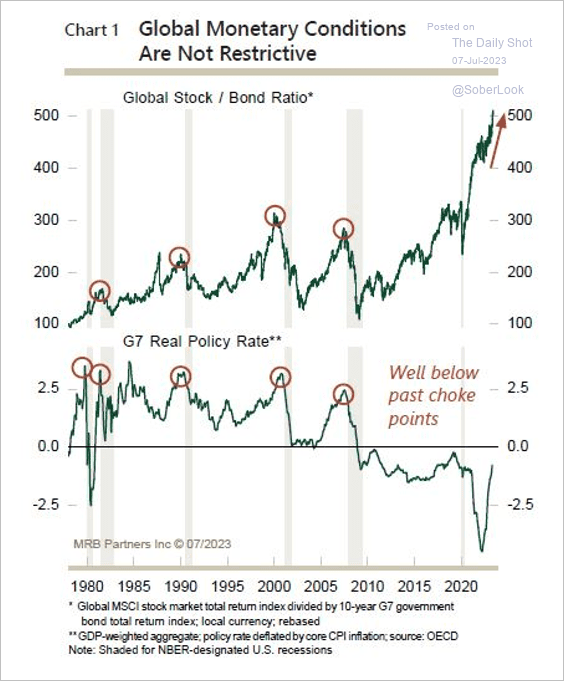 Source: MRB Partners
5. What drove the neutral rate declines in the largest economies?
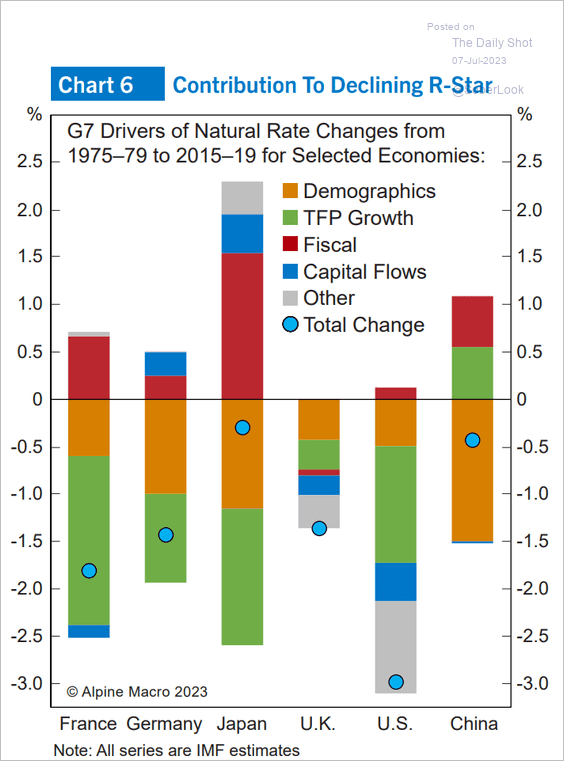 Source: Alpine Macro
——————–
Food for Thought
1. War budgets:
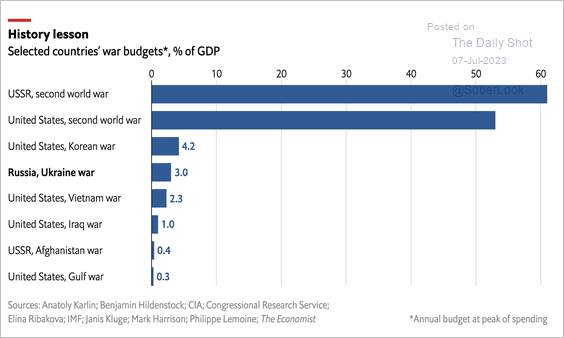 Source: The Economist Read full article
2. Changes in Russian and Ukrainian heavy weapons since the start of the war:
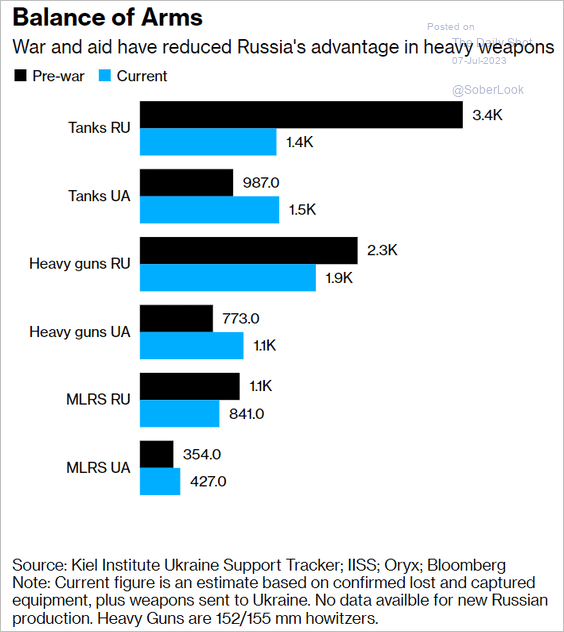 Source: @MarcChampion1, @bpolitics Read full article
3. The US population age distribution over time:
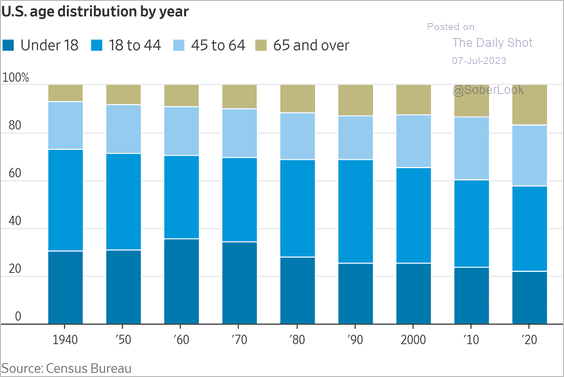 Source: @WSJ Read full article
4. Retirement ages in G20 countries:
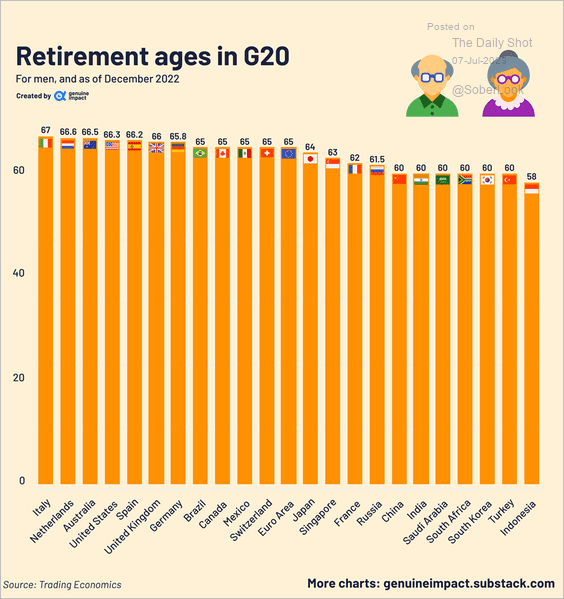 Source: @genuine_impact
5. Preferred way to order from fast-food restaurants:
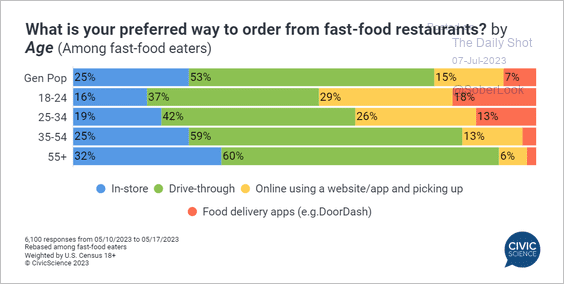 Source: @CivicScience Read full article
6. Spending at Target vs. Walmart (year-over-year growth):
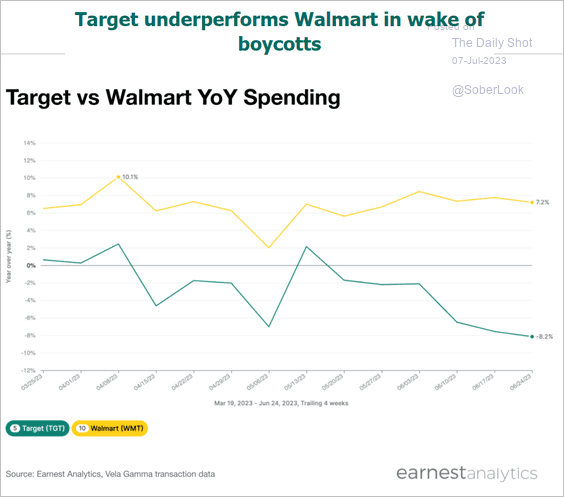 Source: Earnest
7. US college enrollment rates:
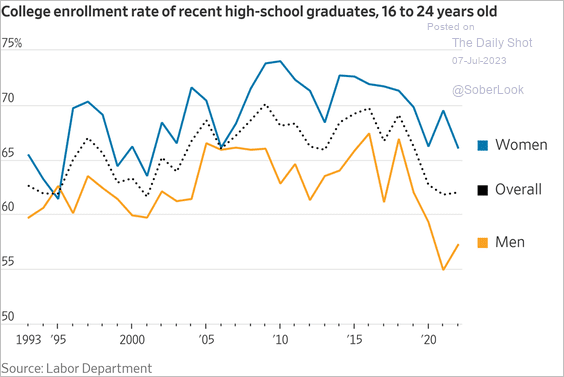 Source: @WSJ Read full article
8. Number of Grand Slam singles titles won:
 Source: Statista
——————–
Have a great weekend!
Back to Index