
The Daily Shot: 10-Jul-23
• The United States
• Canada
• The Eurozone
• Europe
• Asia-Pacific
• China
• Emerging Markets
• Commodities
• Energy
• Equities
• Credit
• Global Developments
• Food for Thought
The United States
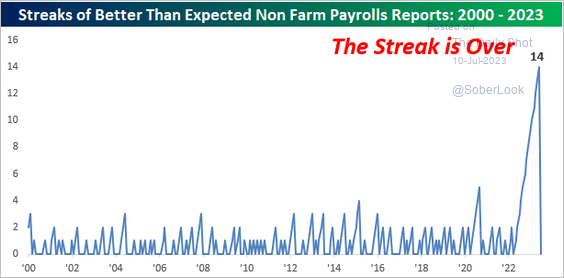
1. The June payrolls figures came in below expectations …
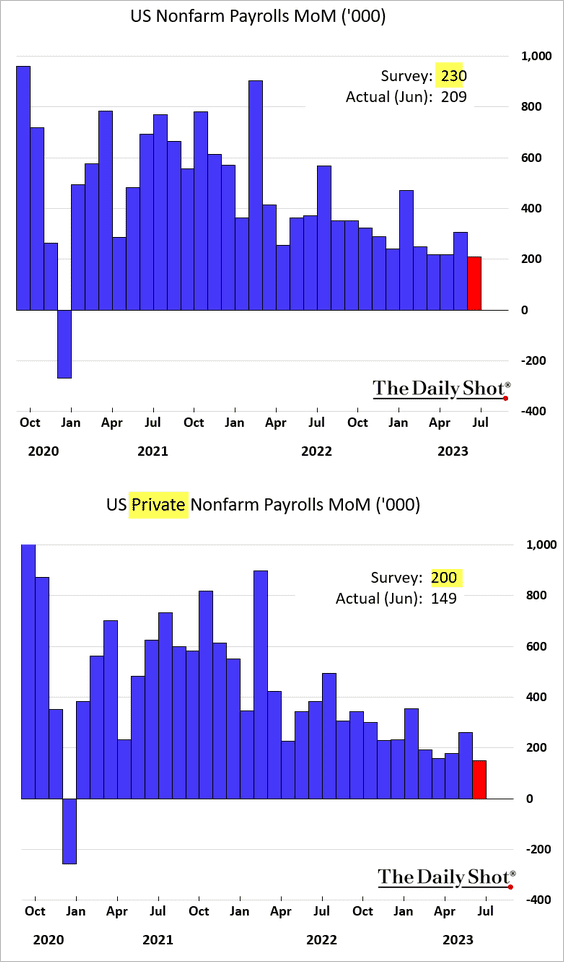
… for the first time in over a year. Nonetheless, the report was sufficiently robust to ensure a Fed rate hike this month.
 Source: @bespokeinvest
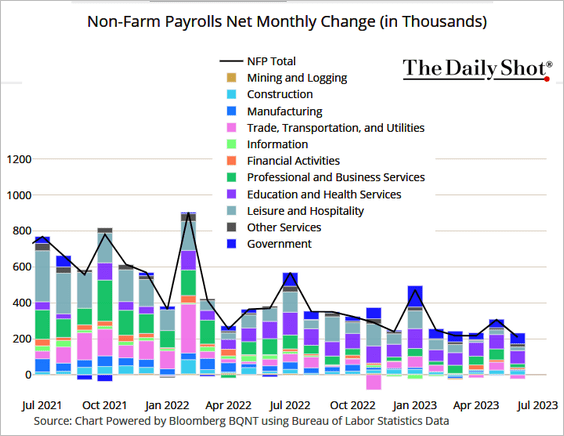
• Here are the contributions to nonfarm payrolls.
 Source: @TheTerminal, Bloomberg Finance L.P.
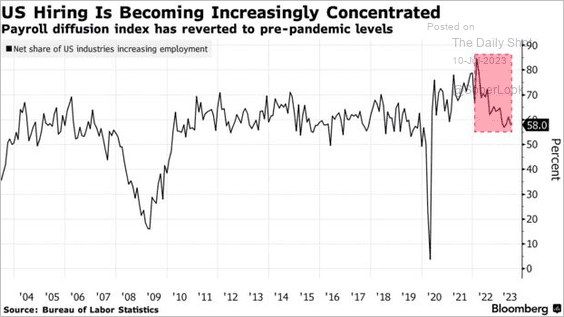
– The payrolls diffusion index has been trending lower.
 Source: @gutavsaraiva, @readep, @economics Read full article
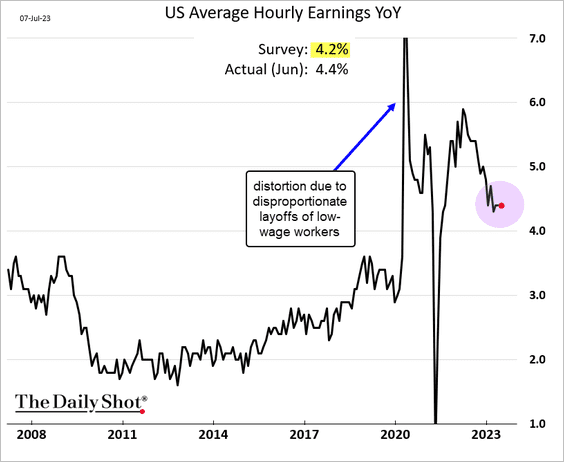
• Wage growth exceeded forecasts.
– According to a survey from Morning Consult, more employees are confident they would get a raise if they asked.
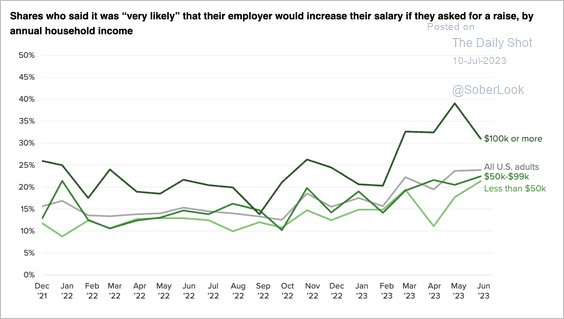 Source: Morning Consult Read full article
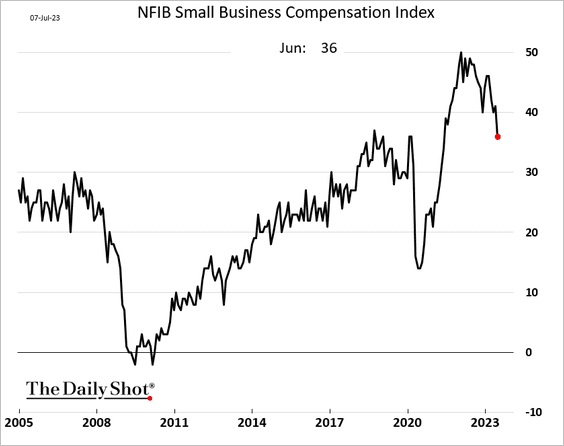
– However, the NFIB small business compensation index declined sharply in May.
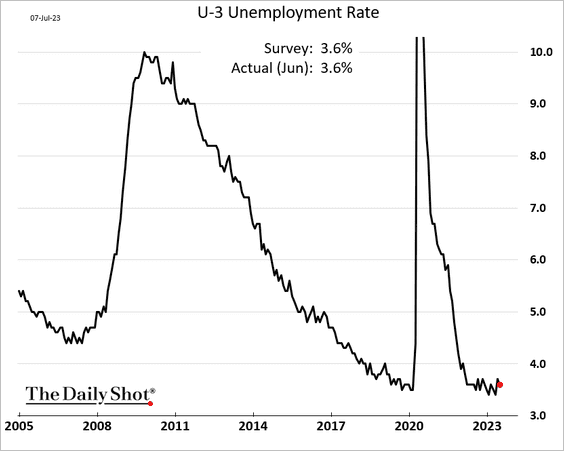
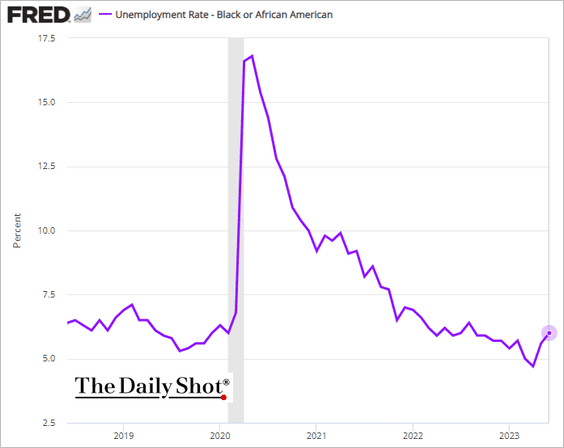
• The unemployment rate edged lower.
– But some groups saw unemployment increasing in June. Here is the rate for African Americans.
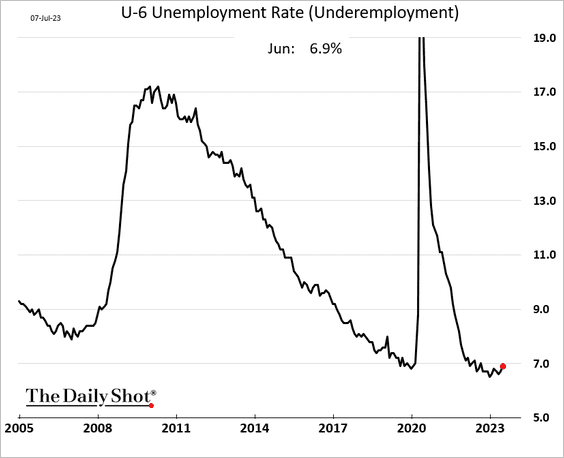
– Other indicators also point to a softening labor market. Underemployment increased.
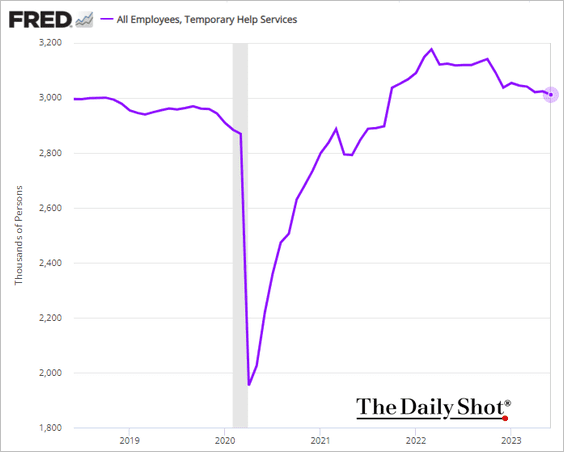
– Temp help services numbers continue to trend lower.
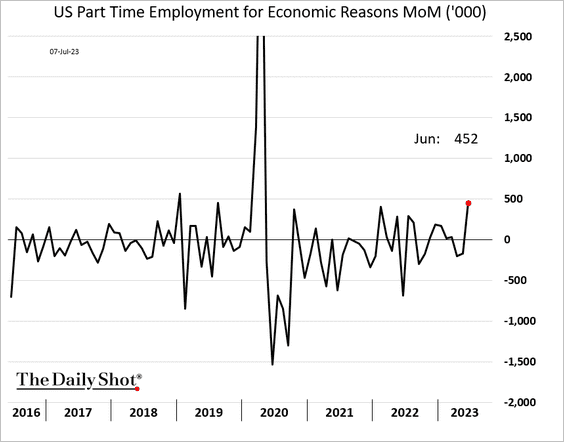
– Part-time employment for “economic reasons” jumped.
– By the way, unemployment, a lagging indicator, is typically flat during the 12 months leading up to a recession.
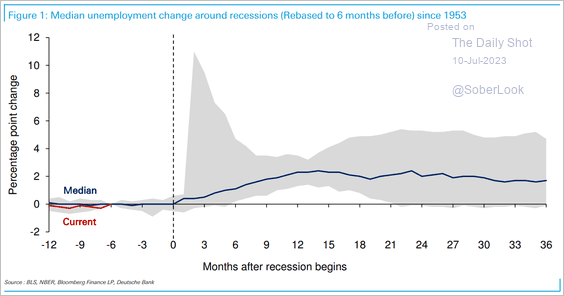 Source: Deutsche Bank Research
• Prime-age labor force participation hit a multi-year high. This is good news from the Fed’s perspective because the trend should keep wage growth capped.
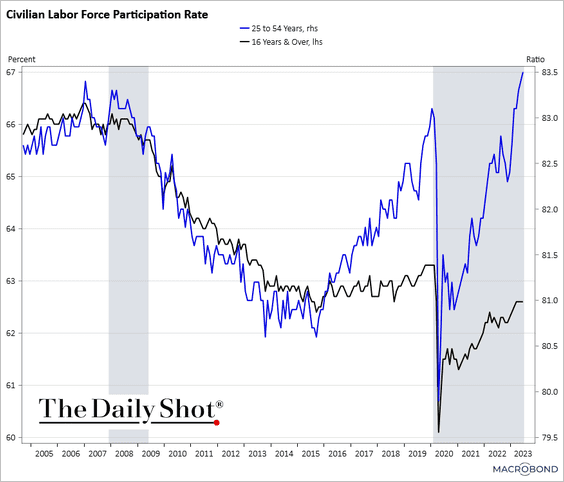 Source: Chart and data provided by Macrobond
 Source: @axios Read full article
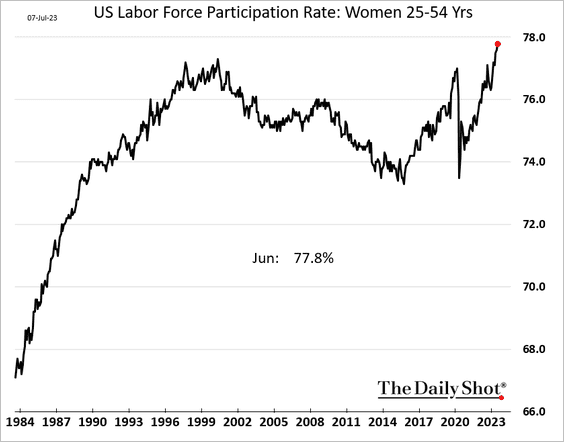
– Labor force participation among prime-age women reached a record high.
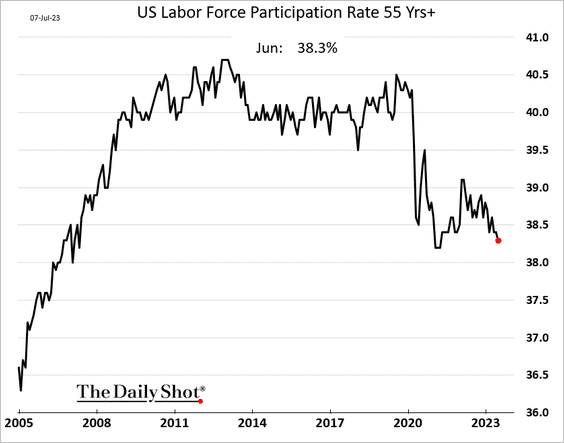
– But participation among Americans 55 and older declined further.
We will have additional updates on the jobs report tomorrow.
——————–
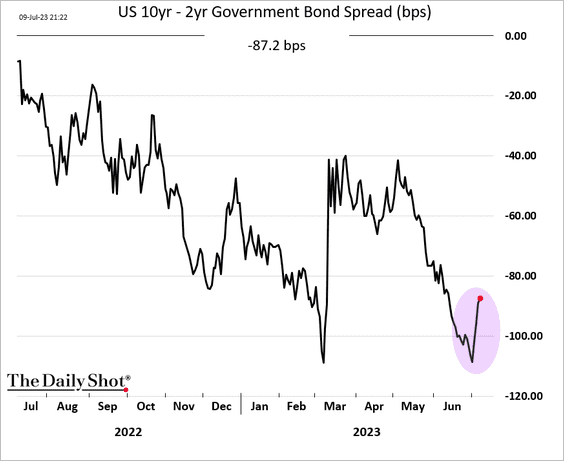
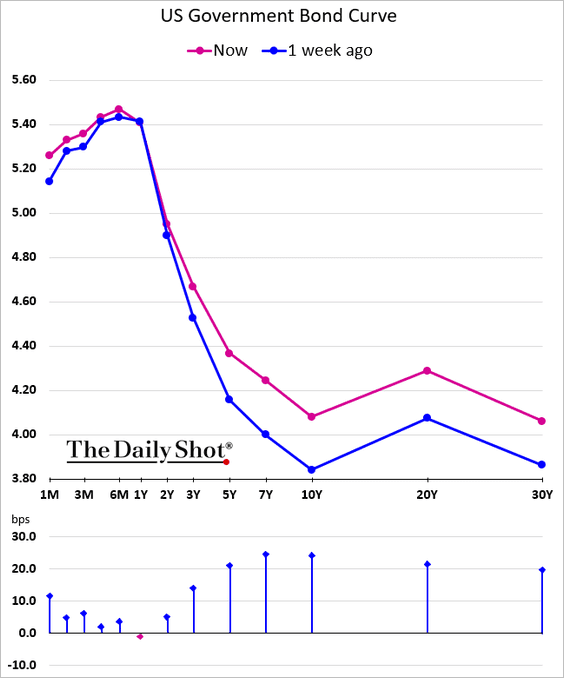
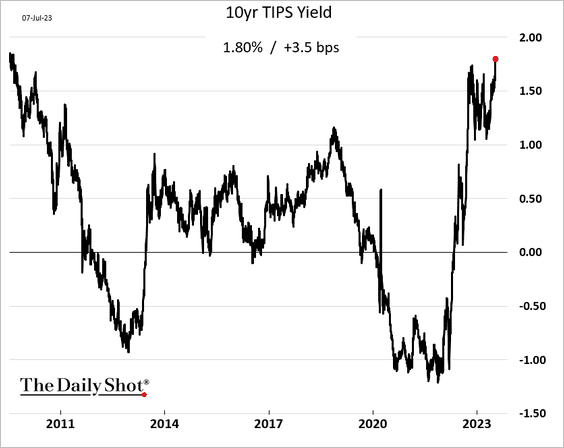
2. Longer-dated Treasury yields climbed further after the payrolls report.
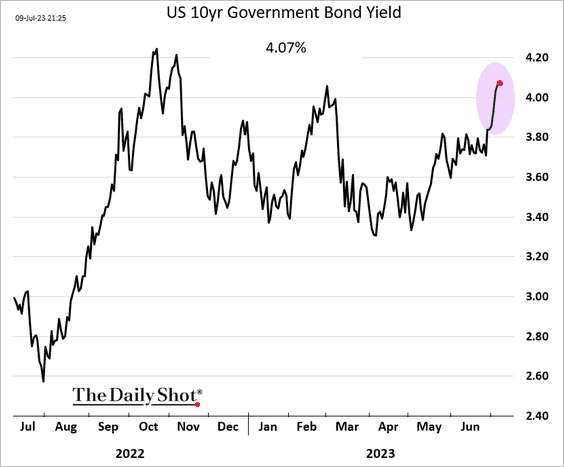
The yield curve steepened.
• The 10-year TIPS yield (real yield) hit the highest level since 2009.
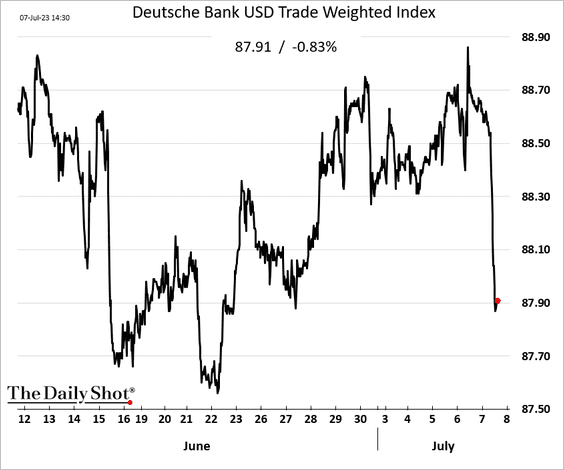
• The dollar declined.
——————–
3. The Redbook index of same-store sales is now almost flat year-over-year.
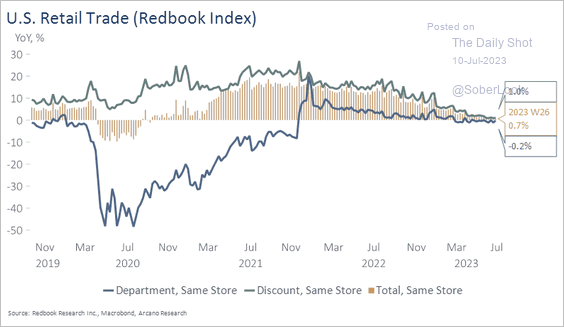 Source: Arcano Economics
4. This chart shows US goods imports by source.
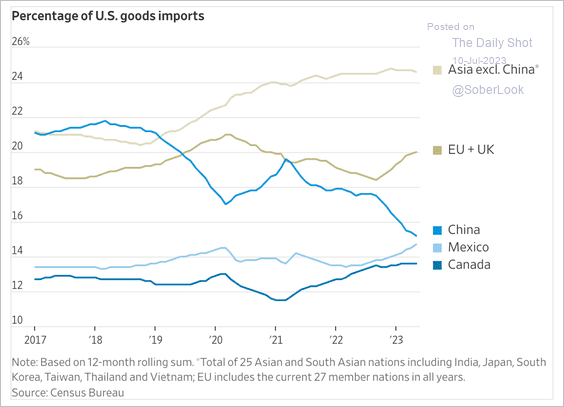 Source: @WSJ Read full article
5. Anticipated population stagnation in the upcoming decades is expected to contribute to further deceleration in potential GDP growth.
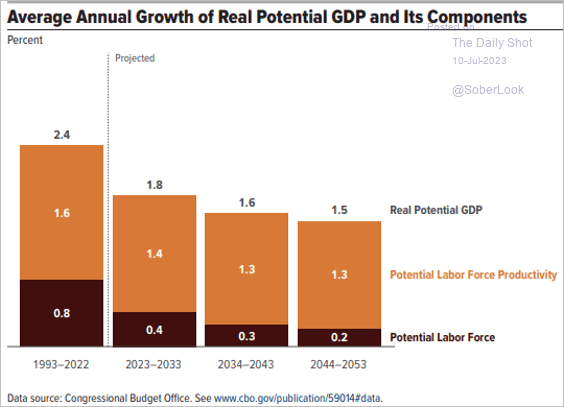 Source: CBO
Back to Index
Canada
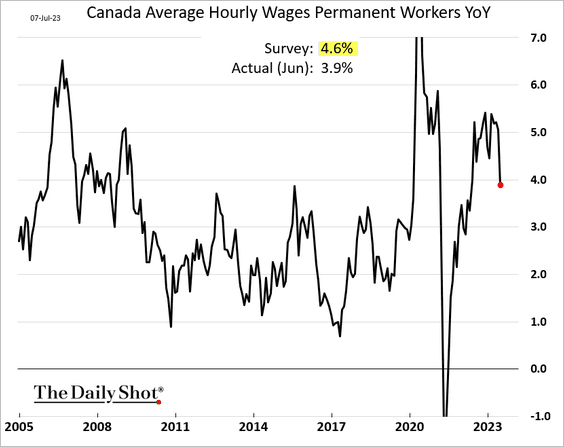
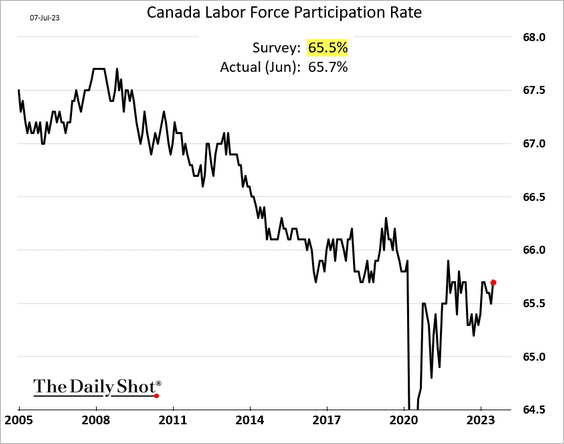
1. The June employment report topped expectations.
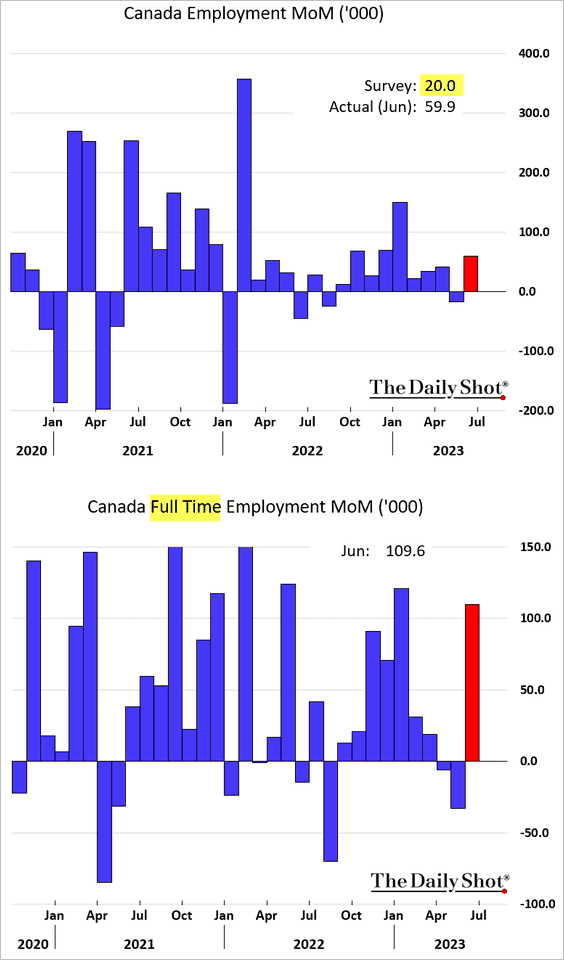
• But wage growth declined sharply.
• The unemployment rate increased …
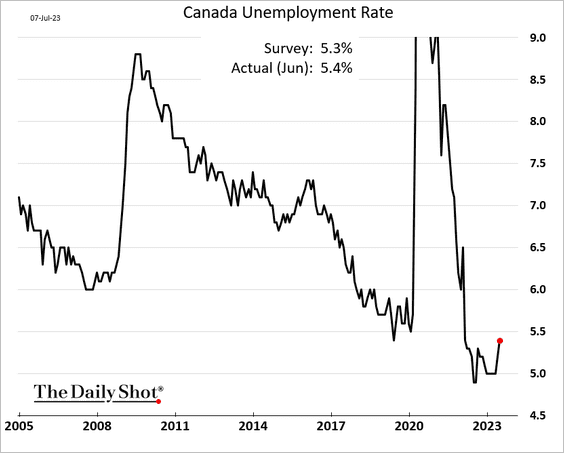
… as more Canadians entered the labor force.
• Here is the breakdown by sector.
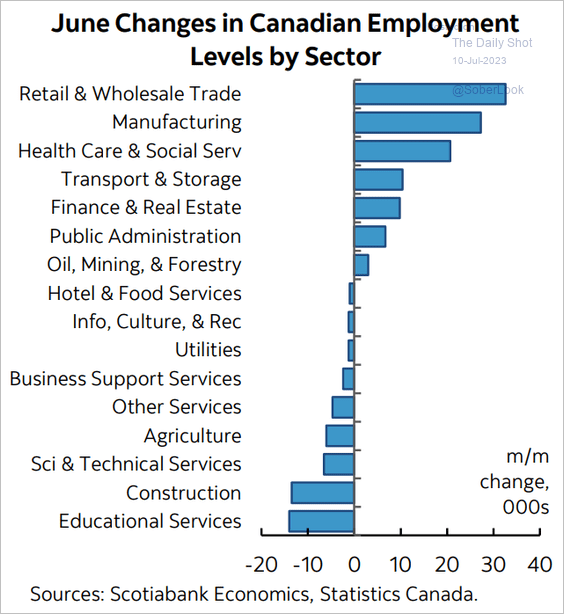 Source: Scotiabank Economics
——————–
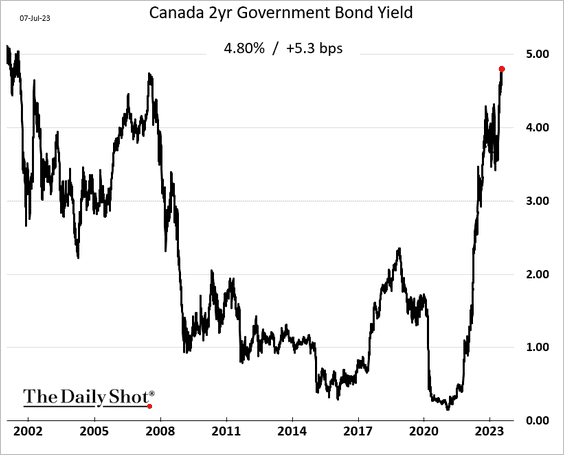
2. The 2-year yield reached 4.8% for the first time since 2001.
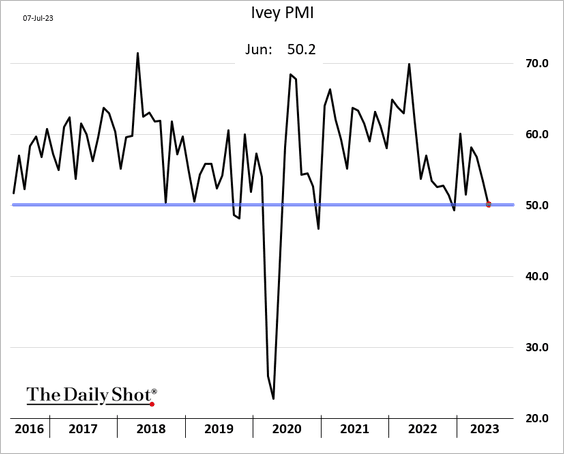
3. The Ivey PMI showed business activity growth stalling in June.
Back to Index
The Eurozone
1. EUR/USD has been resilient despite weaker economic data versus the US.
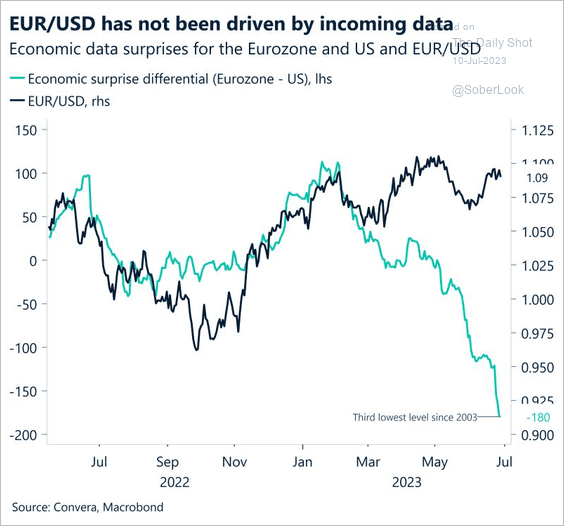 Source: Convera
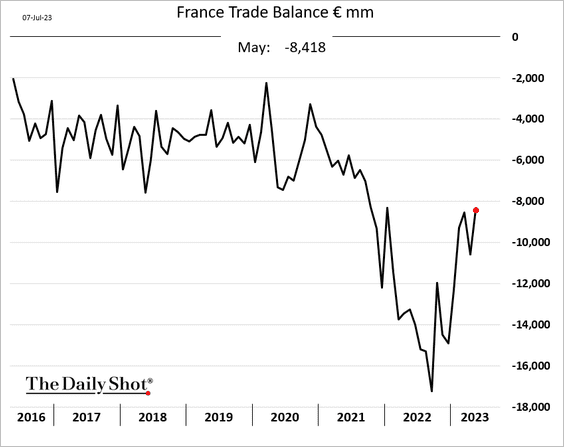
2. French trade deficit narrowed in May.
3. Commerzbank’s leading indicator for Germany looks recessionary.
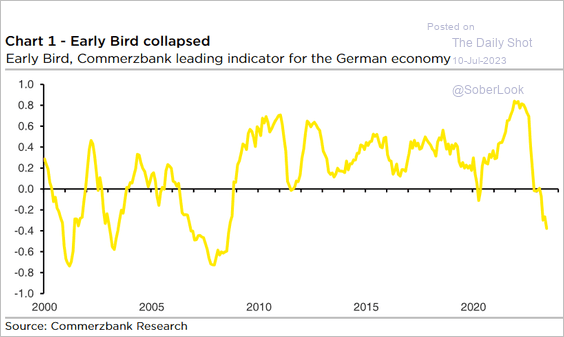 Source: Commerzbank Research
4. Euro-area unemployment has been running below the natural rate of unemployment, indicating tightness in the labor market.
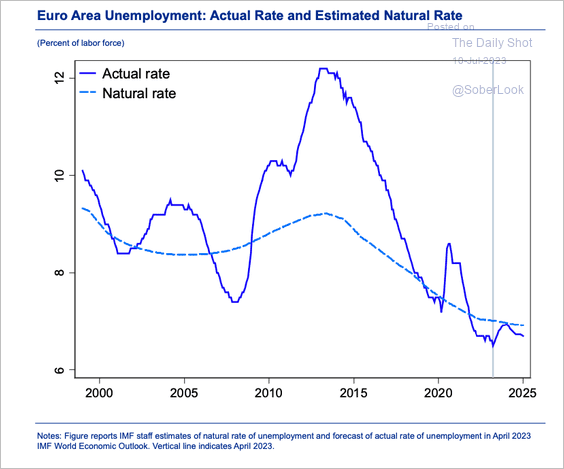 Source: ECB Read full article
Back to Index
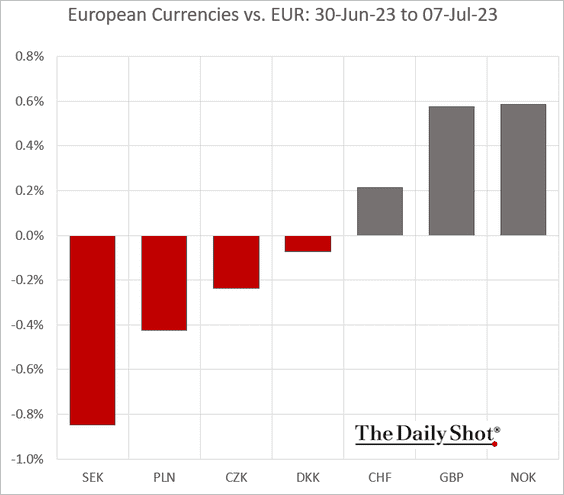
Europe
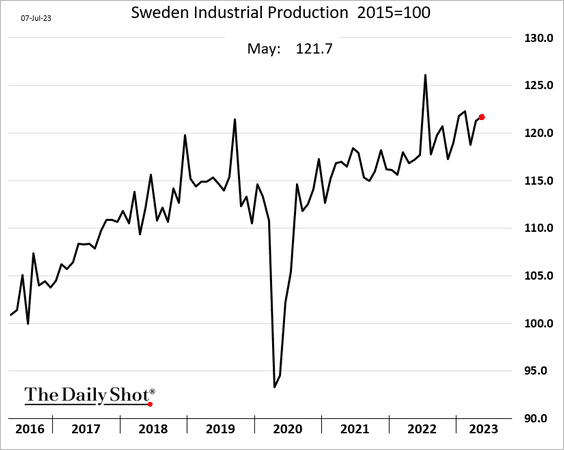
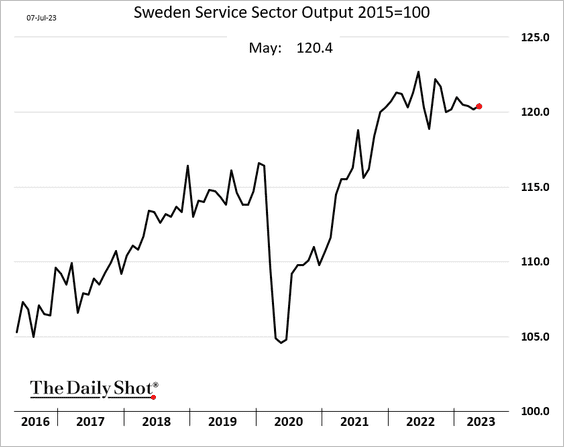
1. Let’s begin with Sweden.
• Industrial and services output indicators edged higher in May.
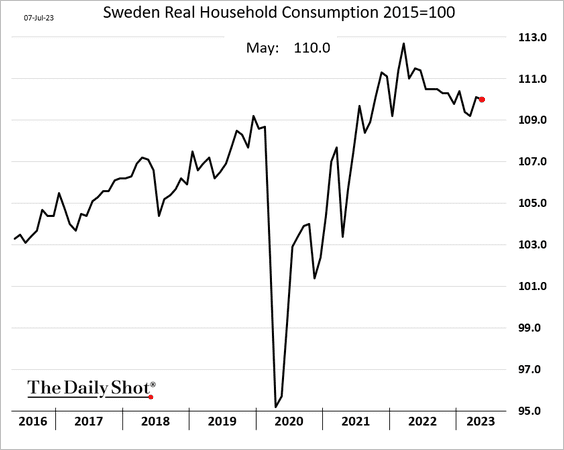
• But household consumption inched lower.
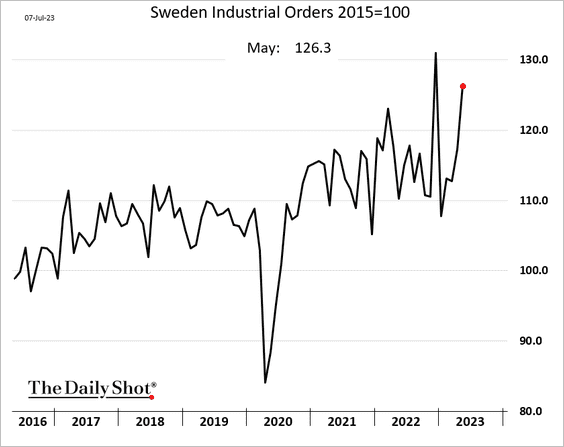
• Industrial orders jumped.
• It was another rough week for the Swedish krona.
——————–
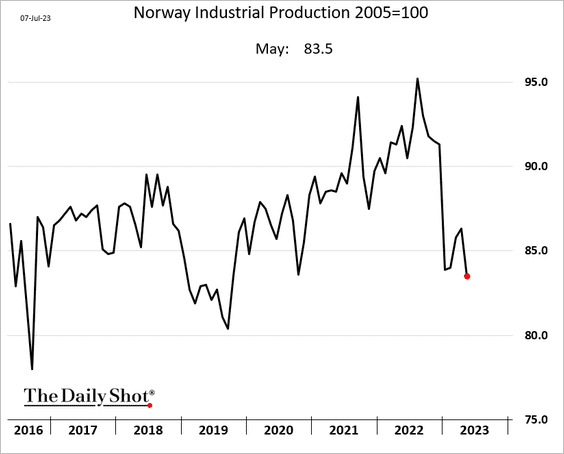
2. Norway’s industrial production contracted further in May.
3. This map shows the share of people in the EU who are not studying and are outside the labor force.
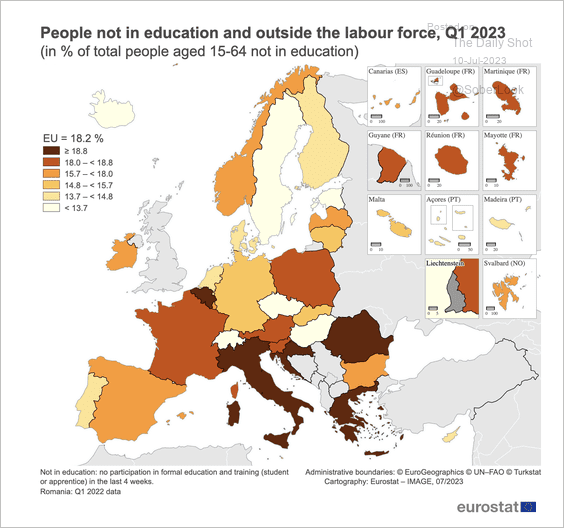 Source: Eurostat Read full article
Back to Index
Asia-Pacific
1. The yen rallied last week.
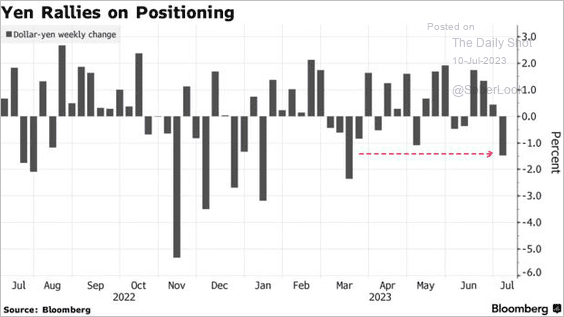 Source: @hcarterjohnson, @AnyaAndrianovaV, @markets Read full article
2. Taiwan’s exports slumped in June.
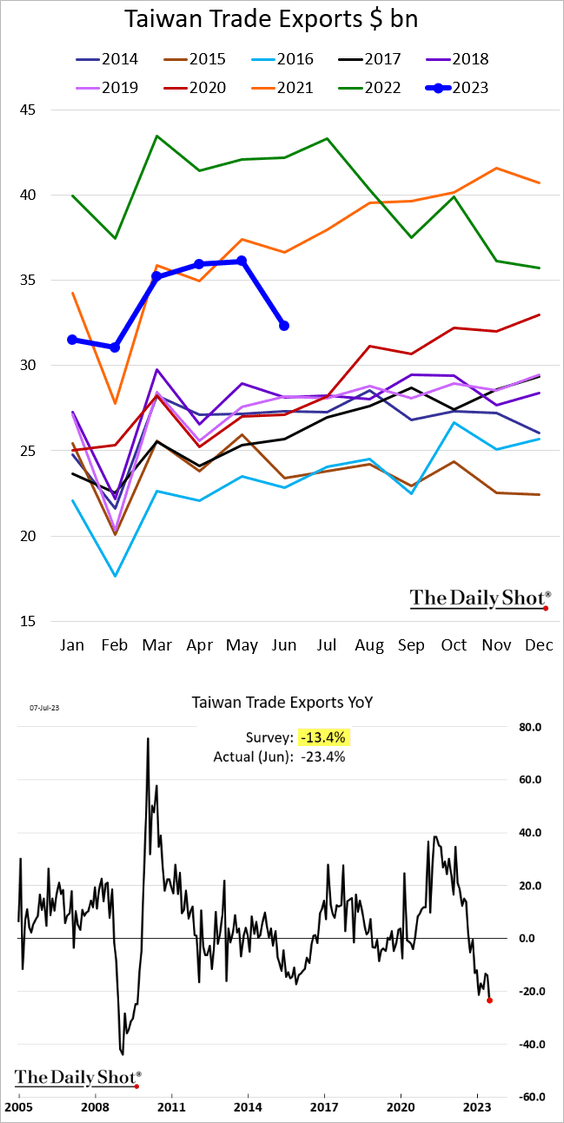
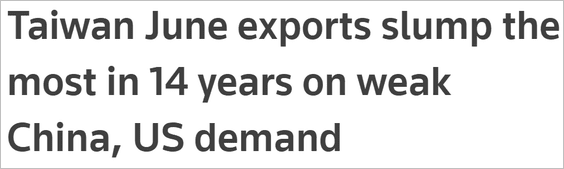 Source: Reuters Read full article
——————–
3. The RBA’s cash rate is barely restrictive compared to previous dispersions above the neutral policy rate.
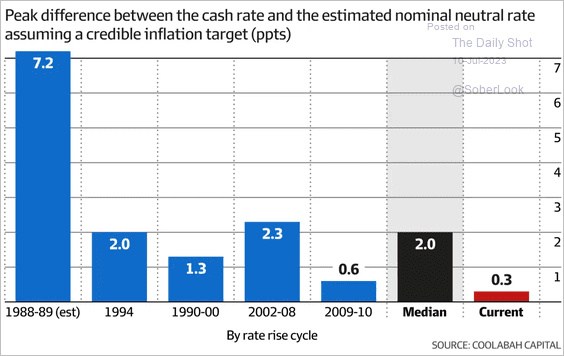 Source: Coolabah Capital Read full article
Back to Index
China
1. The change in money supply has been below average in recent years.
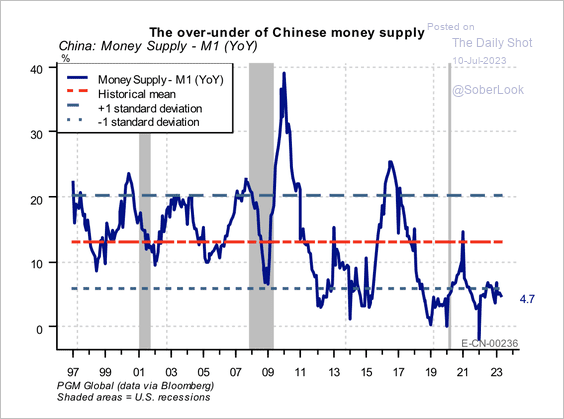 Source: PGM Global
2. Hedge fund short positions have been on the rise, especially in the communication and real estate sectors.
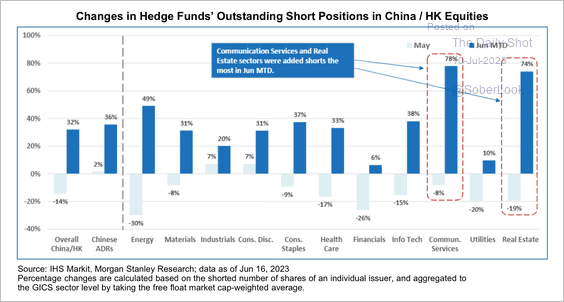 Source: Morgan Stanley Research
3. Electric vehicles boosted China’s value added per unit of car export.
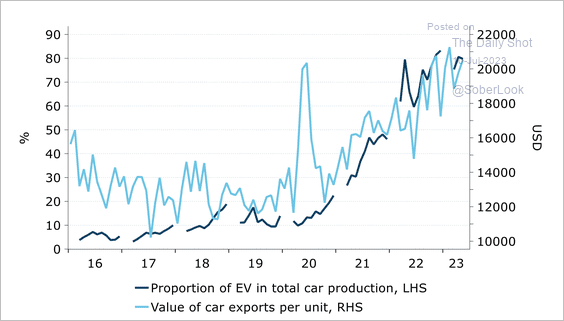 Source: @ANZ_Research
4. China is mostly self-sufficient in grains.
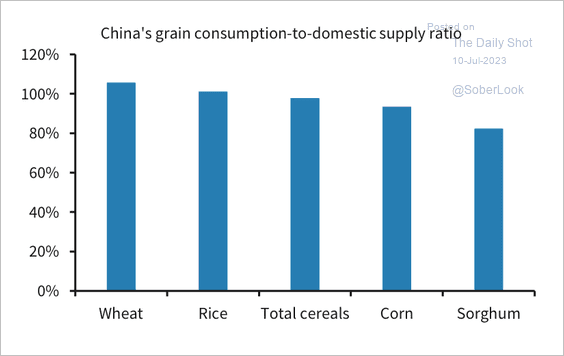 Source: Barclays Research
5. It’s been toasty in Beijing.
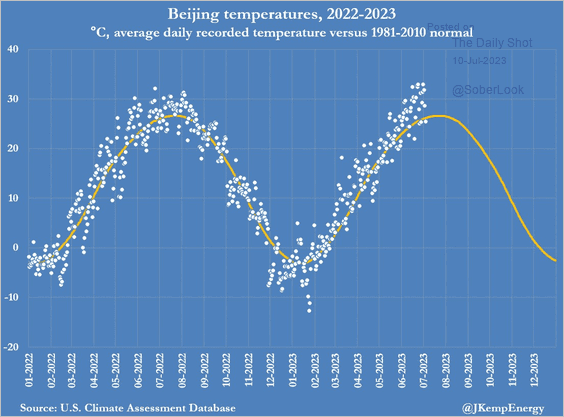 Source: @JKempEnergy
Back to Index
Emerging Markets
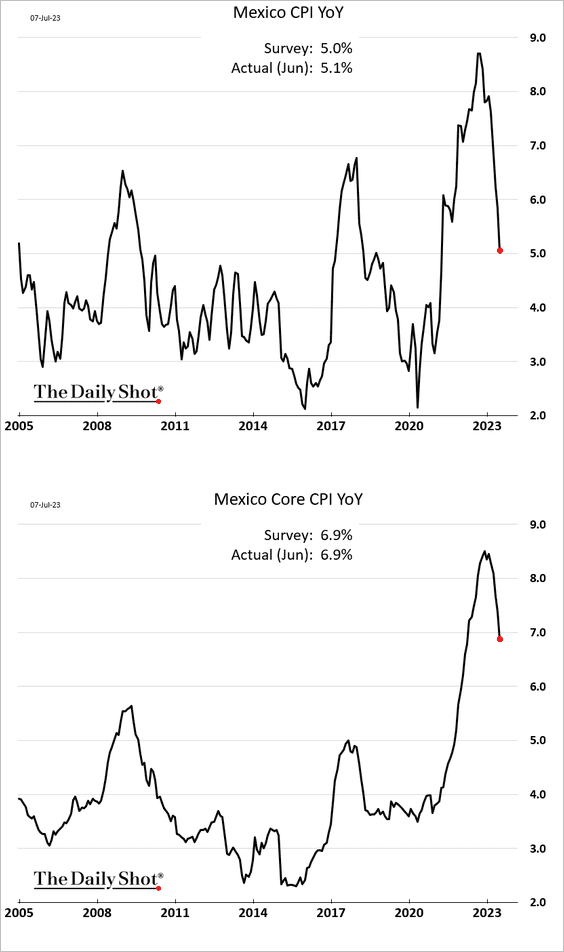
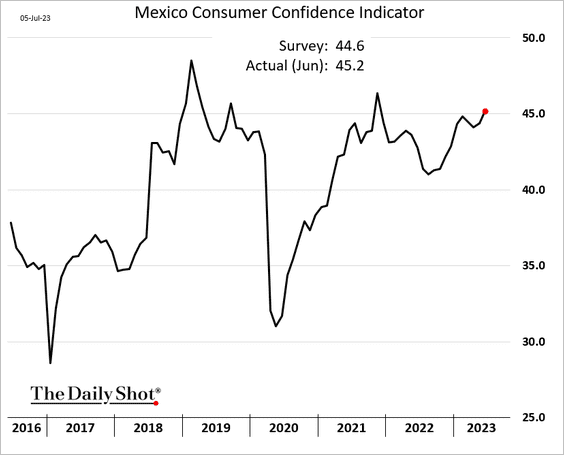
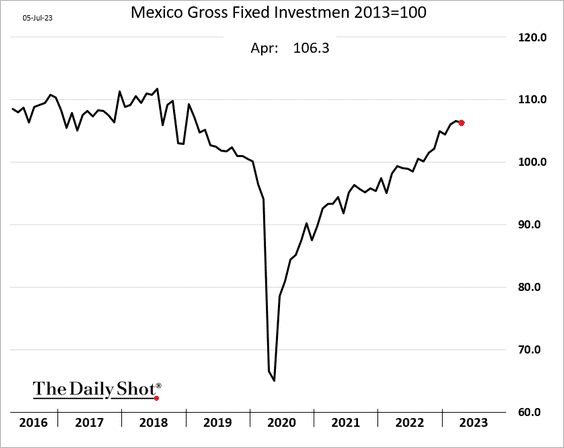
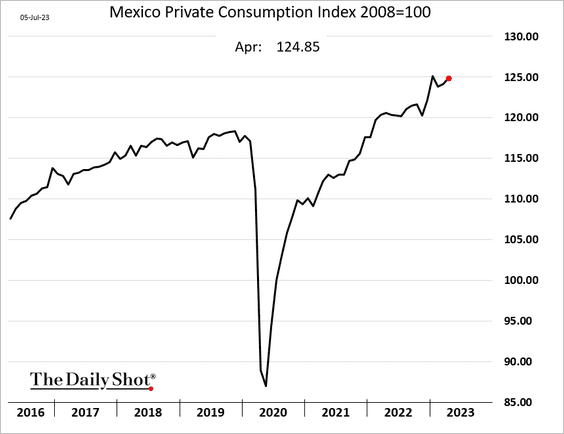
1. Let’s begin with some updates on Mexico.
• Inflation (moderating):
• Consumer confidence (trending higher):
• Business investment (peaking?):
• Private consumption:
——————–
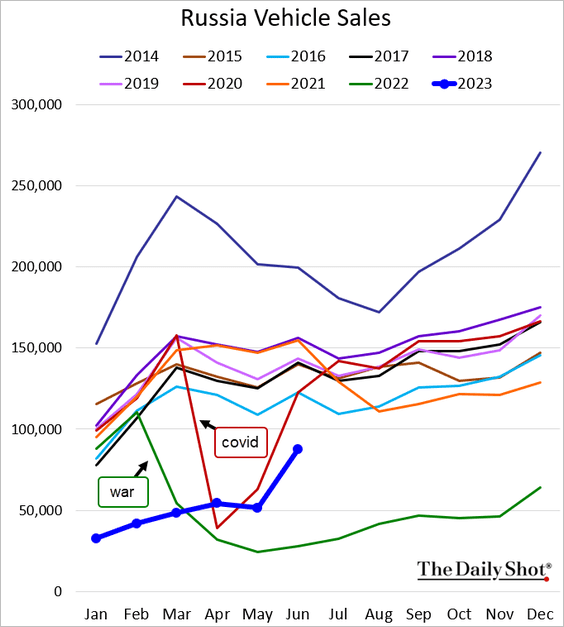
2. Russia’s automobile sales jumped in June.
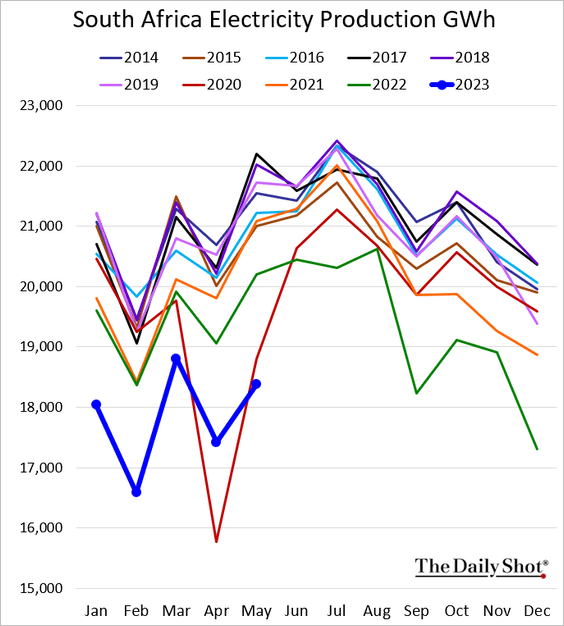
3. South Africa’s electricity production remains depressed (multi-year lows).
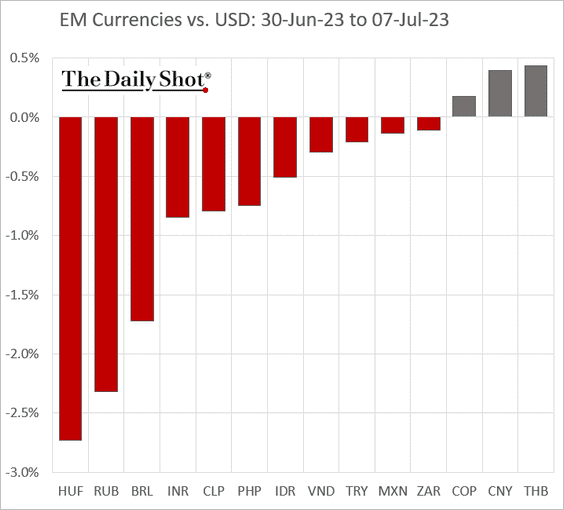
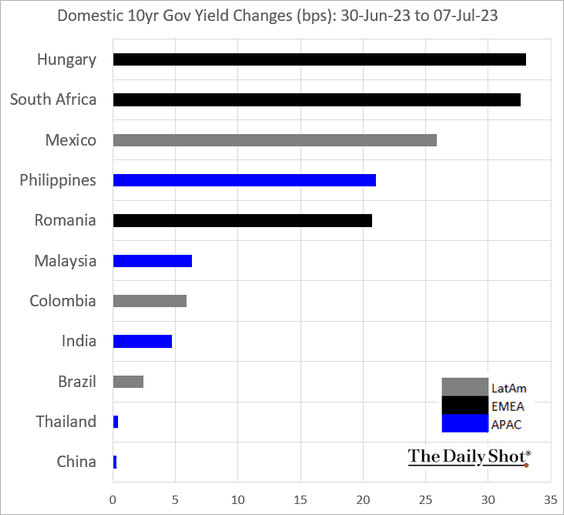
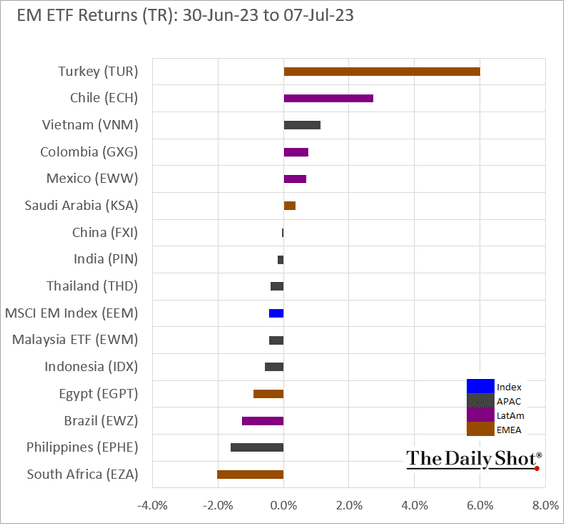
4. Next, we have some performance data from last week.
• Currencies:
• Bond yields:
• Equity ETFs:
Back to Index
Commodities
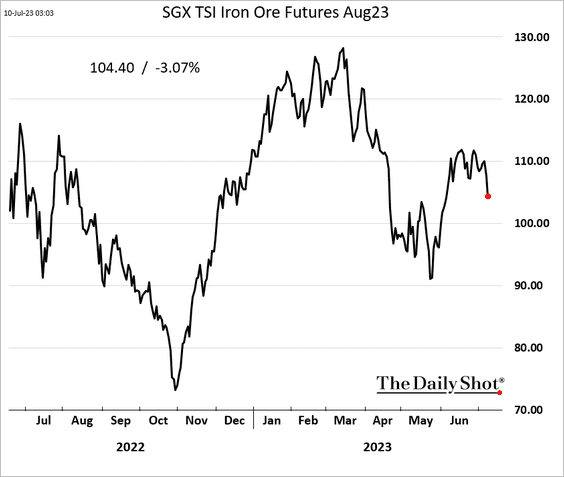
1. The rebound in iron ore prices is fading.
2. Solar capacity growth is expected to drive demand for silver (according to ANZ).
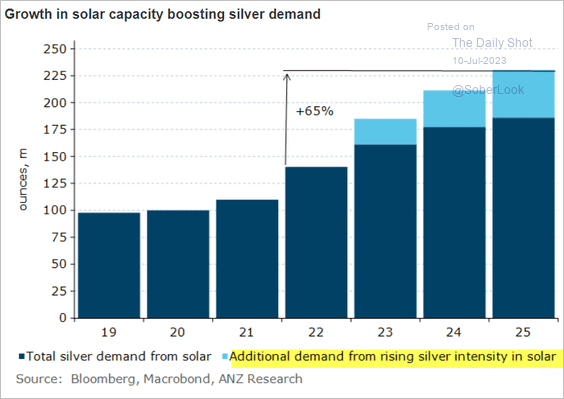 Source: @ANZ_Research
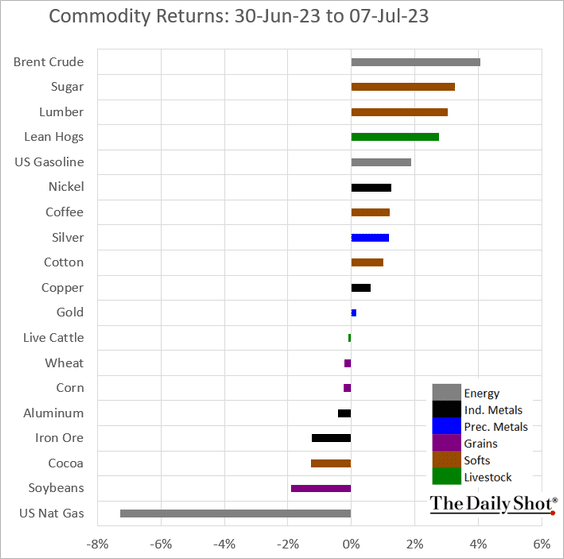
3. Here is last week’s performance across key commodity markets.
Back to Index
Energy
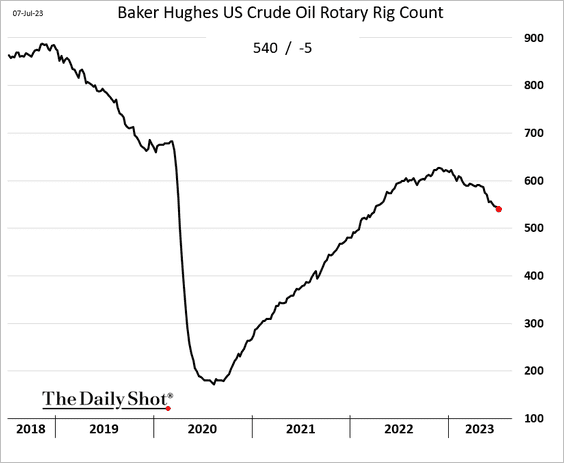
1. US rig count continues to decline.
2. US refining capacity edged higher in 2023.
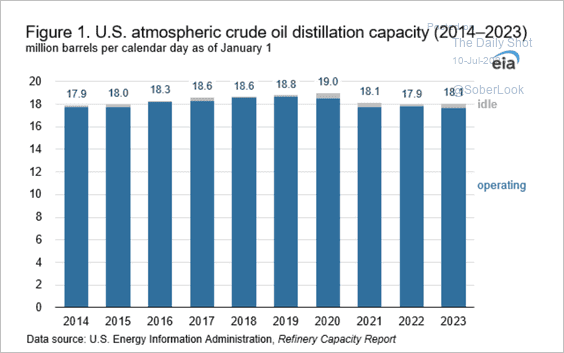 Source: @EIAgov Read full article
3. Net US crude oil imports are at multi-year lows for this time of the year.
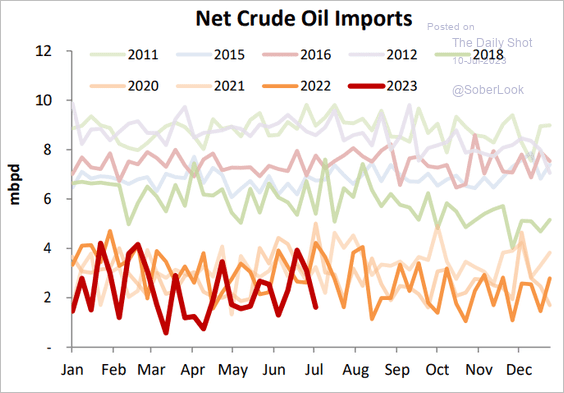 Source: Princeton Energy Advisors
Back to Index
Equities
1. Analysts’ targets imply a 9% increase in the S&P 500 over the next 12 months.
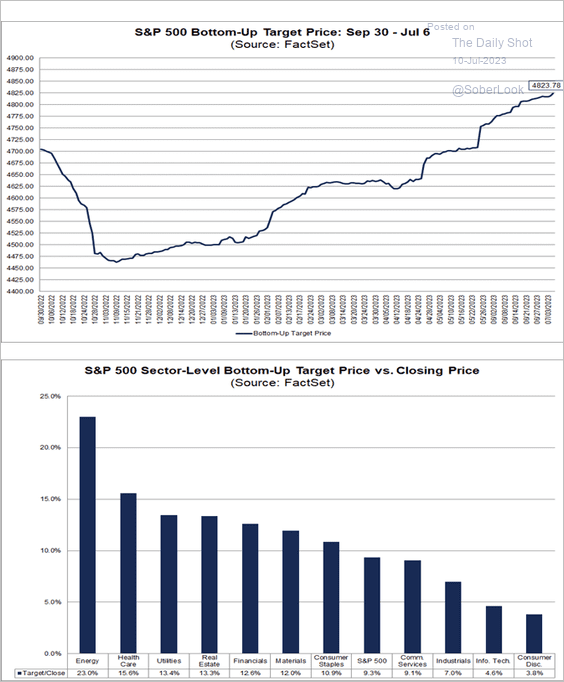 Source: @FactSet Read full article
2. The S&P 500 returns have been very concentrated (2 charts).
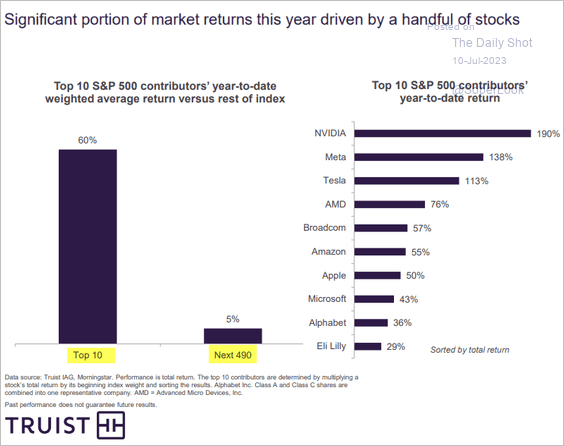 Source: Truist Advisory Services
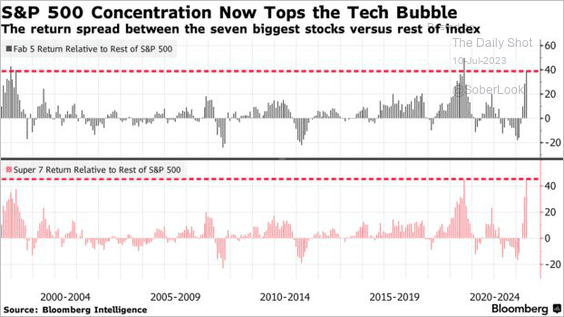 Source: @JessicaMenton, @lena_popina, @markets Read full article
——————–
3. Morgan Stanley’s sentiment indicator flipped to risk-off, which could point to a pullback in stocks. (2 charts)
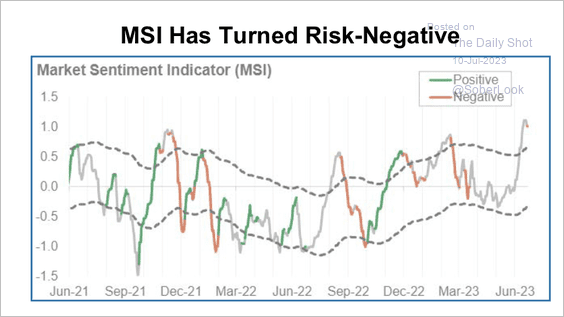 Source: Morgan Stanley Research
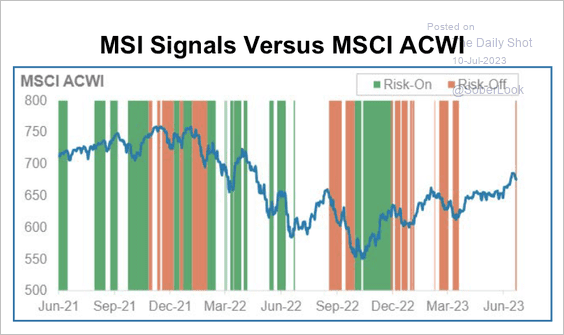 Source: Morgan Stanley Research
——————–
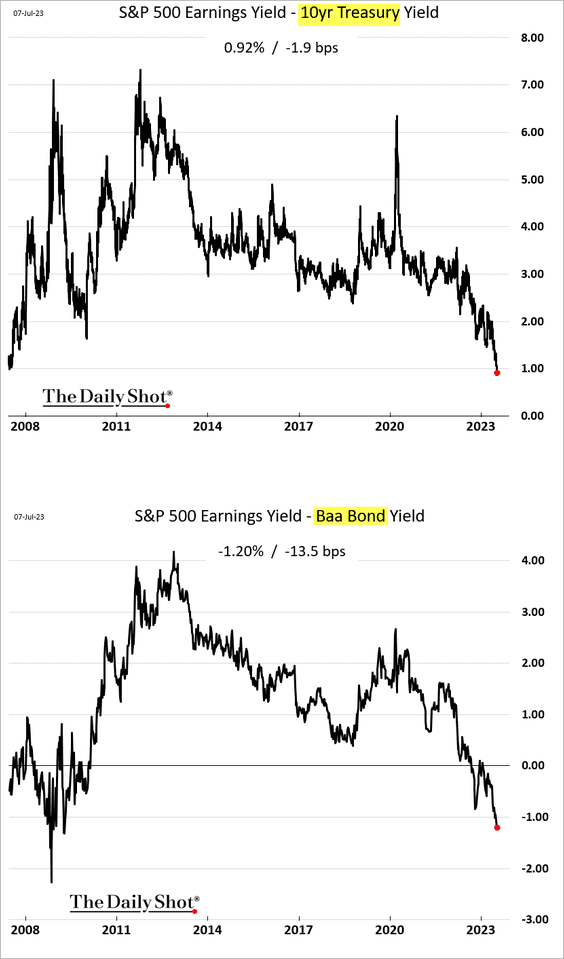
4. Compared to Treasuries and corporate bonds, stocks appear progressively less appealing.
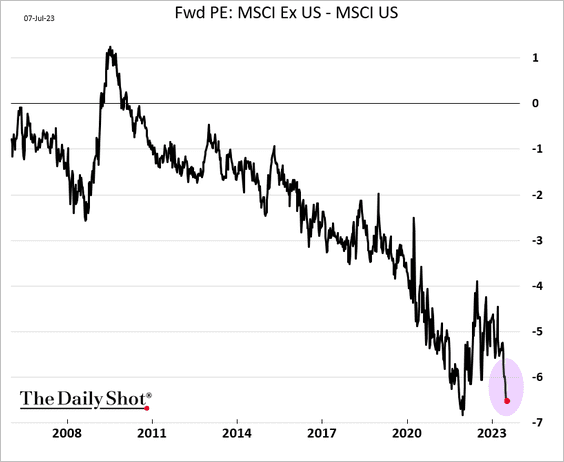
5. The valuation discount on non-US shares has widened sharply in recent months.
6. Profit margins continue to ease.
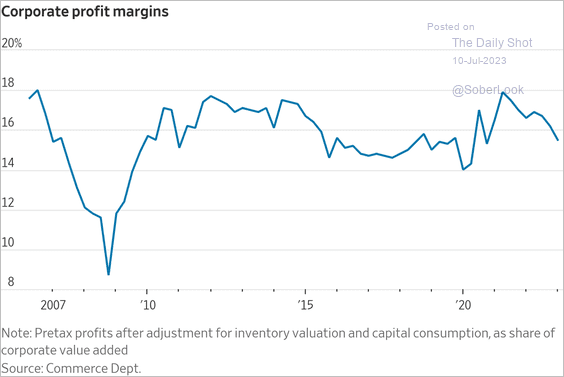 Source: @WSJ Read full article
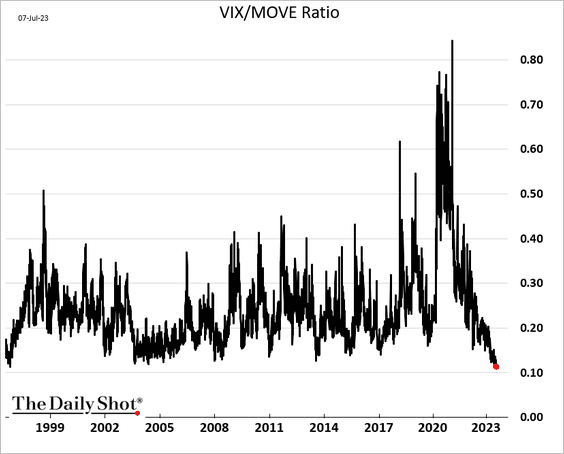
7. The VIX/MOVE ratio (equity vol vs. rates vol) hit the lowest level since 1996.
8. Next, we have some performance data from last week.
• Sectors:
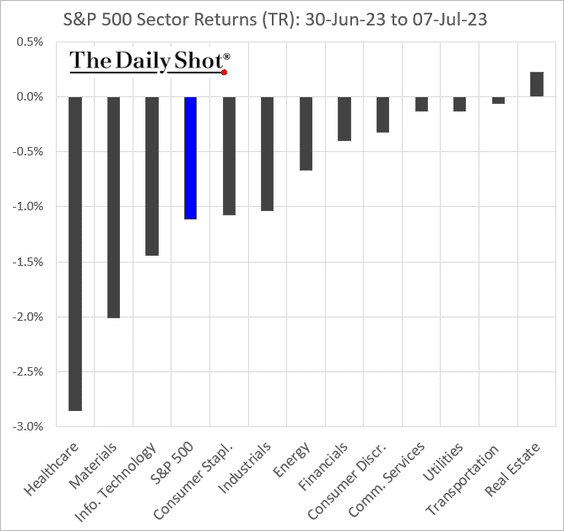
Here is healthcare:
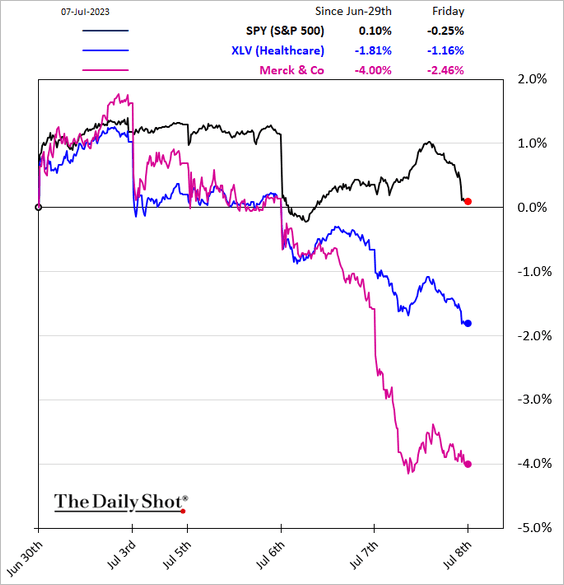
• Equity factors:
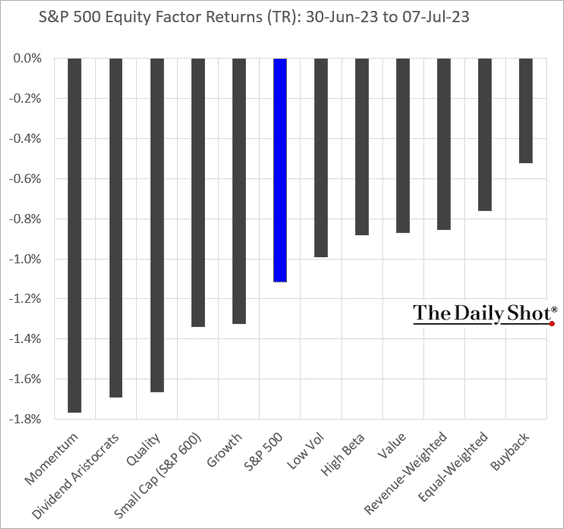
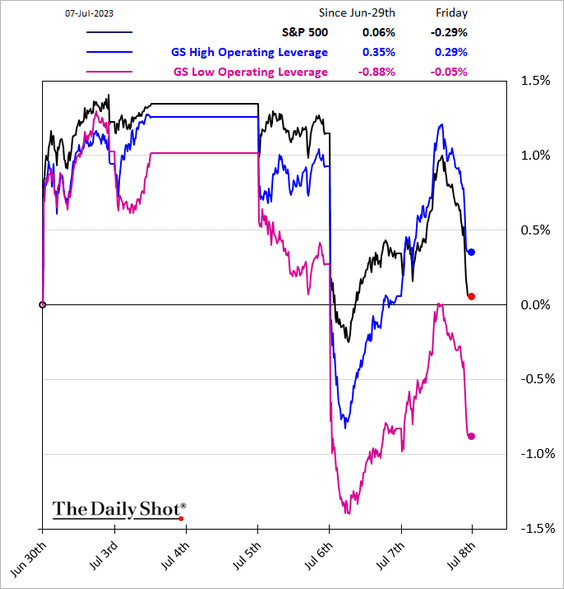
• Macro basket pairs’ relative performance:
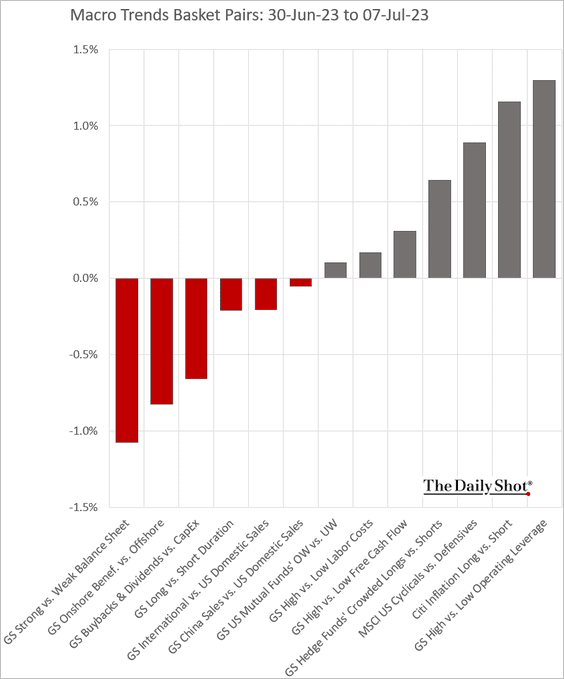
– High vs. low operating leverage:
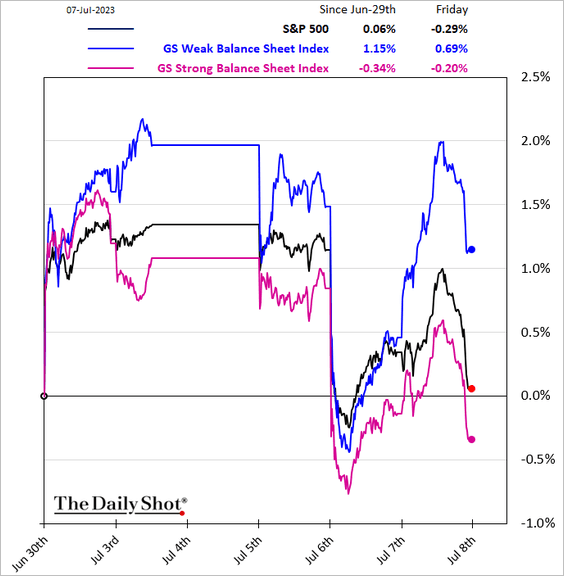
– Strong vs. weak balance sheet:
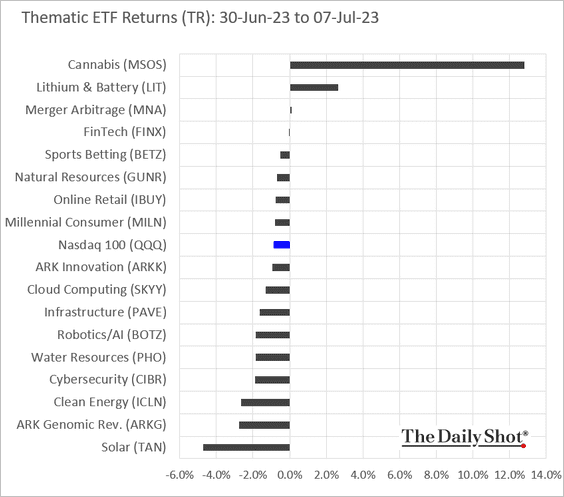
• Thematic ETFs:
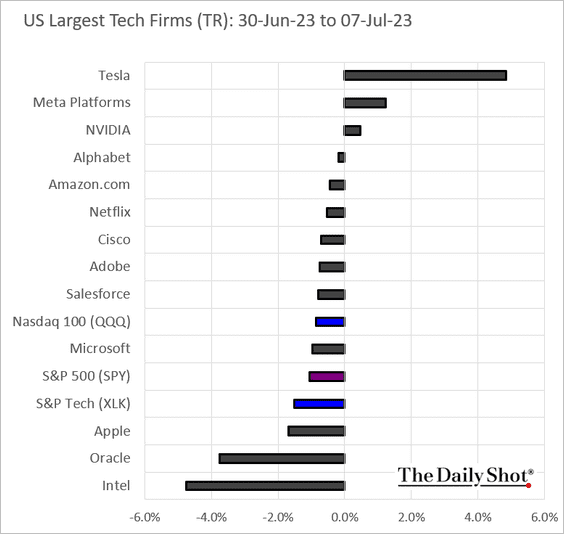
• Largest US tech stocks:
Back to Index
Credit
1. The iBoxx High Yield Bond ETF (HYG) shows improving breadth.
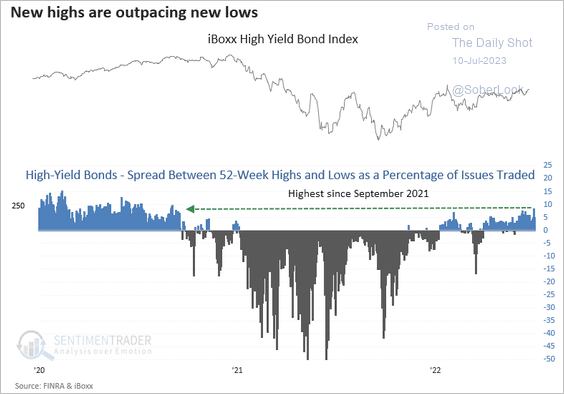 Source: SentimenTrader
But the ETF saw substantial outflows last week.
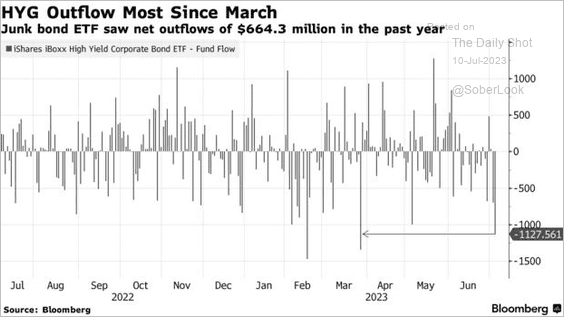 Source: @isabelletanlee, @VildanaHajric, @markets Read full article
——————–
2. Lower-rated bonds have been outperforming.
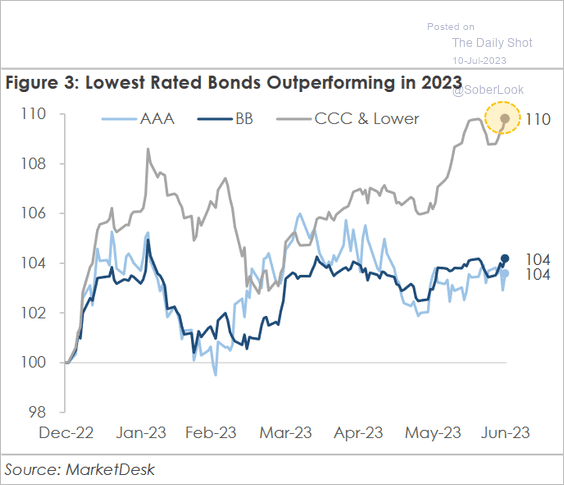 Source: MarketDesk Research
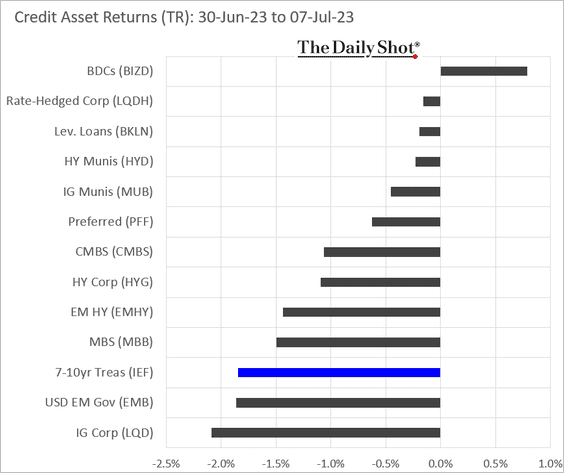
3. Here is last week’s performance by asset class.
Back to Index
Global Developments
1. The US dollar remains capped below long-term resistance after a false breakout last year.
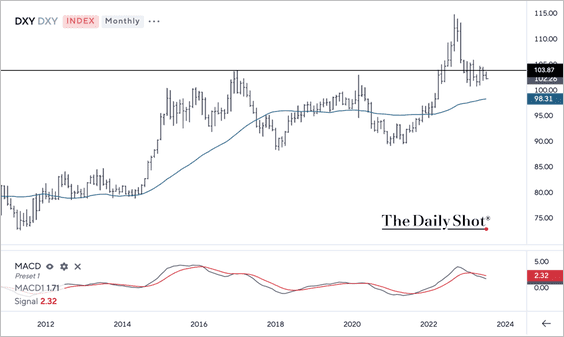 Source: Symbolik
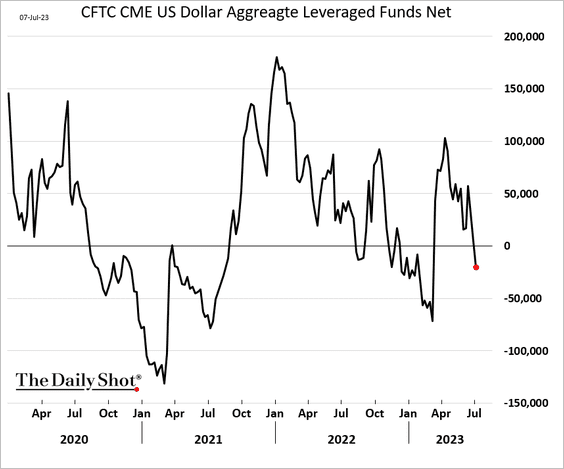
Hedge funds have turned bearish on the dollar.
——————–
2. The NBFI (non-bank financial institutions) sector has more than doubled since 2008.
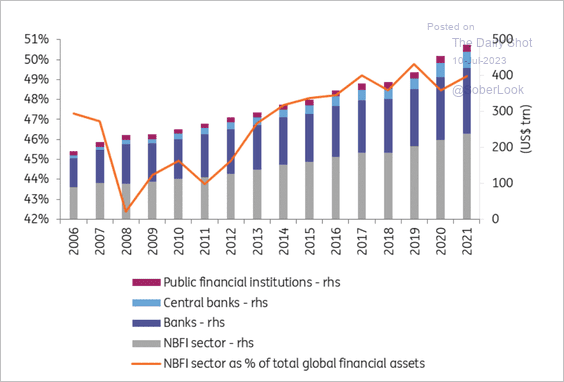 Source: ING
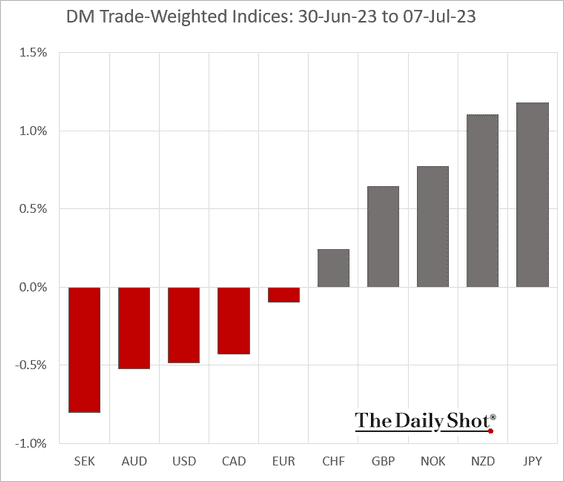
3. Here is last week’s performance data for advanced economies.
• Currency indices:
• Bond yields:
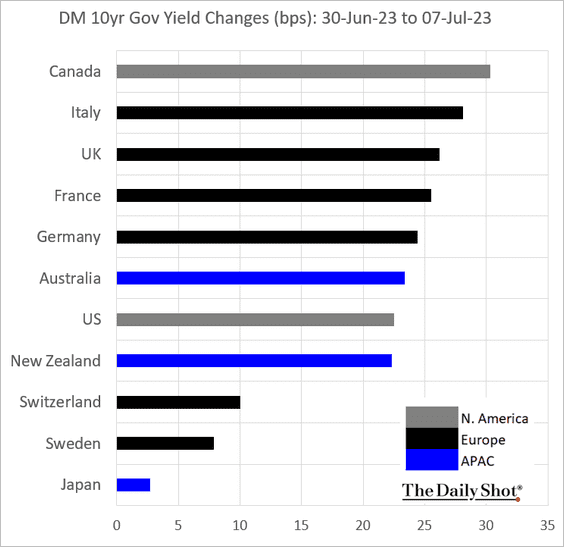
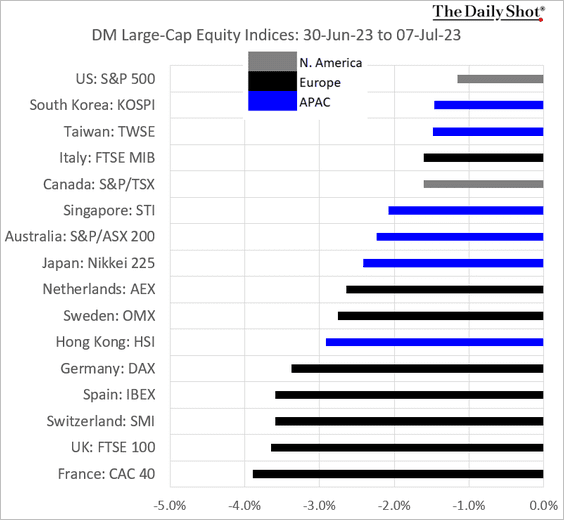
• Large-cap equity indices:
——————–
Food for Thought
1. Net migration by US region:
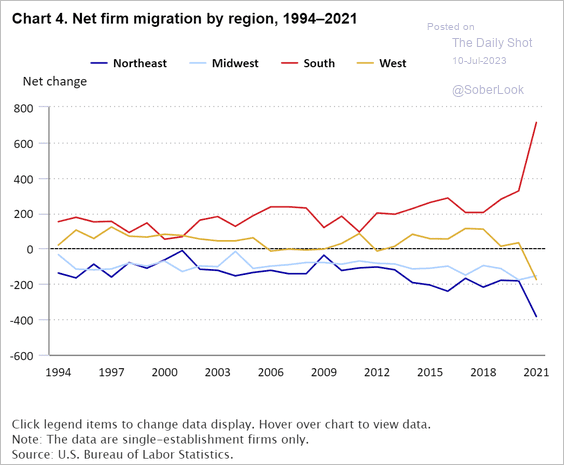 Source: BLS
2. Population pyramids for US Latino vs. non-Latino populations:
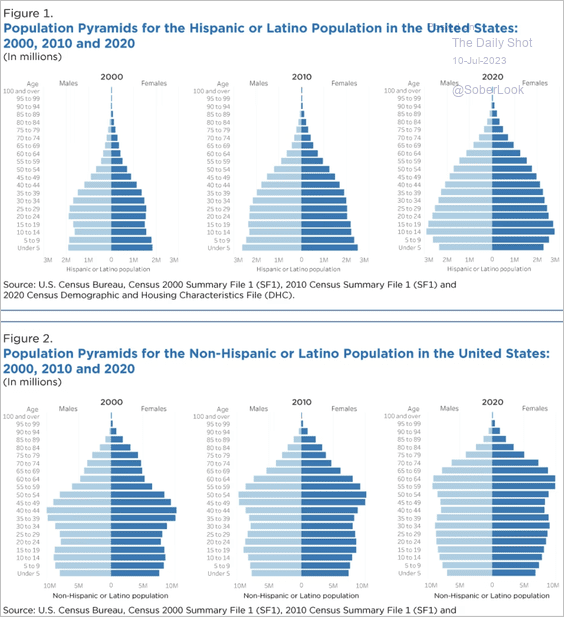 Source: Census Bureau Read full article
3. Global food per capita:
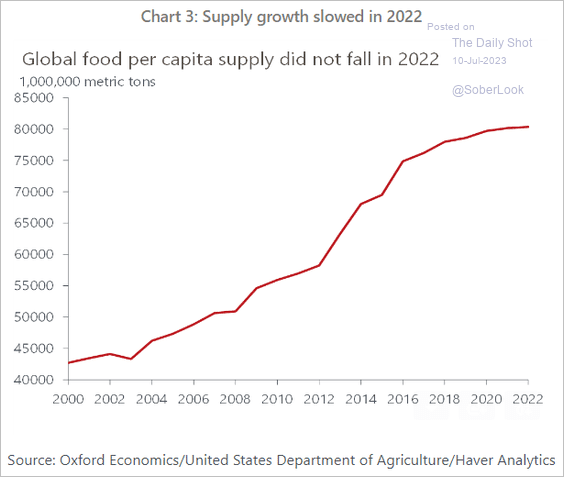 Source: Oxford Economics
4. Concerns about total mobilization in Russia:
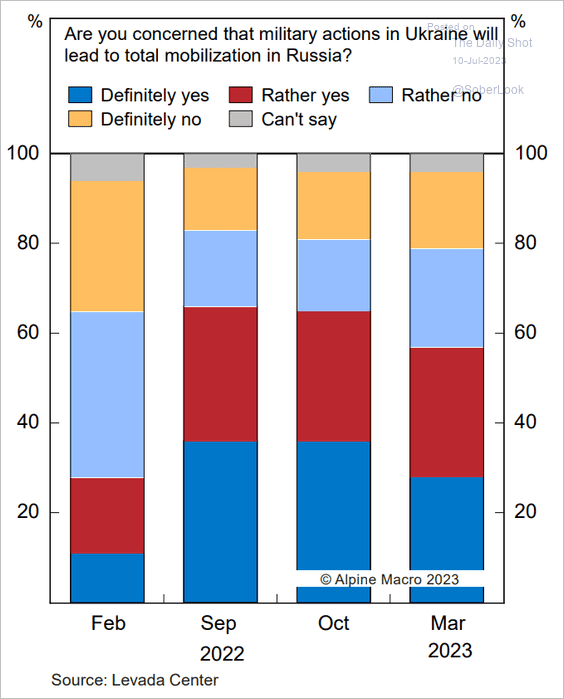 Source: Alpine Macro
5. The hottest June on record:
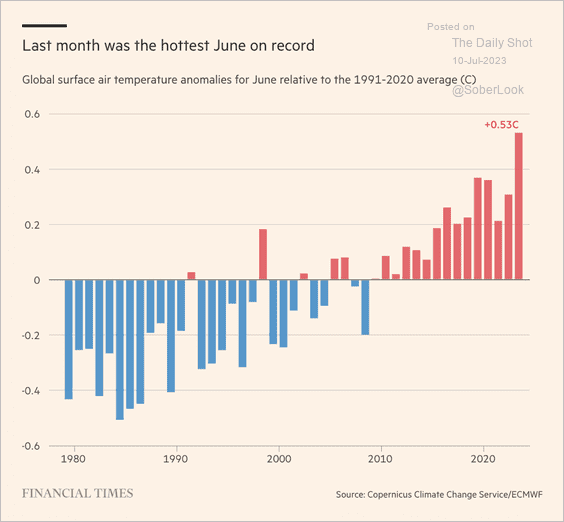 Source: @financialtimes Read full article
6. Political polarization:
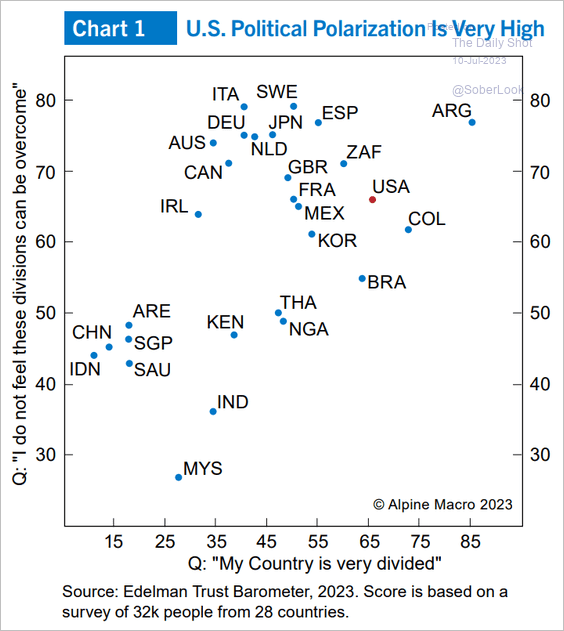 Source: Alpine Macro
7. Self-identification on social issues:
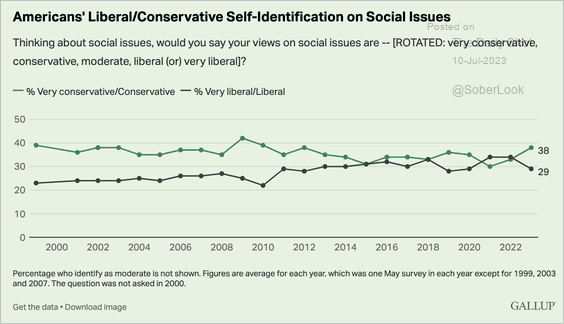 Source: Gallup Read full article
8. Views on gender-neutral pronouns:
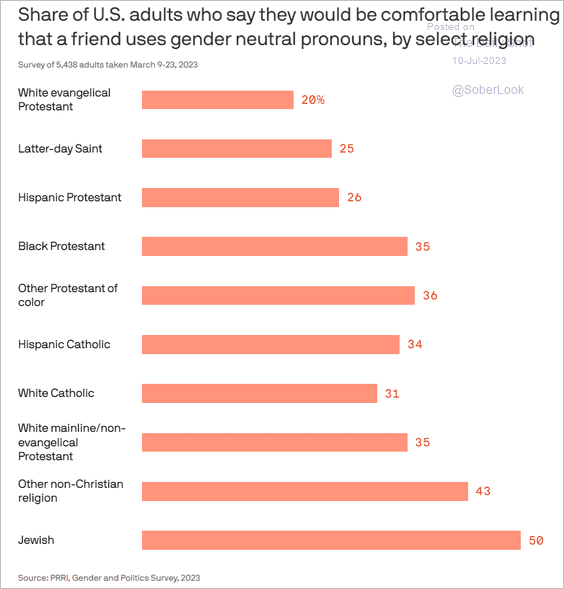 Source: @axios Read full article
9. Cricket team ratings:
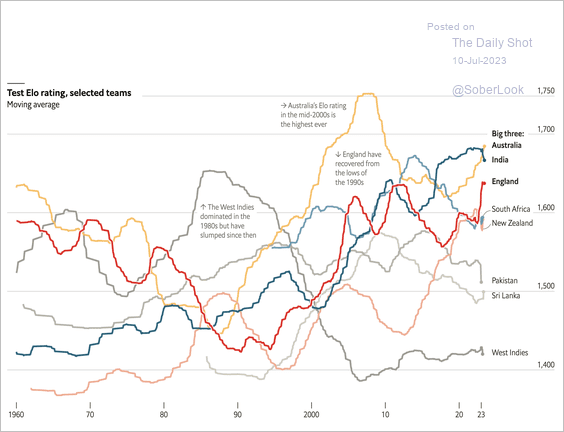 Source: The Economist Read full article
——————–
Back to Index