
The Daily Shot: 11-Jul-23
• The United States
• Canada
• The United Kingdom
• The Eurozone
• Europe
• Japan
• China
• Emerging Markets
• Cryptocurrency
• Energy
• Equities
• Alternatives
• Credit
• Rates
• Global Developments
• Food for Thought
The United States
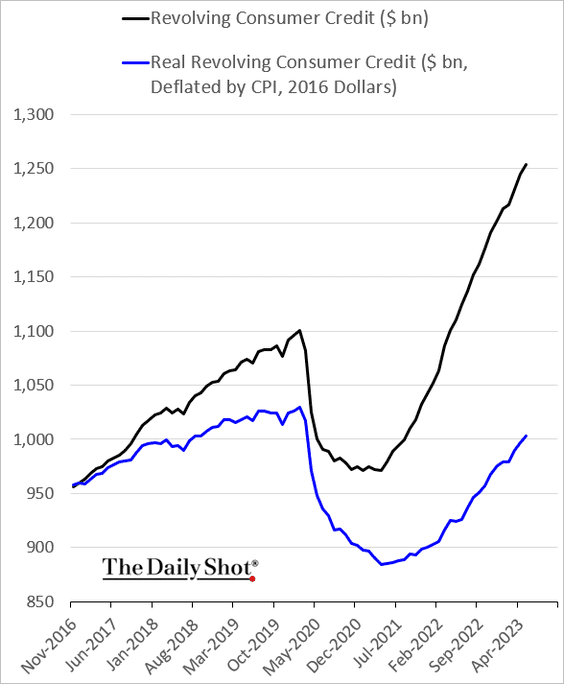
1. Consumer credit growth slowed sharply in May.
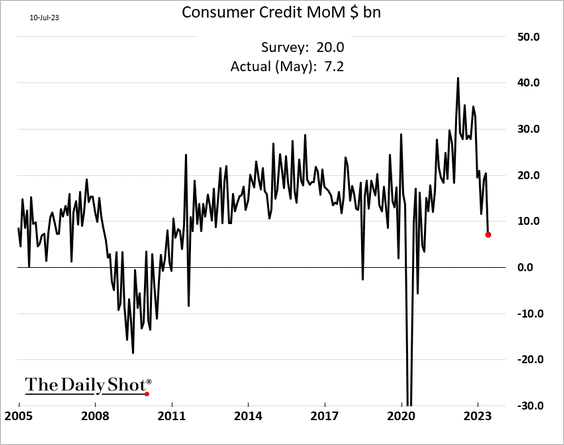
 Source: MarketWatch Read full article
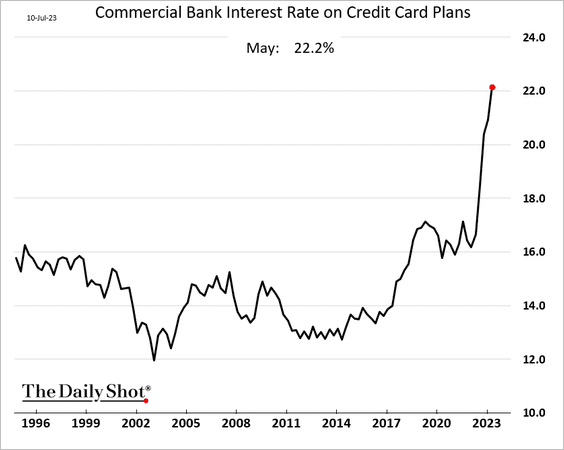
• Average credit card rate climbed above 22%, a new high.
Nonetheless, credit card balances continue to climb, …
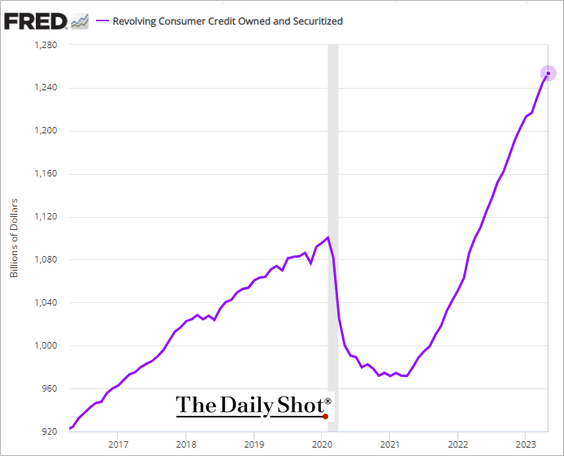
… as households increasingly rely on plastic to maintain their spending.
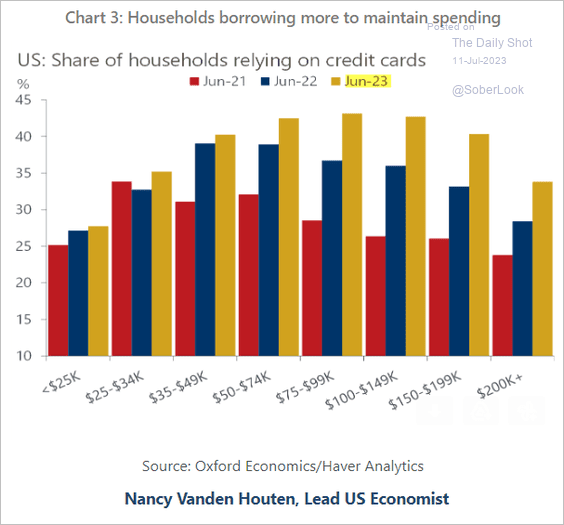 Source: Oxford Economics
– Real credit card balances remain below pre-COVID levels.
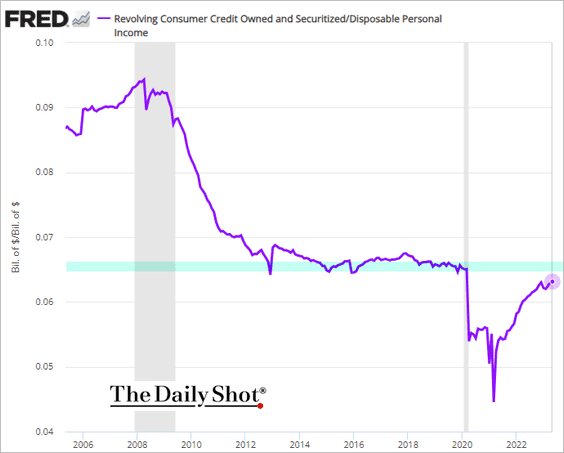
– This chart shows credit card balances as a share of disposable income.
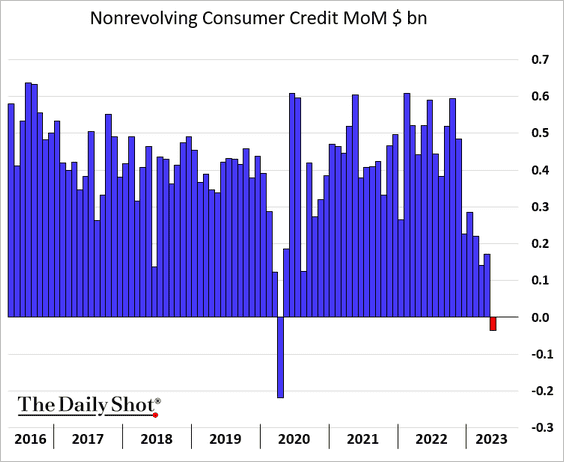
• Non-revolving consumer credit (mostly auto loans and student debt) declined for the first time since the pandemic shock.
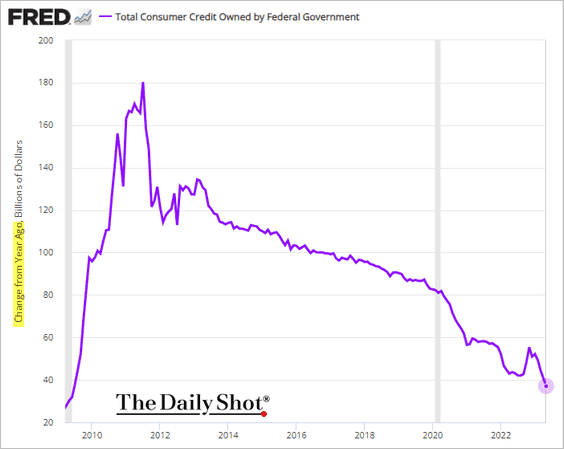
– Student debt growth continues to slow (the chart shows year-over-year changes).
——————–
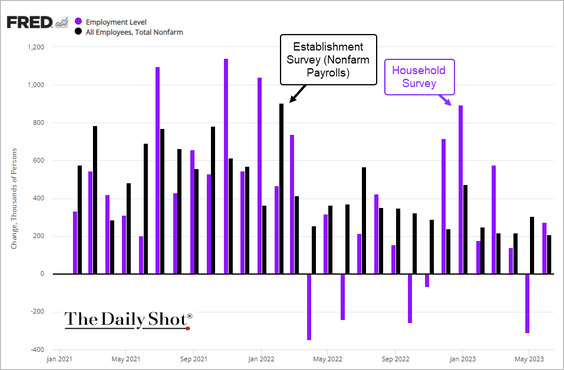
2. Next, we have some data on the labor market.
• The Household Survey vs. the Establishment Survey:
• Job gains in goods and service sectors:
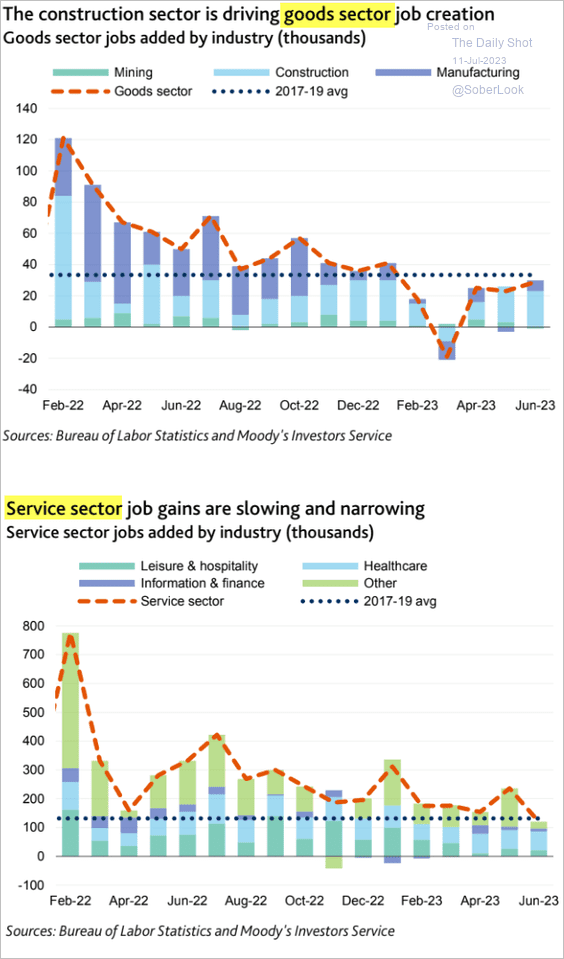 Source: Moody’s Investors Service
• Private payrolls growth vs. small business hiring intentions (NFIB):
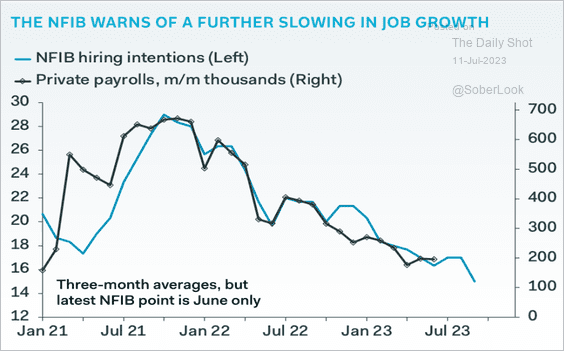 Source: Pantheon Macroeconomics
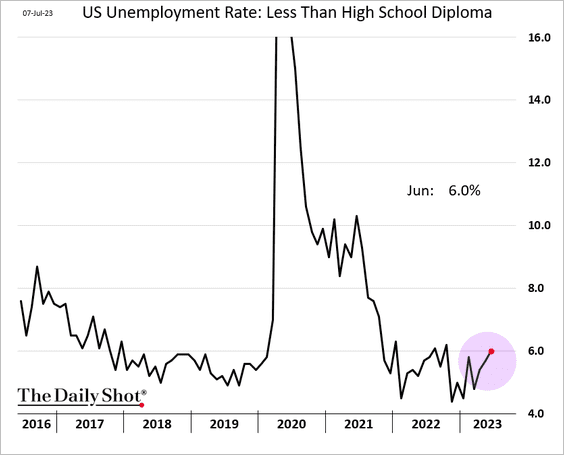
• Unemployment among Americans without a high-school degree:
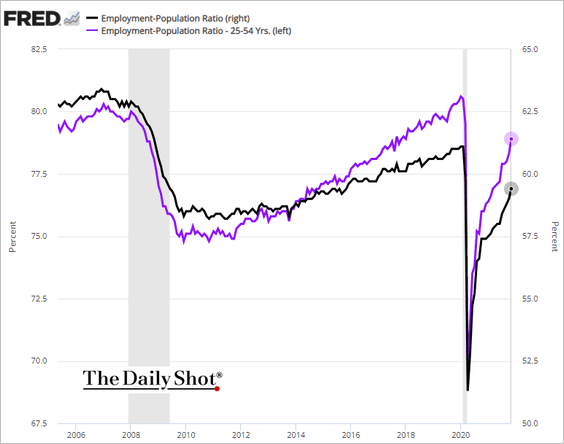
• The employment-to-population ratio (still below pre-COVID levels):
• Percentage of small businesses (NFIB) reporting difficulties filling job openings:
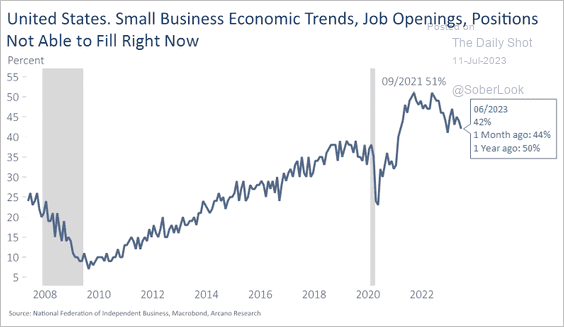 Source: Arcano Economics
• Healthcare employment (well below pre-COVID trend):
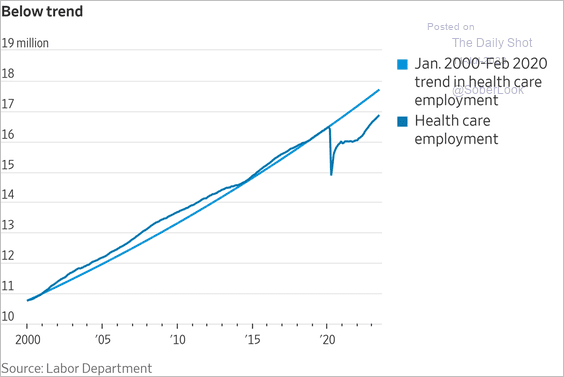 Source: @WSJ Read full article
• Deutsche Bank’s model probability of net job losses over the next few months:
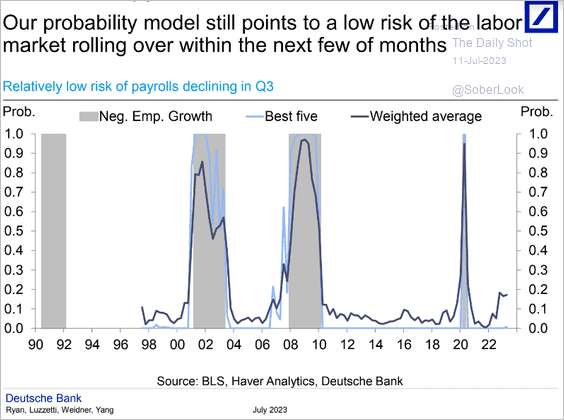 Source: Deutsche Bank Research
• Service industries’ wage growth:
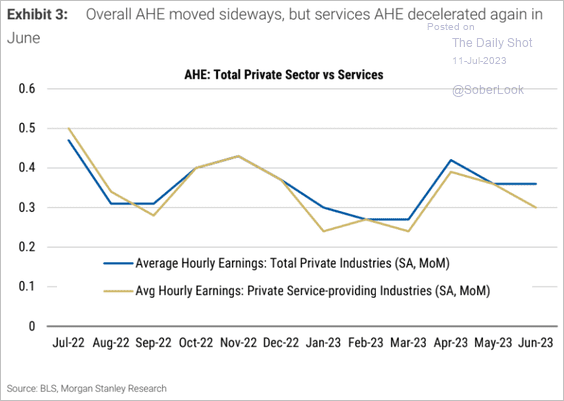 Source: Morgan Stanley Research
– Wage growth among low-wage workers:
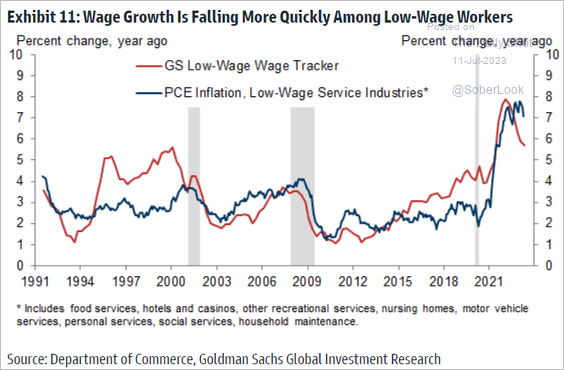 Source: Goldman Sachs
——————–
3. The GDPNow model estimate for second-quarter growth has been hovering around 2% (annualized).
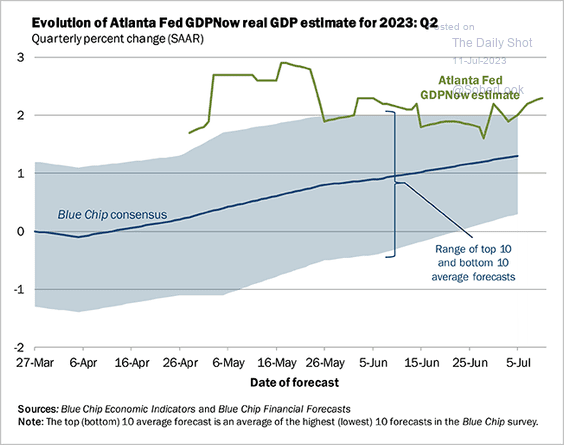 Source: Federal Reserve Bank of Atlanta
Here are the contributions.
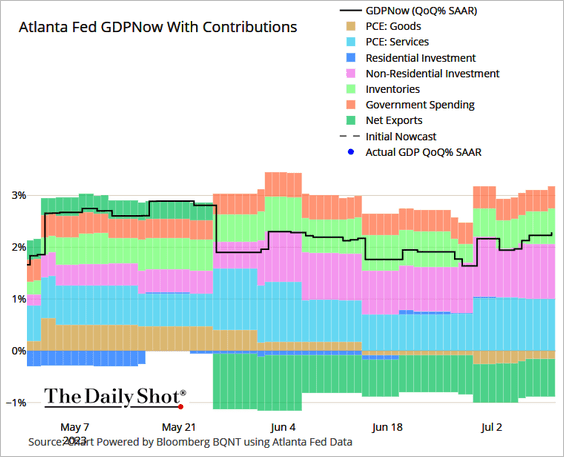 Source: @TheTerminal, Bloomberg Finance L.P.
——————–
4. Finally, we have some updates on inflation.
• 1-year consumer inflation expectations eased further in June.
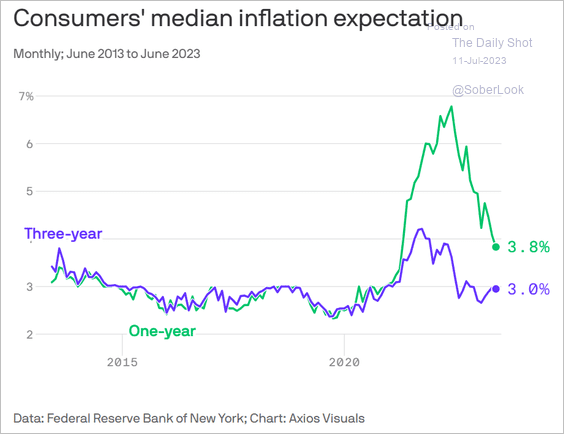 Source: @axios Read full article
• High-frequency indicators continue to signal sharp declines in inflation ahead.
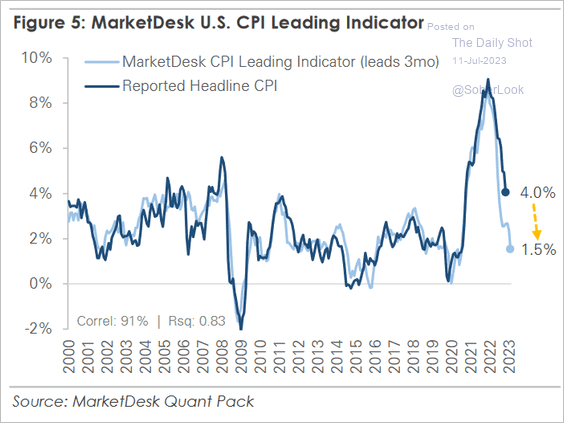 Source: MarketDesk Research
![]() Source: Goldman Sachs
Source: Goldman Sachs
• This chart illustrates the year-over-year CPI scenarios derived from the assumptions of monthly changes in CPI.
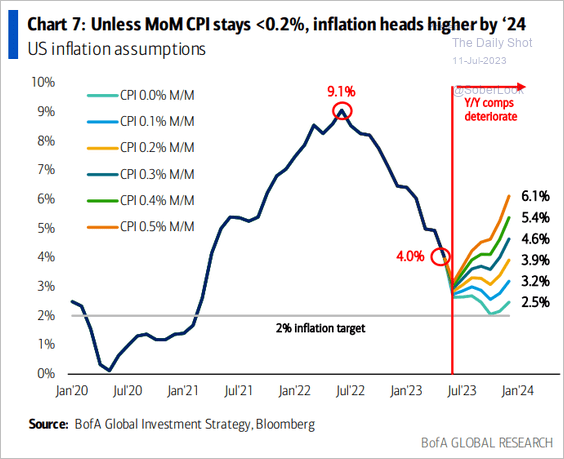 Source: BofA Global Research
• Wholesale used car prices dropped sharply in June.
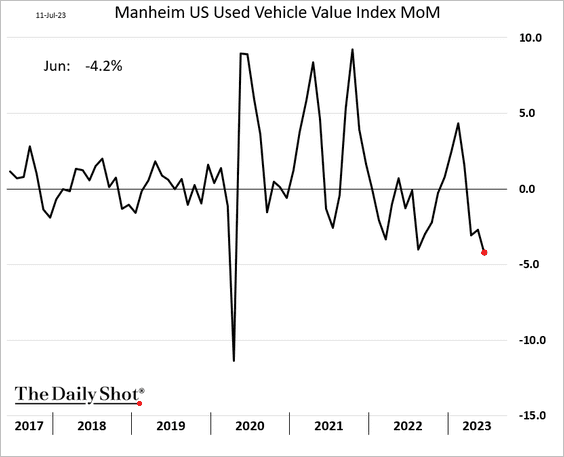
 Source: @axios Read full article
Here is the F. Black Book wholesale index vs. the used vehicles CPI.
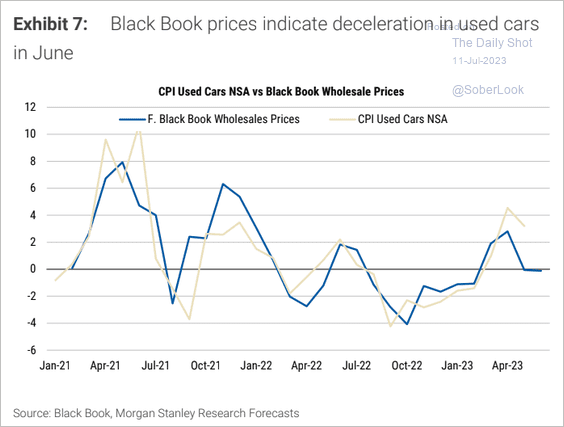 Source: Morgan Stanley Research
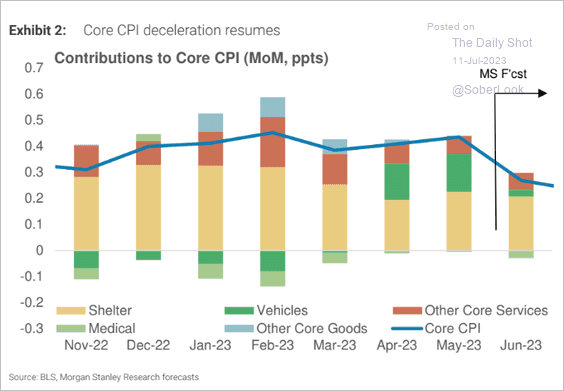
• Morgan Stanley sees the June core CPI print significantly lower than the increase observed in May.
 Source: Morgan Stanley Research
Back to Index
Canada
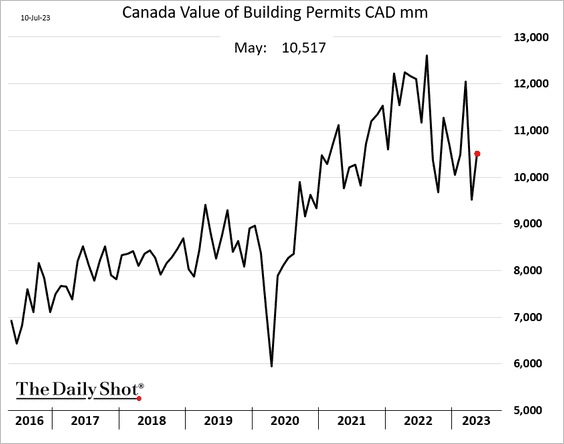
1. Building approvals increased in May.
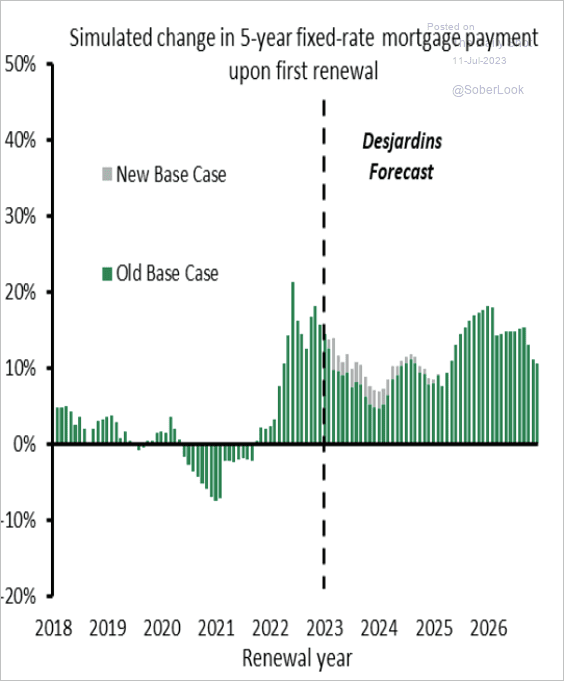
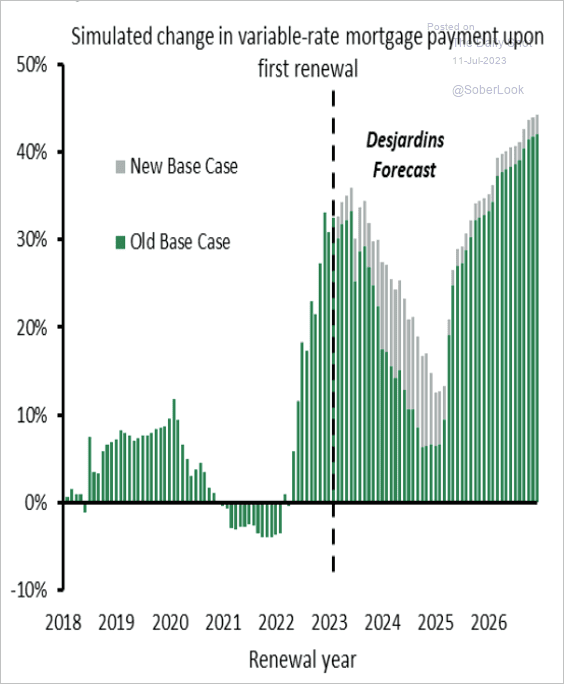
2. According to Desjardins, a higher terminal rate and somewhat slower pace of rate cuts next year will burden households when renewing mortgages, especially for those with variable rates. (2 charts)
 Source: Desjardins
 Source: Desjardins
——————–
3. Canadians have been splurging on travel and entertainment this year.
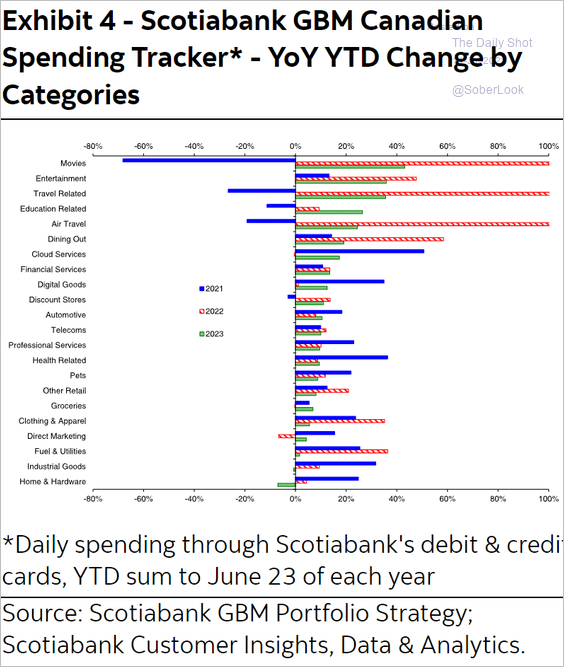 Source: Hugo Ste-Marie, Portfolio & Quantitative Strategy Global Equity Research, Scotia Capital
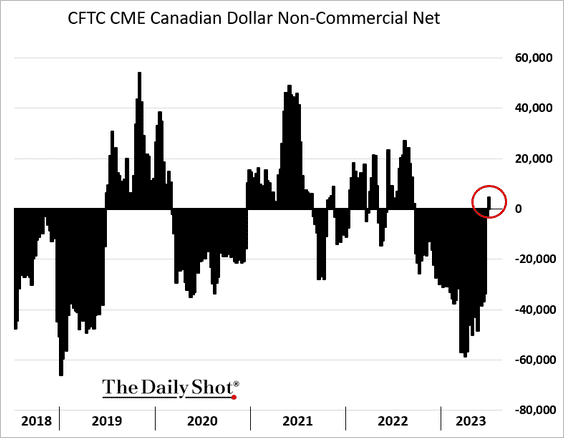
4. Speculators are turning bullish on the loonie.
Back to Index
The United Kingdom
1. Pension plans are running surpluses as gilt yields surge.
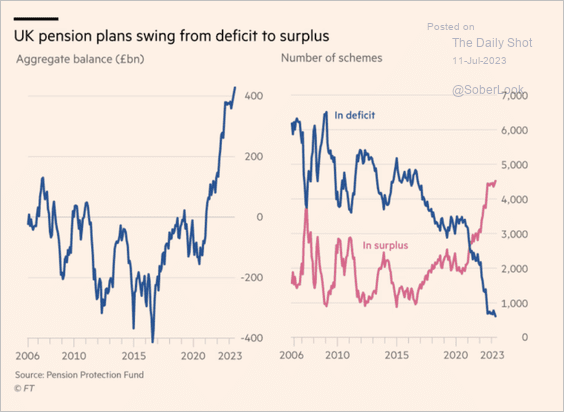 Source: @financialtimes Read full article
2. Resetting mortgage rates will put pressure on household consumption.
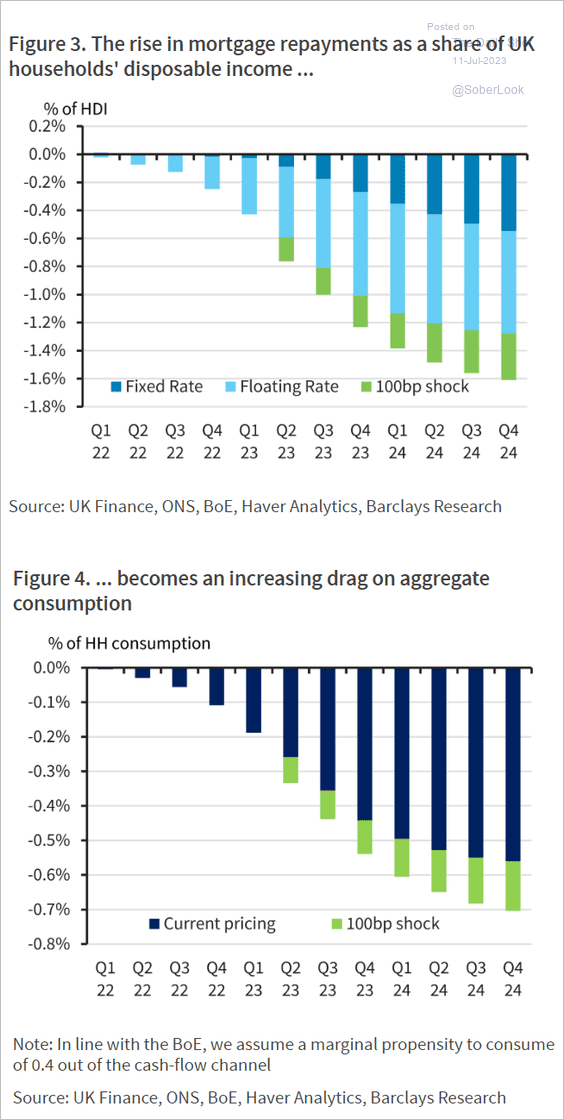 Source: Barclays Research
3. Recruitment challenges are easing.
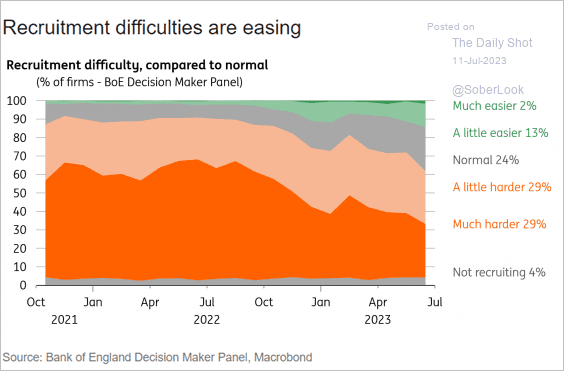 Source: ING
4. Satisfaction with the NHS is collapsing.
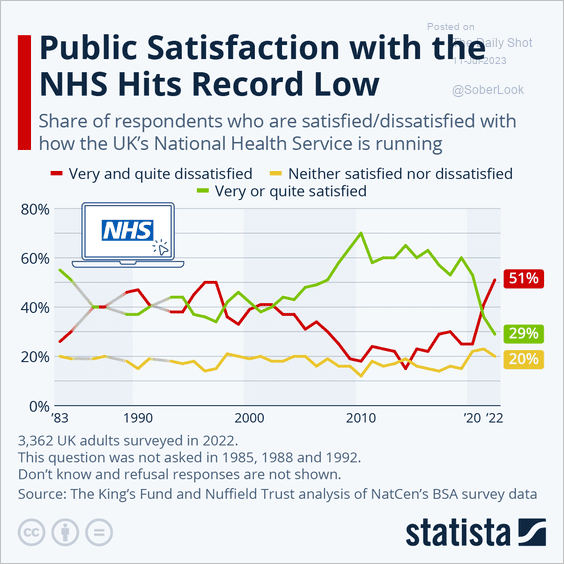 Source: Statista
Back to Index
The Eurozone
1. The Sentix investor confidence index declined further this month.
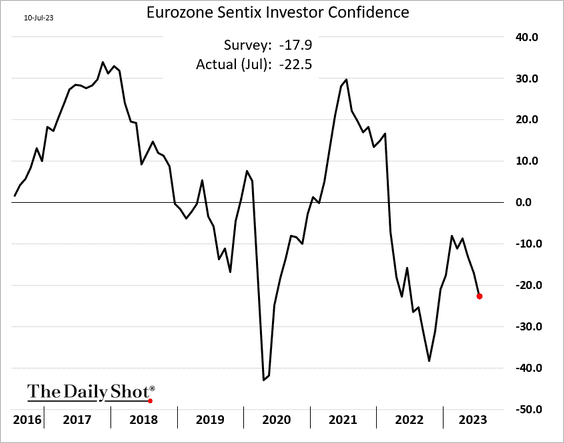
 Source: RTT News Read full article
——————–
2. The Treasury-Bund spread has diverged from the US-Eurozone economic surprise differential.
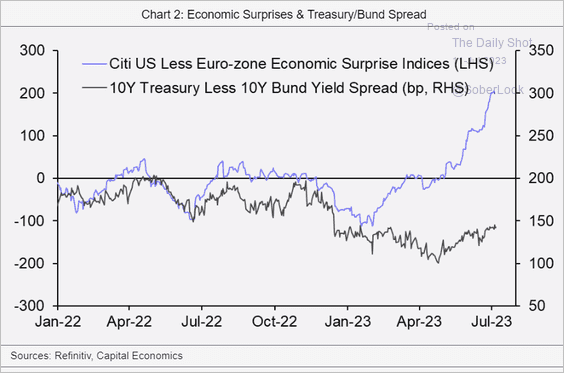 Source: Capital Economics
3. Deteriorating excess liquidity points do downside risks for euro-area stocks.
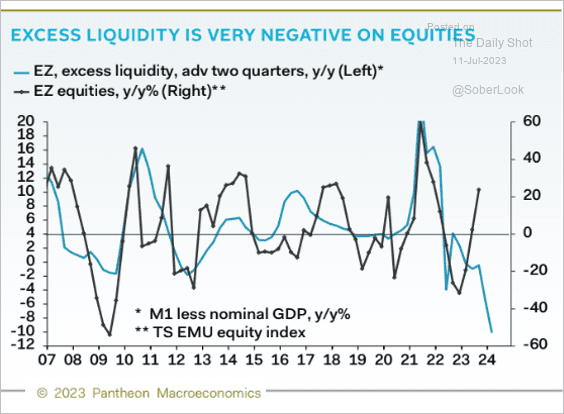 Source: Pantheon Macroeconomics
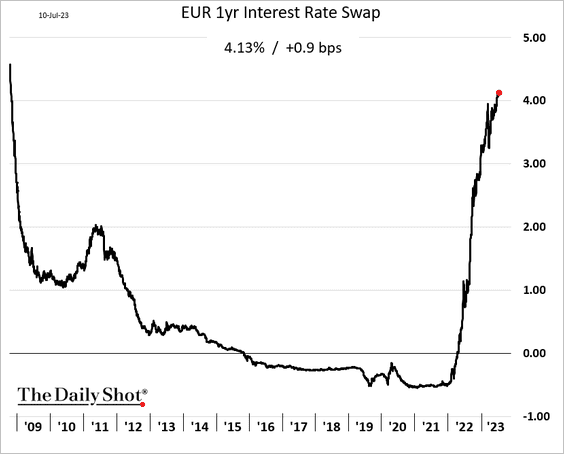
4. Short-term rates continue to climb, with the 1-year swap rising above 4%.
5. French employment growth has been outpacing the rest of the Eurozone.
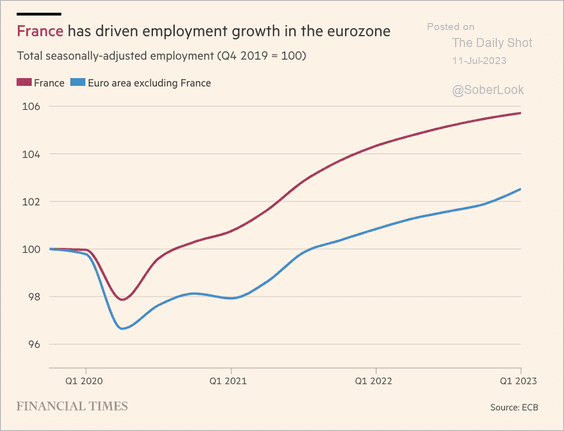 Source: @financialtimes Read full article
Back to Index
Europe
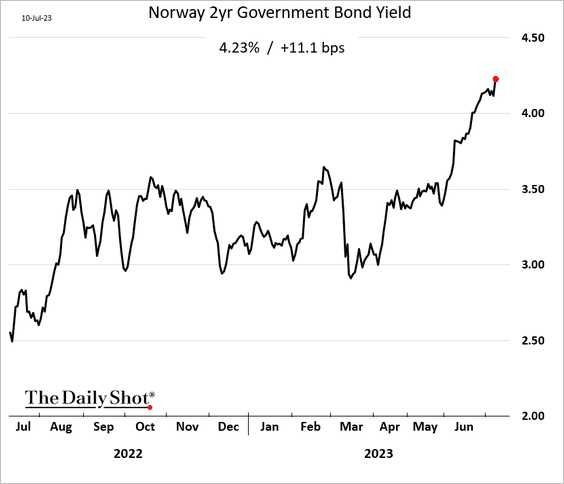
1. Norway’s core CPI hit a record high.
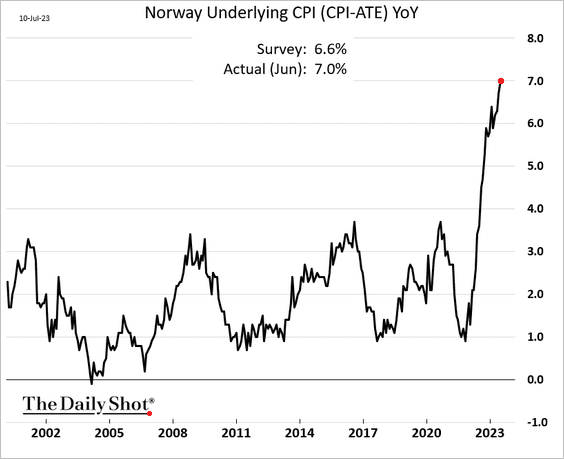
Bond yields jumped.
——————–
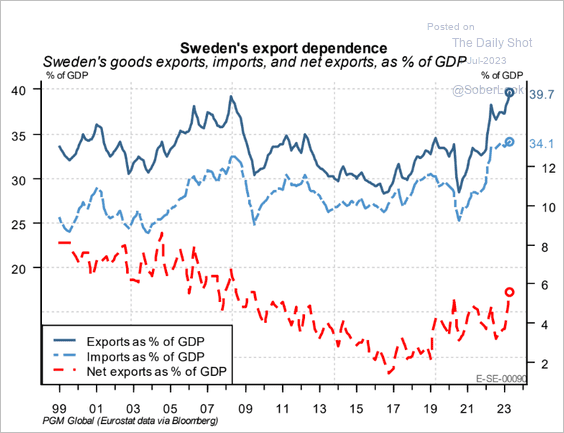
2. Sweden is heavily dependent on trade.
 Source: PGM Global
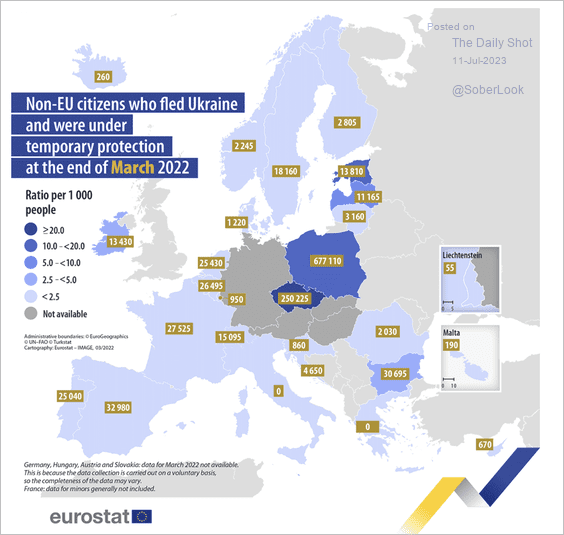
3. Here is a look at Ukrainian refugees throughout the EU.
 Source: Eurostat Read full article
Back to Index
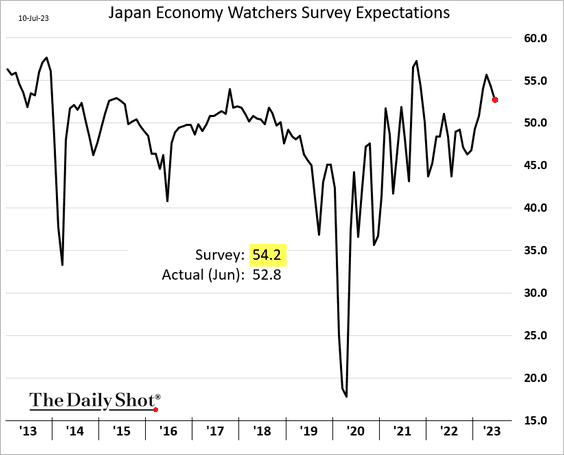
Japan
1. The Economy Watchers Expectations index declined in June.
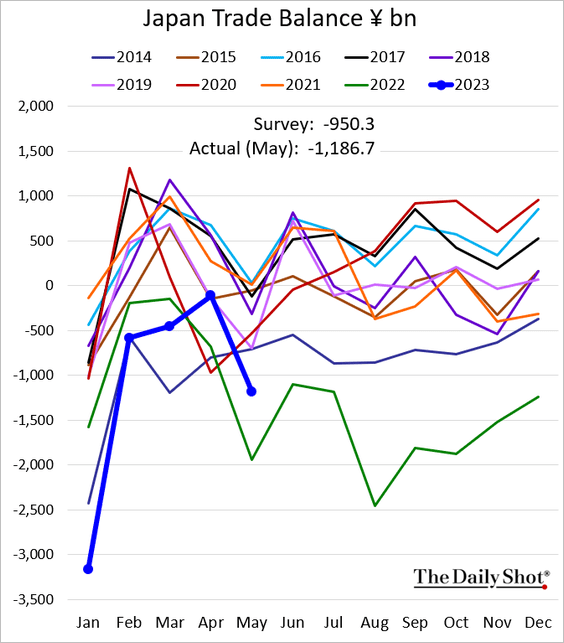
2. The trade deficit widened more than expected.
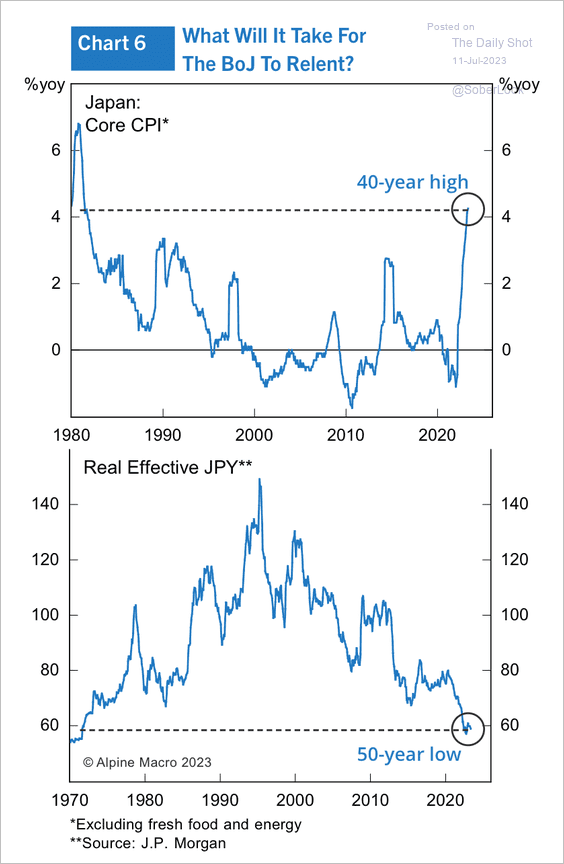
3. The rally in USD/JPY appears stretched.
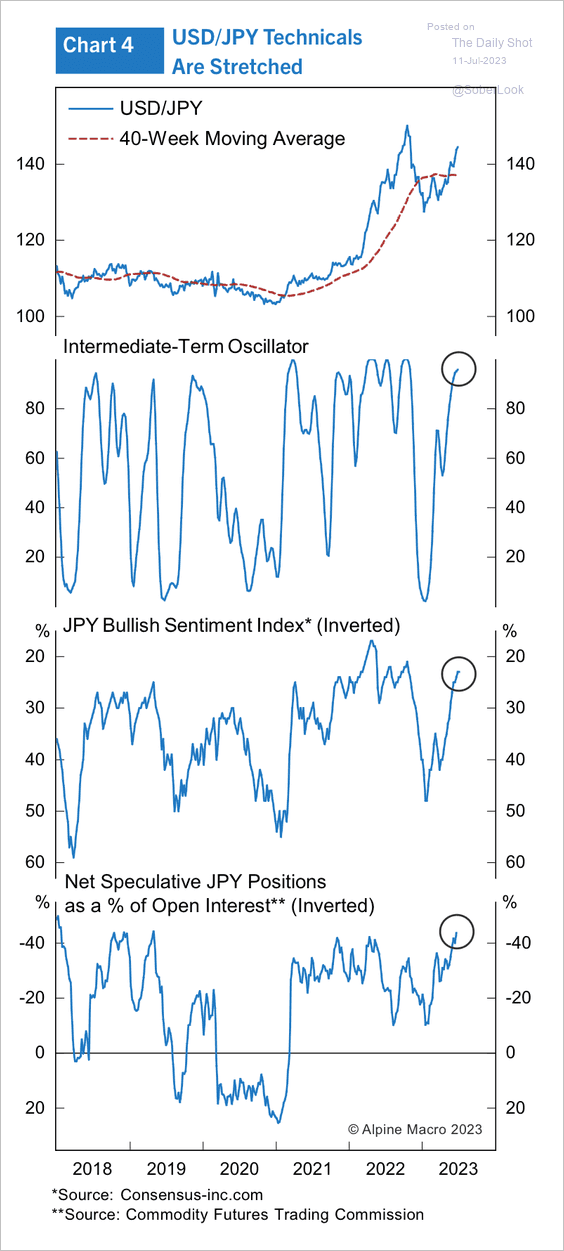 Source: Alpine Macro
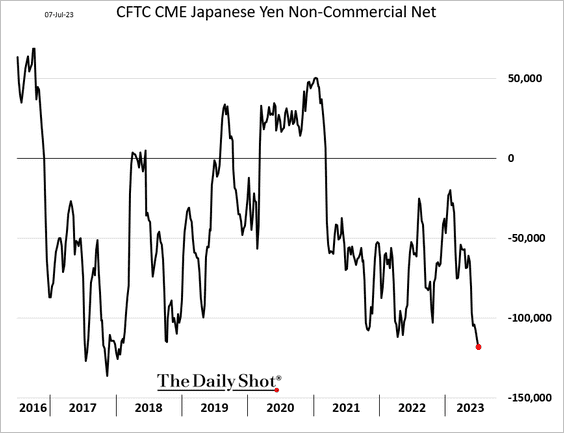
• Speculative bets against the yen hit a multi-year high.
• Core inflation is already at a 40-year high, while the real value of the yen is at a 50-year low. Will the BoJ abandon yield curve control?
 Source: Alpine Macro
Back to Index
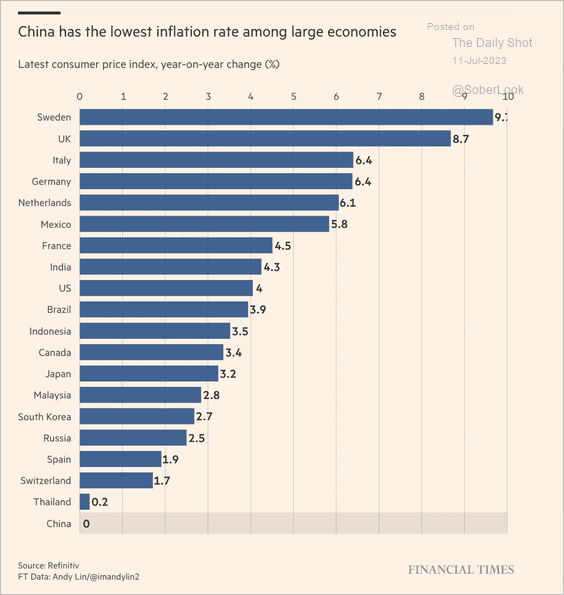
China
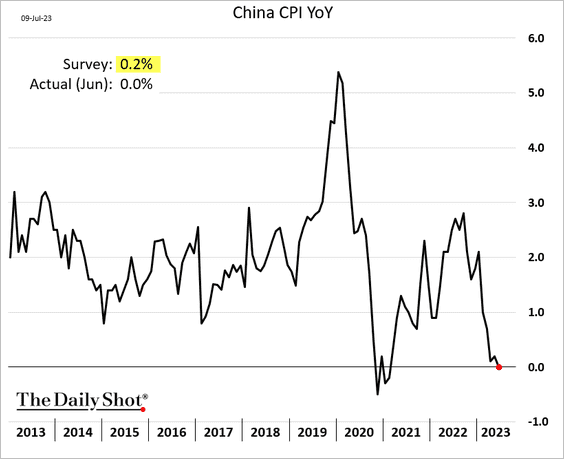
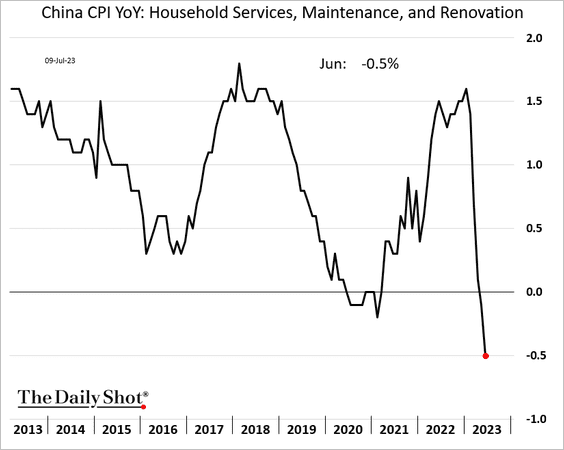
1. The CPI unexpectedly hit zero last month (year-over-year).
 Source: @financialtimes Read full article
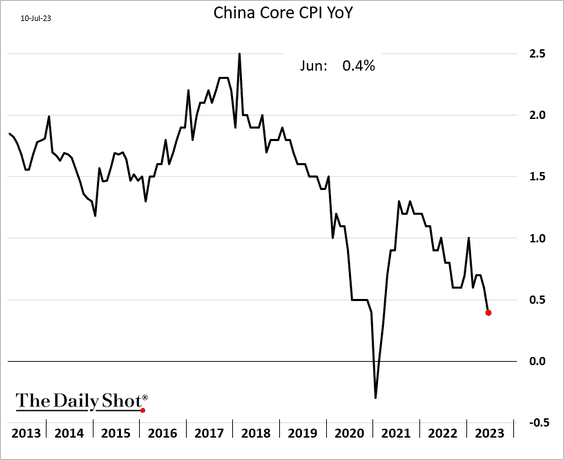
Core inflation is crashing too.
Here are a couple of CPI components.
![]()
 Source: Reuters Read full article
——————–
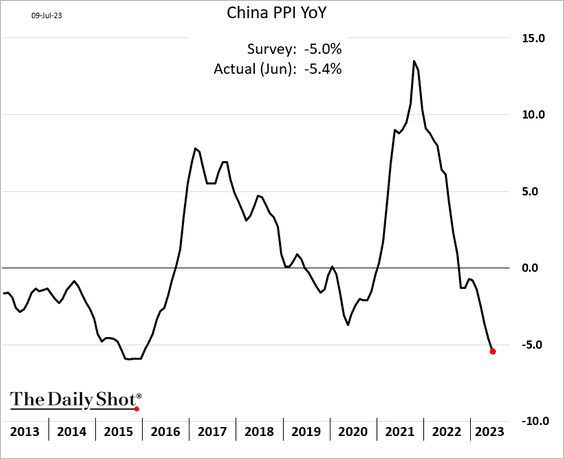
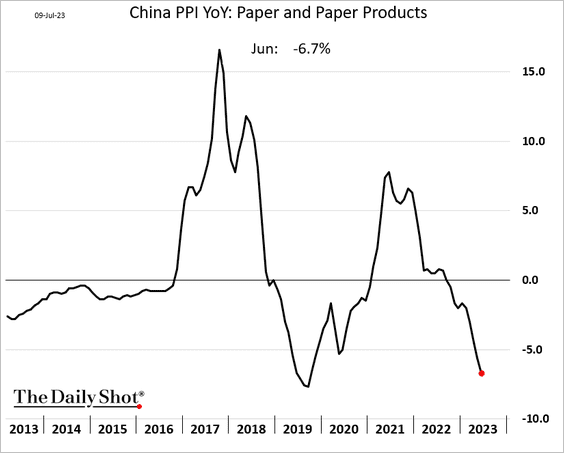
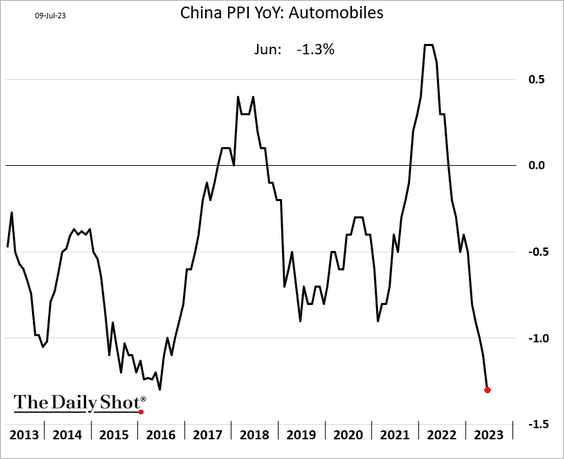
2. The PPI moved deeper into negative territory.
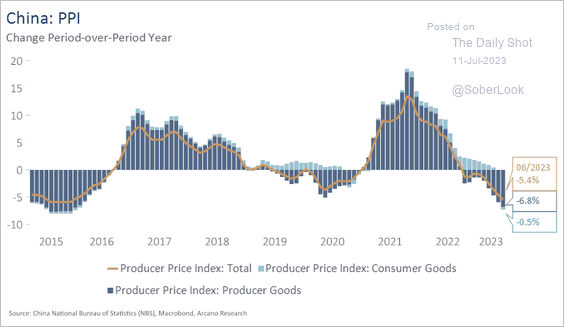 Source: Arcano Economics
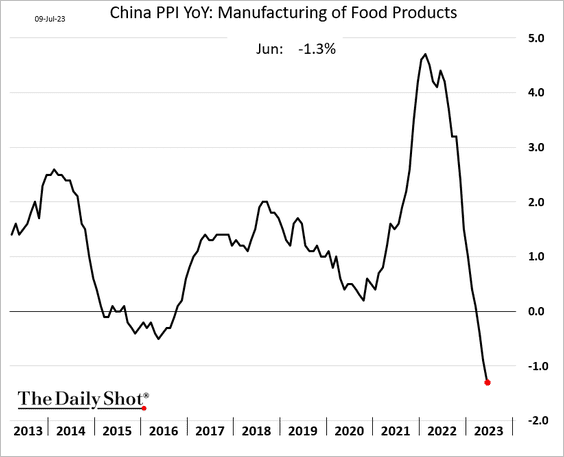
Below are some PPI components.
– Food:
– Paper:
– Automobiles:
• China will be exporting disinflation.
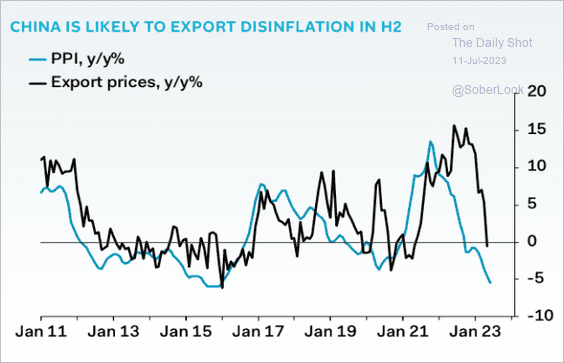 Source: Pantheon Macroeconomics
——————–
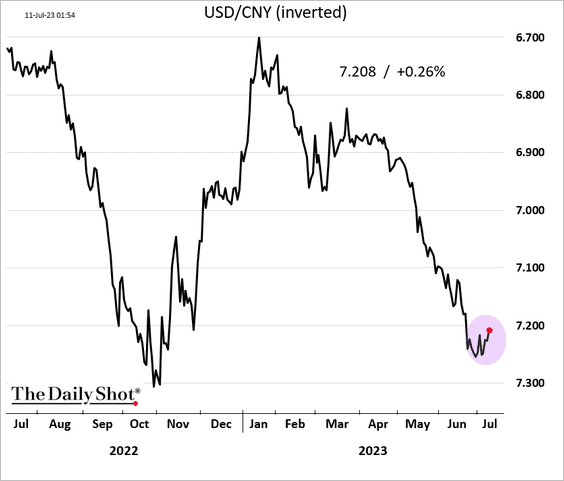
3. Beijing appears to have stabilized the renminbi.
4. Property developers’ USD-denominated bond prices continue to sink.
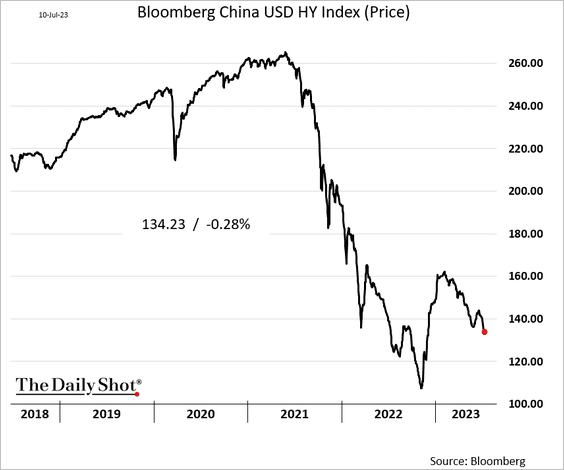
But Beijing is signaling more support for developers.
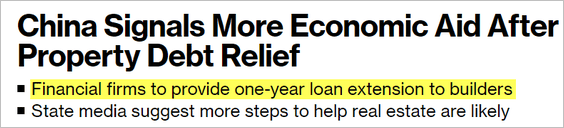 Source: @markets Read full article
——————–
5. Broad credit growth has been lagging the money supply expansion.
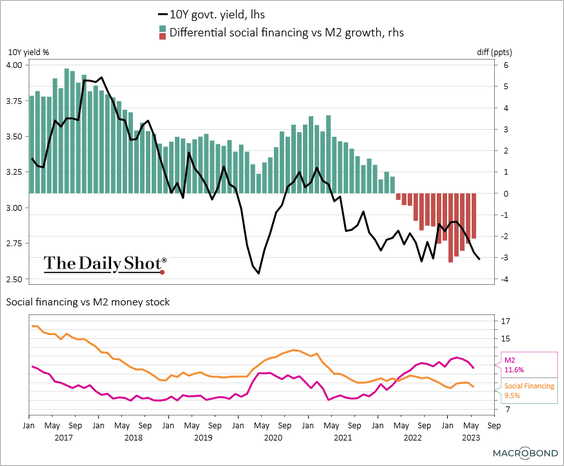 Source: Chart and data provided by Macrobond
Back to Index
Emerging Markets
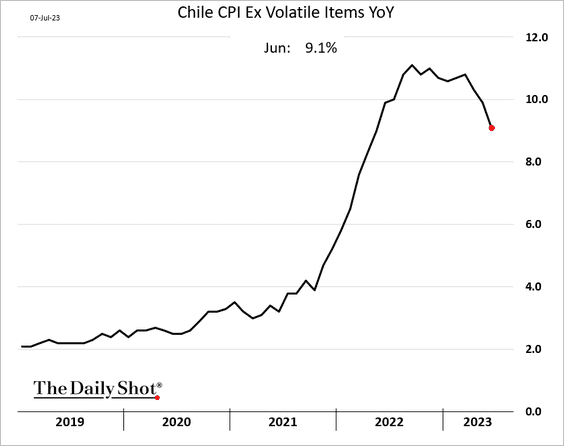
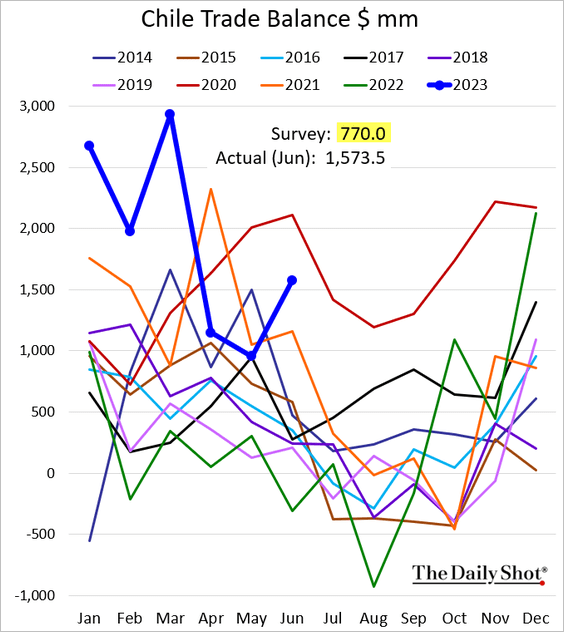
1. Chile’s inflation is slowing.
The trade surplus was higher than expected in June.
——————–
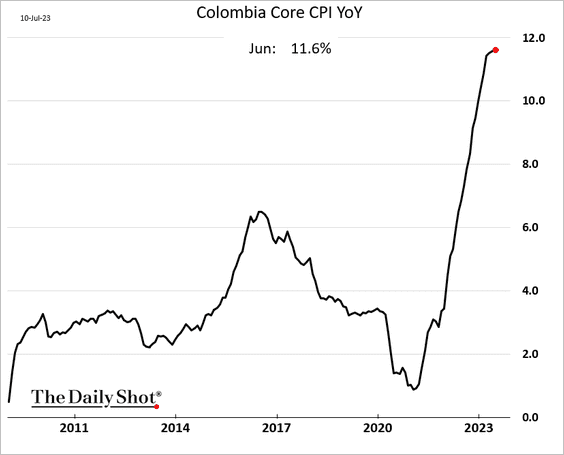
2. Colombia’s core inflation hit a new high.
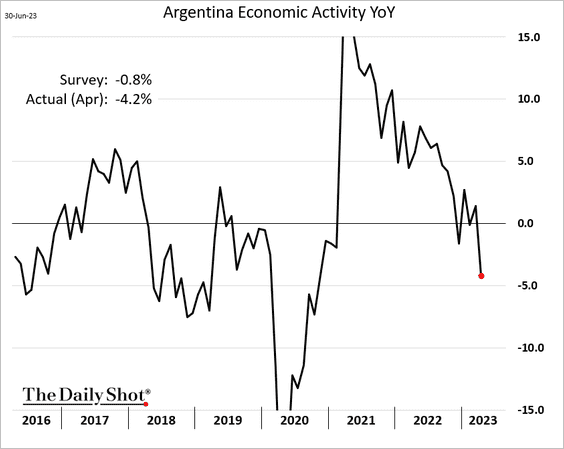
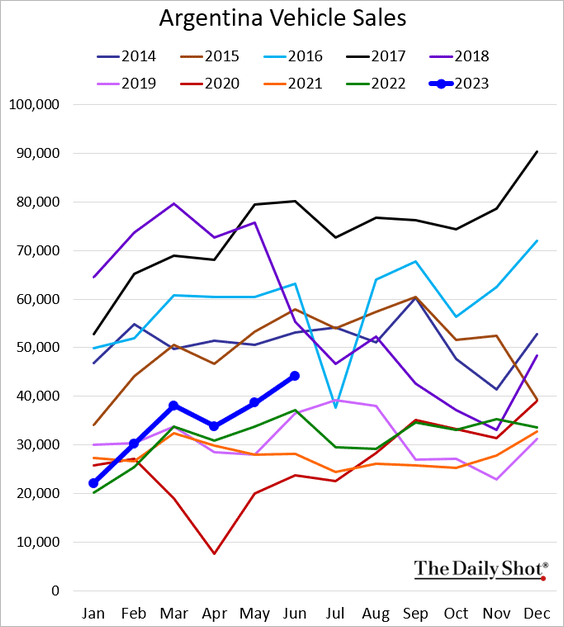
3. Argentina’s economic activity tanked in April.
But vehicle production remains at multi-year highs.
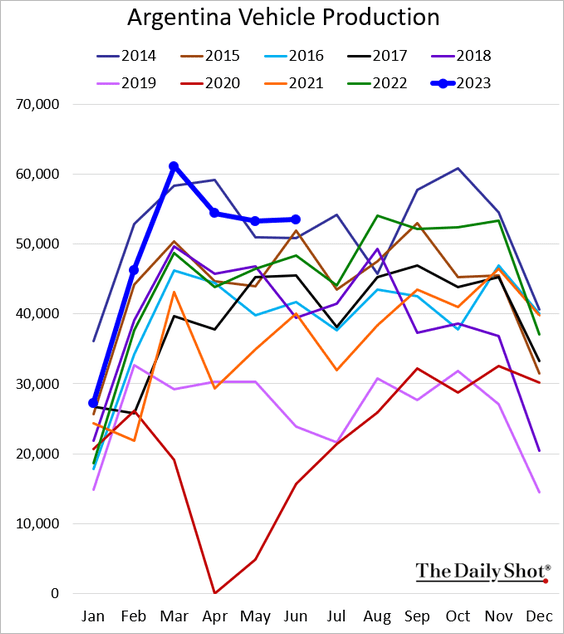
And vehicle sales are improving.
——————–
4. LatAm currencies have been outperforming.
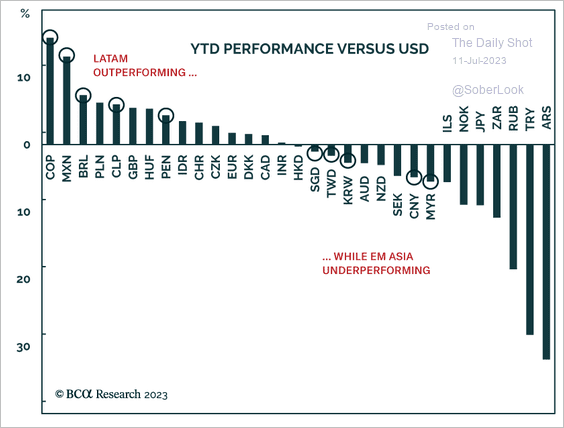 Source: BCA Research
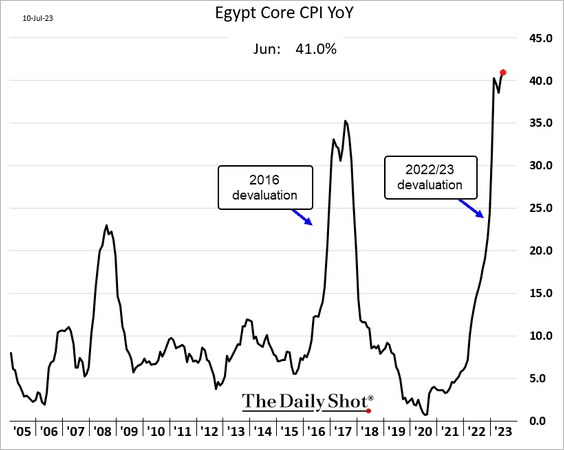
5. Egypt’s core CPI climbed above 40% last month.
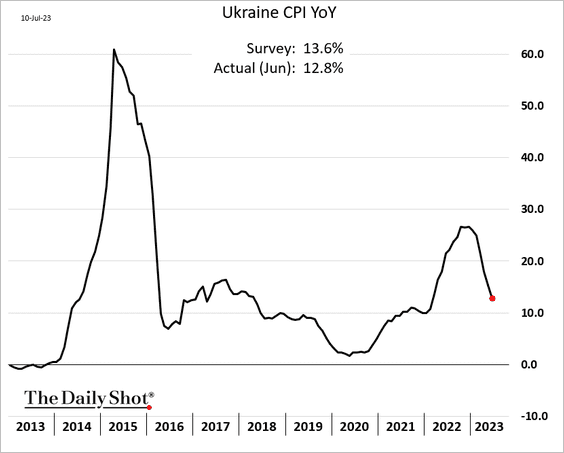
6. Ukrainian inflation is slowing.
7. India’s business investment has been surging.
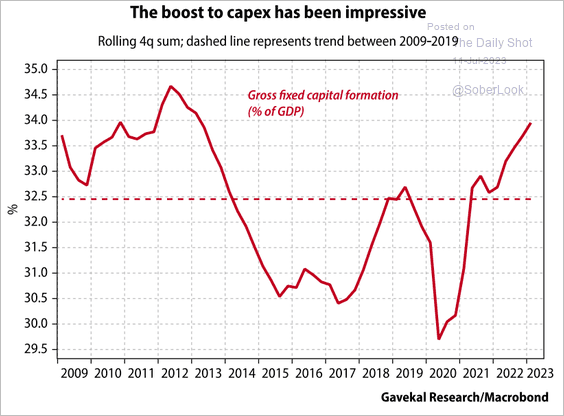 Source: Gavekal Research
8. Are Vietnam’s exports about to rebound?
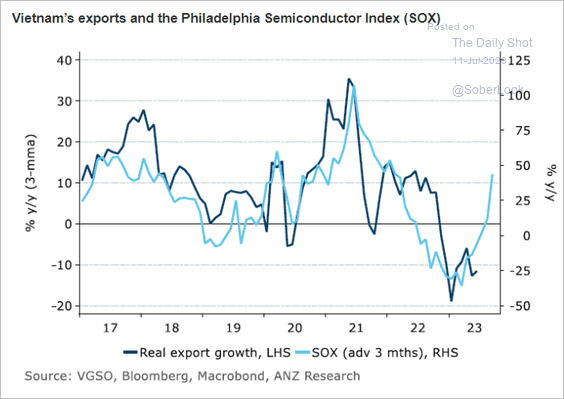 Source: @ANZ_Research
9. It has been a good six months for EM Asia portfolio flows.
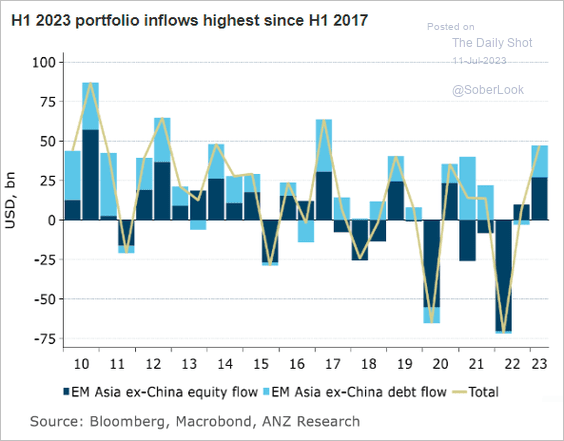 Source: @ANZ_Research
10. Inter-country equity correlations dipped to multi-year lows.
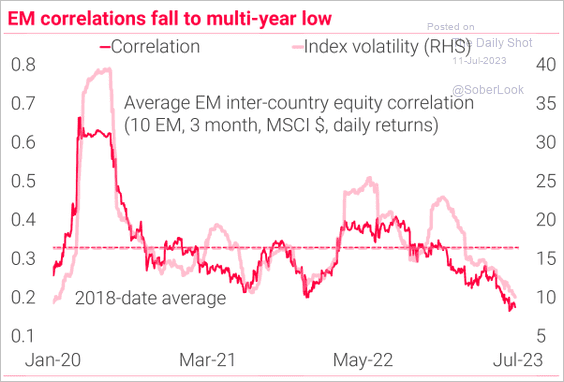 Source: TS Lombard
Back to Index
Cryptocurrency
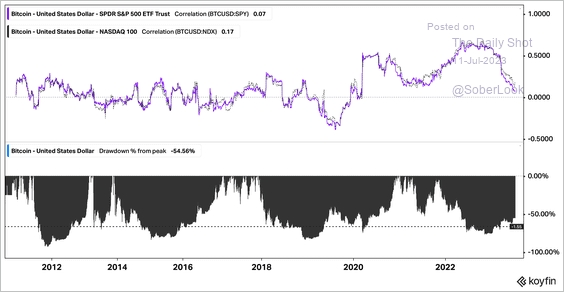
1. Bitcoin’s maximum drawdowns have been fairly consistent throughout cycles, while its correlation with stocks can vary.
 Source: Koyfin
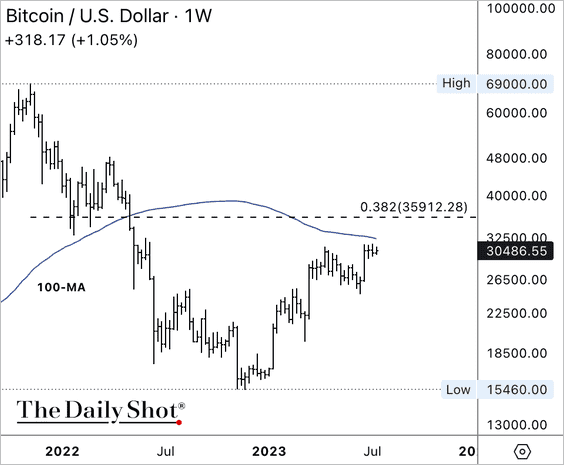
2. BTC/USD is testing resistance at its 100-week moving average after retracing about 30% of its prior downtrend.
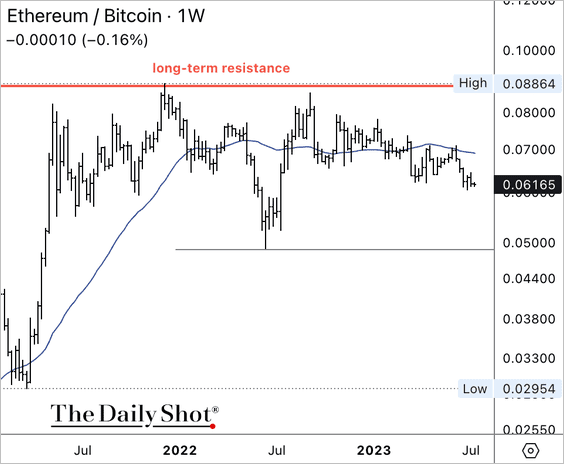
3. ETH/BTC remains capped below long-term resistance.
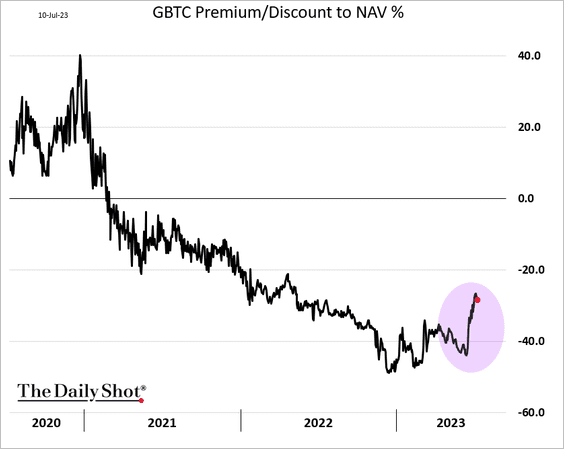
4. The Grayscale Bitcoin Trust’s discount has narrowed significantly on hopes for a spot-bitcoin ETF conversion.
 Source: CoinDesk Read full article
Back to Index
Energy
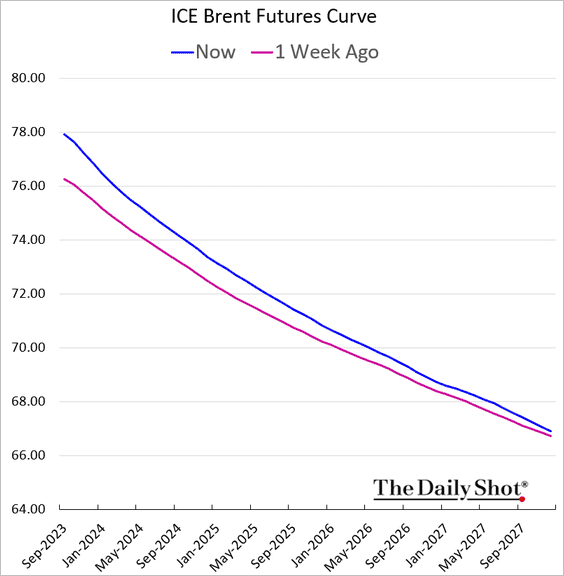
1. The Brent crude backwardation has been strengthening.
2. Green hydrogen costs are expected to decline sharply over the next decade.
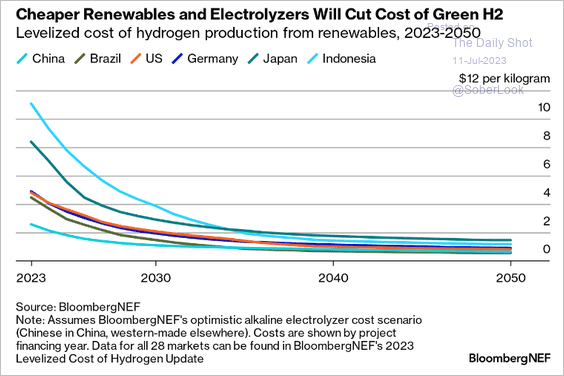 Source: @BloombergNEF Read full article
Back to Index
Equities
1. Deutsche Bank’s positioning indicator has been moving deeper into overweight territory.
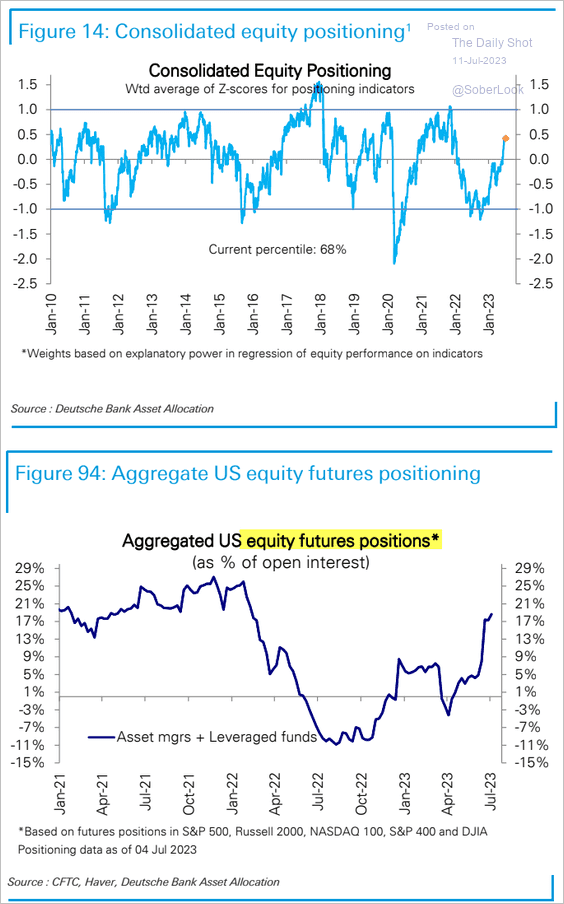 Source: Deutsche Bank Research
This chart shows positioning by sector.
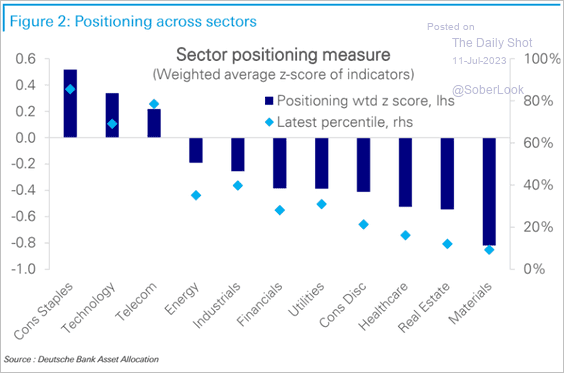 Source: Deutsche Bank Research
——————–
2. Hawkish signals from the Fed and robust US employment data sent the stock-bond correlation back into positive territory.
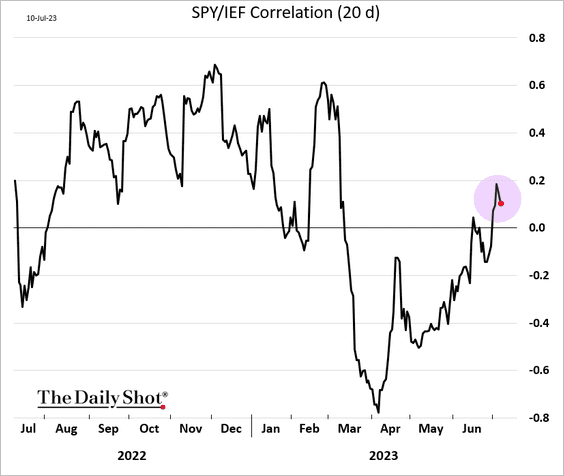
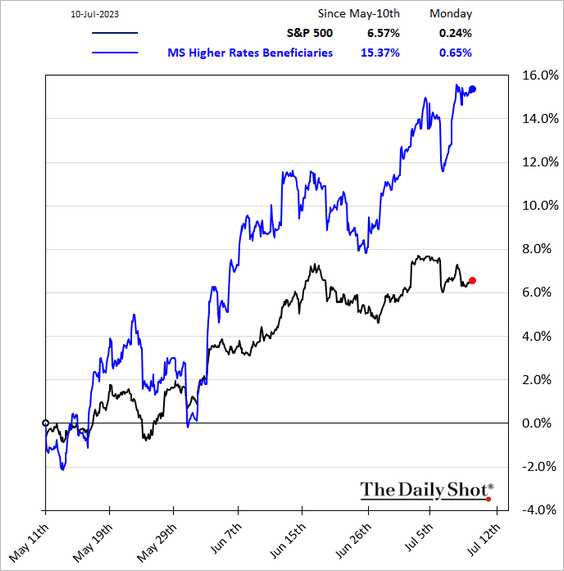
Stocks that benefit from higher rates have been outperforming.
——————–
3. Fundamental and technical indicators point to bonds being attractive relative to stocks.
 Source: Alpine Macro
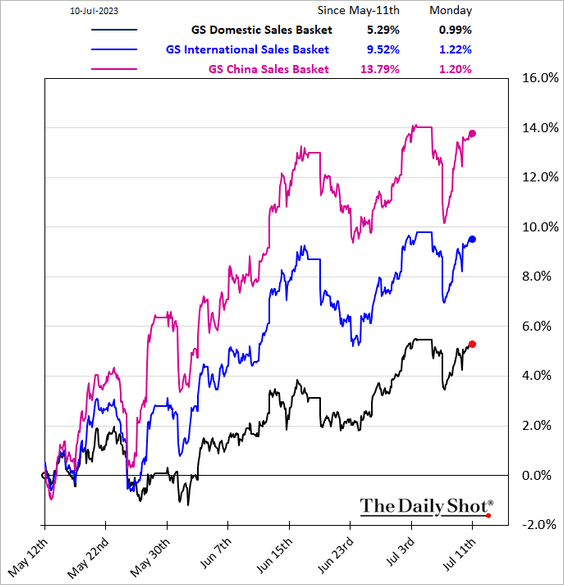
4. Companies with extensive international sales have outperformed over the past couple of months.
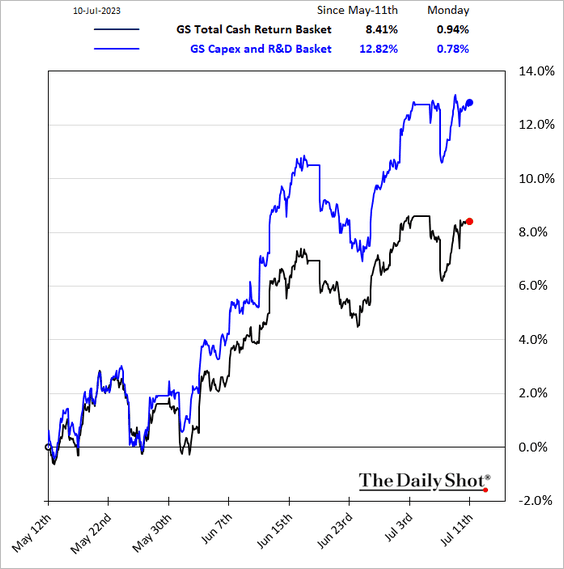
5. Companies with high CapEx and R&D have outperformed those focusing on share buybacks and dividends.
6. More than half of US large-cap active managers underperform the S&P 500 Index over the past 20 years.
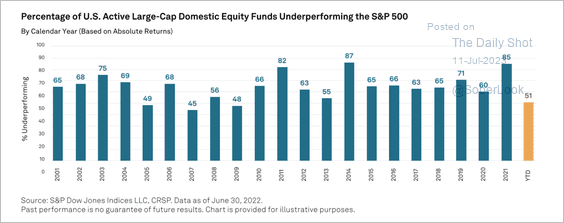 Source: S&P Dow Jones Indices
7. US and European equity indices returned above their SVB collapse levels, although banks are still lagging.
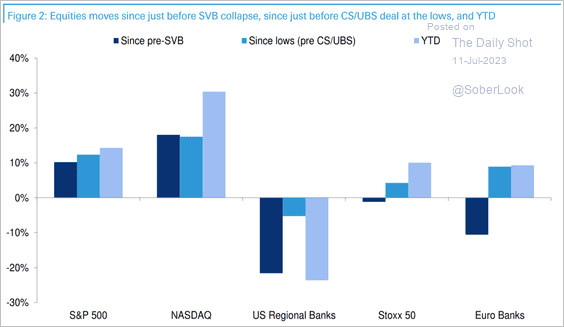 Source: Deutsche Bank Research
8. This chart compares small- vs. large-cap valuations by sector.
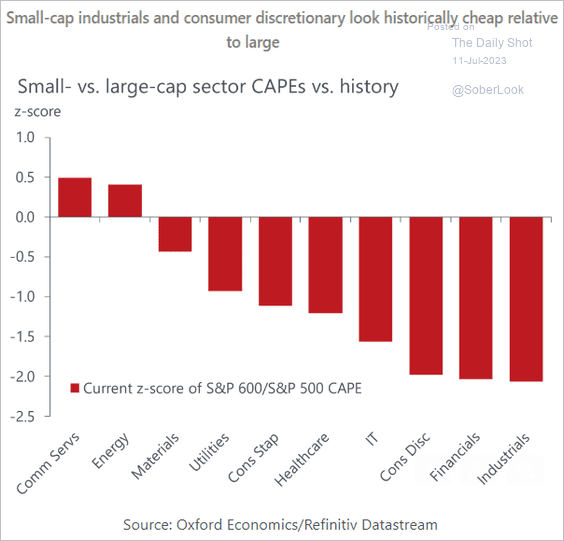 Source: Oxford Economics
Back to Index
Alternatives
1. Morgan Stanley expects retail investors to contribute $3 trillion of assets to private market assets over the next five years.
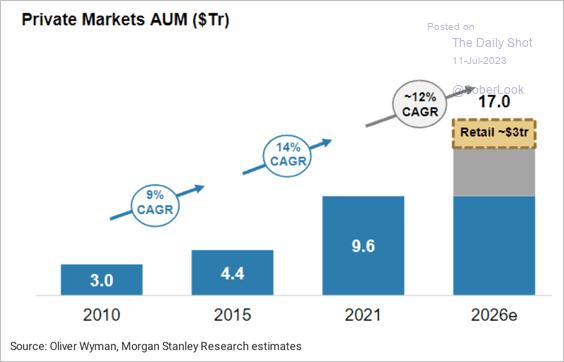 Source: Morgan Stanley Research
2. Here is a look at the composition of dry powder across private market funds.
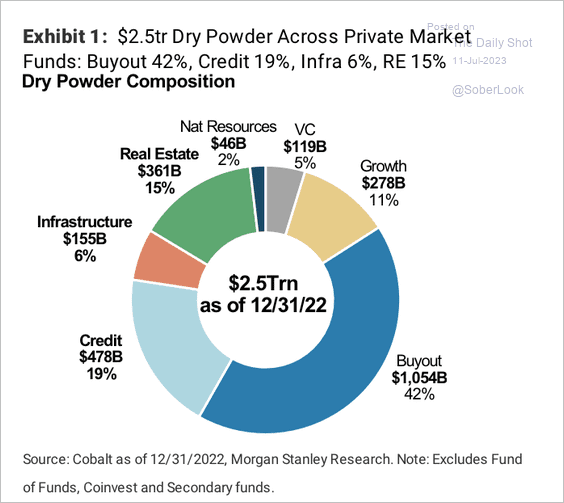 Source: Morgan Stanley Research
3. This chart shows private markets’ AUM over time.
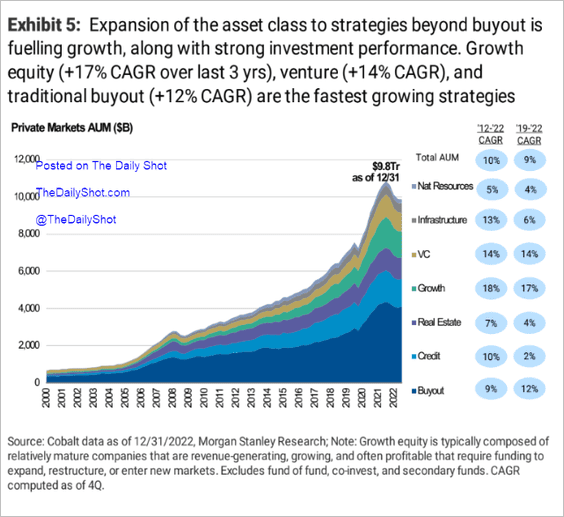 Source: Morgan Stanley Research
4. Global private equity activity has been running well below 2022 levels.
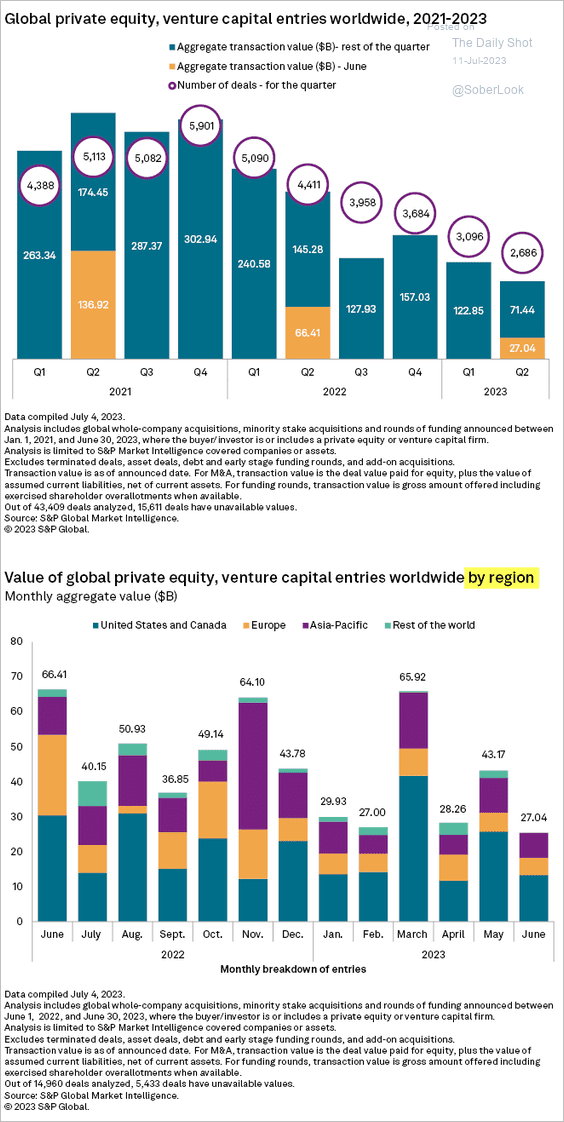 Source: S&P Global Market Intelligence
5. Emerging US venture capital managers are on track to close less than $20 billion in annual commitments for the first time since 2016.
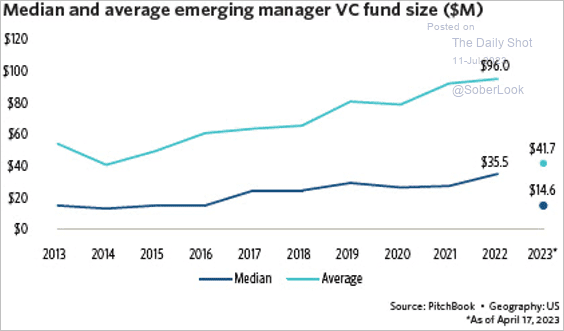 Source: PitchBook
• US venture capital fundraising activity is on pace to finish the year well below $100 billion.
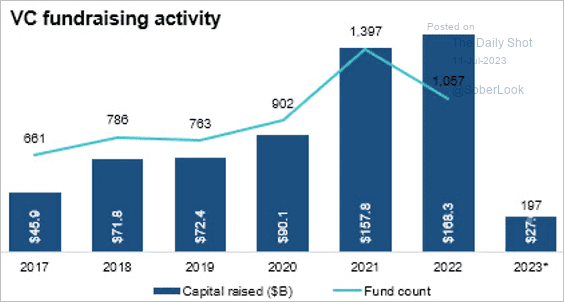 Source: PitchBook
——————–
6. Venture lending activity has slowed.
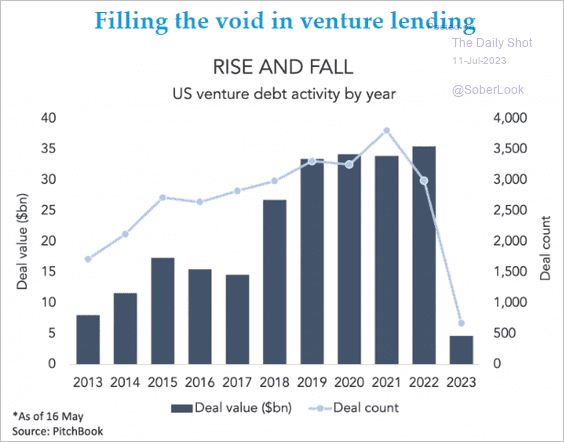 Source: @theleadleft
Back to Index
Credit
1. Let’s begin with some updates on small banks.
• Small banks paid down a substantial portion of FHLB debt going into the quarter-end.
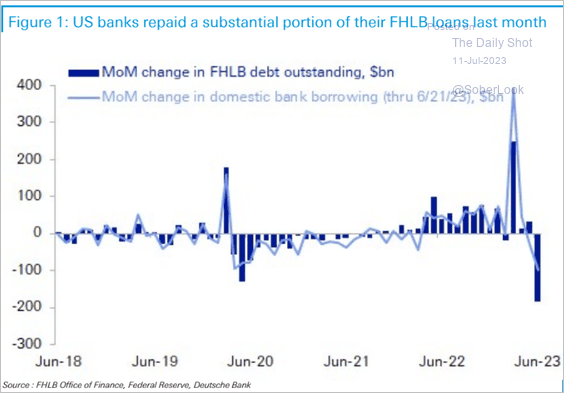 Source: Deutsche Bank Research
But borrowings remain elevated.
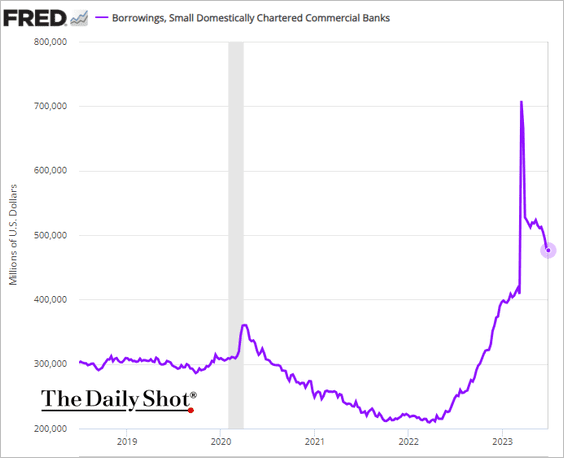
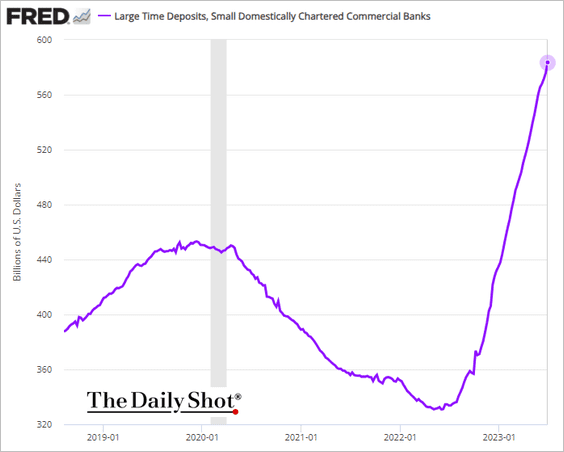
• Small banks increasingly rely on jumbo CDs for funding.
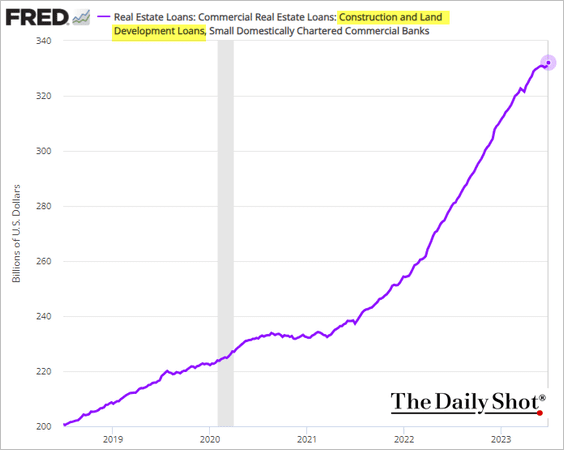
• Construction loan balances continue to grow.
——————–
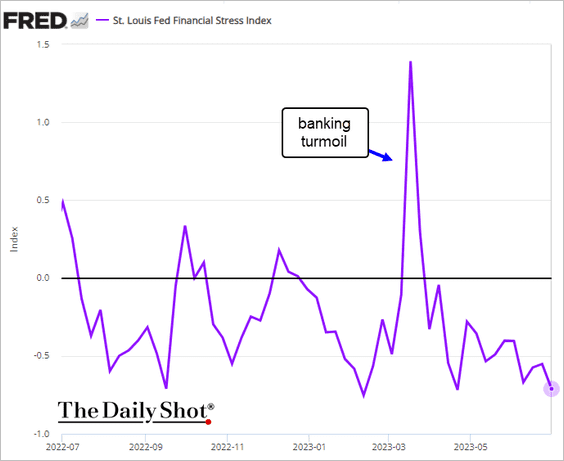
2. The St. Louis Fed’s financial stress index has been easing.
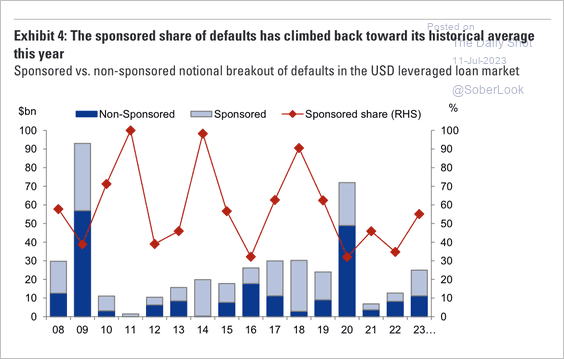
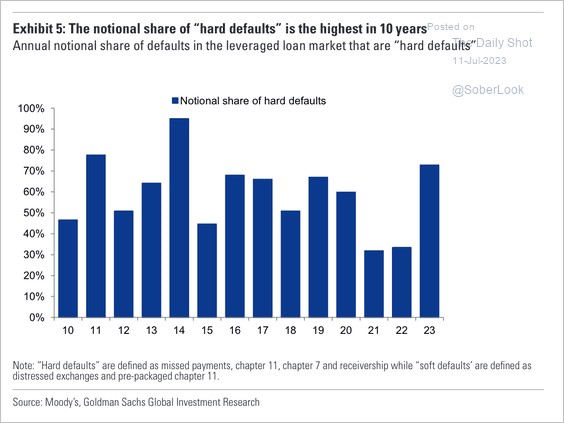
3. There has been an uptick in leveraged loan defaults with an increased share from sponsored firms. (2 charts)
 Source: Goldman Sachs
 Source: Goldman Sachs
——————–
4. There is a growing downgrade risk premium in European senior unsecured real estate debt.
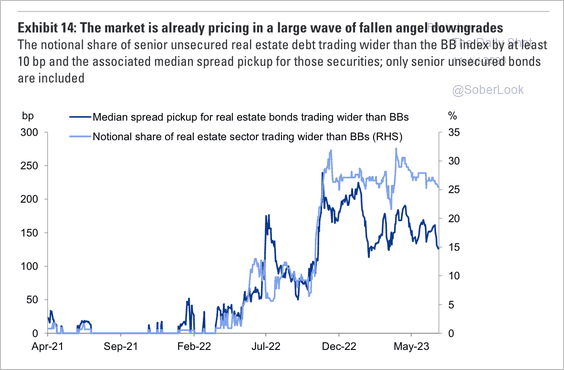 Source: Goldman Sachs
Back to Index
Rates
1. Higher yields are consistent with positive economic surprises.
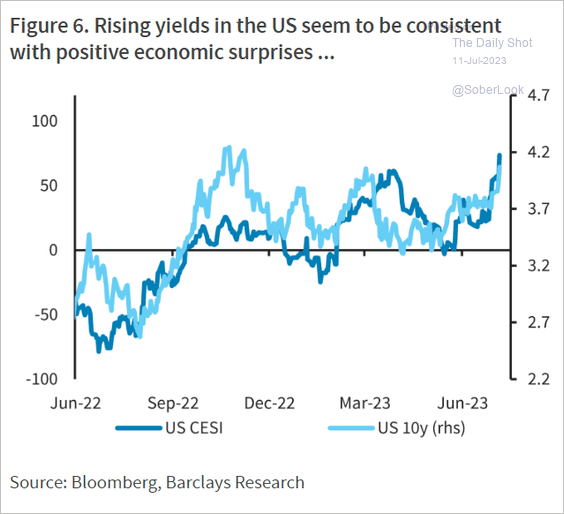 Source: Barclays Research
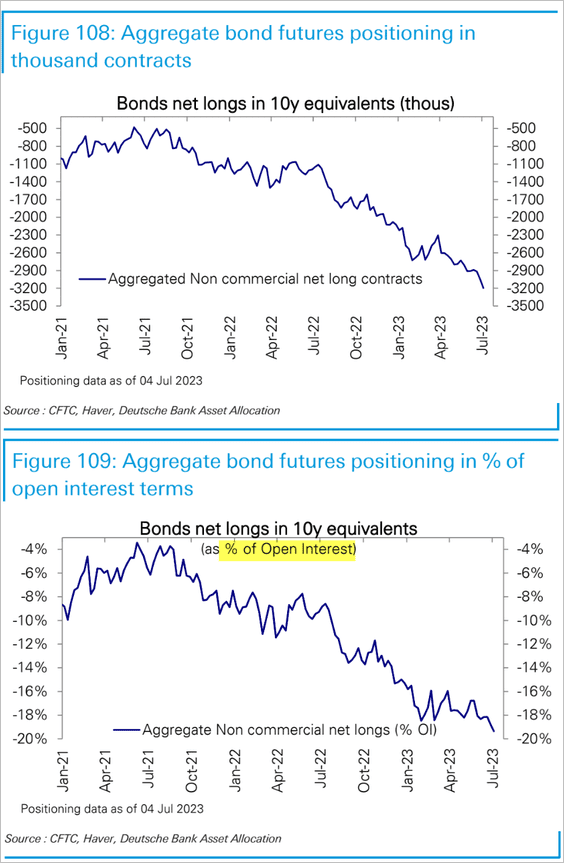
2. Bets against Treasury futures remain extreme (and profitable).
Back to Index
Global Developments
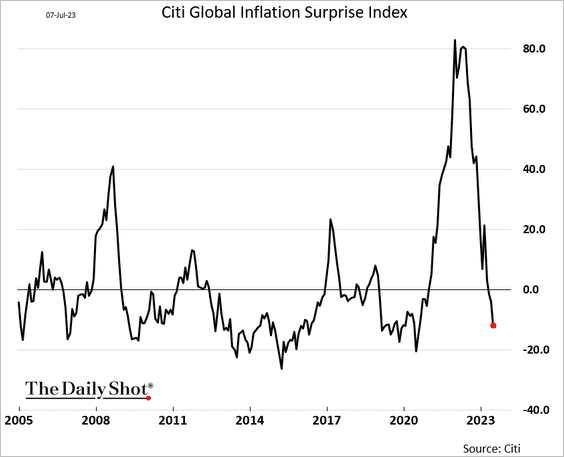
1. Inflation continues to surprise to the downside.
• Food prices have been trending lower.
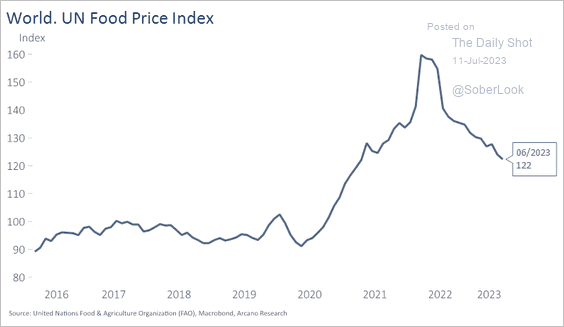 Source: Arcano Economics
• Tightening liquidity points to slower inflation ahead.
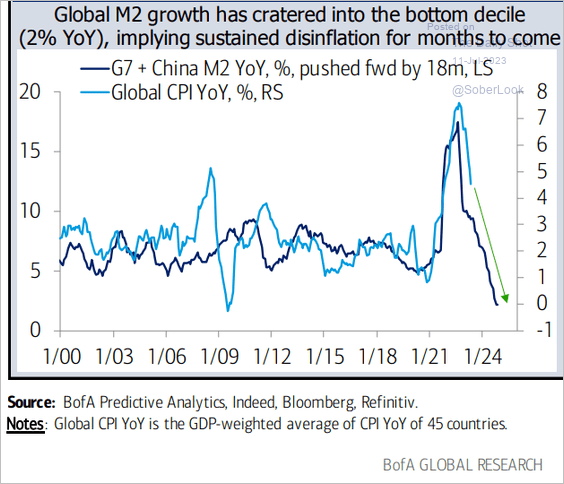 Source: BofA Global Research
• This scatterplot shows 2023 inflation and GDP growth forecasts.
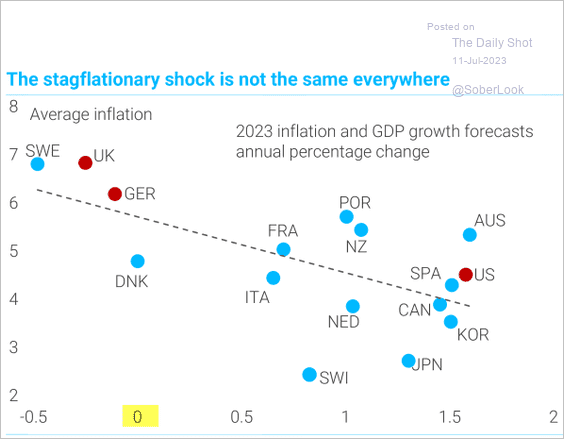 Source: TS Lombard
——————–
2. The US dollar has been consolidating.
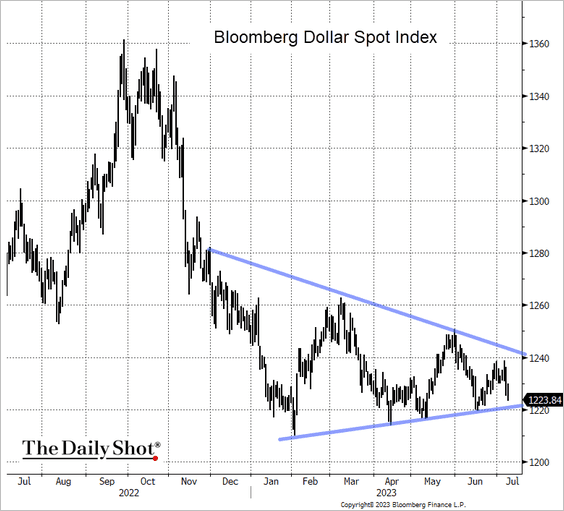 Source: @TheTerminal, Bloomberg Finance L.P.
3. Here are Deutsche Bank’s expectations for currency volatility by economic scenarios. A spike in equity or currency vol could trigger an unwind of carry trades, especially given wide interest rate differentials.
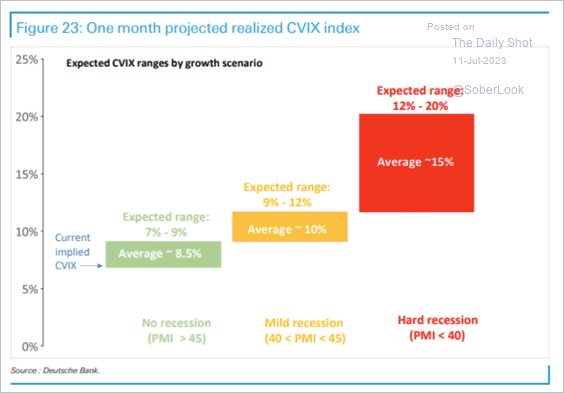 Source: Deutsche Bank Research
4. The global stock/bond ratio appears overbought.
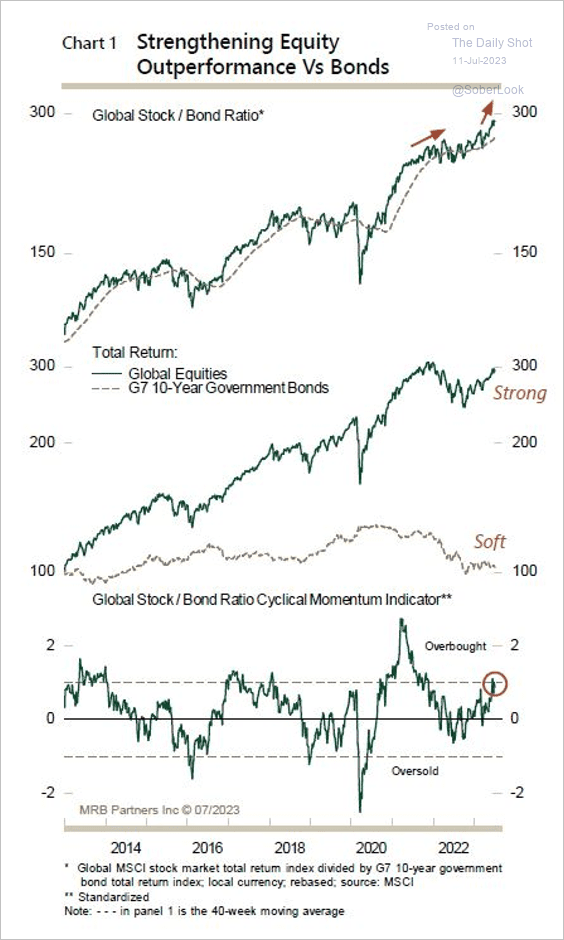 Source: MRB Partners
——————–
Food for Thought
1. Searching for remote work:
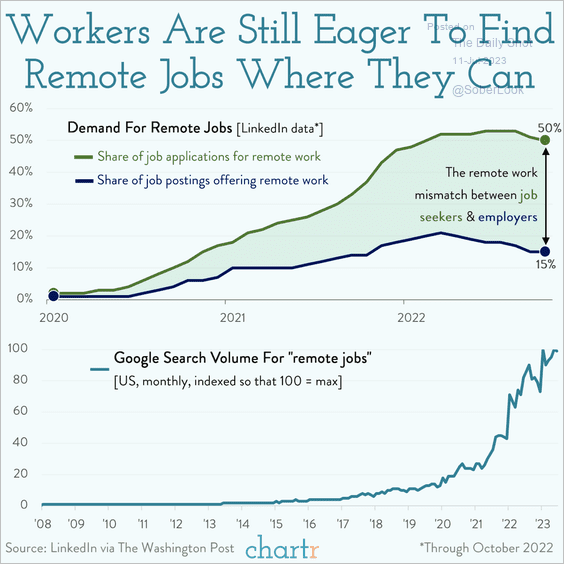 Source: @chartrdaily
2. Attending religious services:
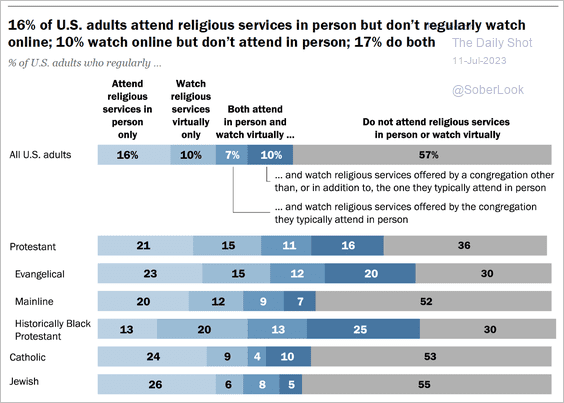 Source: Pew Research Center Read full article
3. Threads’ user count:
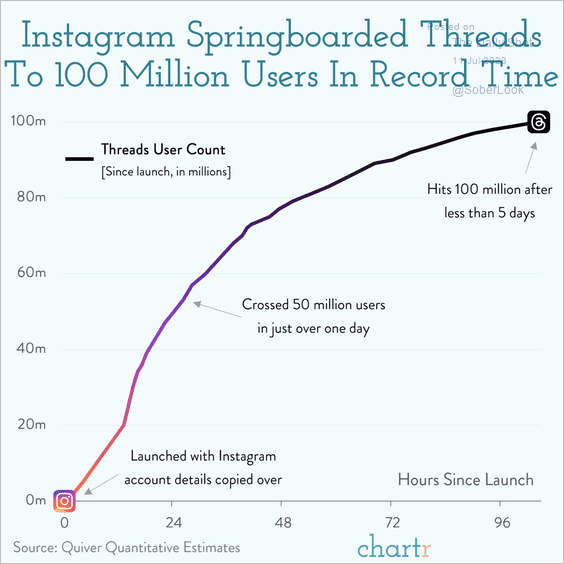 Source: @chartrdaily
4. Companies with the largest ETF and mutual fund assets:
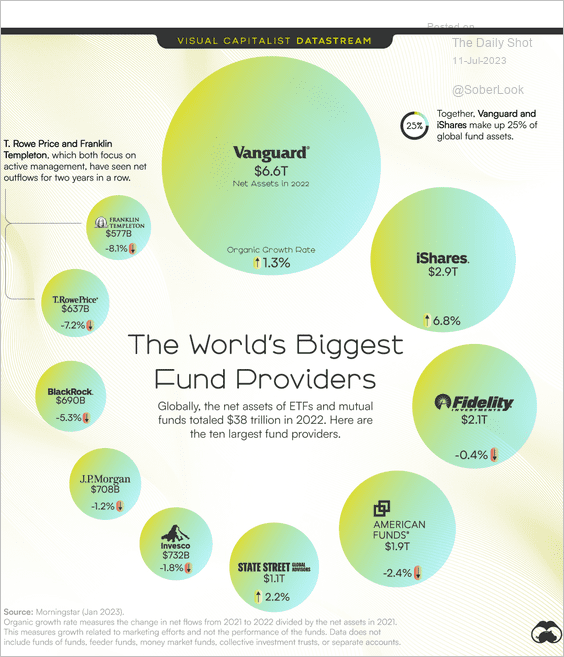 Source: Visual Capitalist Read full article
5. Cutting back on tips:
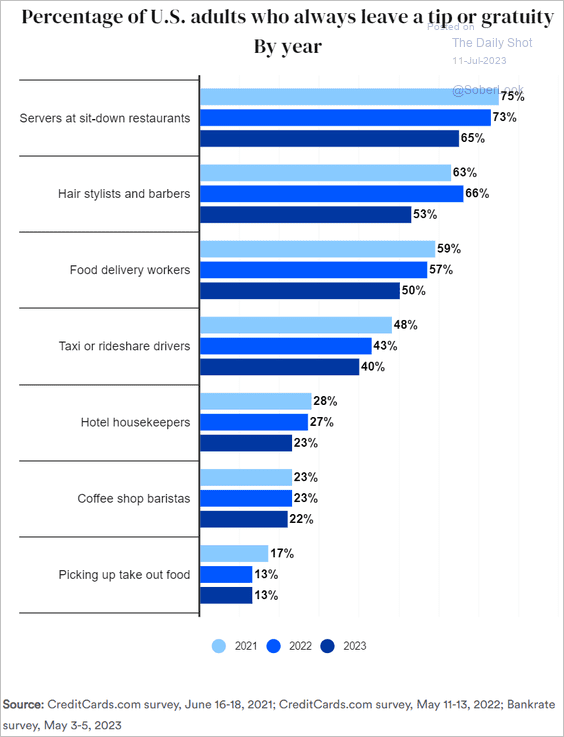 Source: Bankrate Read full article
6. EVs are expected to make up 91% of the global light-duty vehicle fleet by 2050.
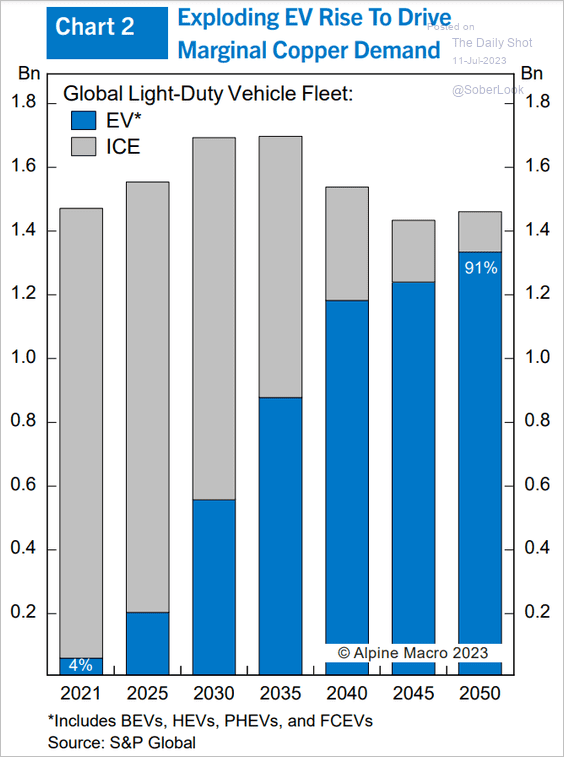 Source: Alpine Macro
7. Homes with air conditioning that use individual units:
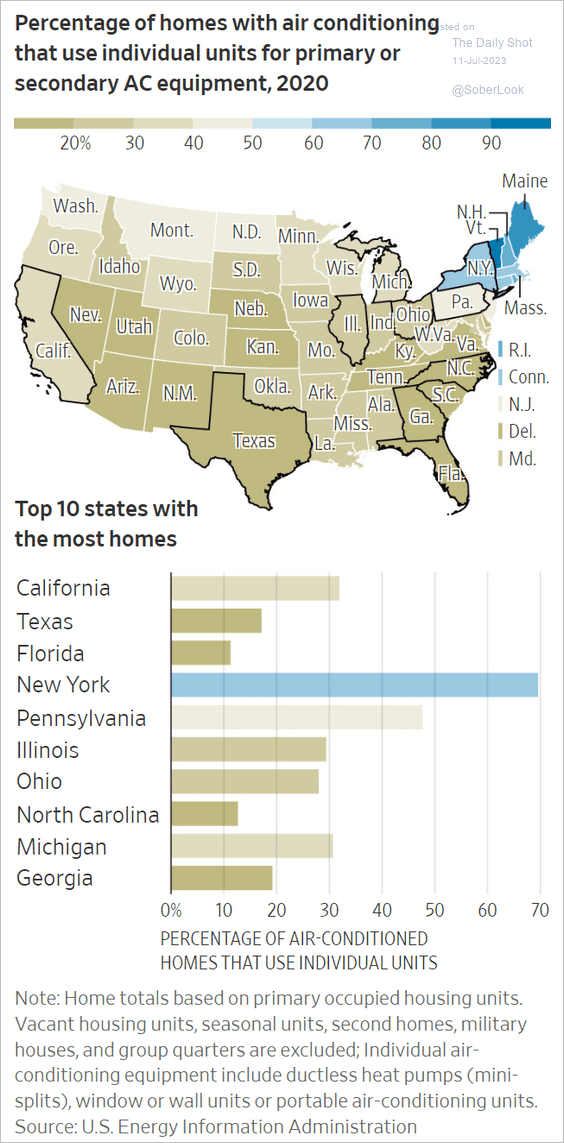 Source: @WSJ Read full article
——————–
Back to Index