
The Daily Shot: 12-Jul-23
• The United States
• The United Kingdom
• The Eurozone
• Europe
• Japan
• China
• Emerging Markets
• Cryptocurrency
• Commodities
• Energy
• Equities
• Credit
• Rates
• Global Developments
• Food for Thought
The United States
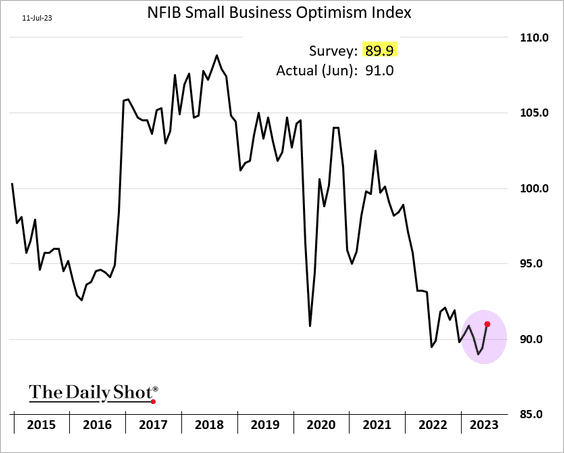
1. The NFIB small business sentiment index showed some improvement in June.
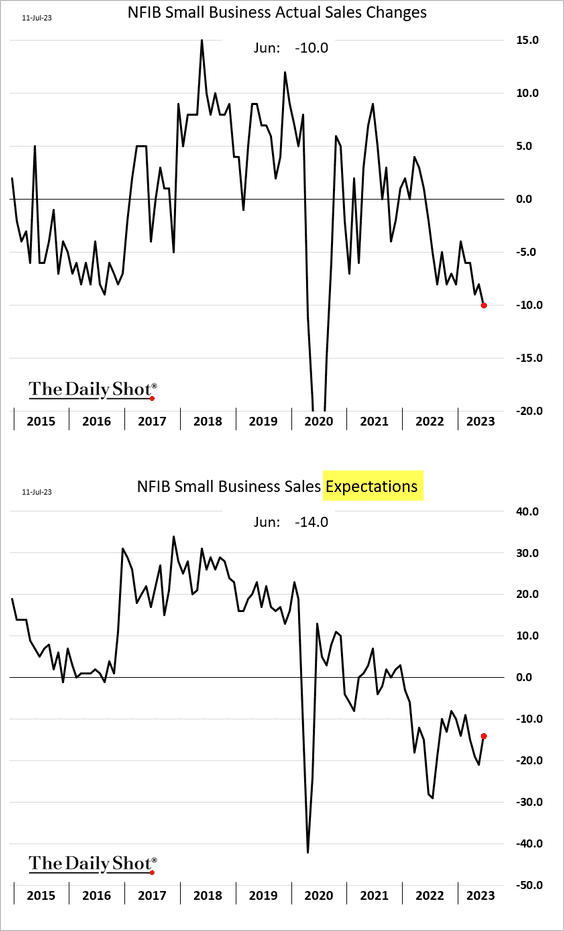
• Even as businesses continue to report a downward trend in sales, their sales projections were slightly less gloomy last month.
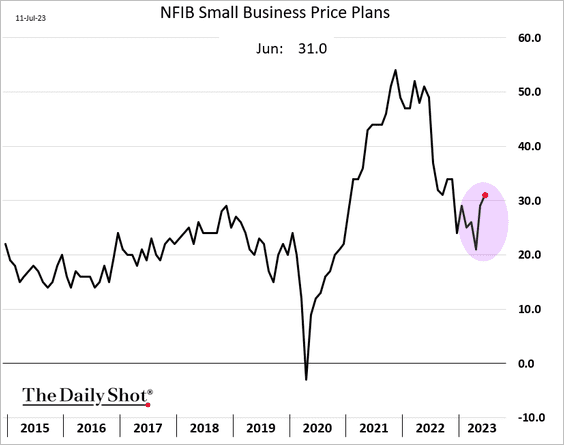
• More companies plan to boost prices.
A separate survey shows that raising prices to defend margins remains a popular strategy.
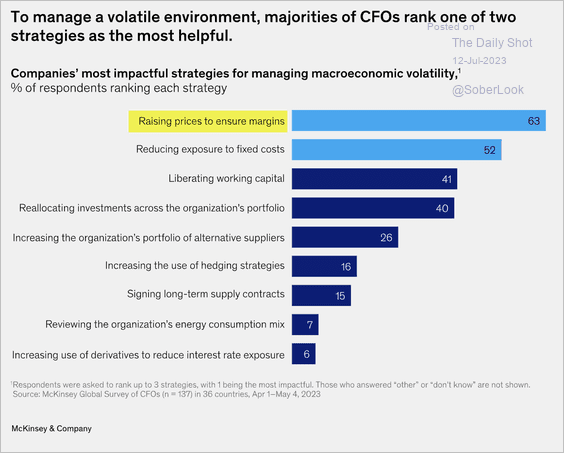 Source: McKinsey & Company Read full article
• The NFIB report signals slower wage growth ahead.
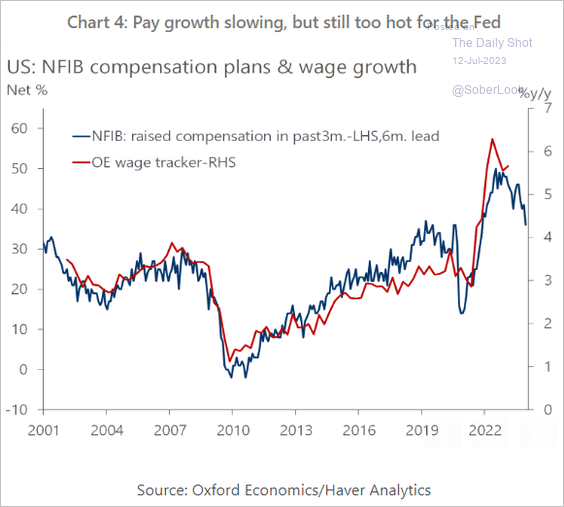 Source: Oxford Economics
——————–
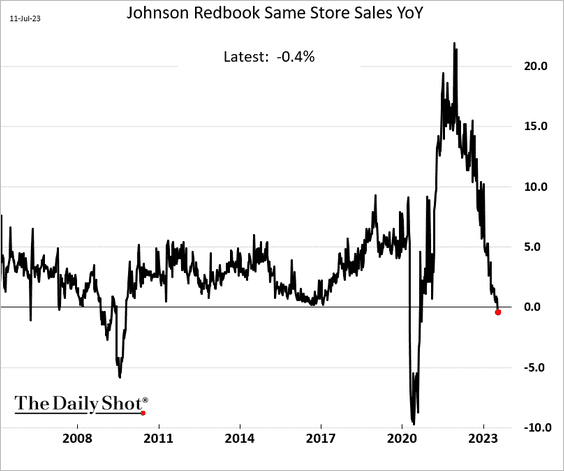
2 The Johnson Redbook index of same-store sales is now down year-over-year for the first time since the 2020 COVID shock.
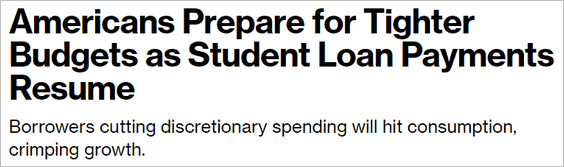
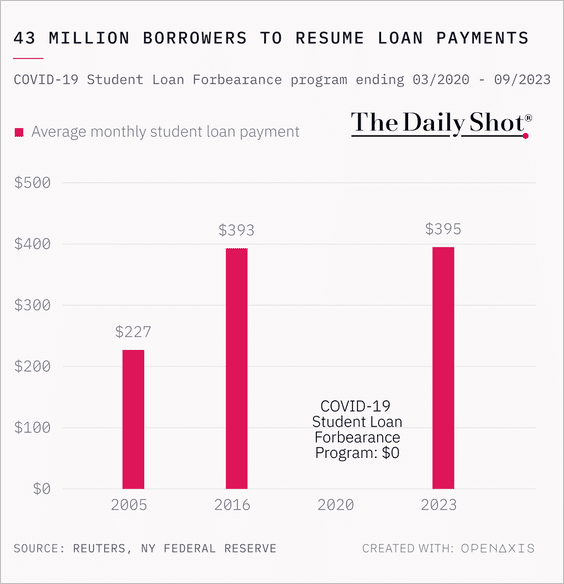
3. The impending student loan reckoning is anticipated to strain consumer spending.
 Source: @cfb_18, @gutavsaraiva
 Source: @TheDailyShot Further reading
——————–
4. Office visits increased across the country in June.
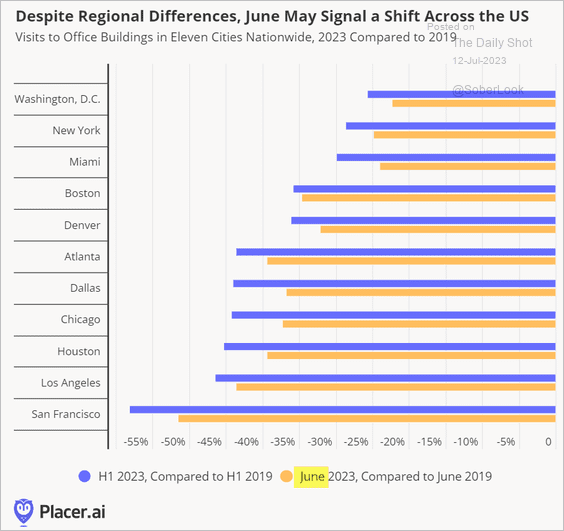 Source: Placer.ai
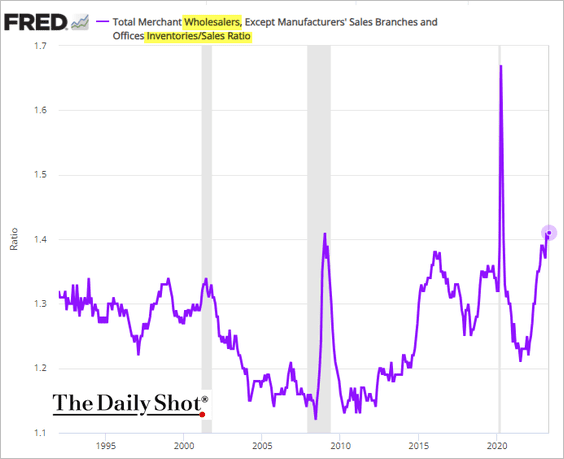
5. The wholesale inventories-to-sales ratio remains elevated.
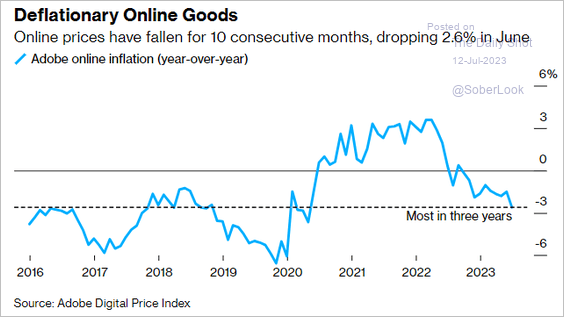
6. Online goods prices have been in deflation mode for ten months in a row.
 Source: @atanzi, @economics Read full article
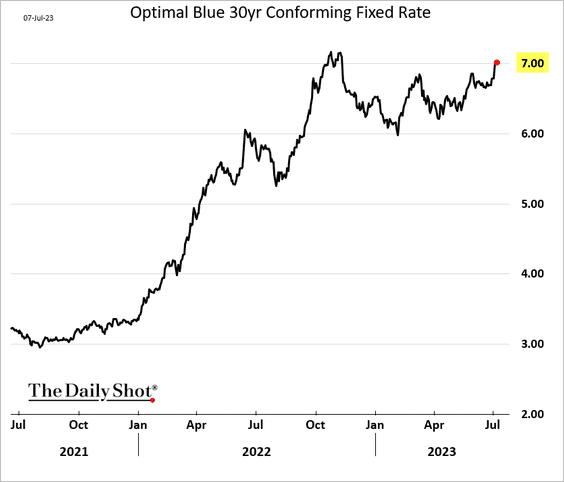
7. Next, we have some updates on the housing market.
• Mortgage rates are hovering around 7%.
– Most homeowner mortgages are well below current market rates.
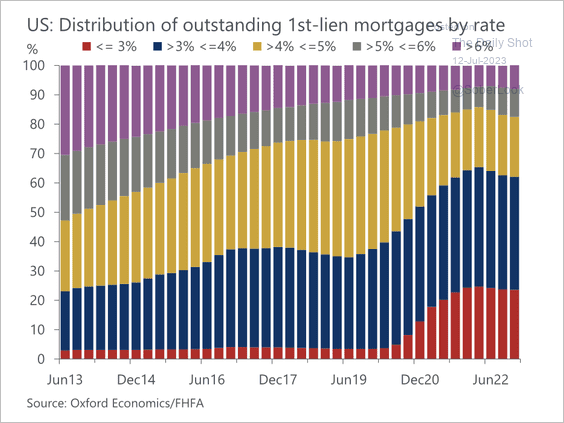 Source: Oxford Economics
– Adjustable-rate mortgages are a small share of the market.
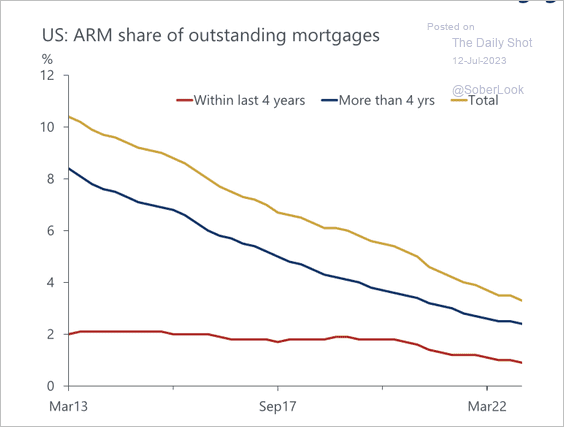 Source: Oxford Economics
• The rapid rise in rates has more than doubled monthly mortgage payments from pandemic lows, significantly denting affordability.
– Monthly payments:
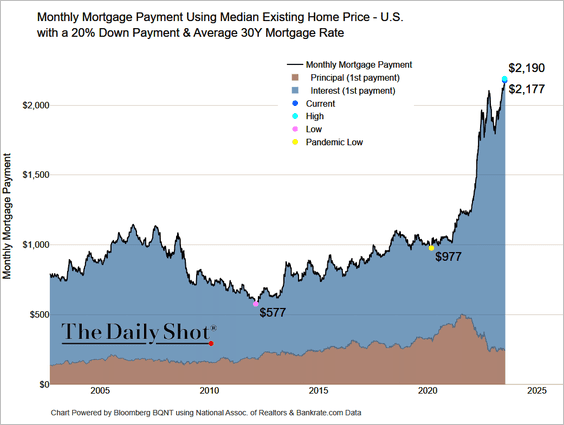 Source: @TheTerminal, Bloomberg Finance L.P.
– How much home can you buy with a $2,500 monthly mortgage payment?
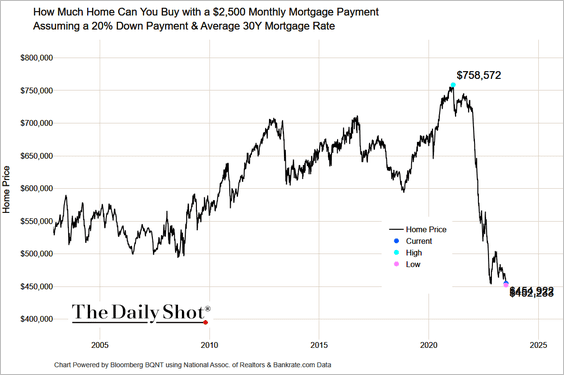 Source: @TheTerminal, Bloomberg Finance L.P.
– Here is a look at housing affordability across states.
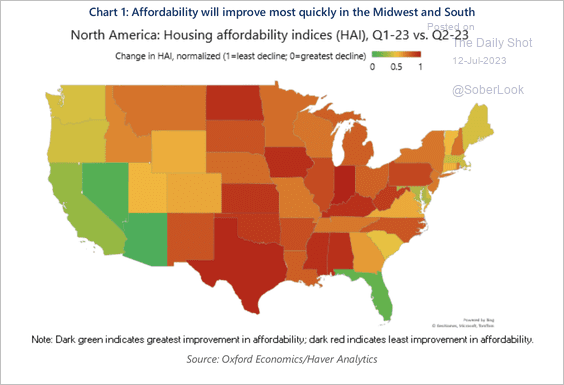 Source: Oxford Economics
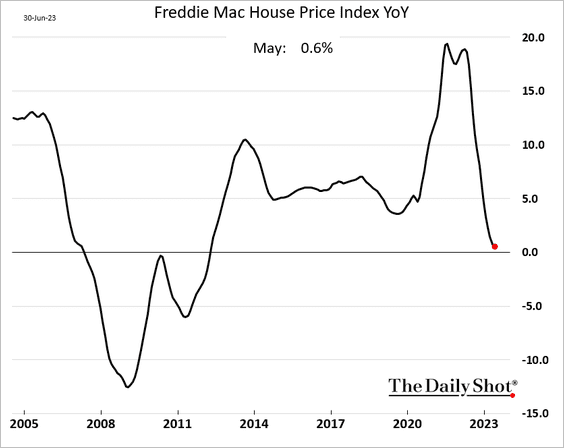
• The Freddie Mac housing index was almost flat in May (year-over-year).
• Current predictions largely indicate a rebound in the year-over-year home price growth.
– AEI Housing Center:
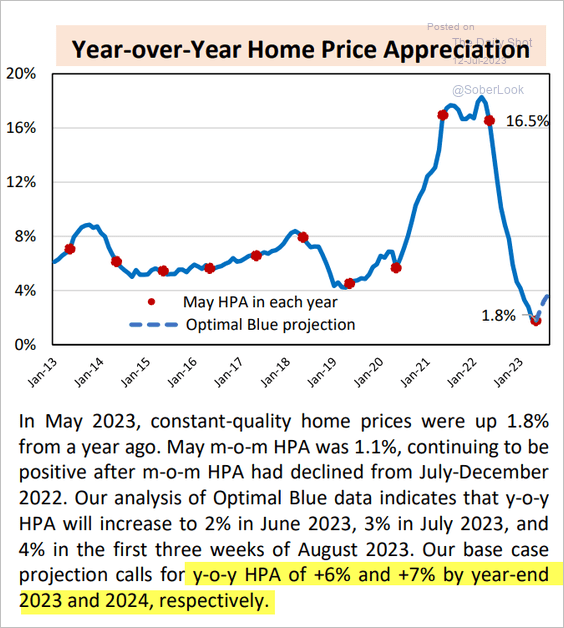 Source: AEI Housing Center
– CoreLogic:
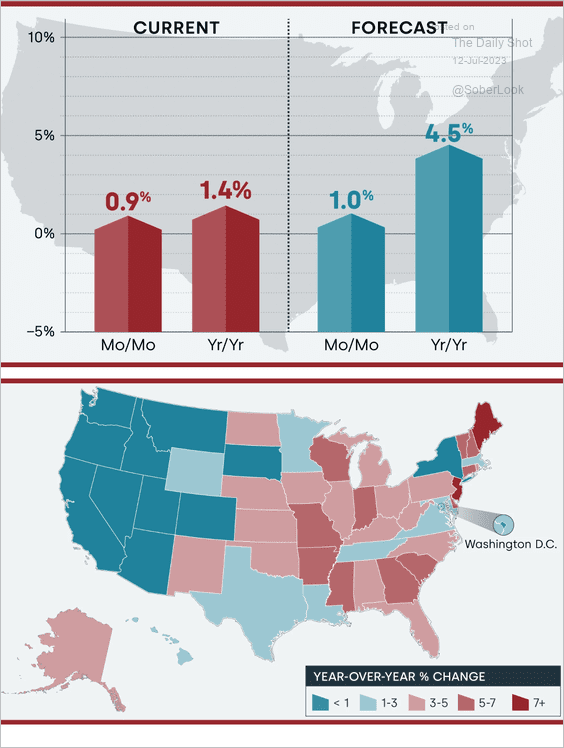 Source: CoreLogic Read full article
• The national inventory of homes for sale continues to deteriorate.
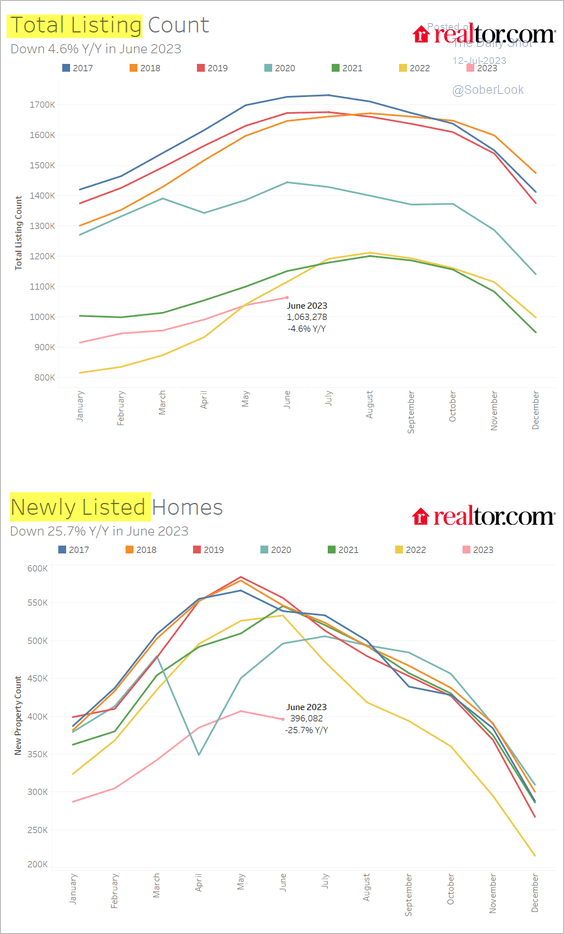 Source: realtor.com
• The median listing price is slightly below 2022 levels.
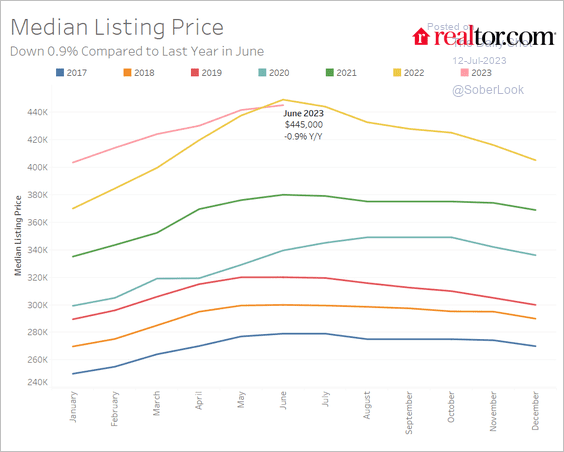 Source: realtor.com
• Housing starts have decoupled from permits, although there are signs of improvement. (2 charts)
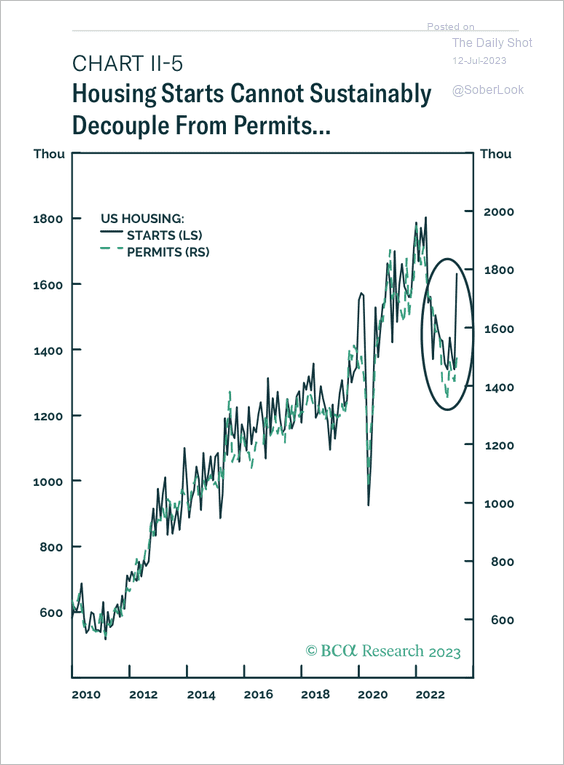 Source: BCA Research
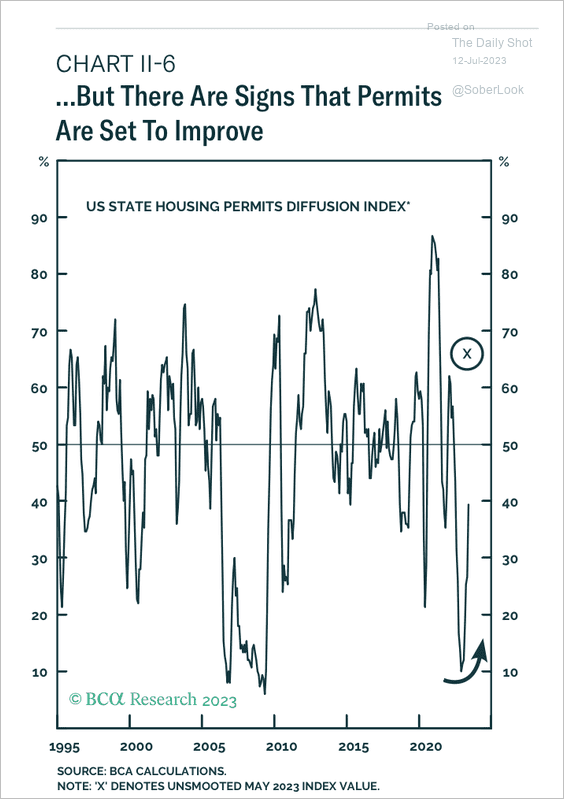 Source: BCA Research
——————–
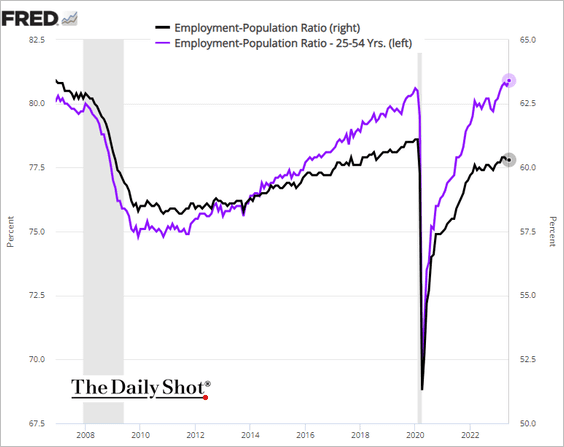
Correction: Yesterday’s employment-to-population ratio chart did not cover the full range. Here is the correct image.
Back to Index
The United Kingdom
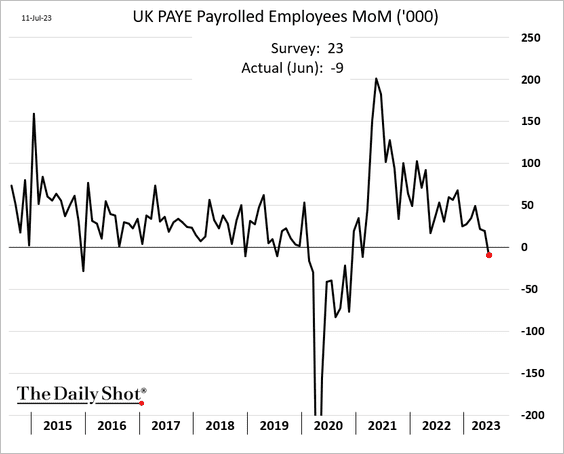
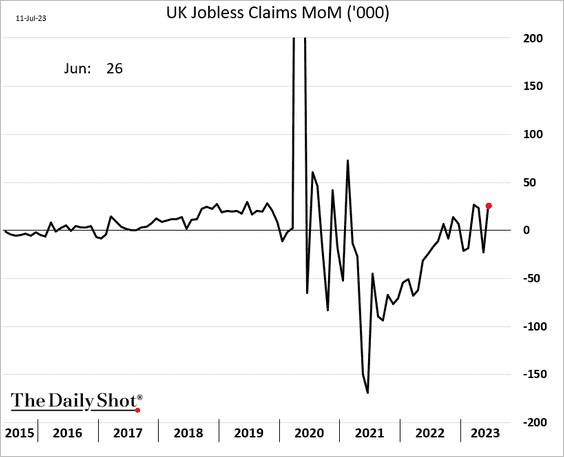
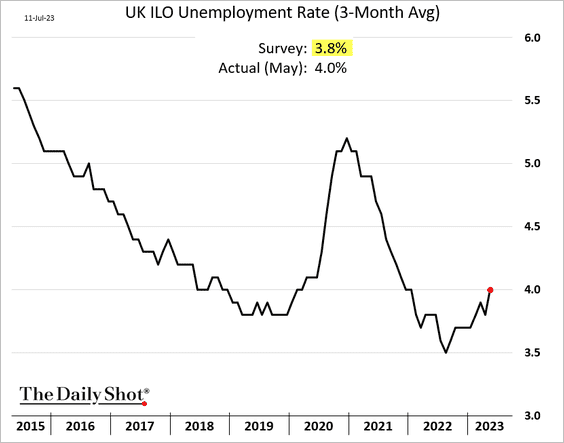
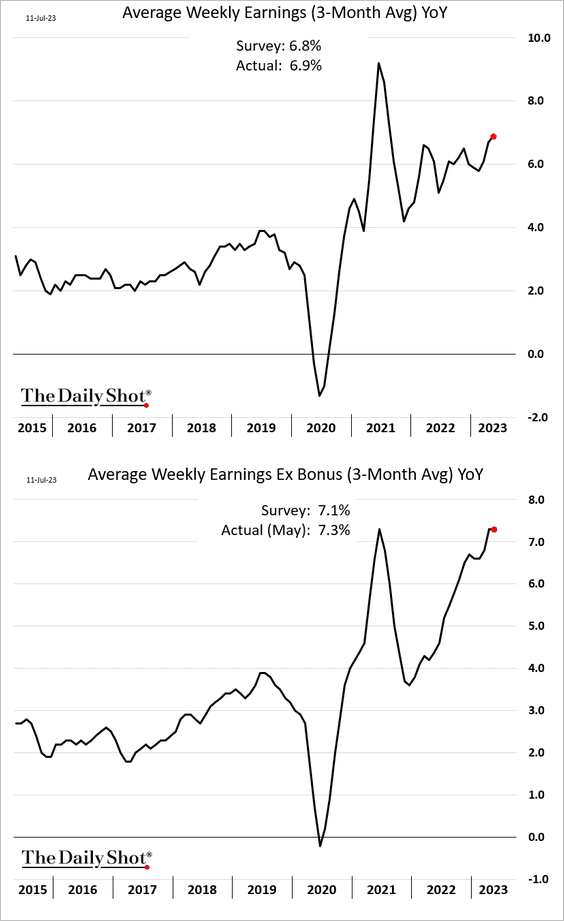
1. The UK employment report revealed cracks in the job market, even as wage growth remains robust.
– Payrolls:
– Jobless claims:
– The unemployment rate:
– Wage growth:
• Permanent placements have been slowing.
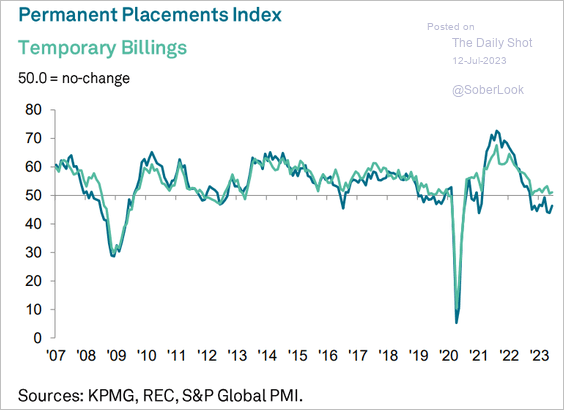 Source: S&P Global PMI
• Job openings are declining (2 charts), …
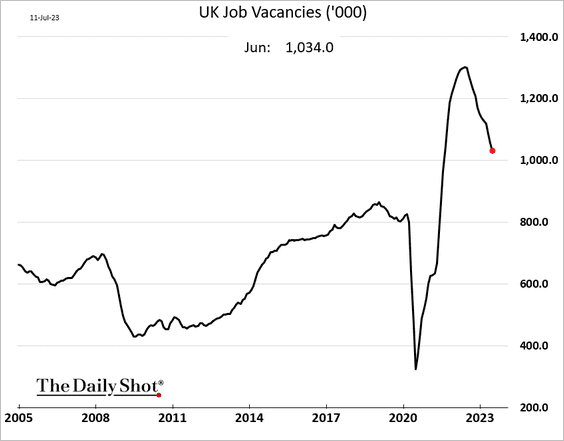
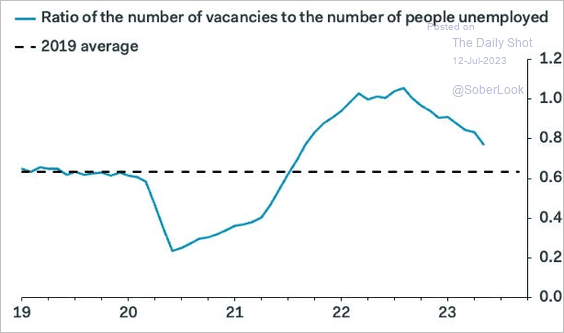 Source: Pantheon Macroeconomics
… as worker shortages ease, …
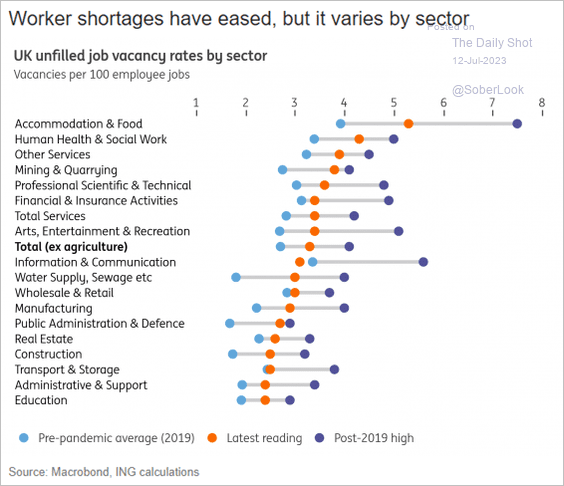 Source: ING
… helped by foreign worker inflows.
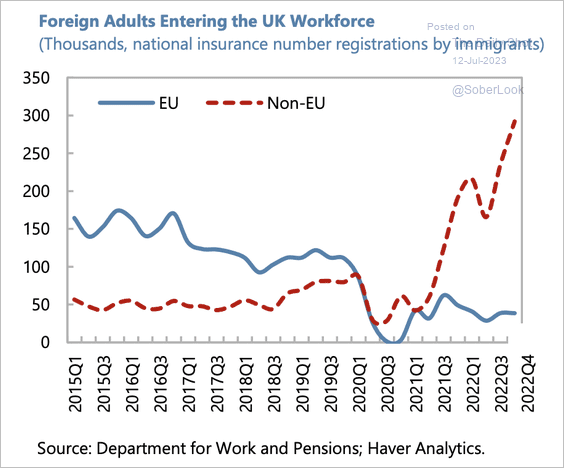 Source: IMF Read full article
——————–
2. Similar to the US, rising rates and higher monthly payments have impacted affordability.
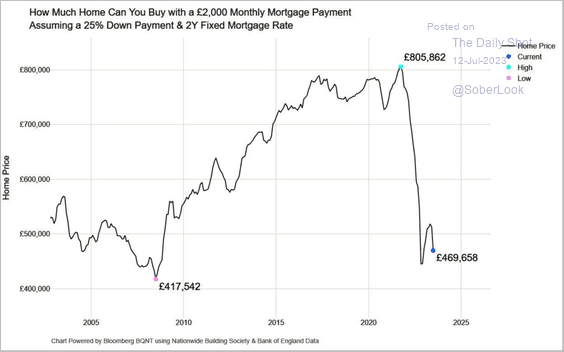 Source: Owen Minde
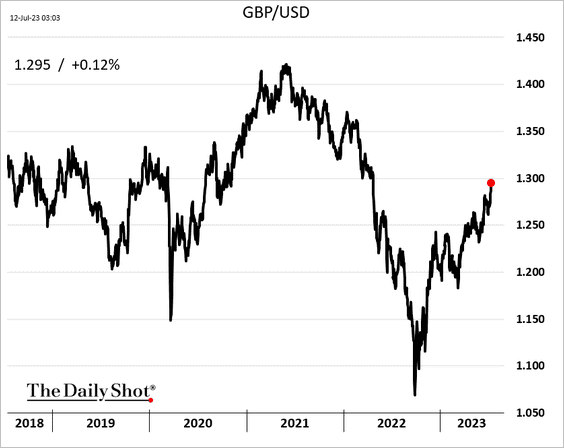
3. The GBP/USD rally has accelerated.
Back to Index
The Eurozone
1. Germany’s ZEW expectations index continues to sink.
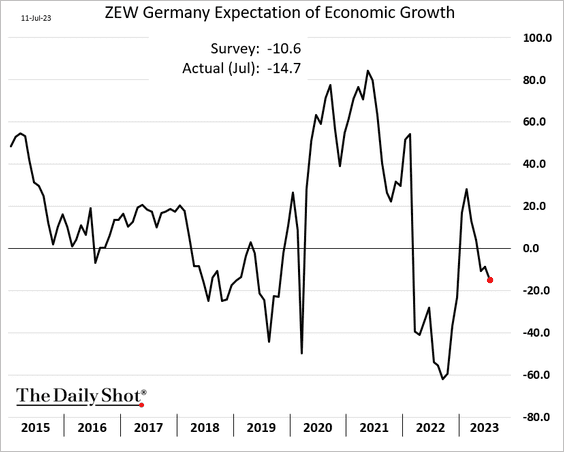
 Source: Reuters Read full article
——————–
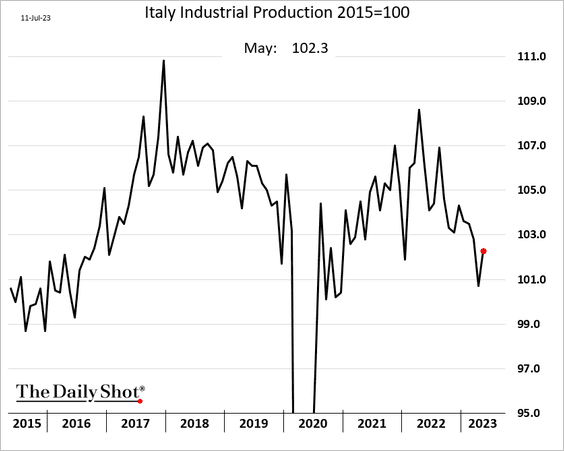
2. Italian industrial production bounced in May.
3. Job growth in Spain and Germany has been dominated by the public sector.
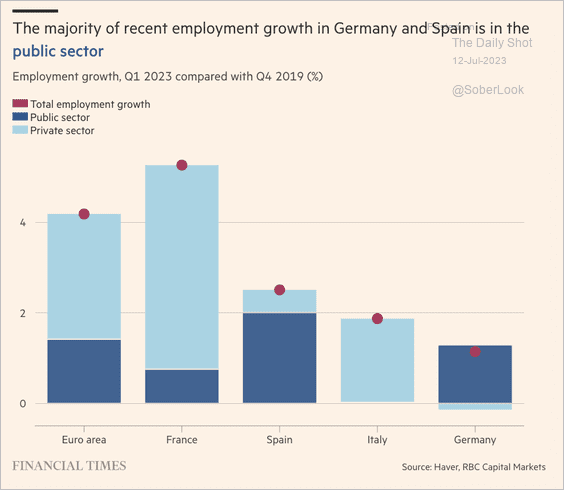 Source: @financialtimes Read full article
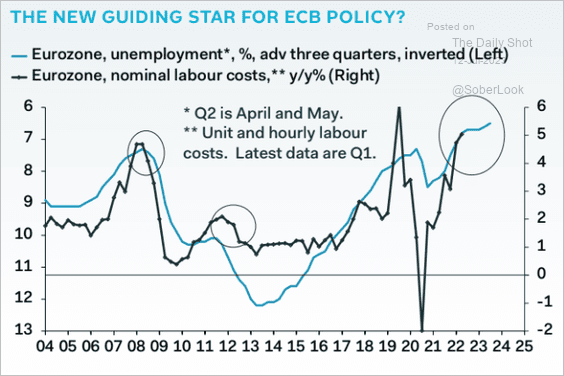
4. Eurozone labor costs are heading higher.
 Source: Pantheon Macroeconomics
Back to Index
Europe
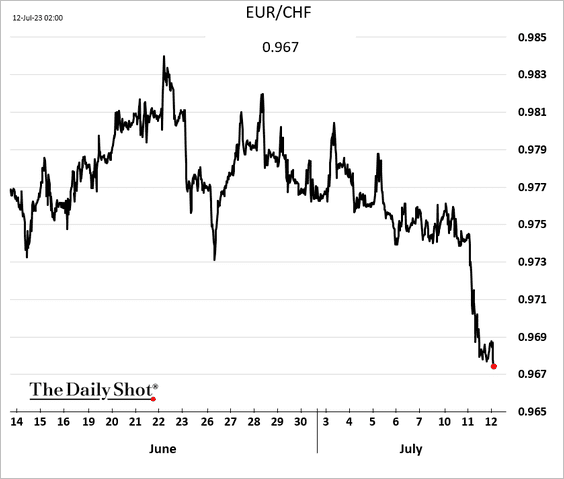
1. The Swiss franc is surging.
2. European natural gas consumption remains below average.
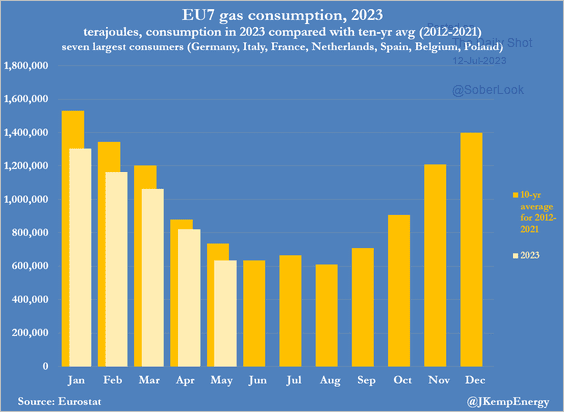 Source: @JKempEnergy
3. This chart shows the number of vehicles and road fatalities in the EU.
 Source: @ACEA_auto
4. Many parts of Europe face water shortages.
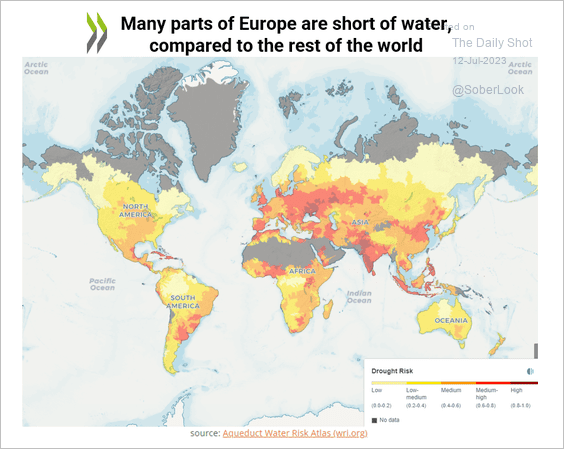 Source: OECD Read full article
——————–
Correction: Here is an up-to-date map of Ukrainian refugees in Europe (yesterday’s map was outdated).
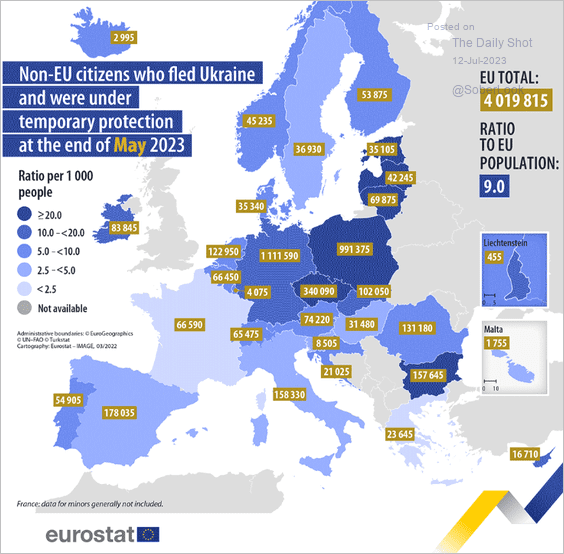 Source: Eurostat Read full article
Back to Index
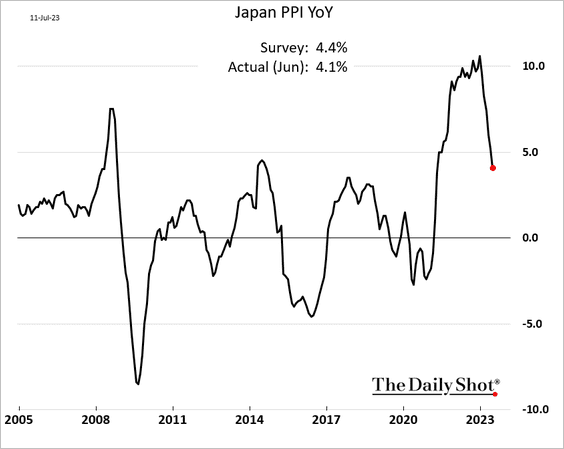
Japan
1. The PPI is slowing rapidly.
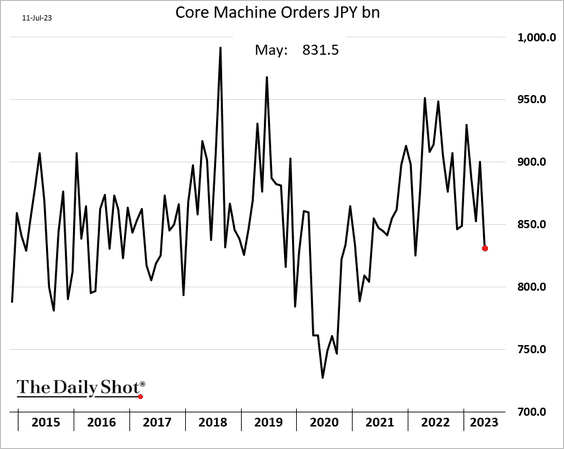
2. Machinery orders declined sharply in May.
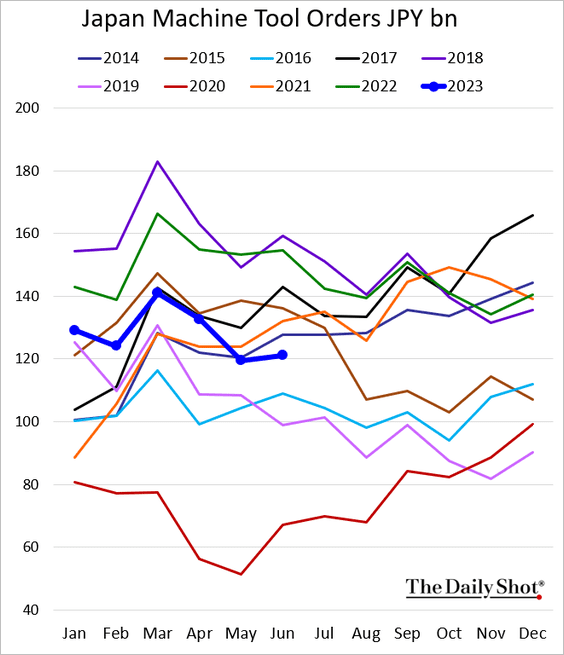
3. Machine tool orders were weak last month.
Back to Index
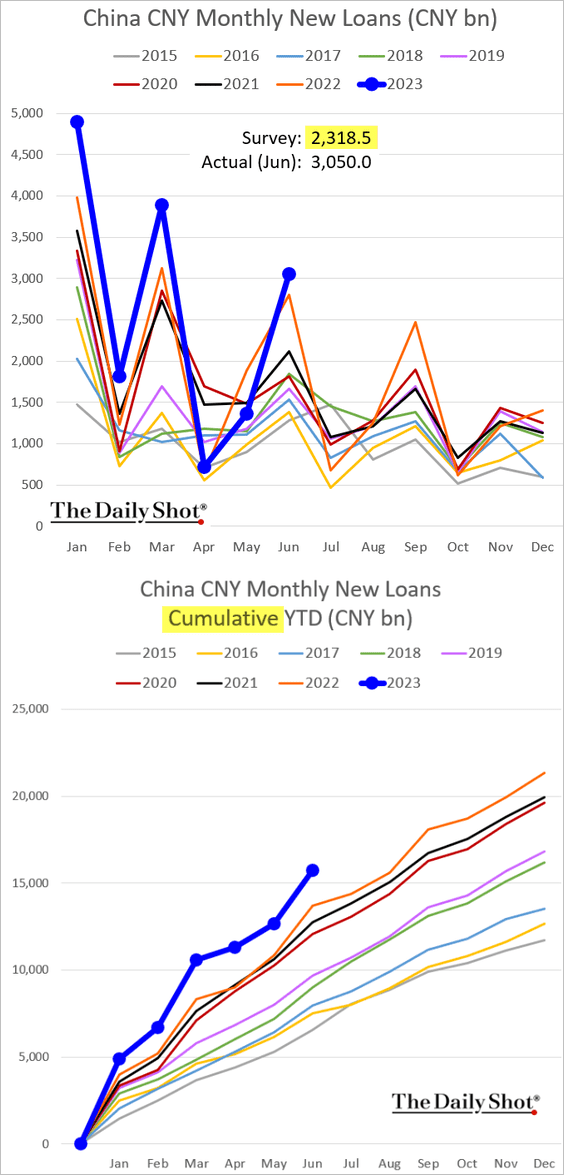
China
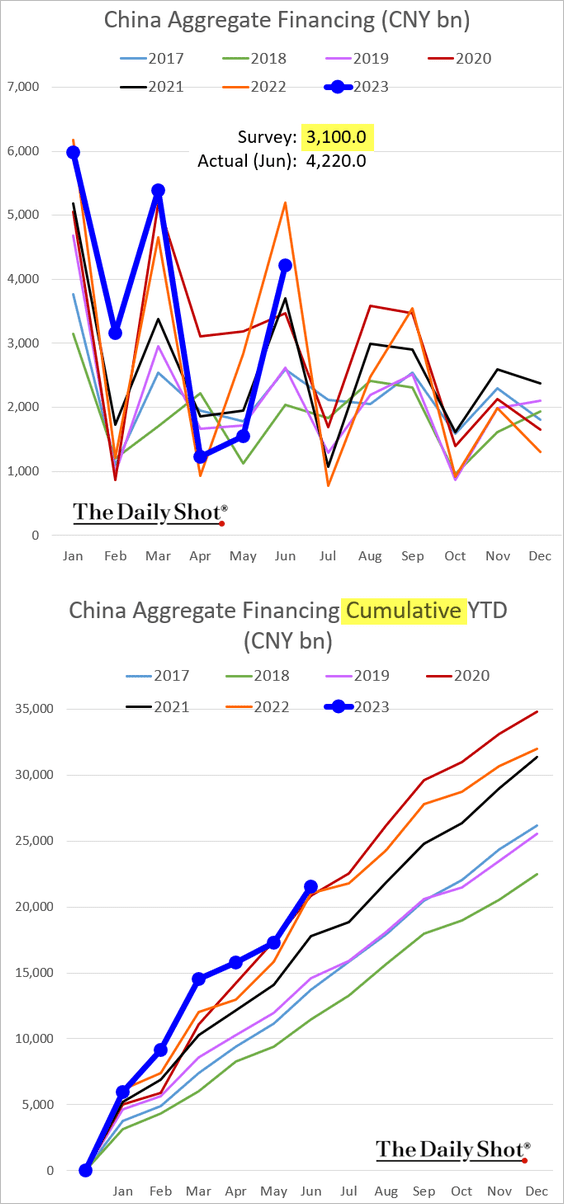
1. Last month’s credit growth was stronger than expected.
 Source: @markets Read full article
– CNY loans:
– Aggregate financing:
But the overall credit growth continues to slow.
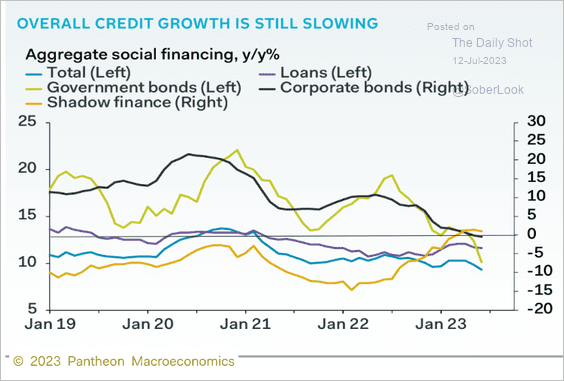 Source: Pantheon Macroeconomics
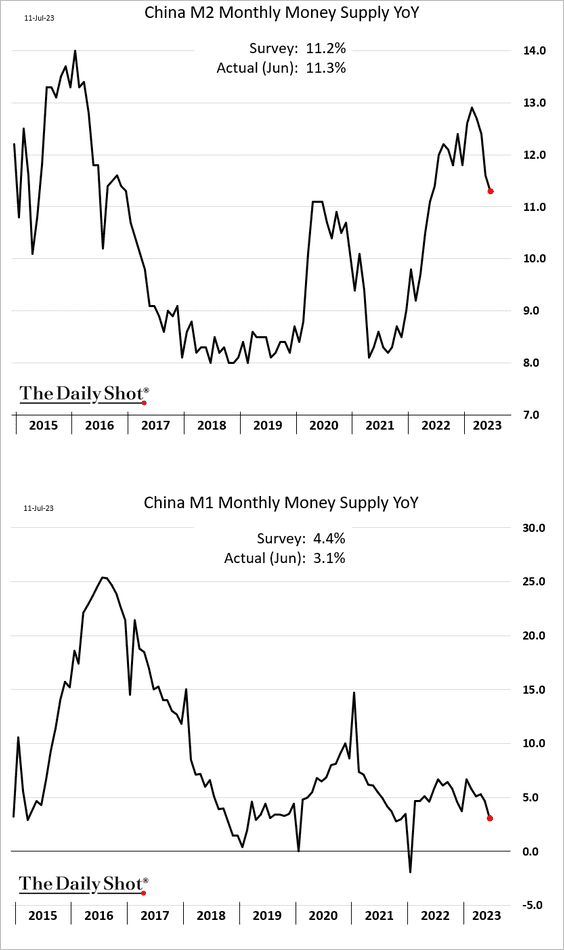
Here are the money supply metrics.
——————–
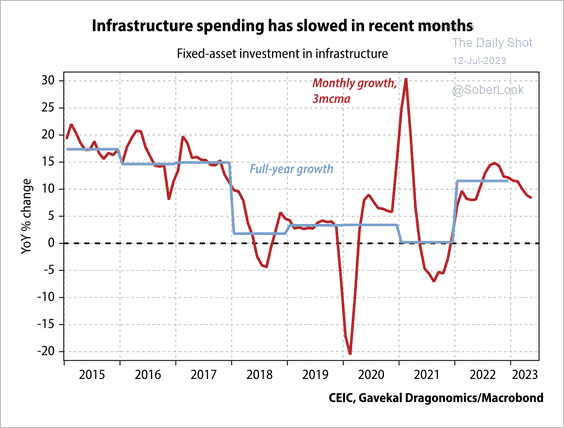
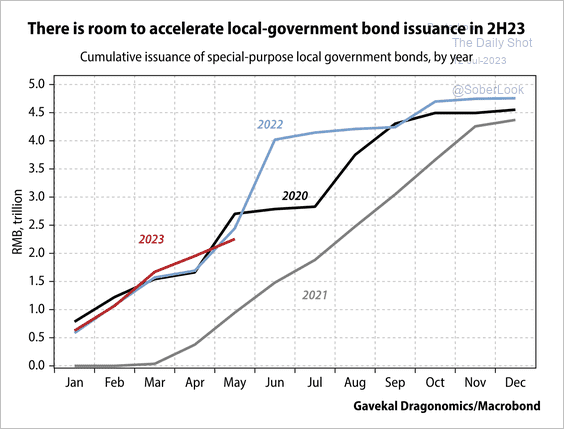
2. Will local government special-purpose bond issuance boost infrastructure spending? (2 charts)
 Source: Gavekal Research
 Source: Gavekal Research
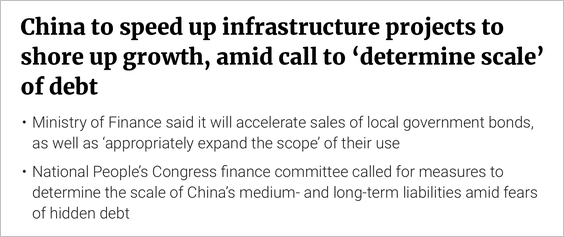 Source: SCMP Read full article
——————–
3. Domestic carmakers are increasingly dominating the market.
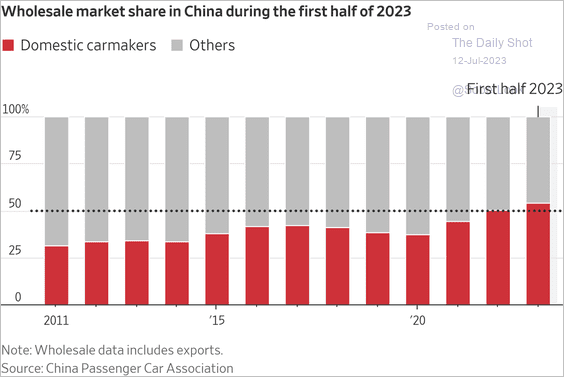 Source: @WSJ Read full article
4. The Shanghai Shenzhen CSI 300 Index is consolidating.
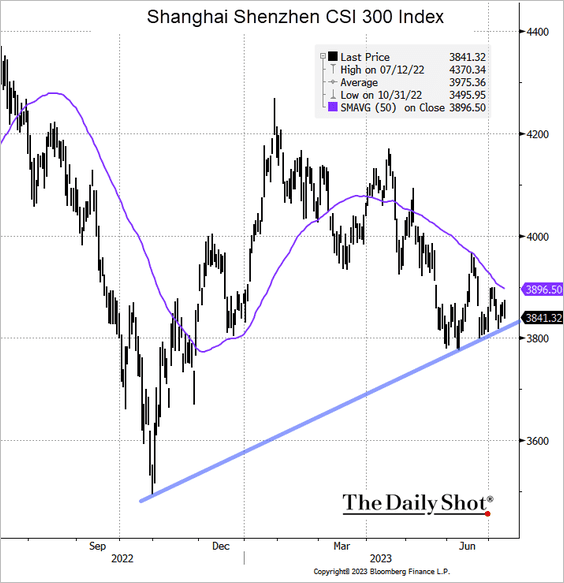 Source: @TheTerminal, Bloomberg Finance L.P.
5. China’s marriage rate hit a new low.
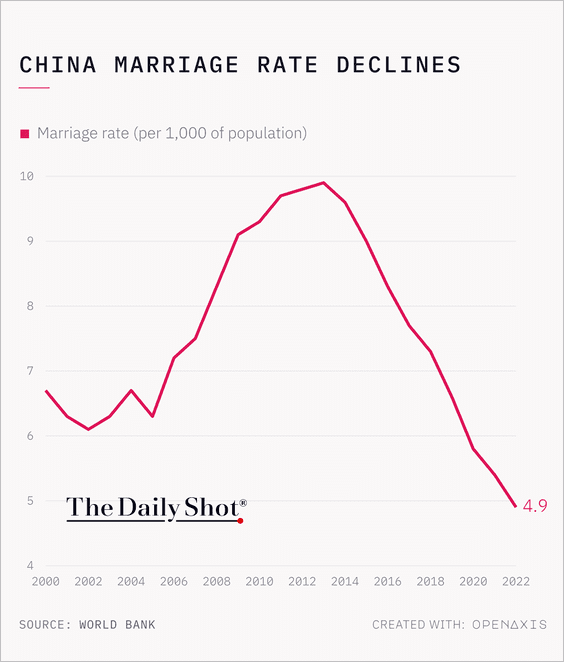 Source: @TheDailyShot Further reading
Back to Index
Emerging Markets
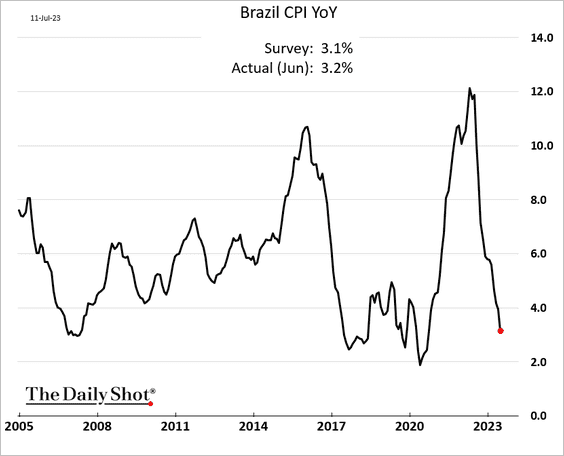
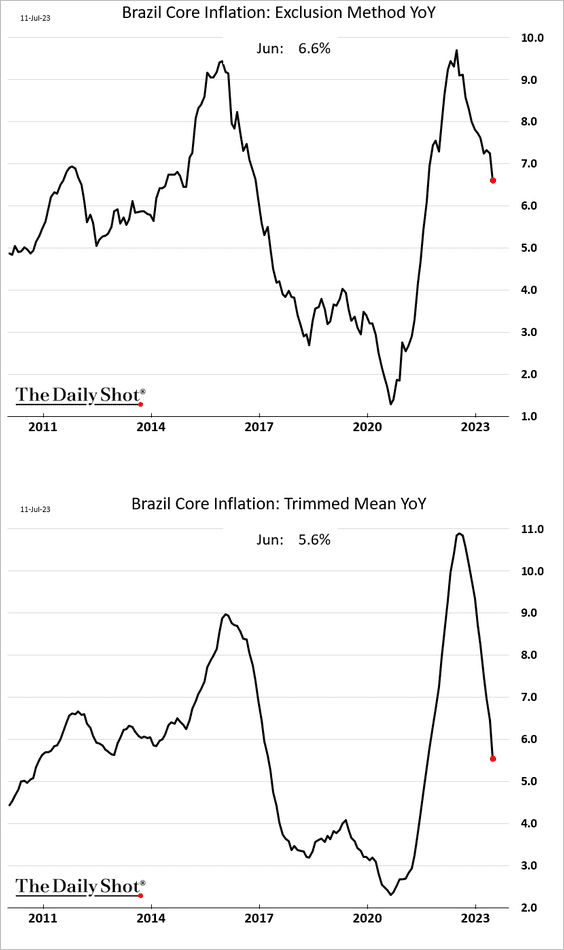
1. Brazil’s falling inflation signals a rate cut next month.
• Headline CPI:
• Core CPI:
——————–
2. Russia’s current account surplus declined sharply this year, with the Q2 print coming in well below forecasts.
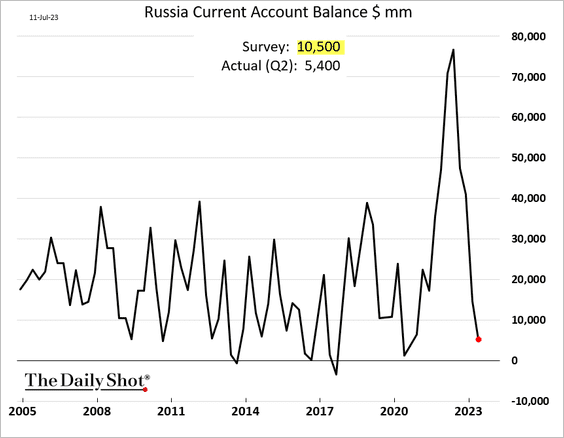
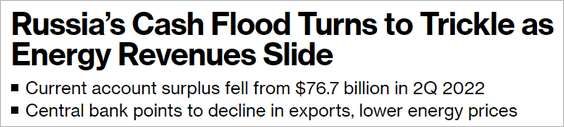 Source: @markets Read full article
——————–
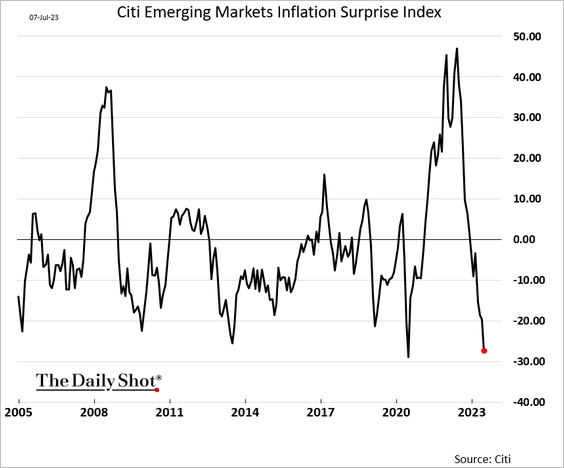
3. EM inflation has been surprising to the downside.
4. This chart shows sovereign debt renegotiations and write-offs involving China’s lenders.
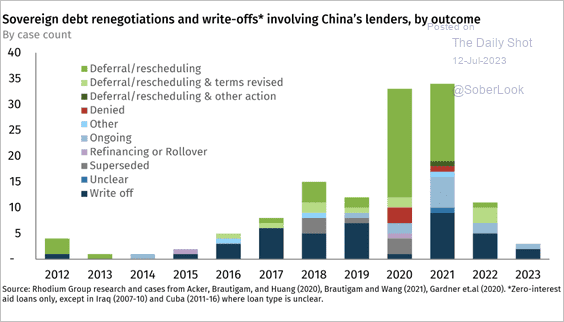 Source: Rhodium Group Read full article
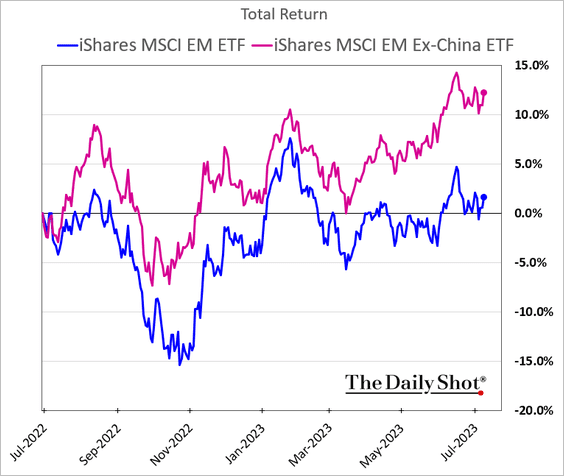
5. China’s shares have been a drag on EM performance.
 Further reading
6. EM equity ETFs’ implied volatility is near record lows.
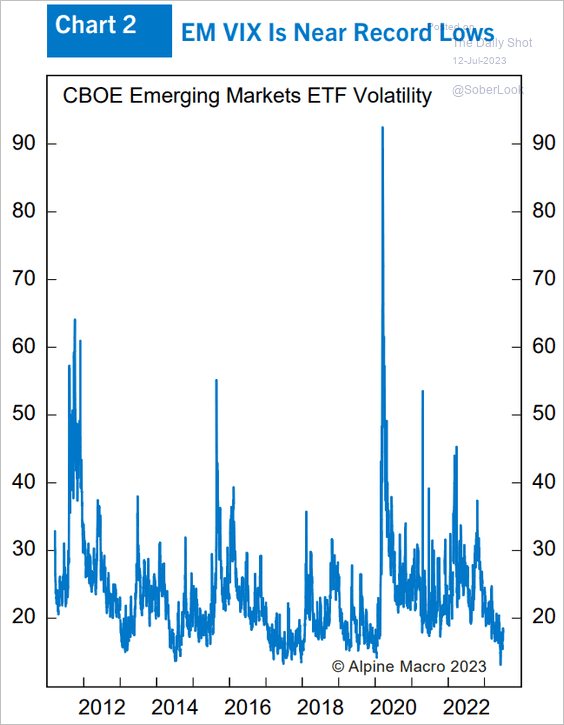 Source: Alpine Macro
Back to Index
Cryptocurrency
1. Bitcoin’s trading volatility has been very low as searches for ‘cryptocurrency regulation’ declined.
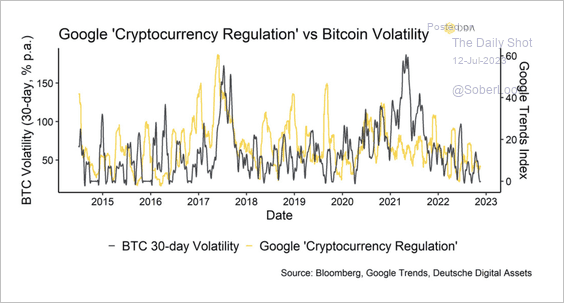 Source: Deutsche Digital Assets
2. According to Deutsche Digital Assets, a significant decline in real yields alongside monetary policy easing could provide a tailwind for bitcoin.
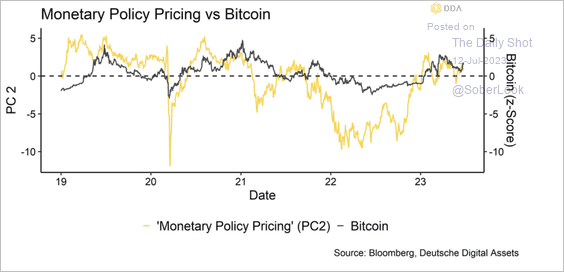 Source: Deutsche Digital Assets
3. Crypto funds saw three straight weeks of inflows, fully correcting the prior nine weeks of outflows.
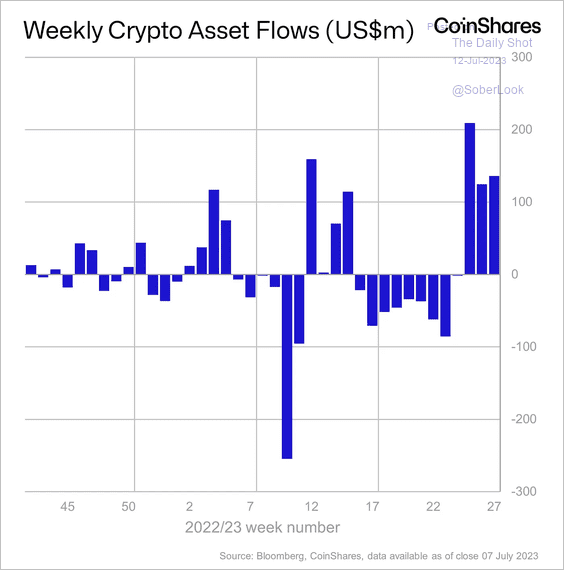 Source: CoinShares Read full article
• Bitcoin products saw the most inflows last week while investors continued to exit short-bitcoin funds.
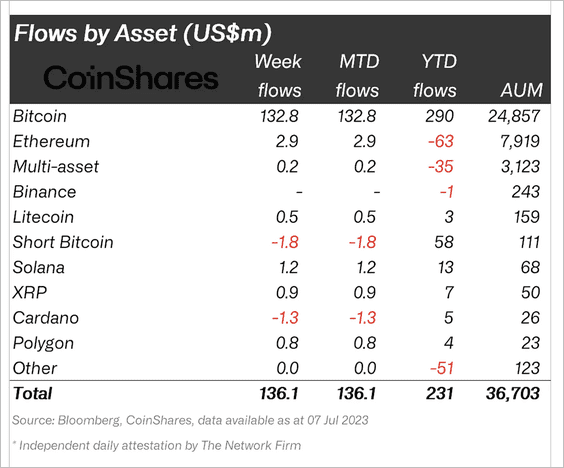 Source: CoinShares Read full article
Back to Index
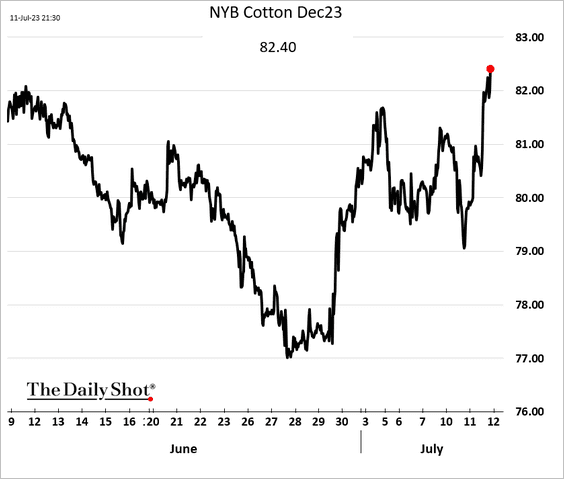
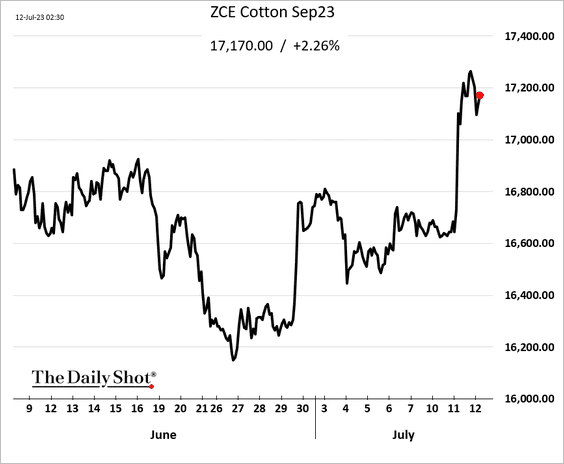
Commodities
1. Cotton futures rallied in New York and Zhengzhou on China’s stimulus hopes and adverse weather conditions in Texas.
——————–
2. The Chicago hog futures rebound continues.
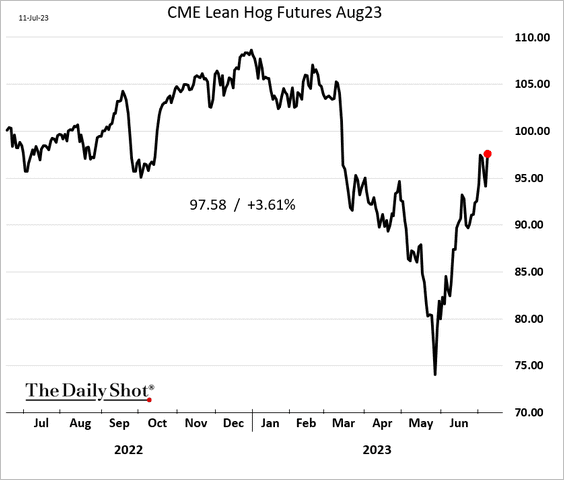
 Source: Farm Journal Read full article
——————–
3. Cocoa supplies are running low.
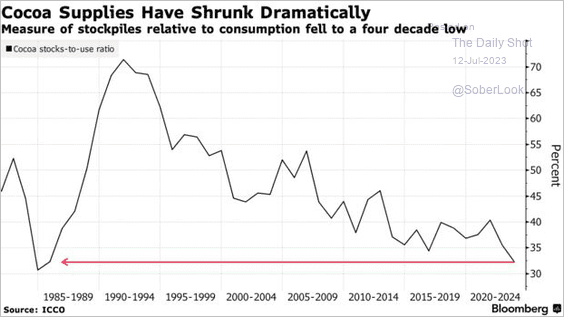 Source: @isiscarol14, @dayannesousa, @MumbiGitau, @markets Read full article
4. The cobalt market is expected to shift into deficit over the next few years.
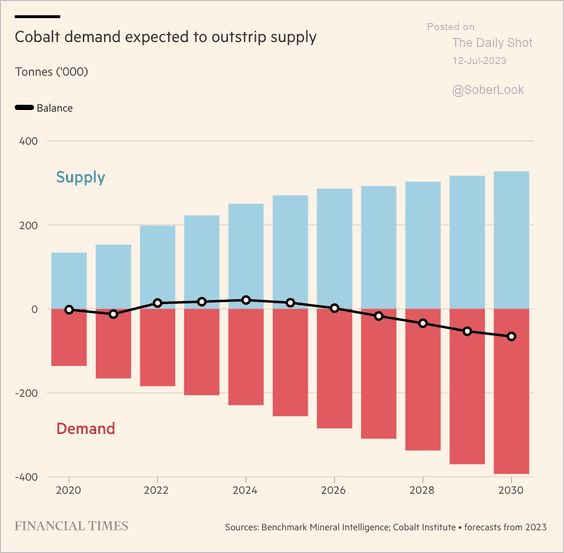 Source: @financialtimes Read full article
Who are the largest suppliers of cobalt?
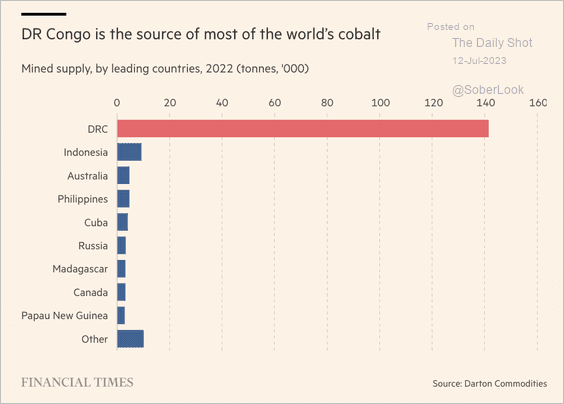 Source: @financialtimes Read full article
5. Here is a look at key metals production.
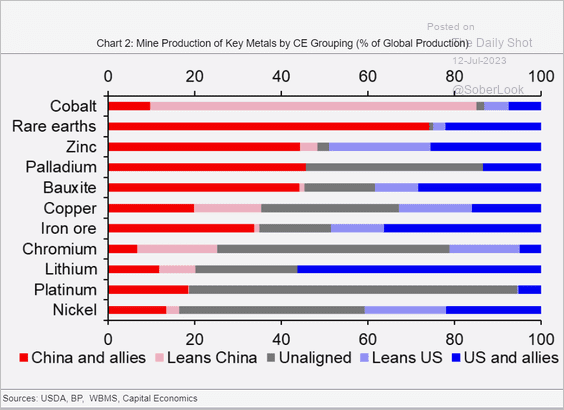 Source: Capital Economics
Back to Index
Energy
1. Brent futures have exited the recent trading range and are testing resistance at $80/bbl.
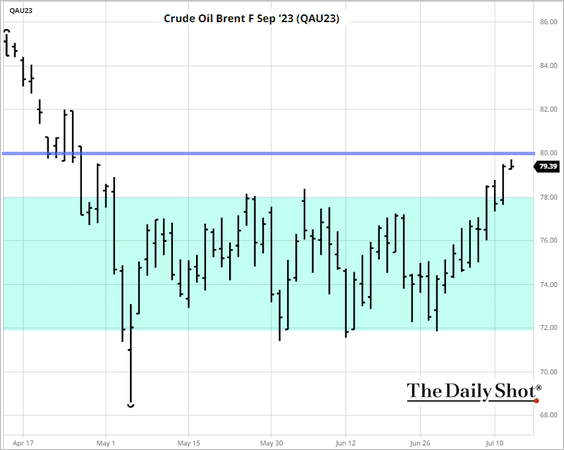 Source: barchart.com
2. Oil implied volatility has been trending lower (2 charts).
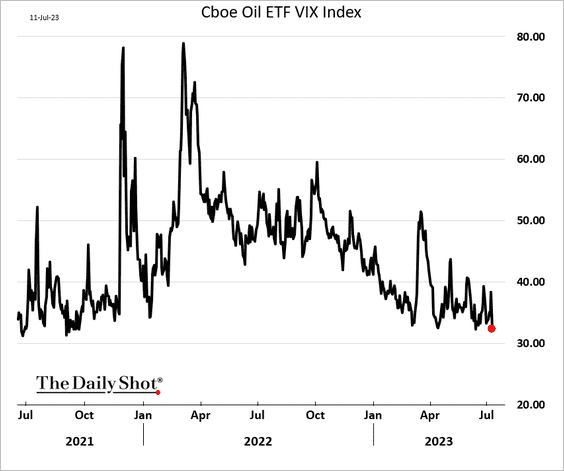
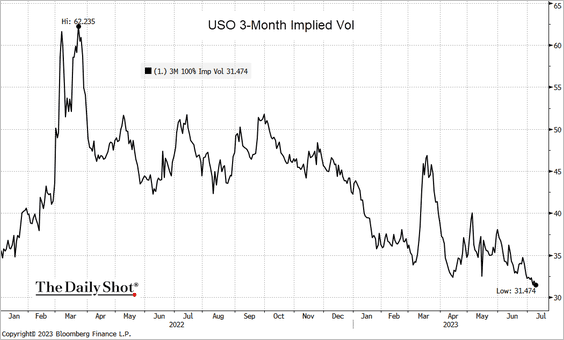 Source: @TheTerminal, Bloomberg Finance L.P.
——————–
3. Here is a look at O&G drilling CapEx.
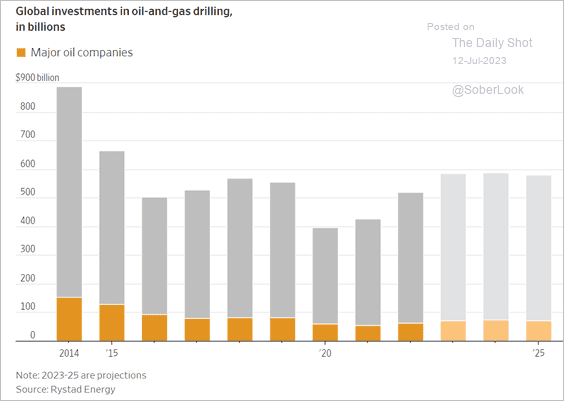 Source: @WSJ Read full article
Back to Index
Equities
1. Global investors are very bearish on US stocks.
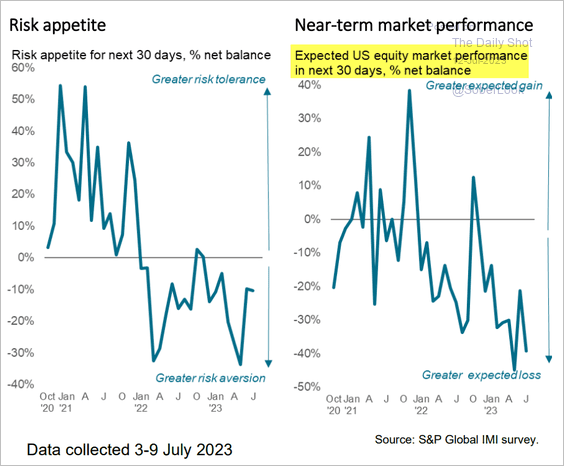 Source: S&P Global
• Here is the percentage of JP Morgan’s clients planning to increase their equity exposure.
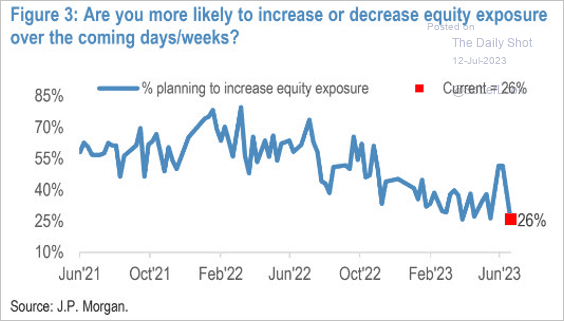 Source: JP Morgan Research; @dailychartbook
• Hedge funds went on a shorting spree last week as yields surged.
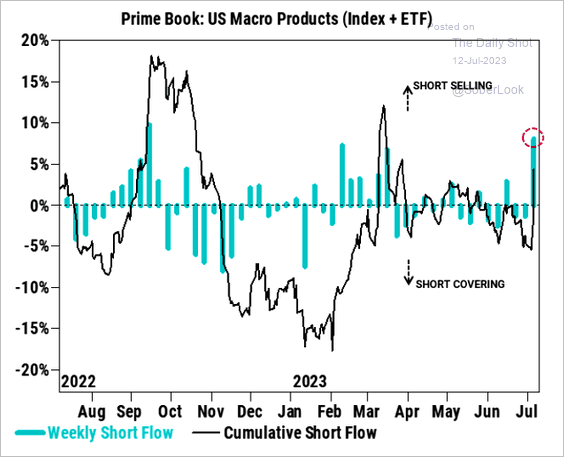 Source: Goldman Sachs; @themarketear
——————–
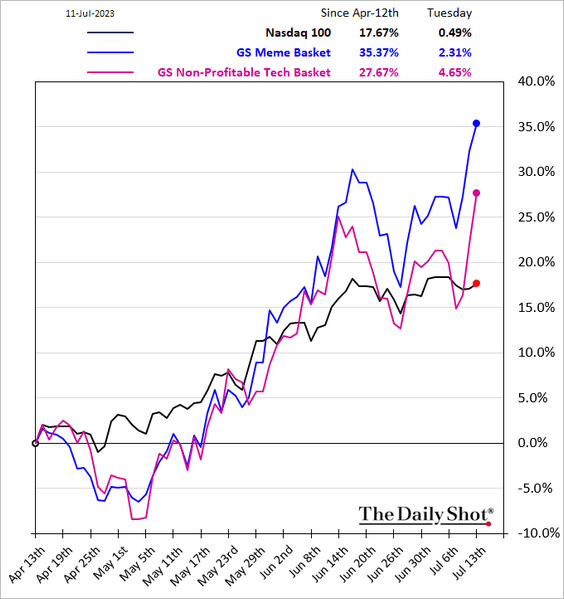
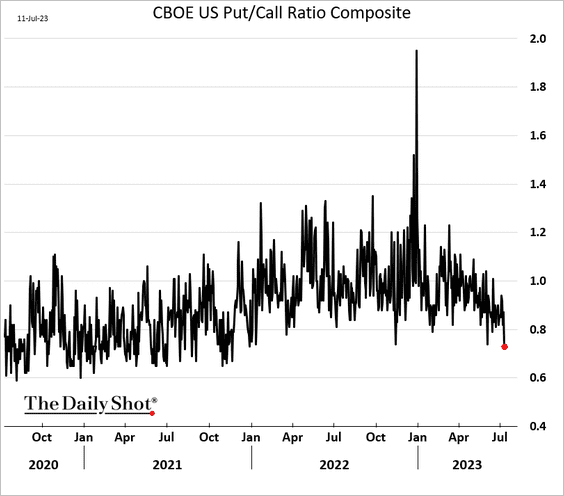
2. While money managers and institutions are cautious, the Reddit crowd is happy to buy. Speculative stocks are outperforming.
• The CBOE put-call ratio hit the lowest level since 2021.
——————–
3. This chart shows the percentage of stocks outperforming the S&P 500 (market breadth).
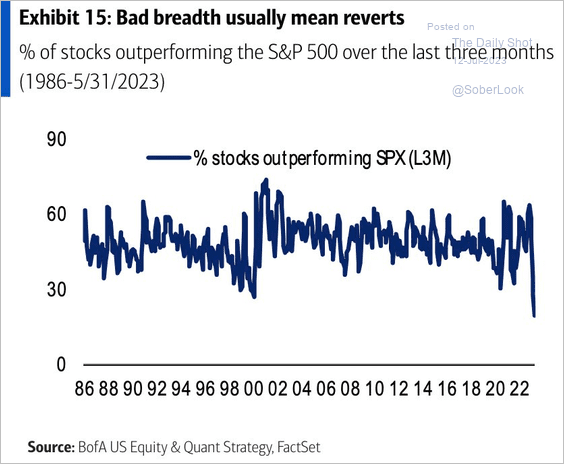 Source: BofA Global Research
4. The correlation between the Nasdaq 100 and small caps (including small-cap growth stocks) has deteriorated.
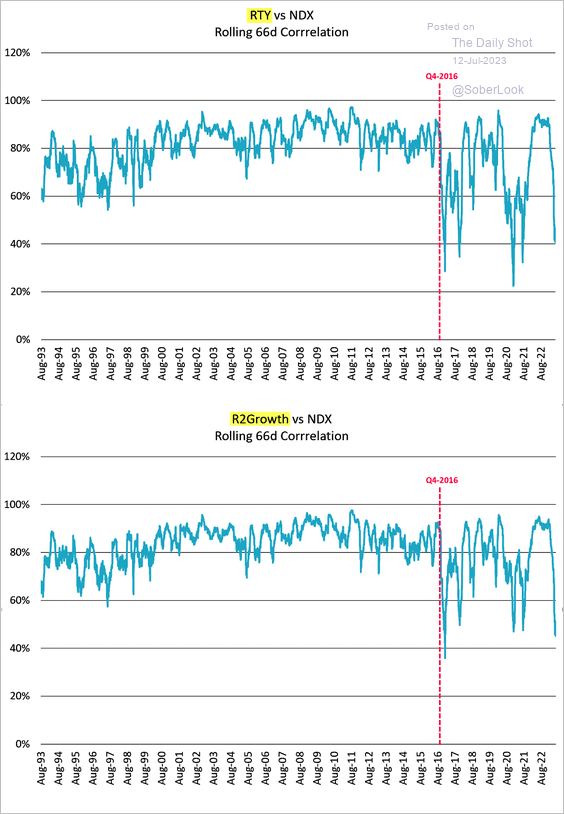 Source: @t1alpha
5. Next, we have some sector updates.
• US financial stocks are starting to improve relative to the S&P 500.
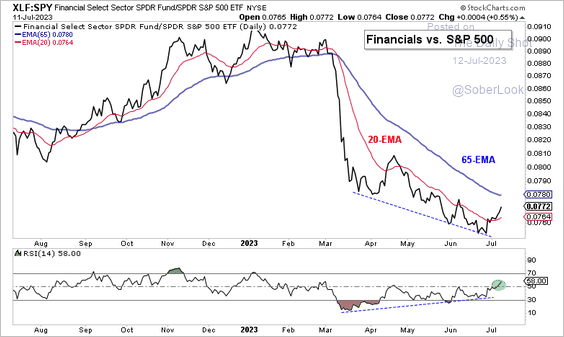 Source: Aazan Habib, Paradigm Capital
• This chart shows cumulative fund flows by sector.
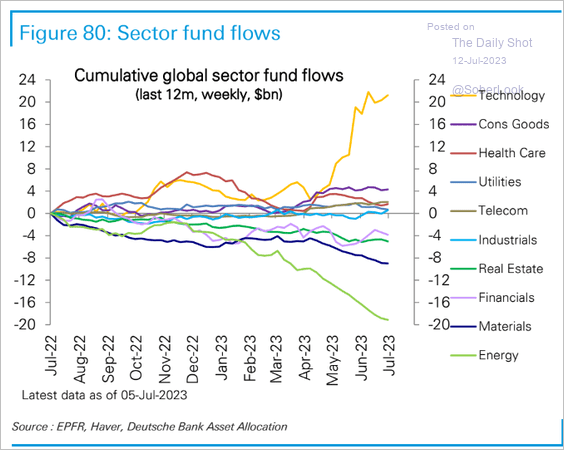 Source: Deutsche Bank Research
• How do global investors see sector performance over the next 30 days?
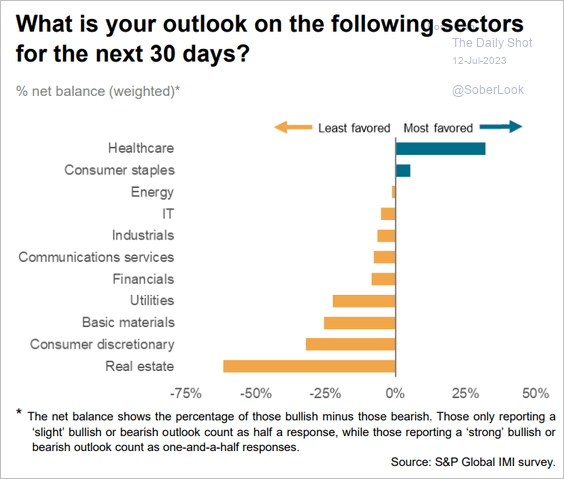 Source: S&P Global
• US REITs and other real estate-related companies typically outperform the broader market coming out of downturns.
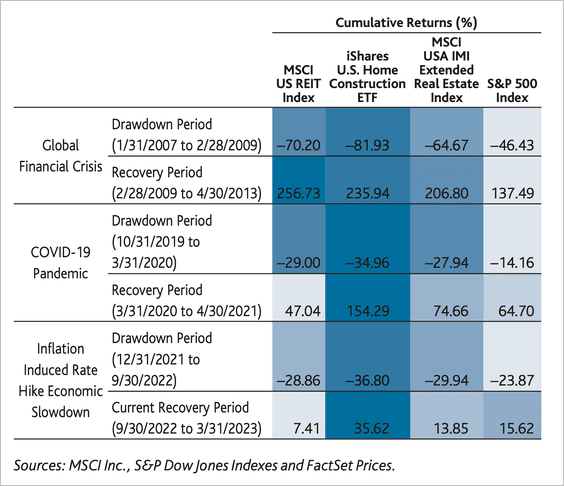 Source: Baron Funds Read full article
• Here is short interest by sector vs. historical averages.
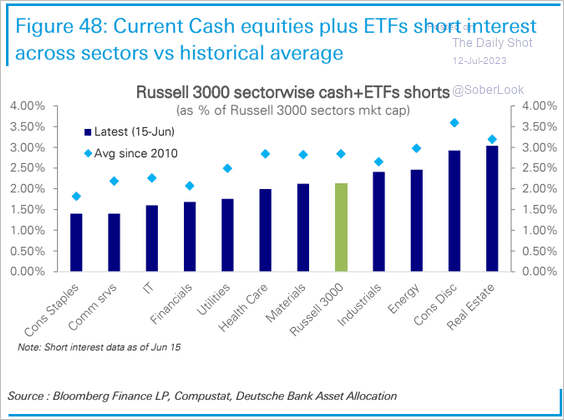 Source: Deutsche Bank Research
• Below is a long-term view of sector contributions to the S&P 500 capitalization and income.
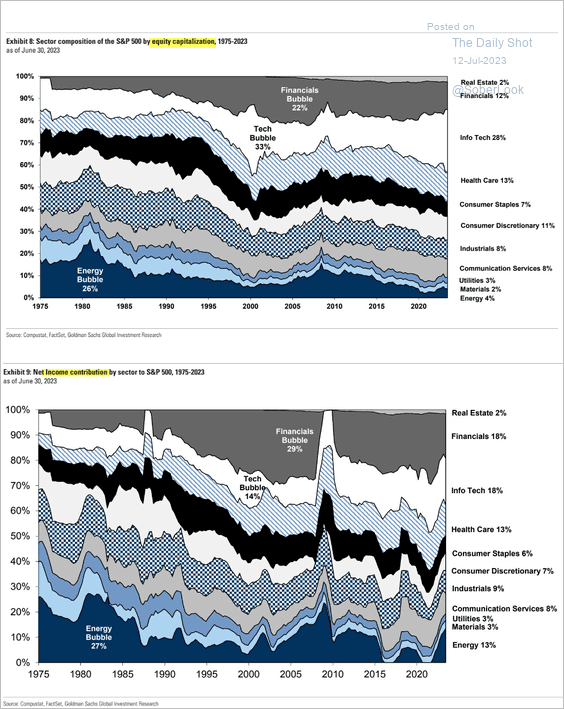 Source: Goldman Sachs; @dailychartbook
——————–
6. US growth stocks appear overbought versus value stocks.
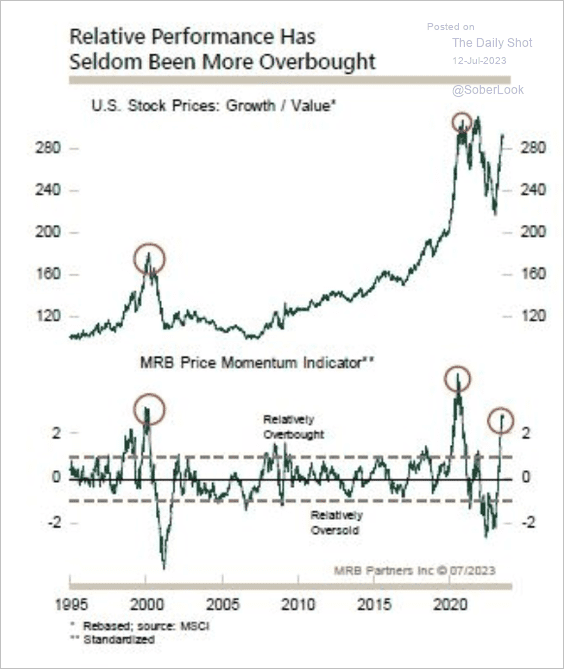 Source: MRB Partners
Back to Index
Credit
1. Bankruptcies have been rising (2 charts).
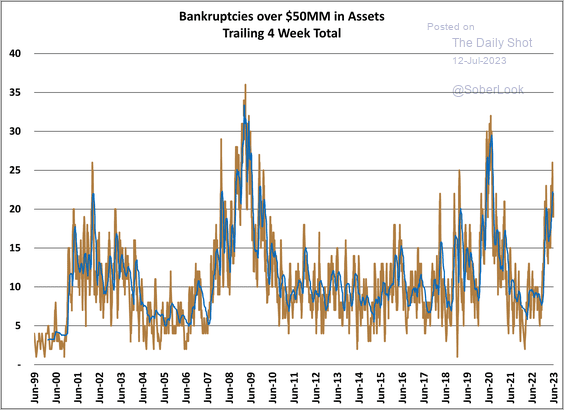 Source: @t1alpha
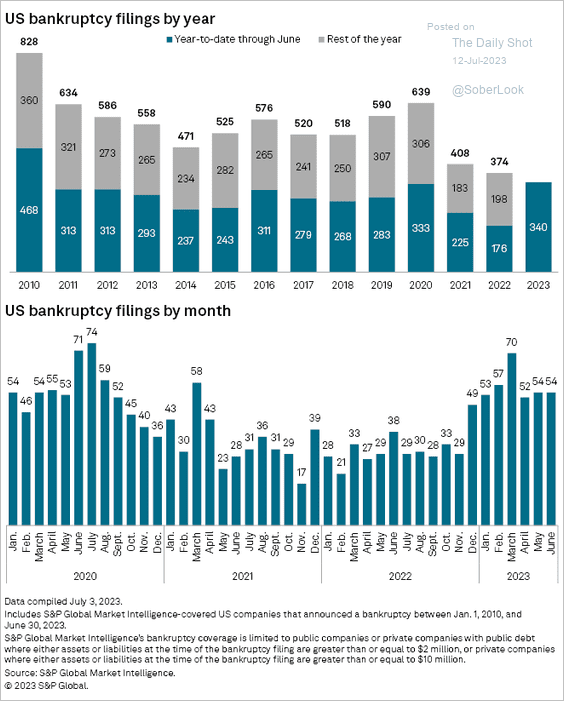 Source: S&P Global Market Intelligence
• Here is the breakdown by sector.
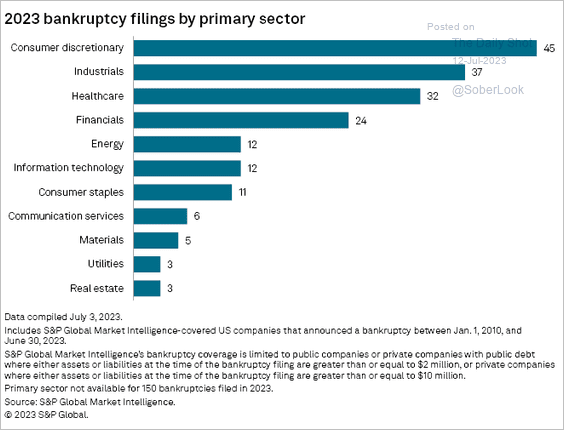 Source: S&P Global Market Intelligence
• This chart shows retail sector defaults over time.
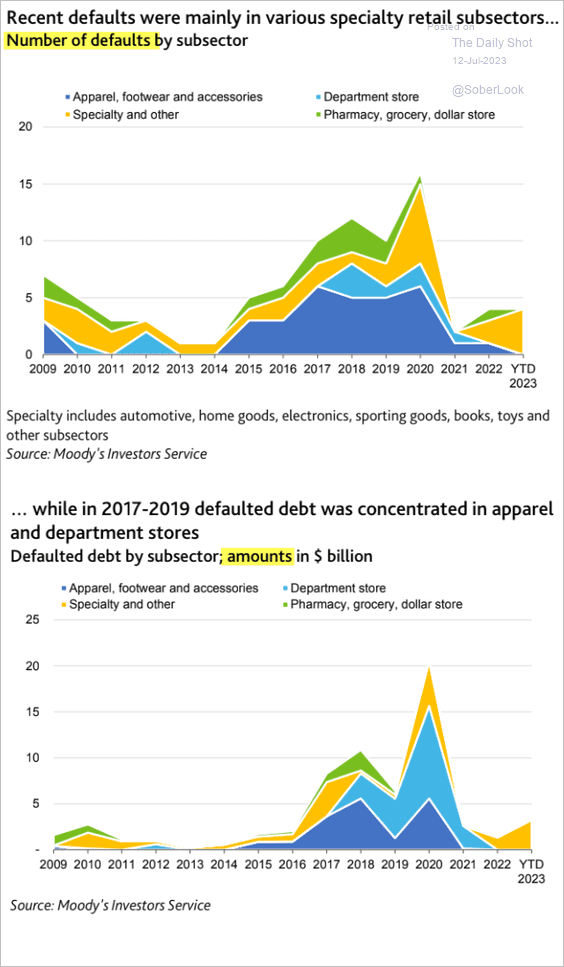 Source: Moody’s Investors Service
——————–
2. Small caps are vulnerable to tighter credit conditions.
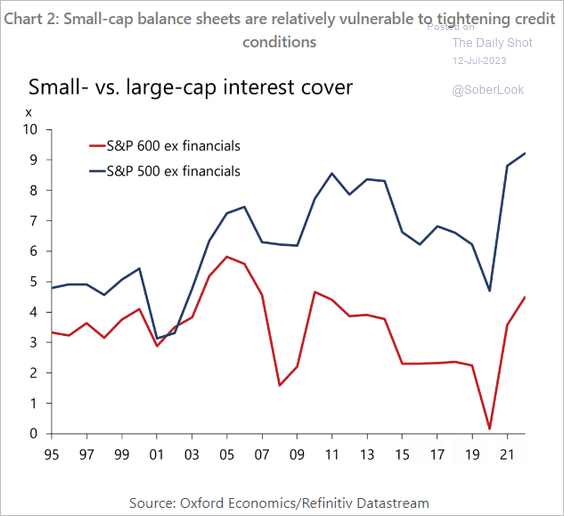 Source: Oxford Economics
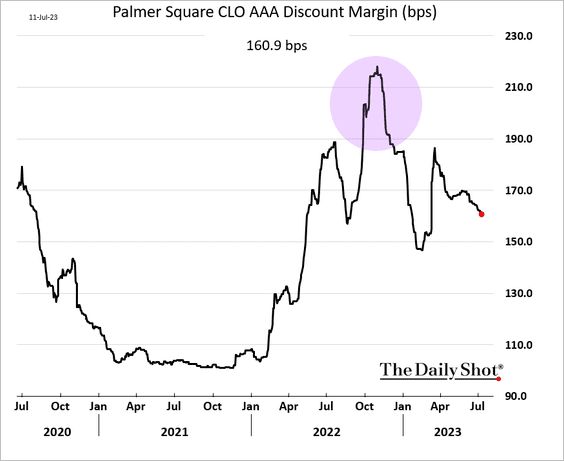
3. CLOs are finally starting to reset their liability spreads.
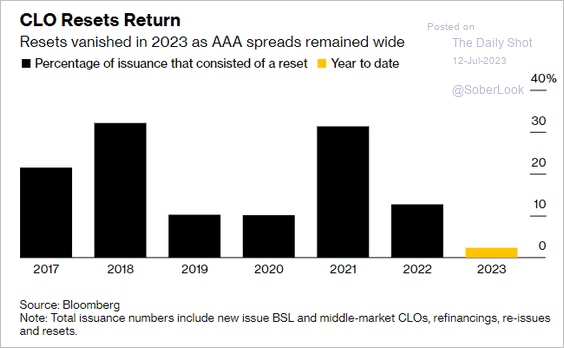 Source: @LisaLeereporter, @ArroyoNieto, @markets Read full article
AAA spreads have been trending lower after peaking last fall.
——————–
4. CMBS issuance remains depressed relative to recent years.
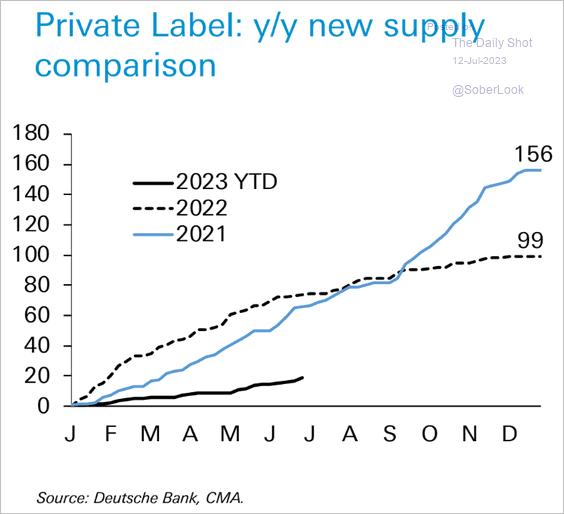 Source: Deutsche Bank Research
• Office property investment is expected to deteriorate further.
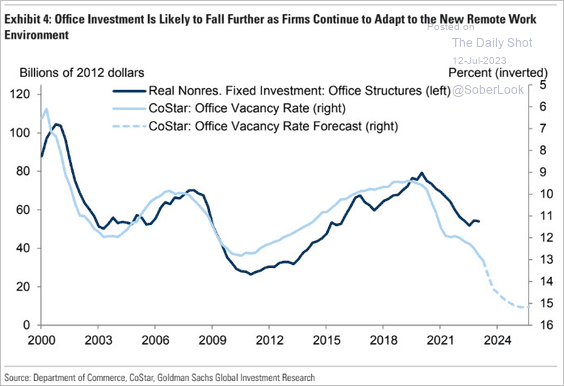 Source: Goldman Sachs; @dailychartbook
Back to Index
Rates
1. TS Lombard’s model suggests that rates implied vol should be lower.
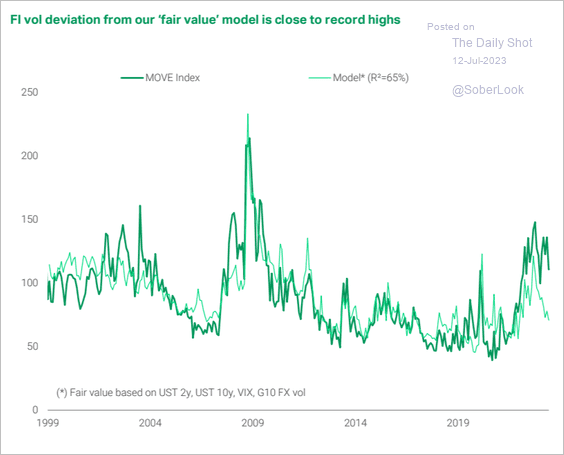 Source: TS Lombard
2. Here is the percentage of JP Morgan’s clients planning to decrease bond portfolio duration.
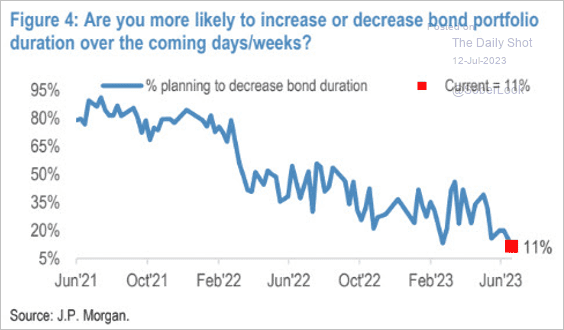 Source: JP Morgan Research; @dailychartbook
Back to Index
Global Developments
1. The US dollar broke below short-term support.
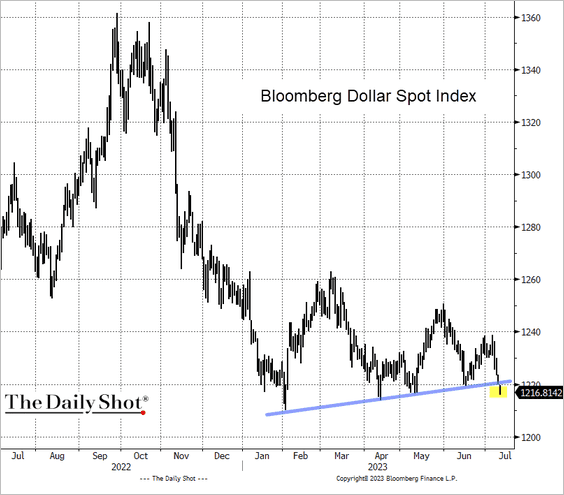 Source: @TheTerminal, Bloomberg Finance L.P.
2. Global labor markets continue to slacken, according to LinkedIn.
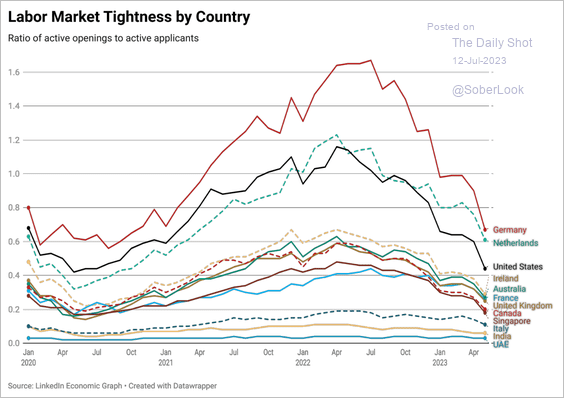 Source: LinkedIn
Hiring is slowing.
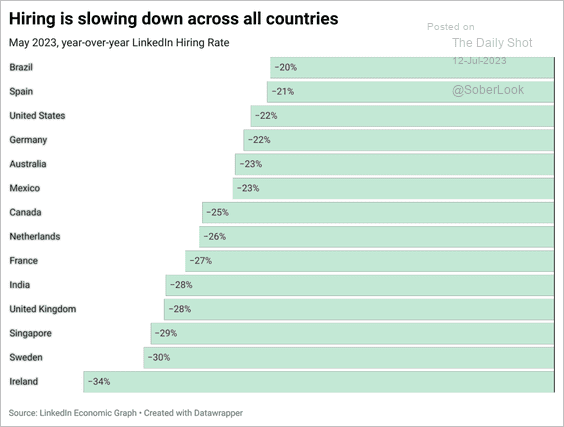 Source: LinkedIn
——————–
3. Is the global economy nearing a recession?
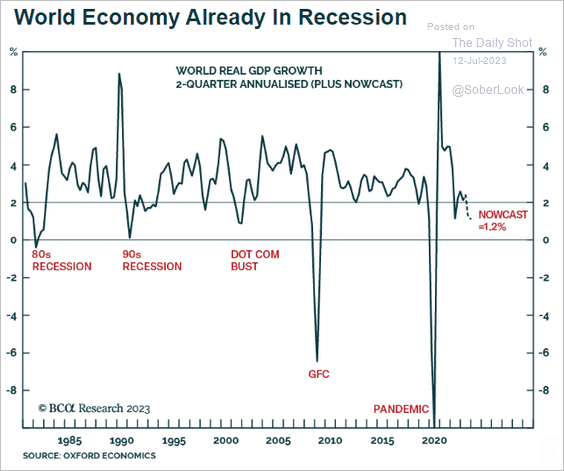 Source: BCA Research
——————–
Food for Thought
1. EVs with the longest range:
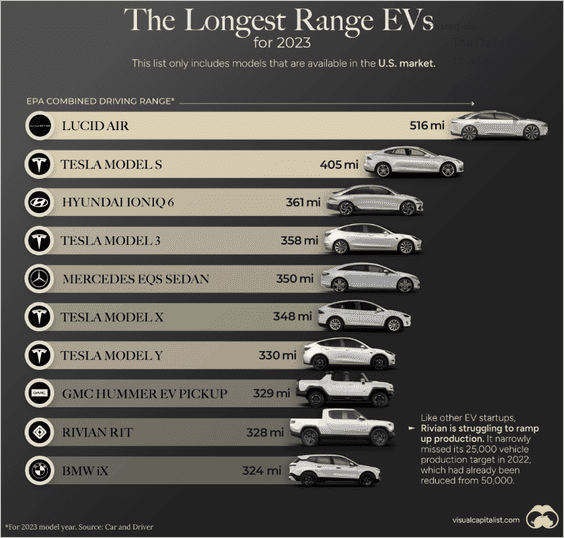 Source: Visual Capitalist Read full article
2. The most innovative companies:
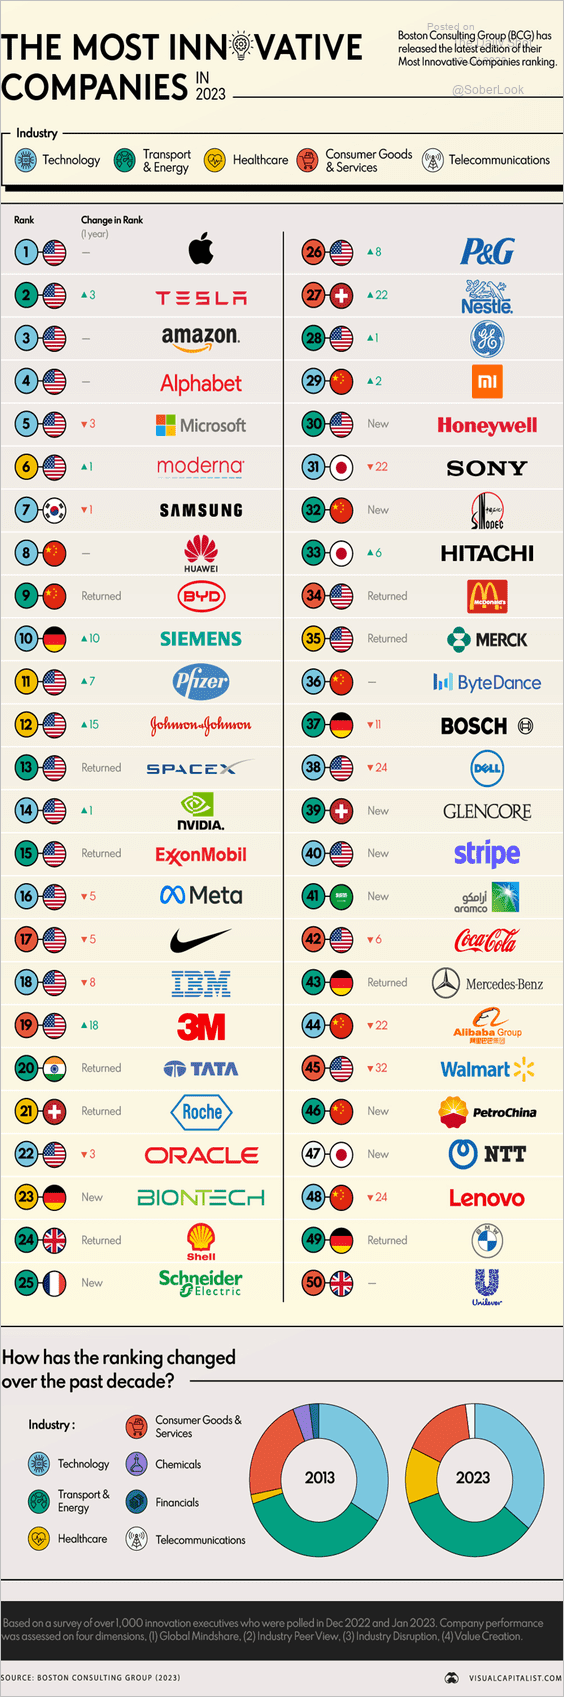 Source: Visual Capitalist Read full article
3. The Index of Economic Freedom:
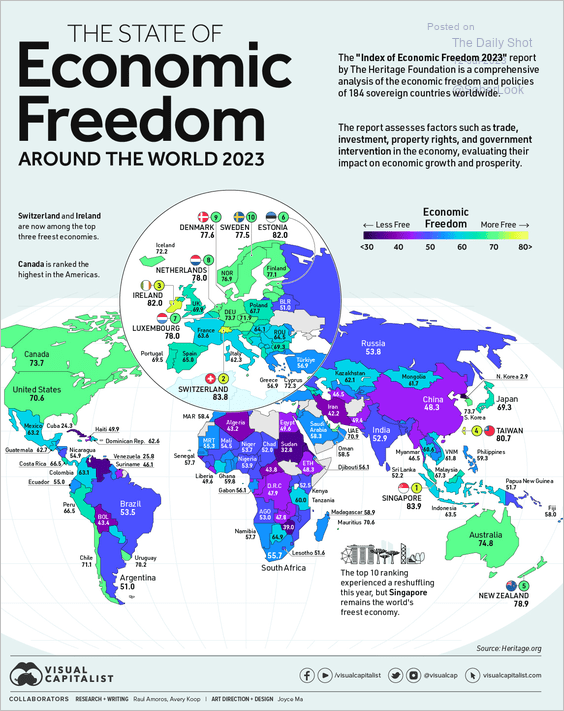 Source: Visual Capitalist Read full article
4. NATO’s expansion:
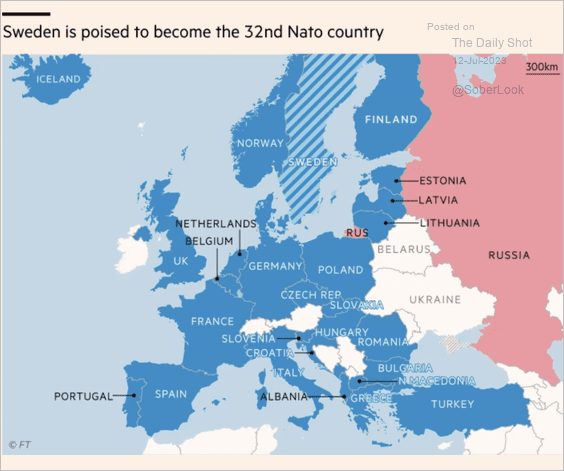 Source: @financialtimes Read full article
5. Remote work policies by company size:
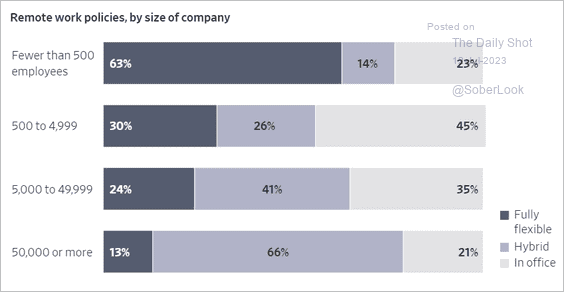 Source: @WSJ Read full article
6. Views on declining union membership:
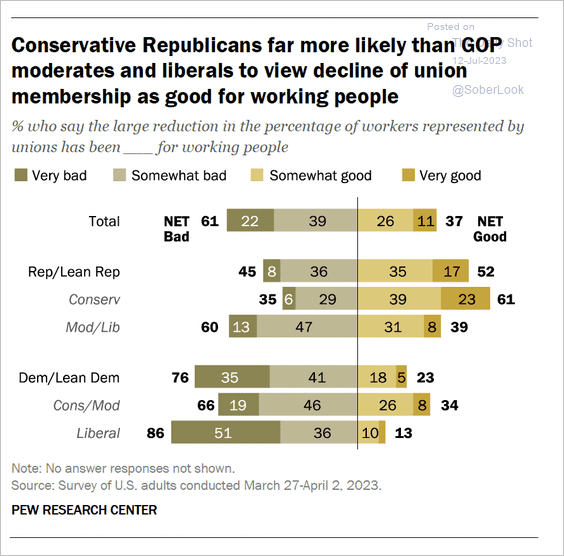 Source: Pew Research Center Read full article
7. Distance to light pollution-free areas in the US:
 Source: @axios Read full article
——————–
Back to Index