
The Daily Shot: 28-Jun-23
• The United States
• Canada
• The United Kingdom
• The Eurozone
• Asia-Pacific
• China
• Emerging Markets
• Cryptocurrency
• Commodities
• Equities
• Food for Thought
The United States
1. The Conference Board’s consumer confidence index climbed in June, topping expectations. The report confirmed the latest gain in the Penta-CivicScience index (see chart from yesterday).
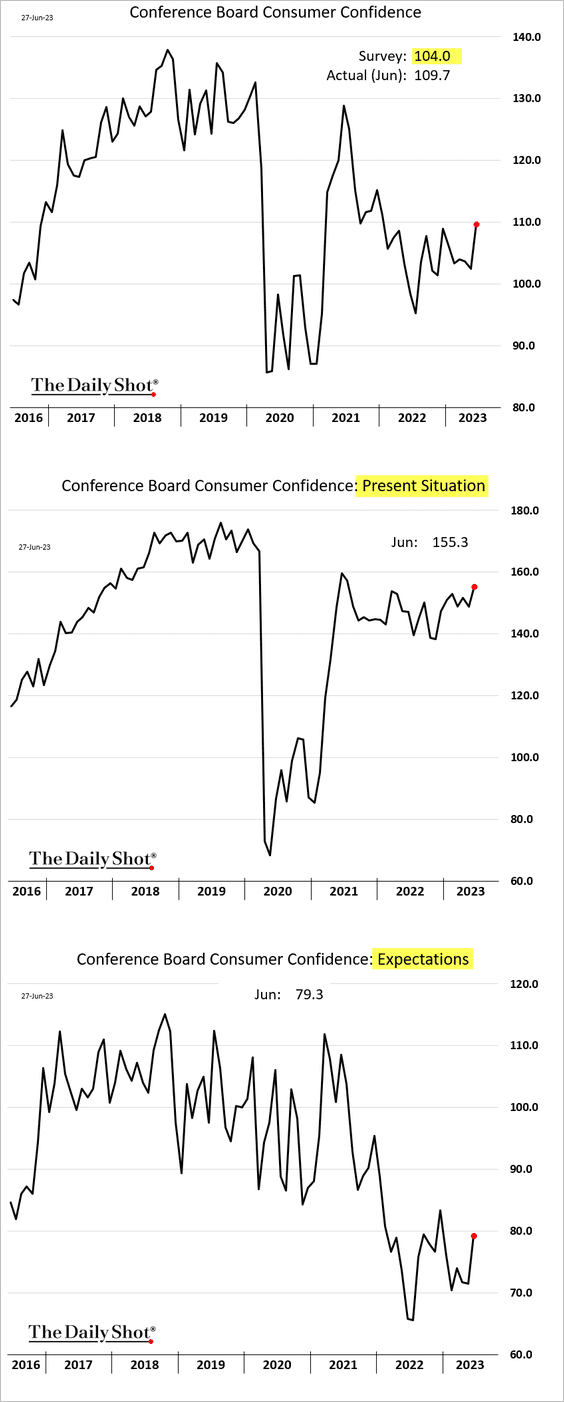
• The labor differential indicator (“jobs plentiful” less “jobs hard to get”) moved higher, suggesting that consumers remain confident about the job market.

• The gap with the U. Michigan’s sentiment index remains extreme.
 Source: @TheTerminal, Bloomberg Finance L.P.
——————–
2. Durable goods orders unexpectedly jumped in May, …

… boosted by transportation.
![]()
Capital goods orders also surprised to the upside (2 charts).


• This chart shows the level of nominal and real capital goods orders.

• Regional Fed manufacturing surveys have been showing deteriorating CapEx plans, which points to downside risks for capital goods orders.
 Source: Pantheon Macroeconomics
——————–
3. The Richmond Fed’s manufacturing index improved in June but remained in contraction territory.

• Fewer firms are increasing workers’ hours.

• However, the region’s manufacturers reported an improving outlook.

• Price pressures are easing.

——————–
4. Next, we have some updates on the housing market, where we continue to see improvements.
• New home sales surged in May (up almost 26% vs. 2022).

 Source: @axios Read full article
– The median sales price stabilized.

Here is the distribution of sales prices over time.
 Source: Calculated Risk
– Inventories tightened sharply (in terms of months of supply).

– This chart shows new home sales by stage of construction.
 Source: Chart and data provided by Macrobond
• Existing home prices were down on a year-over-year basis in April.

But monthly price changes showed another increase (beating forecasts).
– Case-Shiller:

– FHFA:

• The gap between home prices and wages continues to widen.

——————–
5. The market-implied terminal rate (maximum fed funds rate in this cycle) keeps rising as more Fed rate hikes are priced in.

Back to Index
Canada
1. Inflation continues to moderate.
– Headline CPI (2 charts):

 Source: iA Global Asset Management
– Core inflation indicators (3 charts):


• Services CPI remains elevated.

• Here are some additional trends.
– Inflation breadth (still very high):
 Source: Scotiabank Economics
– The 2023 CPI forecasts over time compared to the US and the Eurozone:
 Source: iA Global Asset Management
– The CPI price level vs. the 2% BoC target:
 Source: iA Global Asset Management
——————–
2. Rate hike expectations eased.

Back to Index
The United Kingdom
1. Short-term gilt yields keep climbing.

2. The UK wage growth has been outpacing inflation (unlike in the US).
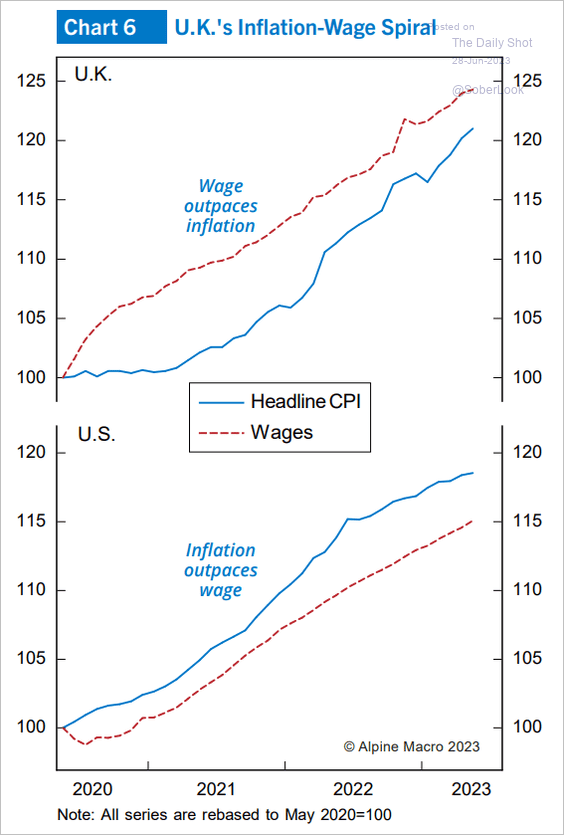 Source: Alpine Macro
Back to Index
The Eurozone
1. The economic surprise gap with the US has blown out.
 Source: @TheTerminal, Bloomberg Finance L.P.
2. Italian sentiment indicators were mixed this month.
• Consumer confidence:

• Manufacturing confidence:

——————–
3. EUR/USD’s trading range this year is near the lowest in history.
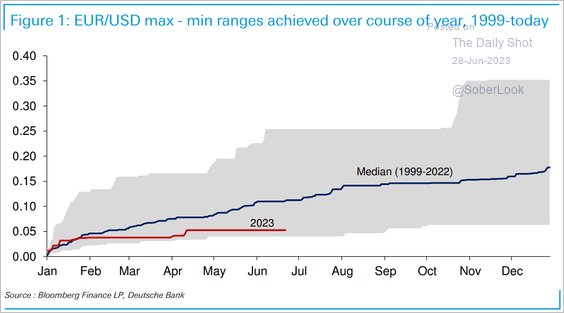 Source: Deutsche Bank Research
4. Market-implied longer-dated real rates have been declining.
 Source: ING
5. Here is the decomposition of euro-area stock returns through May (from Numera Analytics).
 Source: Numera Analytics (@NumeraAnalytics)
Back to Index
Asia-Pacific
1. Taiwan’s unemployment rate keeps falling.

• It’s been a tough month for the Taiwan dollar.

——————–
2. South Korea’s consumer sentiment continues to improve.

3. Australia’s monthly inflation index surprised to the downside.
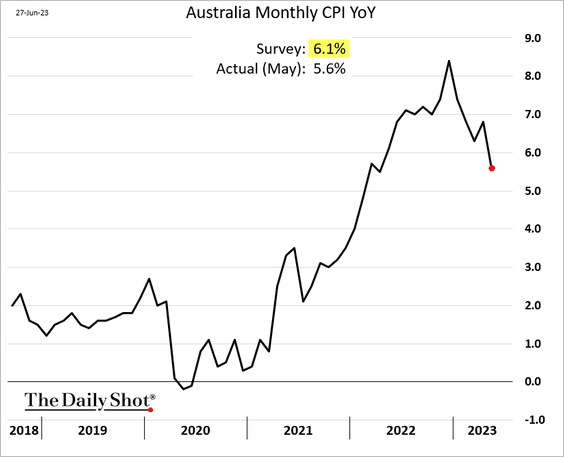
Rate hike expectations eased, with a July increase looking increasingly unlikely.

Back to Index
China
1. Beijing has had enough of RMB weakness (the chart shows CNY vs. a basket of currencies).

The PBoC is now steering the renminbi higher.

——————–
2. Consumer spending intentions remain weak.
 Source: Pantheon Macroeconomics
3. The credit impulse rolled over in May, driven by soft private-sector confidence and lower bank loan growth. (2 charts)
 Source: BCA Research
 Source: BCA Research
——————–
4. The fertility rate is declining faster than the rest of the world.
 Source: Alpine Macro
5. Hong Kong’s exports softened in May,

Back to Index
Emerging Markets
1. Brazil’s inflation continues to ease.

Pressure is building on the central bank to begin cutting rates.
 Source: @beckmartha, @simoneiglesias, @economics Read full article
——————–
2. Mexico’s exports hit a record high for this time of the year.

3. Foreign holdings of South African government bonds continue to decline.
 Source: Codera Analytics Read full article
4. Foreign investors have largely shunned EM assets.
 Source: MRB Partners
Back to Index
Cryptocurrency
1. Crypto funds saw the largest single weekly inflows since July 2022, recouping almost half of the prior nine consecutive weeks of outflows.
 Source: CoinShares Read full article
Long-bitcoin products accounted for most inflows last week while investors exited short-bitcoin funds.
 Source: CoinShares Read full article
——————–
2. There has been an uptick in token delisting on crypto exchanges this month.
 Source: @KaikoData
3. Daily crypto trading volume barely spiked during recent SEC crypto lawsuits.
 Source: @KaikoData
4. Bitcoin’s correlation with gold and silver flipped negative, residing near cycle lows.
 Source: @glassnode
Back to Index
Commodities
1. US corn futures are reversing the recent rally.

As a result, cattle futures are rebounding.

——————–
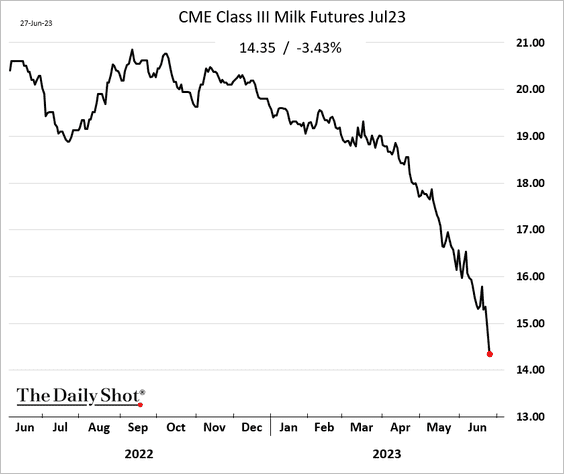
2. Milk futures continue to crash.
3. Here is a look at the largest commodity M&A deal announcements this year.
 Source: PGM Global
• Materials and energy M&A deal flow is at its lowest in decades, partly because of monetary policy tightening and China weakness.
 Source: PGM Global
Back to Index
Equities
1. The rally in semiconductor stocks is facing a setback.
 Source: @WSJ Read full article
• The iShares Semiconductor ETF (after close)
 Source: barchart.com
• Nvidia:.
 Source: barchart.com
Will we see a reversal in chip stocks’ bullish sentiment?
 Source: @WSJ Read full article
——————–
2. US equity bubbles can inflate for many years in the absence of a recession, similar to the late-90s before a mild contraction in 2001.
 Source: Capital Economics
3. Profit margins continue to face persistent downside risks.
 Source: SG Markets Cross Asset Research; @dailychartbook
4. Here is the investor sentiment indicator from Oxford Economics. The second panel shows the percent ranks of the various sentiment signals.
 Source: Oxford Economics
5. Options positioning has been increasingly bullish (2 charts).
 Source: Deutsche Bank Research
 Source: @WSJ Read full article
——————–
6. VIX remains low compared to the Treasury market implied vol (MOVE).
 Source: Gavekal Research
7. S&P 500 volatility tends to trough in July.
 Source: @WSJ Read full article
8. Hedge funds remain cautious on cyclical sectors.
 Source: Goldman Sachs; @dailychartbook
——————–
Food for Thought
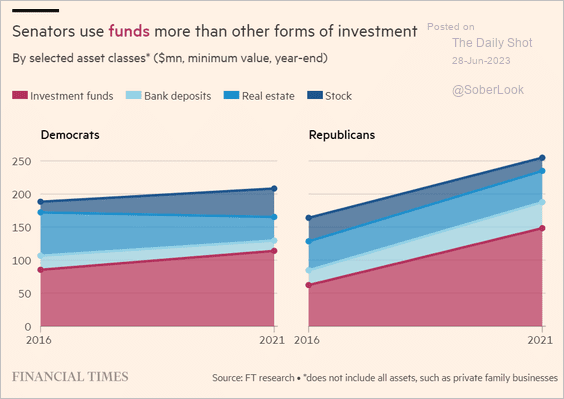
1. US senators’ assets over time:
 Source: @financialtimes Read full article
2. Widening salary ranges in job postings:
 Source: Indeed Read full article
3. Heat pump vs. gas furnace sales:
 Source: Canary Media Read full article
4. The US population pyramid in 2000, 2010, and 2020:
 Source: Census Bureau Read full article
5. Concerns about being able to pay back student debt:
 Source: @CivicScience Read full article
6. Views on US industries:
 Source: @axios Read full article
7. Bicycle-friendly cities:
 Source: Statista
——————–
Back to Index