
The Daily Shot: 30-Mar-21
• The United States
• The United Kingdom
• Europe
• Japan
• China
• Emerging Markets
• Commodities
• Energy
• Equities
• Credit
• Rates
• Food for Thought
The United States
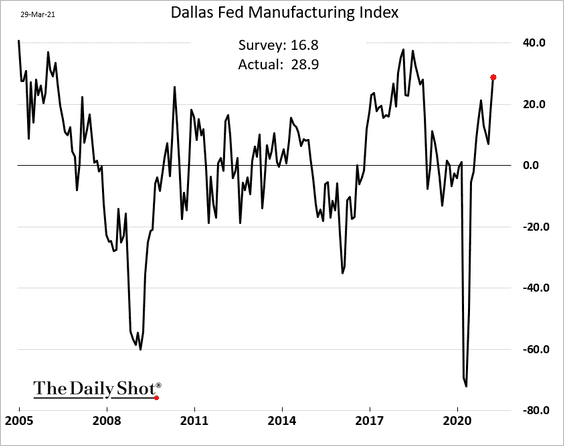
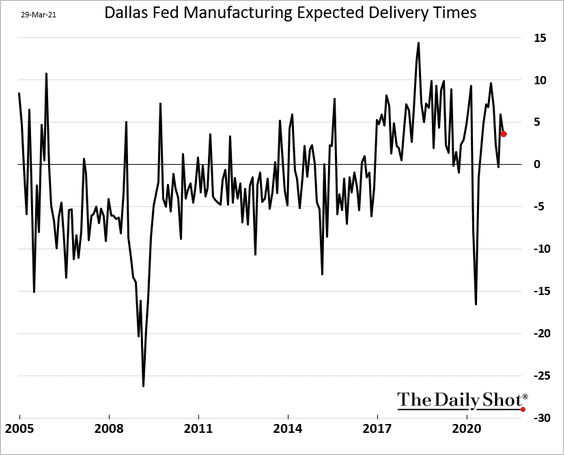
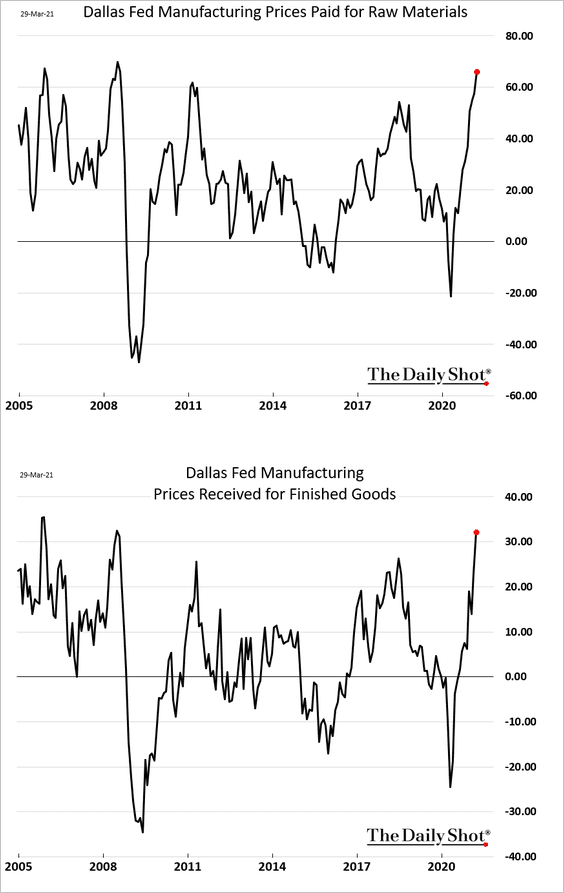
1. The Dallas Fed manufacturing report (the last of the regional surveys for the month) further validated continued strength in the nation’s factory activity.
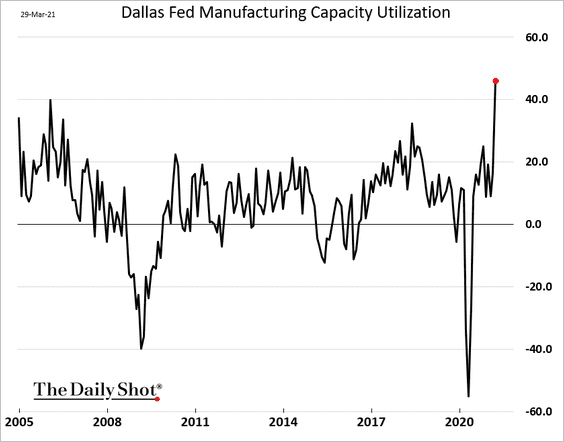
• The index of capacity utilization hit a record high.
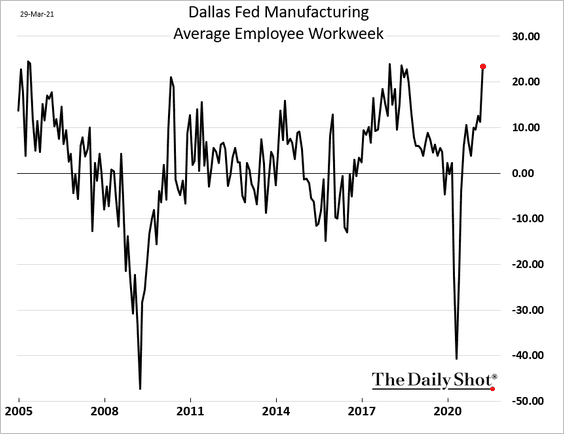
• And workers’ weekly hours climbed sharply.
• Supplier delivery times spiked (a global trend).
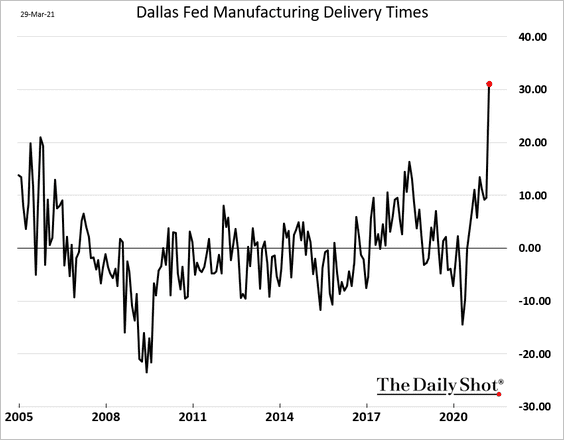
But manufacturers expect these supply-chain bottlenecks to ease over the next few months.
• Prices increases are accelerating.
——————–
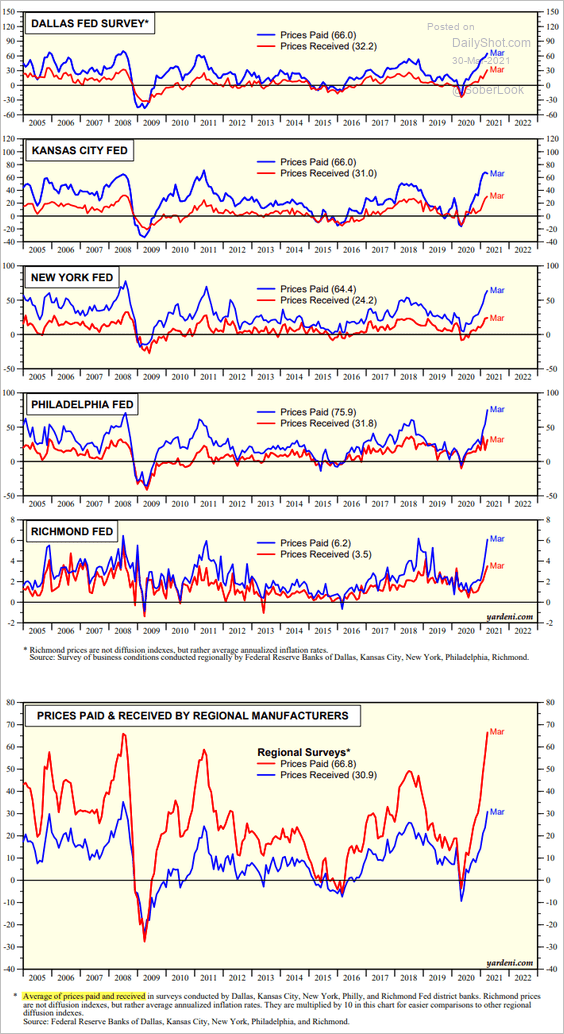
2. Here is a summary of price indices for all the regional manufacturing reports.
 Source: Yardeni Research
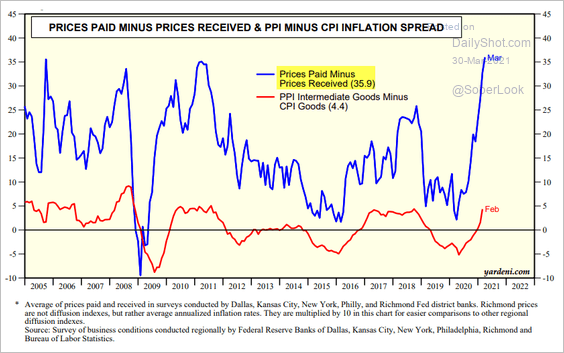
The spread between indices of prices paid and prices charged keeps widening. Without further boosting output prices, some manufacturers could face margin pressures.
 Source: Yardeni Research
——————–
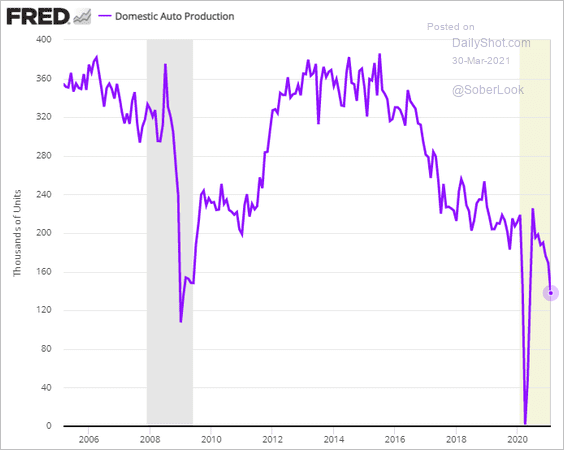
3. One of the primary supply-chain issues has been semiconductors (a global disruption).
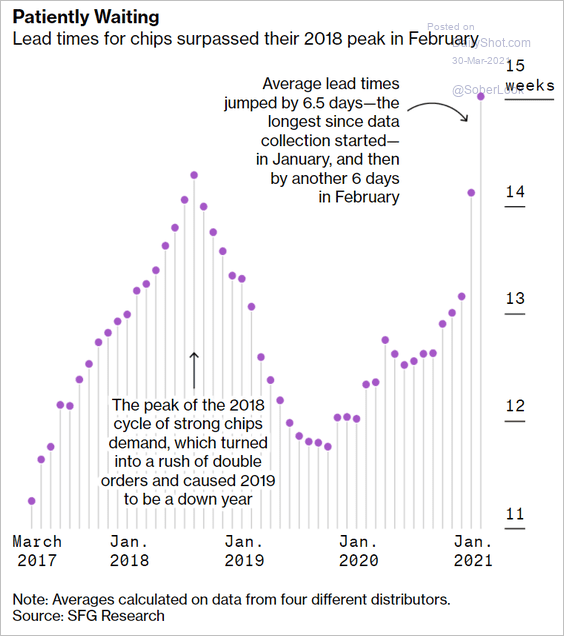 Source: Bloomberg Read full article
That’s part of the reason US auto production has slowed this year.
——————–
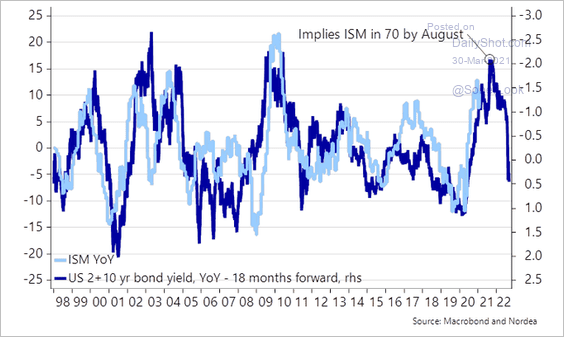
4. The Treasury curve continues to steepen.
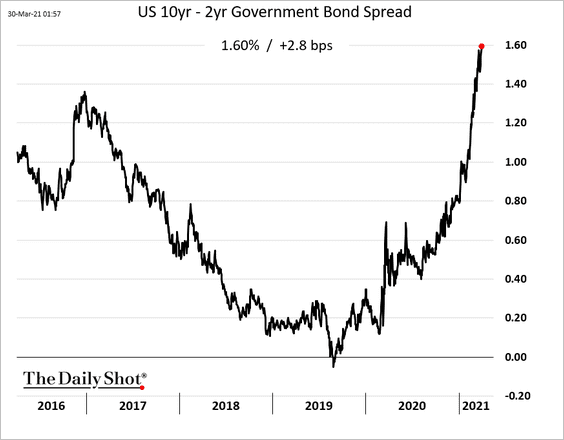
Based on historical data, the yield curve slope suggests that US manufacturing activity will peak this summer.
 Source: @AndreasSteno
——————–
5. Moody’s Analytics expects a rebound in productivity during this decade.
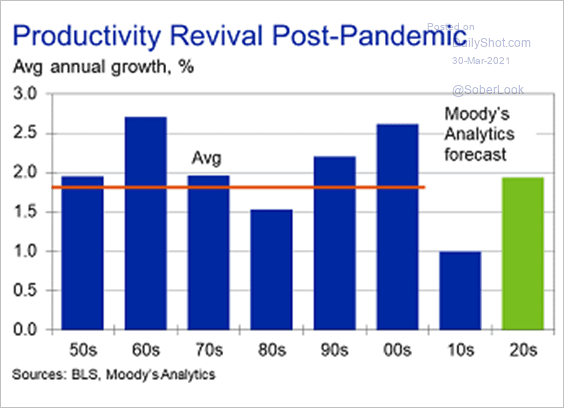 Source: Moody’s Analytics
6. Next, we have some updates on the labor market.
• The “effective” unemployment rate is substantially higher than the headline figures.
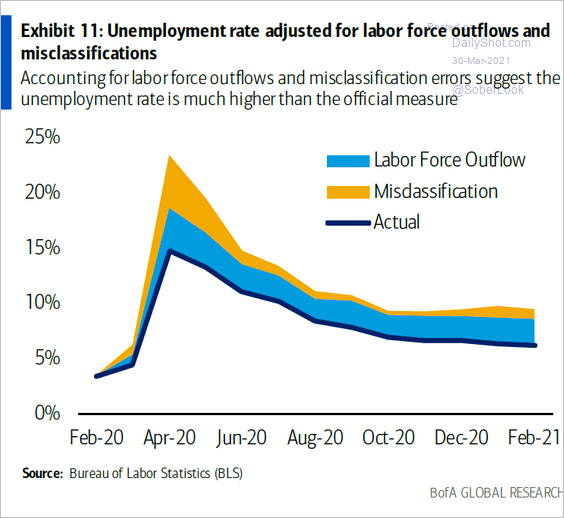 Source: BofA Global Research
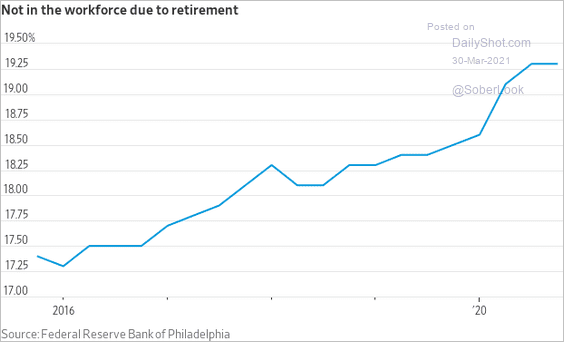
• COVID forced many older workers into retirement. How many will return after the pandemic ends?
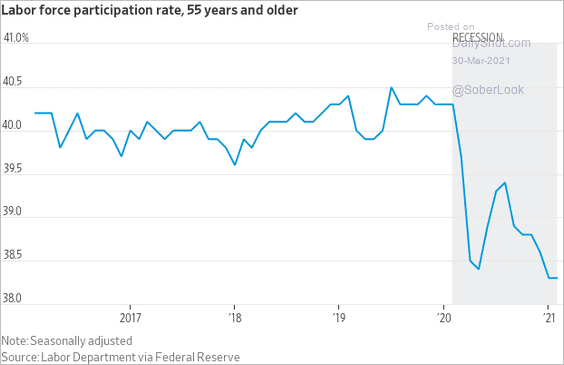 Source: @WSJ Read full article
 Source: @WSJ Read full article
• BofA expects US labor force participation to return to pre-COVID levels by the end of next year.
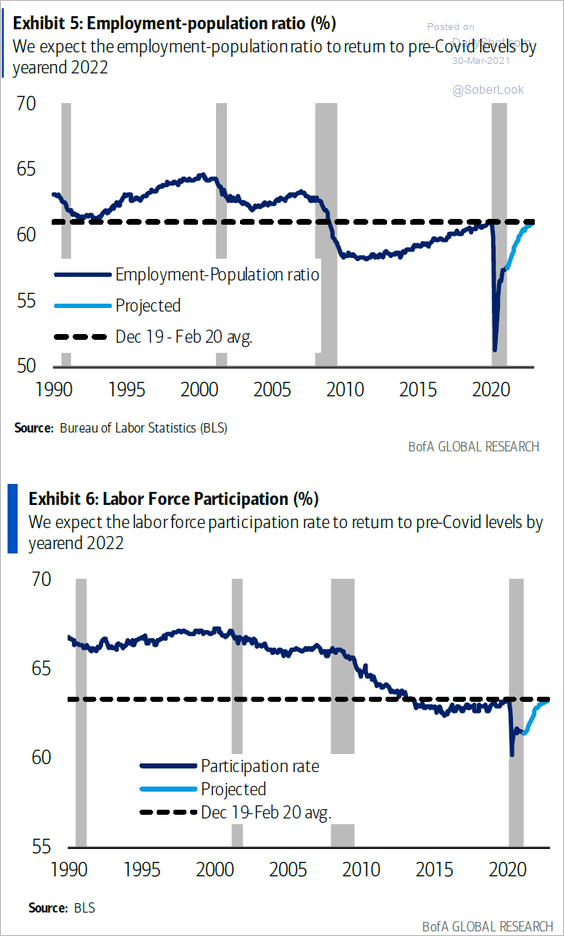 Source: BofA Global Research
• Improving mobility trends suggest that hiring has picked up this month.
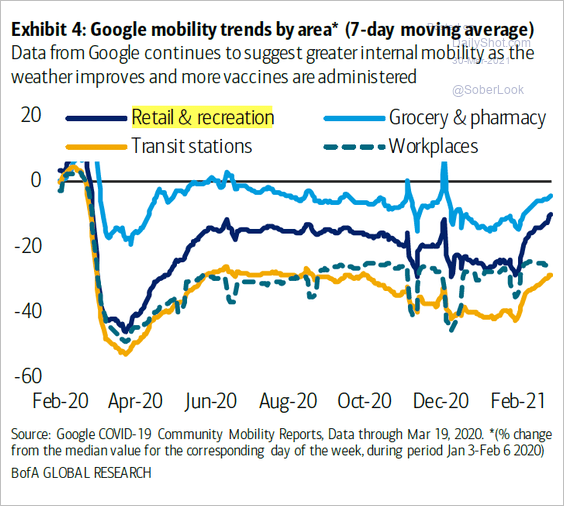 Source: BofA Global Research
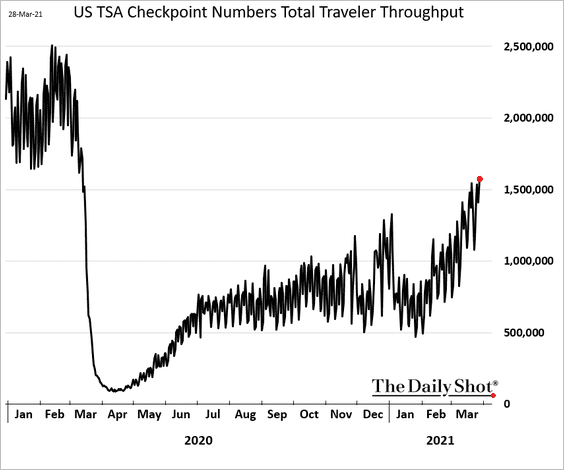
Airport travel hit the highest level in a year.
• Hotel occupancy is returning to normalcy.
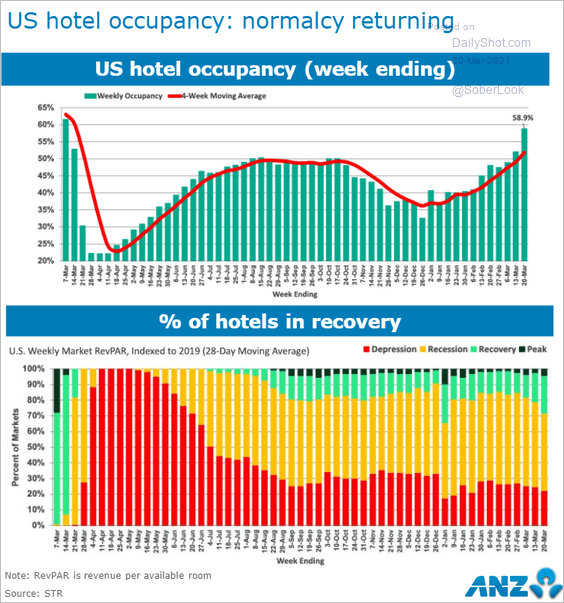 Source: ANZ Research
And high-frequency data show rapid increases in hospitality-sector hiring.
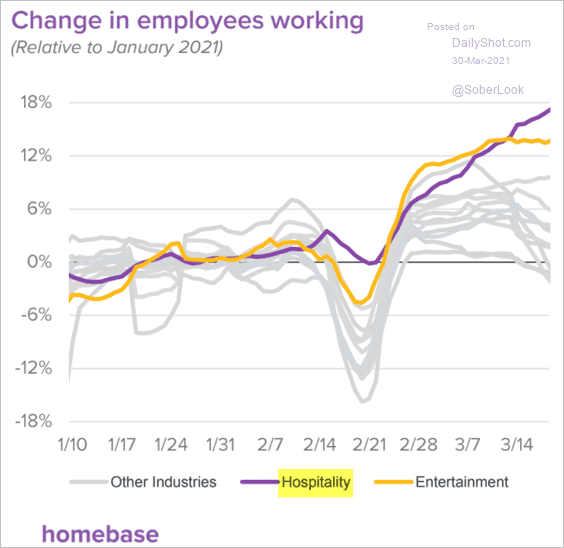 Source: homebase
• There should be a similar rebound in restaurant hiring.
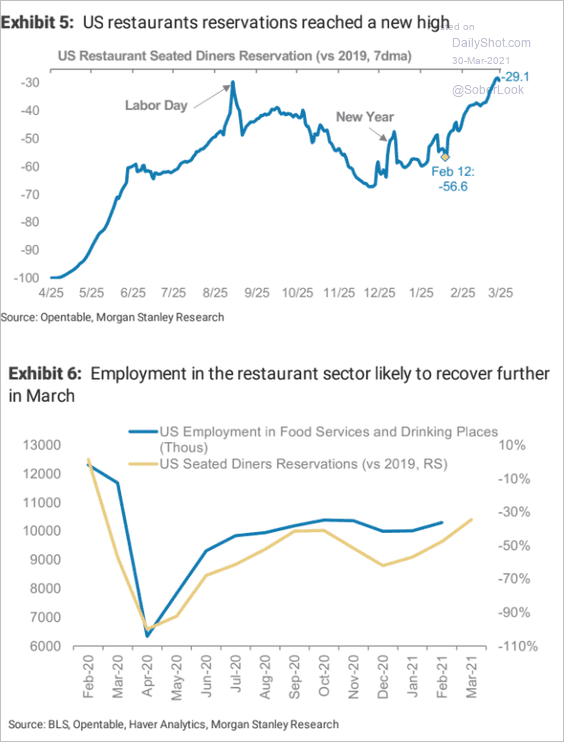 Source: Morgan Stanley Research
• Some of these lost jobs are coming back quickly.
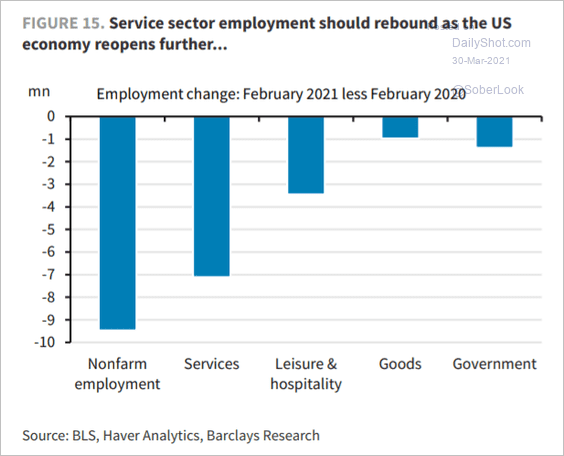 Source: Barclays Research
• Job postings on Indeed point to rising demand for workers.
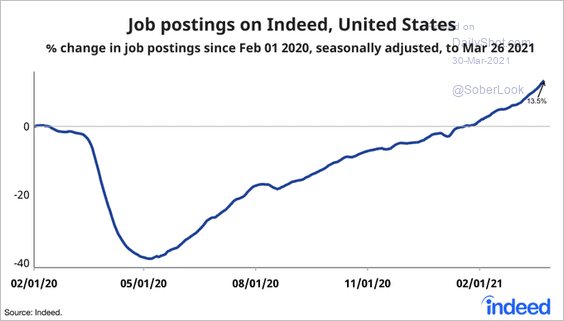 Source: @JedKolko, @indeed Read full article
——————–
7. How do you plan to spend the $1,400 government check?
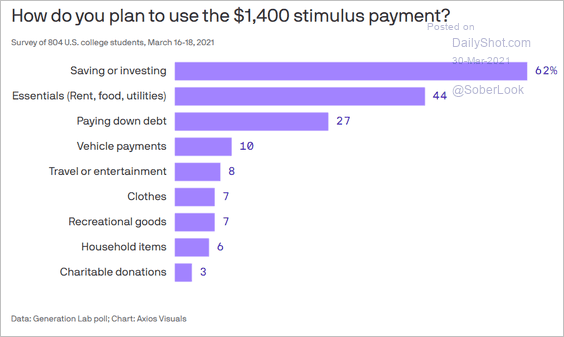 Source: @axios Read full article
8. With all the help from Uncle Sam, personal bankruptcy filings have been declining.
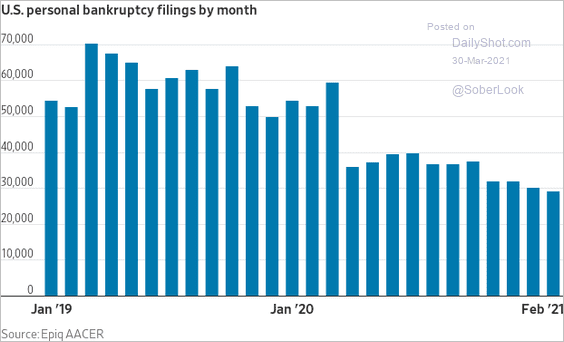 Source: @WSJ Read full article
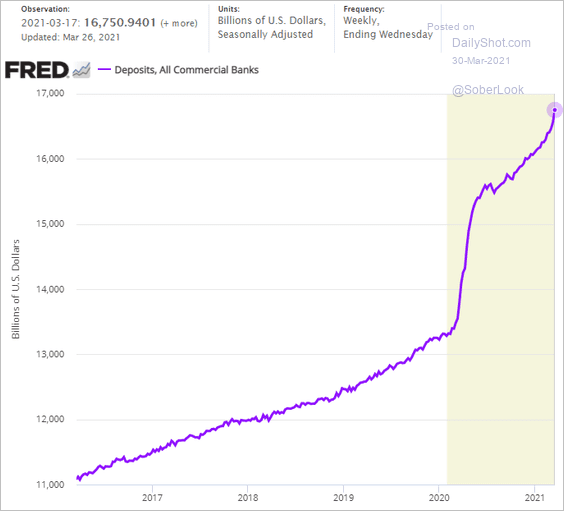
9. US bank deposits hit another record high.
10. Finally, we have some data on vaccination progress.
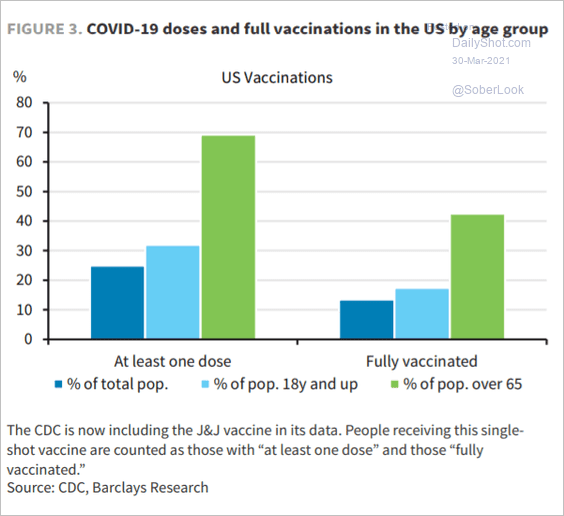 Source: Barclays Research
Back to Index
The United Kingdom
1. Mortgage approvals slowed last month, but economists expect a rebound going forward.
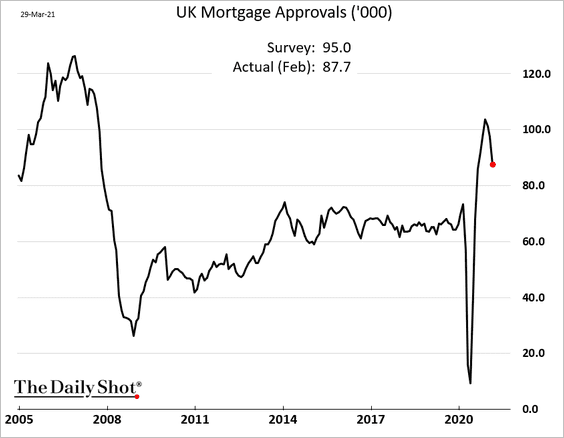
Online search activity points to rising demand for housing.
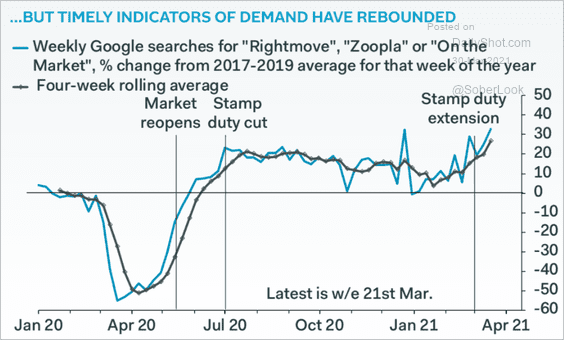 Source: Pantheon Macroeconomics
——————–
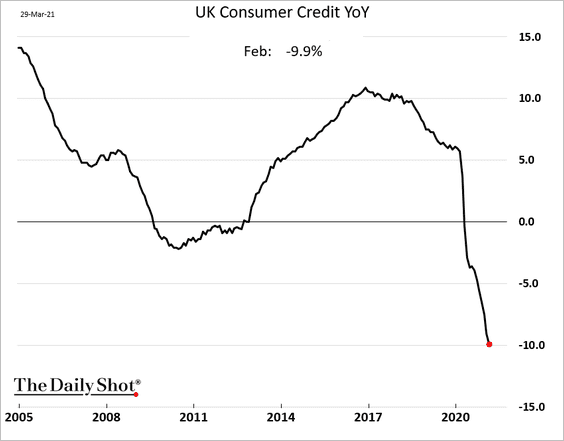
2. Consumer credit is down 10% from a year ago as households cut back on credit card debt (similar to the US).
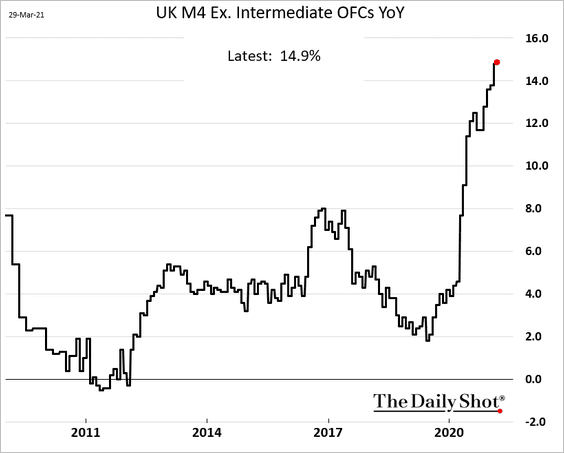
3. The broad money supply expansion is at multi-year highs.
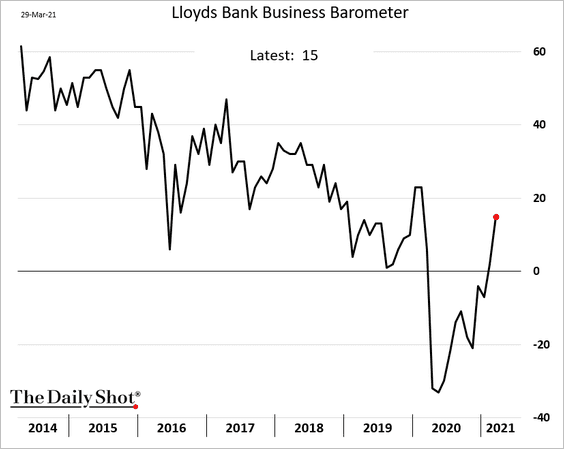
4. Business sentiment is rebounding.
5. The pace of vaccinations remains robust.
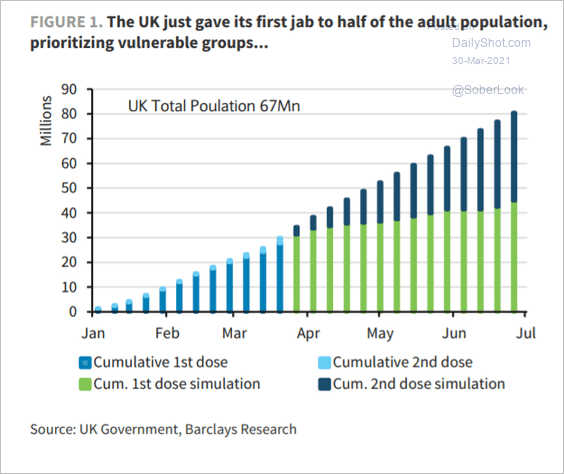 Source: Barclays Research
Hospitalizations are down sharply.
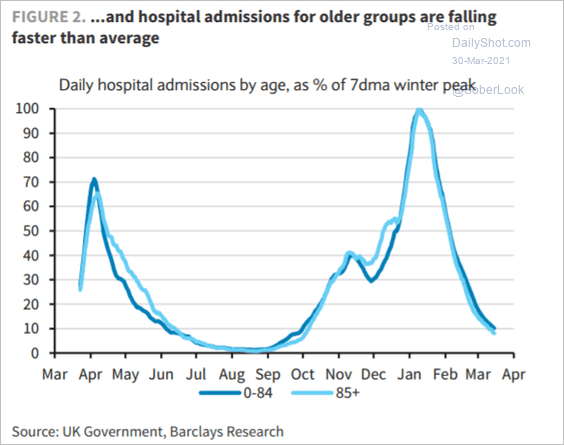 Source: Barclays Research
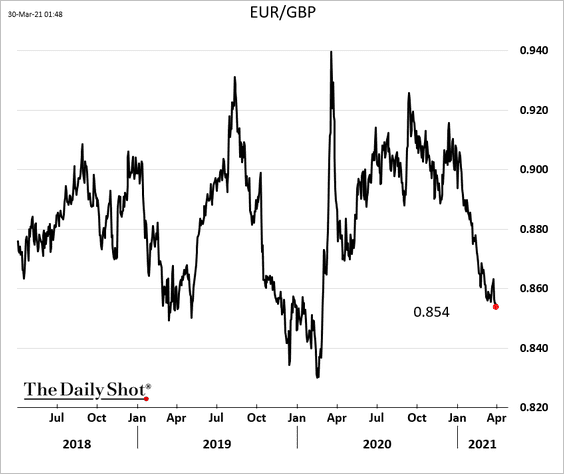
The UK’s vaccine progress is part of the reason the pound keeps strengthening vs. the euro.
Back to Index
Europe
1. Italy’s debt-to-GDP ratio rose sharply over the past year.
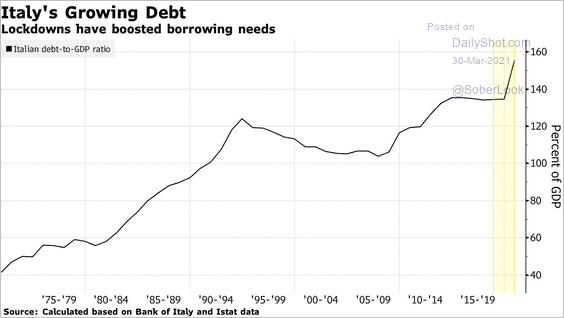 Source: @bpolitics Read full article
And more increases are on the way.
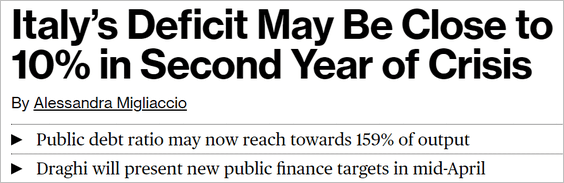 Source: @markets Read full article
——————–
2. The ECB announced that the 33% issuer limit would not apply to emergency asset purchases (PEPP), giving the central bank more flexibility to buy debt.
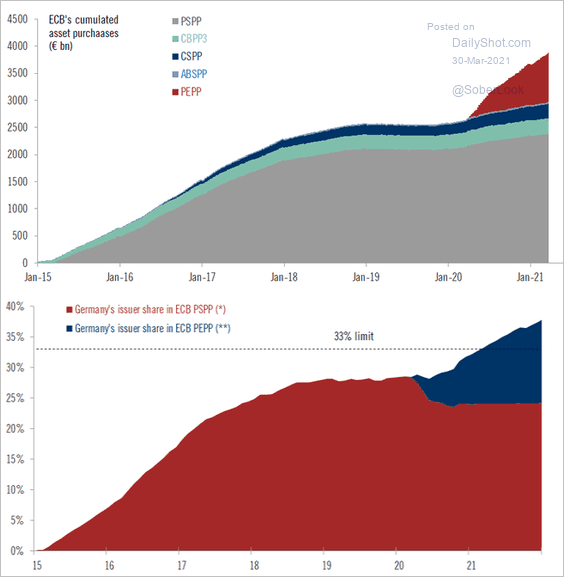 Source: @fwred
3. Here are some economic forecasts for Germany.
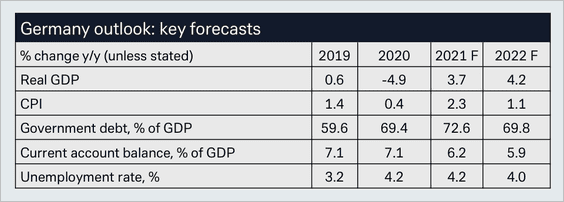 Source: Deutsche Bank Research
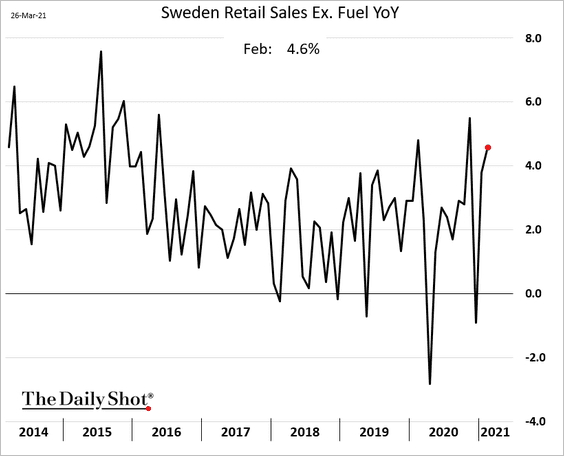
4. Sweden’s retail sales rebounded last month.
5. The third COVID wave will be a drag on growth.
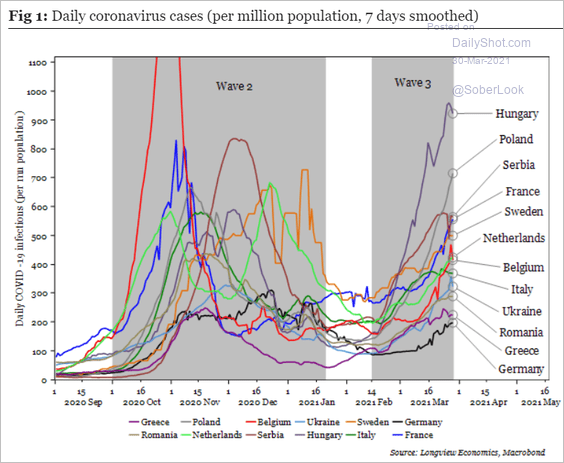 Source: Longview Economics
Back to Index
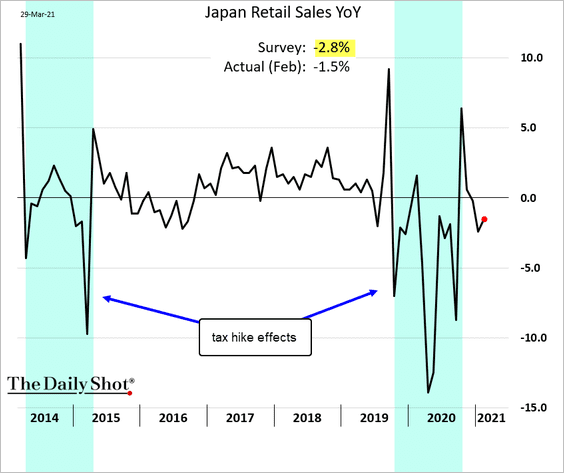
Japan
1. February’s retail sales surprised to the upside.
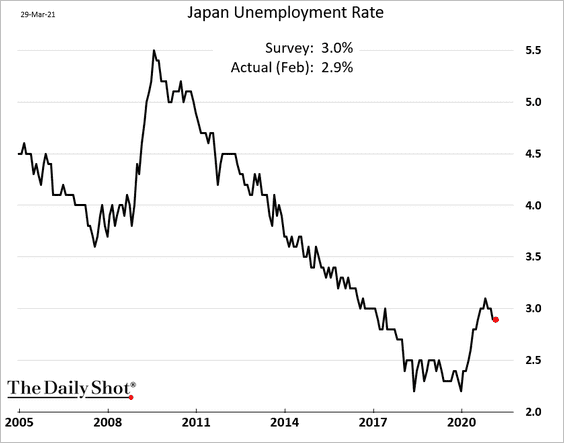
2. The jobs-to-applicants ratio ticked lower last month.
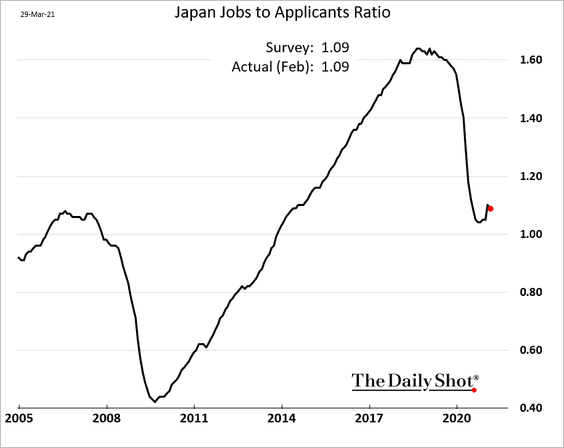
But the unemployment rate is also drifting lower.
——————–
3. USD/JPY is testing resistance.
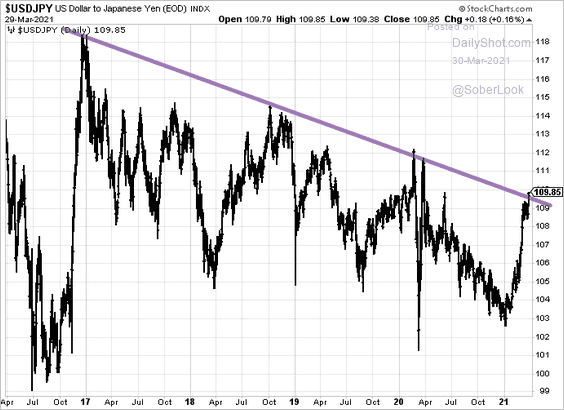 h/t Michael G Wilson
4. Here is Japan’s energy mix over time (2 charts).
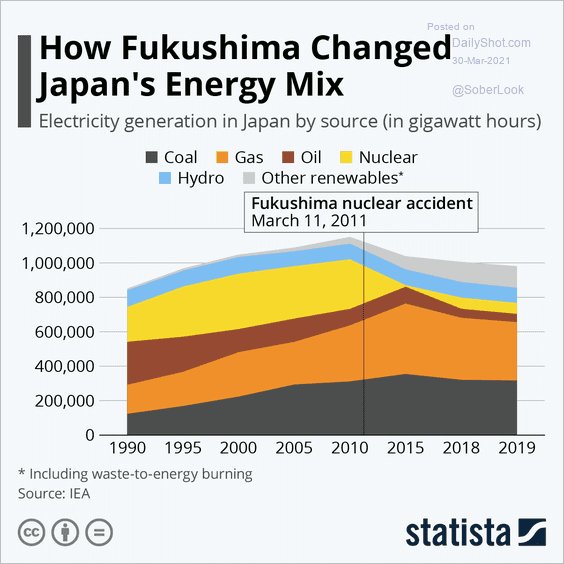 Source: Statista
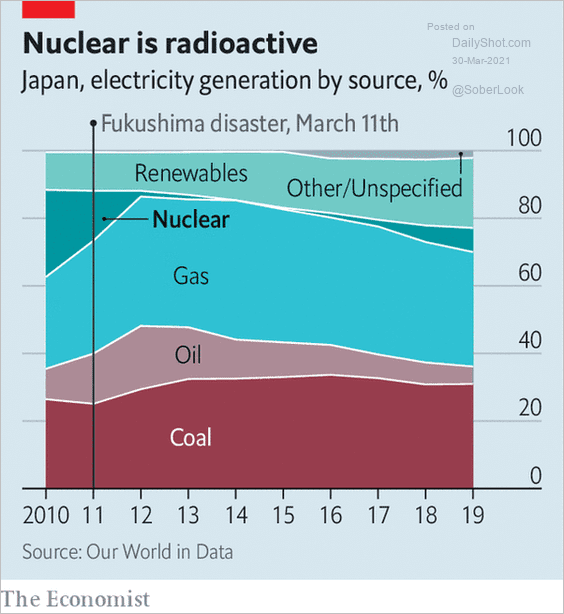 Source: The Economist Read full article
Back to Index
China
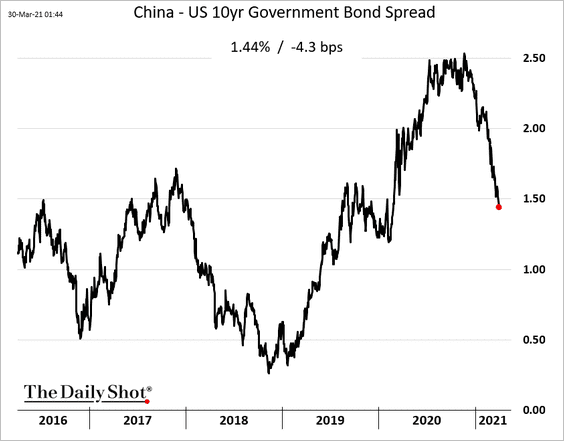
1. The China-US bond spread continues to tighten, which could put downward pressure on the renminbi.
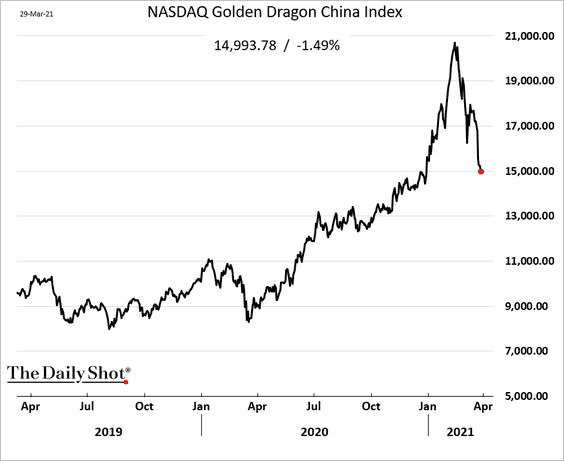
2. US ADRs of Chinese companies have declined in recent weeks.
 h/t @KritiGuptaNews
3. Semiconductor private equity deals hit a record high last year.
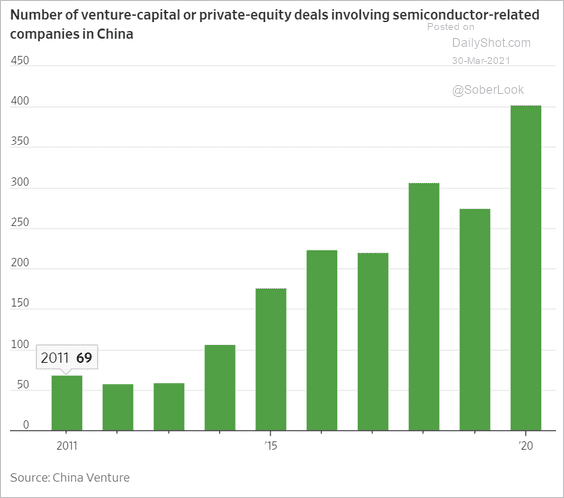 Source: @WSJ Read full article
Back to Index
Emerging Markets
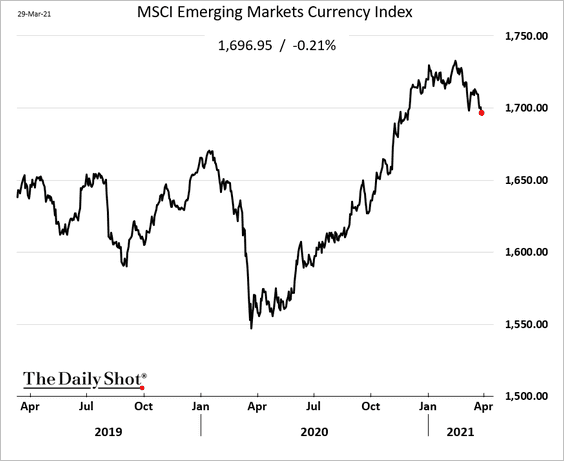
1. EM currencies have been rolling over.
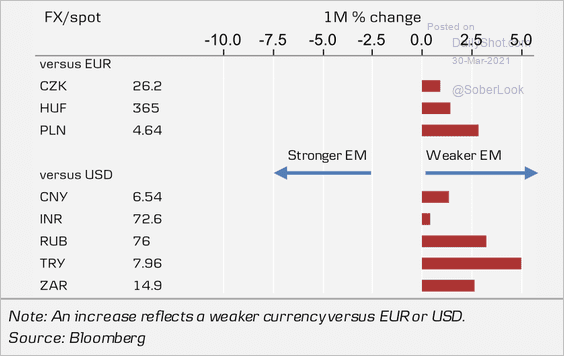 Source: Danske Bank
——————–
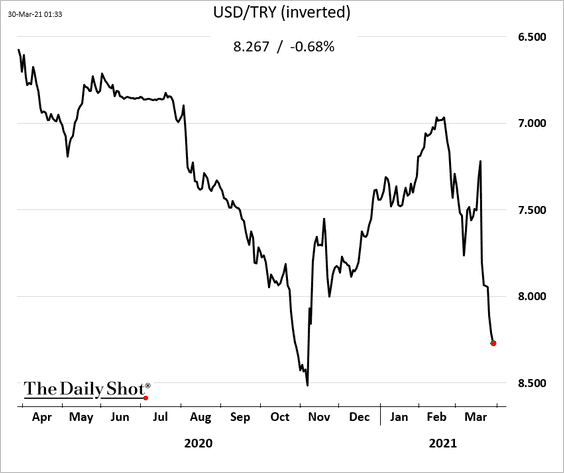
2. The Turkish lira continues to weaken.
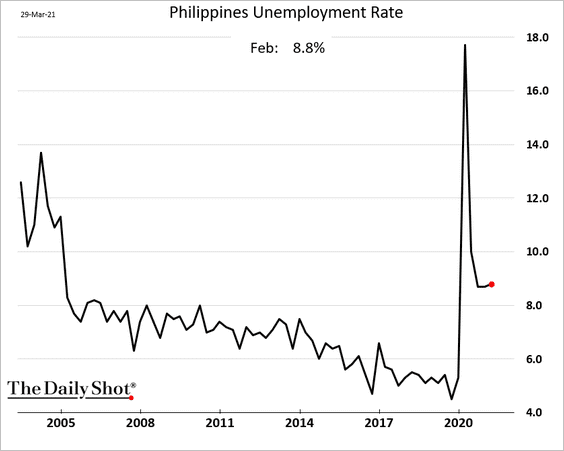
3. The Philippine labor market recovery has stalled.
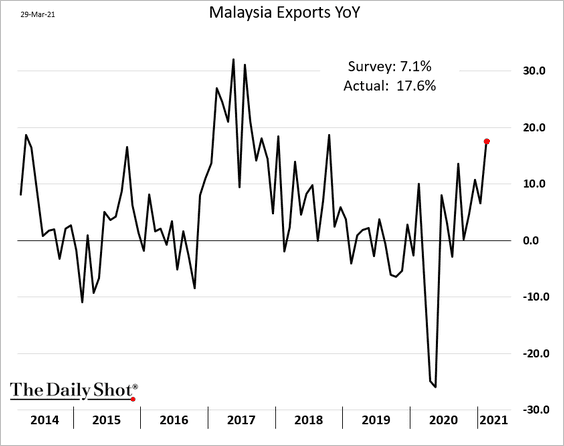
4. Malaysia’s exports surprised to the upside.
5. Some Asian countries see a spike in COVID cases.
 Source: Statista
6. Brazil’s COVID situation continues to worsen.
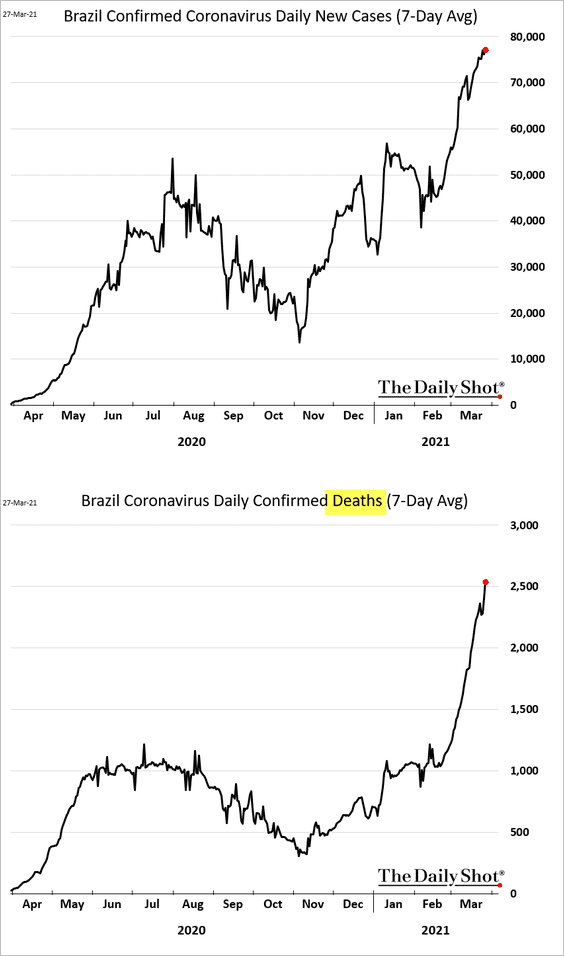
Bolsonaro ousted more top ministers in response (it’s unclear how that could help).
 Source: @bpolitics Read full article
——————–
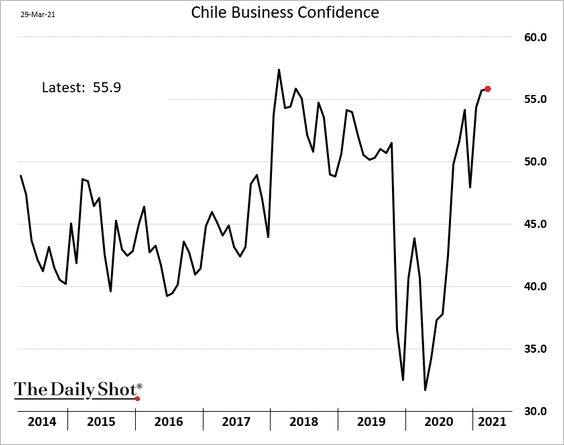
7. Chile’s business confidence remains strong.
8. EM equities have been underperforming developed markets as the dollar strengthens.
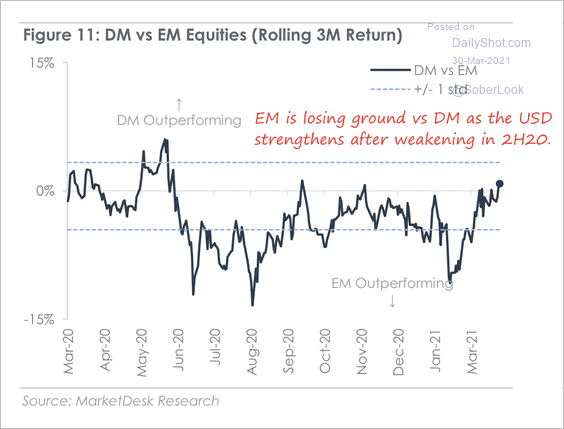 Source: Danske Bank
Back to Index
Commodities
1. CTA exposure to gold turned negative as the price uptrend has weakened since January.
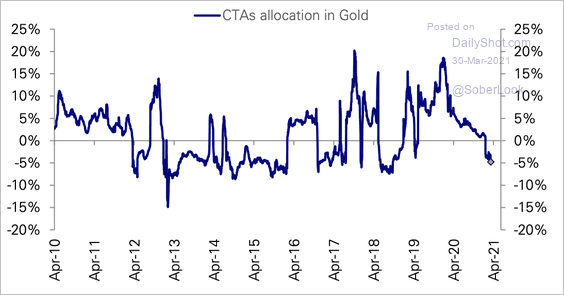 Source: Deutsche Bank Research
2. 86% of the world’s commodities (ex-energy and gold) are generating positive year-over-year gains, the highest since March 2011.
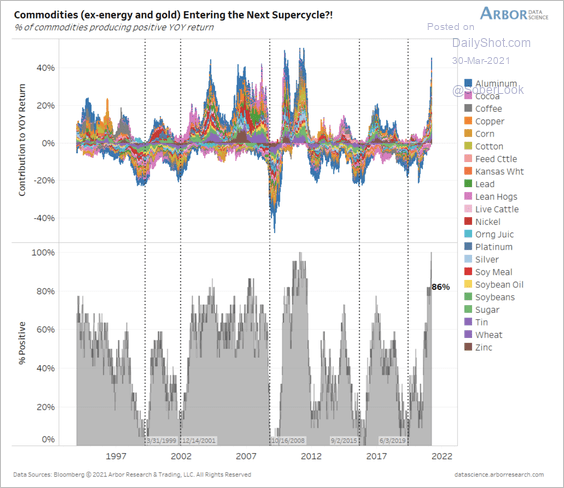 Source: Arbor Research & Trading
3. US farmland prices strengthened last year as grain prices surged.
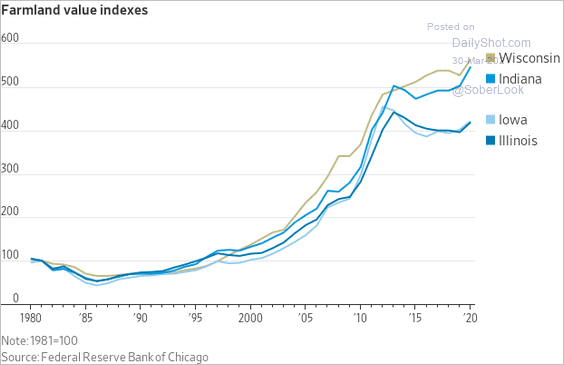 Source: @WSJ Read full article
Back to Index
Energy
1. Global diesel prices are approaching pre-pandemic levels.
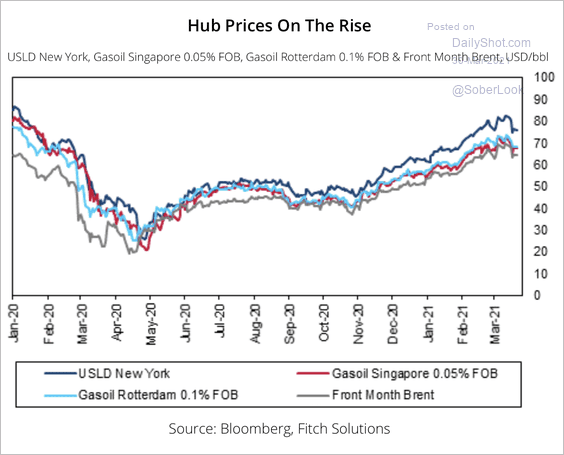 Source: Fitch Solutions Macro Research
2. This chart shows oil majors’ CapEx over time.
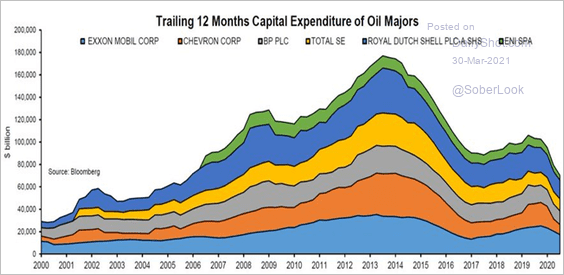 Source: @jessefelder, @johnauthers, @bopinion Read full article
3. Hydrogen energy stocks have been struggling in recent weeks.
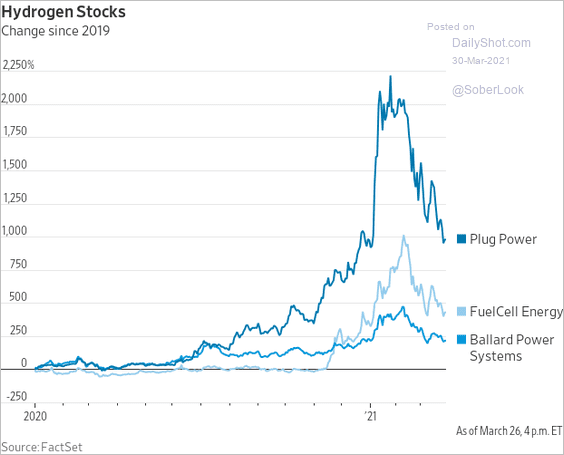 Source: @WSJ Read full article
Back to Index
Equities
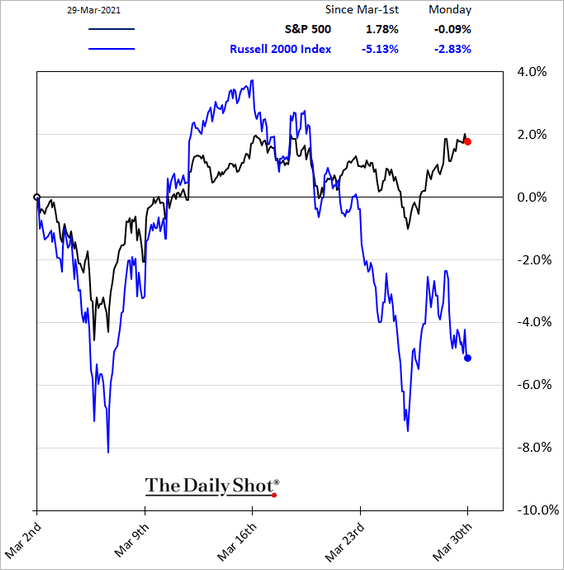
1. Small caps have been underperforming.
Leveraged funds have been bearish on small caps while asset managers are long.
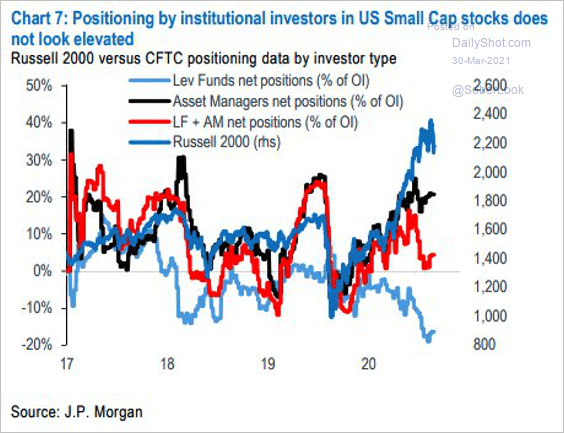 Source: @WallStJesus
——————–
2. Nonprofitable tech companies slumped over the past month.
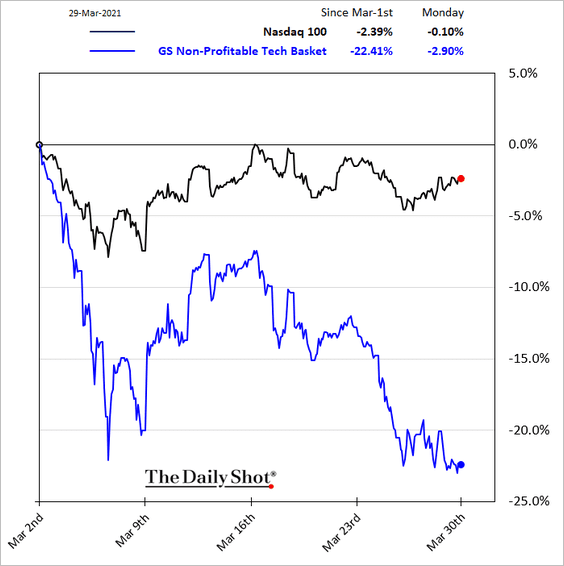
Valuations have been extreme.
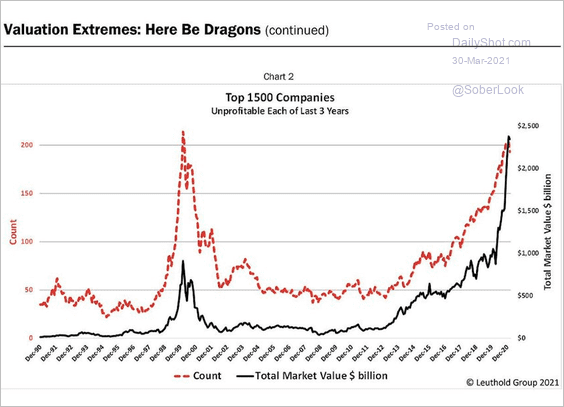 Source: @jessefelder, The Leuthold Group Read full article
——————–
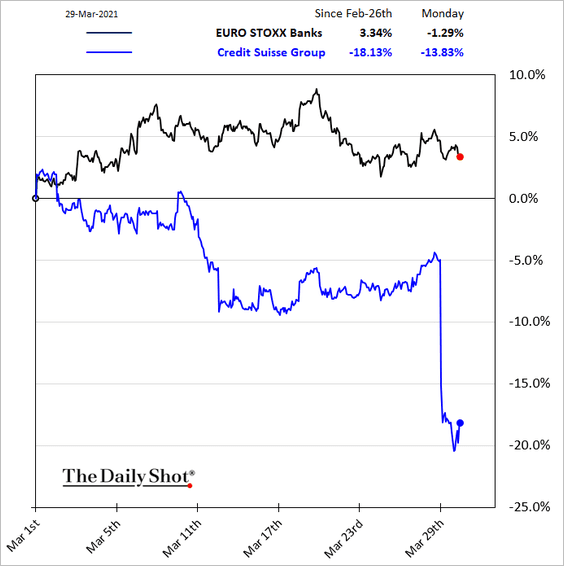
3. The Archegos Capital situation put some pressure on bank shares.
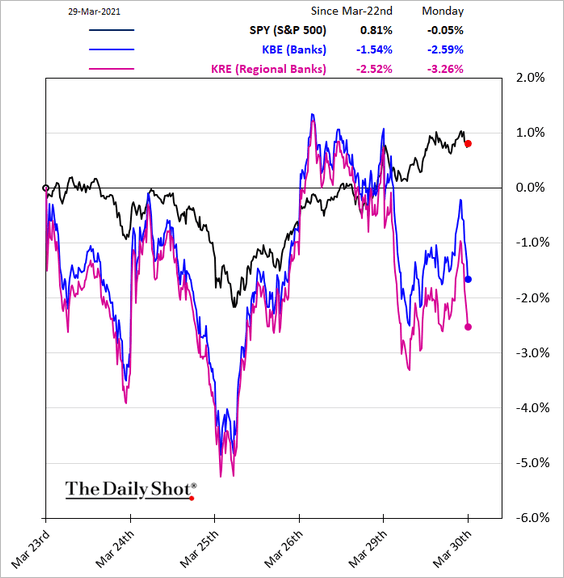
Here is Credit Suisse over the past month.
——————–
4. Median singe-stock PE ratios are high across equity markets in the US and Europe.
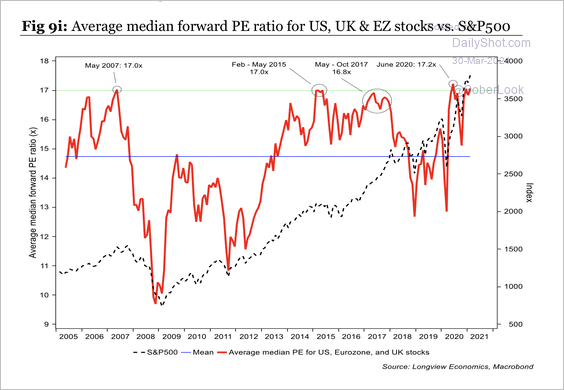 Source: Longview Economics
The proportion of US stocks with a PE ratio above 20 is at an extreme.
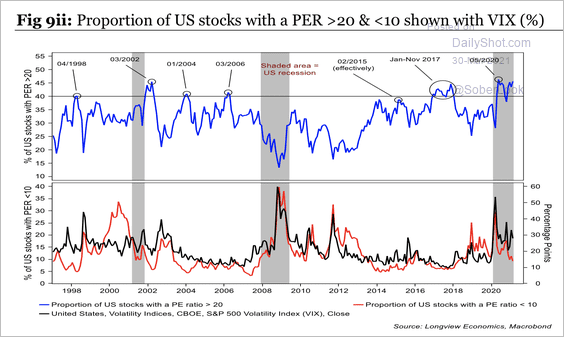 Source: Longview Economics
——————–
5. 2021 has been good to value shares.
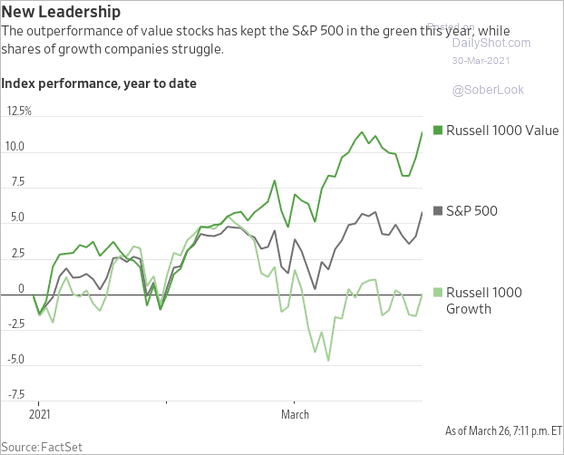 Source: @WSJ Read full article
6. Merrill Lynch’s private clients have been cutting back on equity exposure.
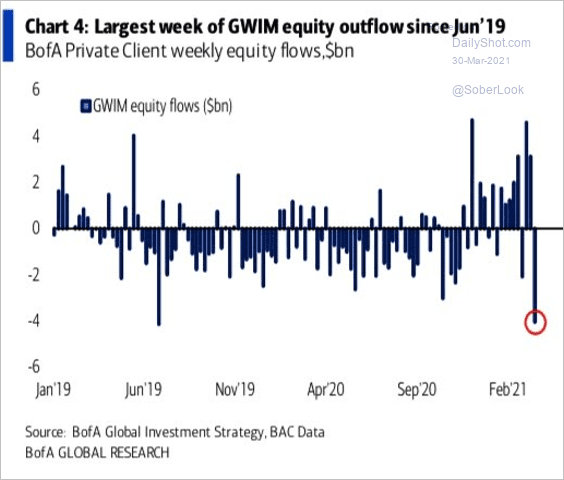 Source: BofA Global Research, @WallStJesus
7. The S&P 500 dividend yield remains below the 10yr Treasury yield.
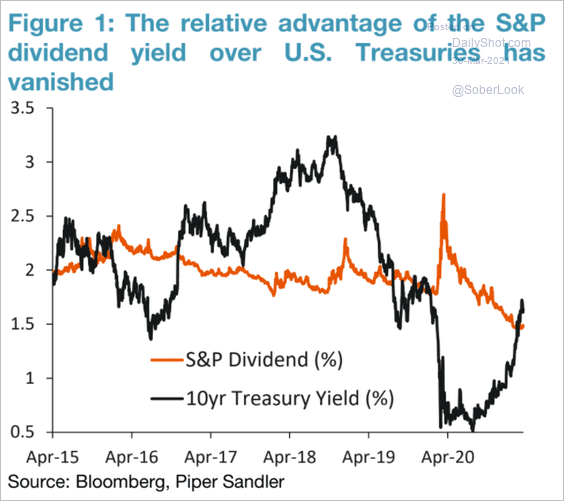 Source: Piper Sandler
8. History indicates that markets are vulnerable to a summer sell-off.
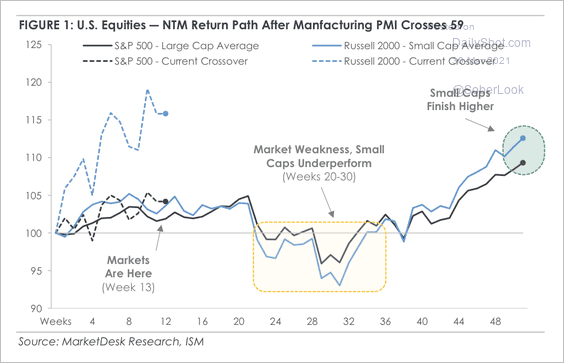 Source: MarketDesk Research
9. Here is the Nasdaq Composite vs. the Startups Barometer.
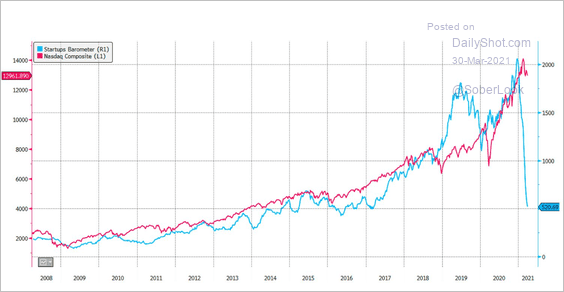 Source: Andrew Rummer
10. Insiders are no longer selling.
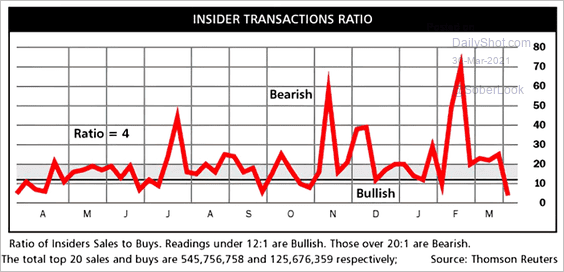 Source: @ISABELNET_SA
11. A basket of stocks with the highest call option exposures has turned down sharply since mid-February.
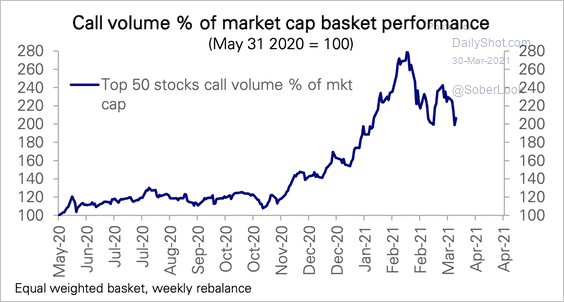 Source: Deutsche Bank Research
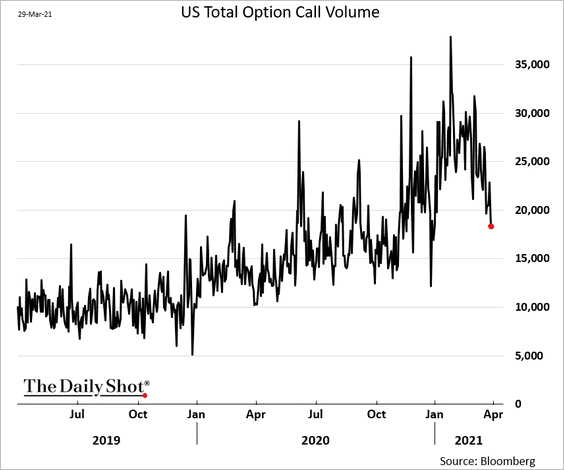
12. Call option volume continues to moderate.
Back to Index
Credit
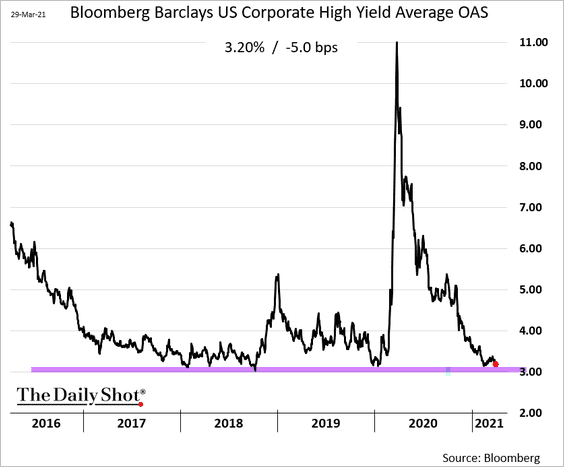
1. US high-yield bond spreads are hovering near the lows.
2. High-yield issuance hit a record high.
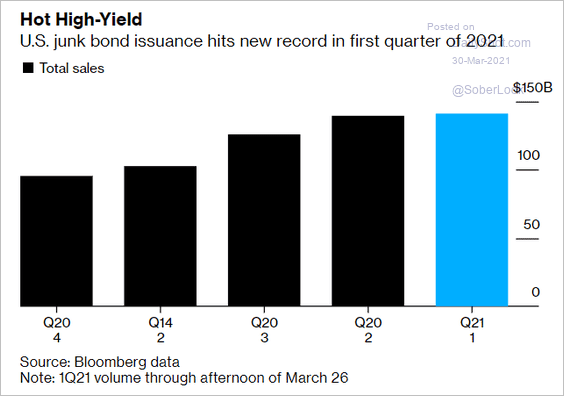 Source: Bloomberg Read full article
3. Leveraged loan volume rose sharply this quarter.
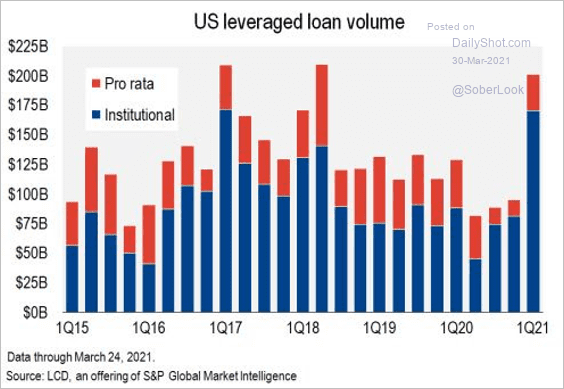 Source: S&P Global Market Intelligence
4. Median high-yield company leverage is now at pre-COVID levels. But enterprise multiples are elevated.
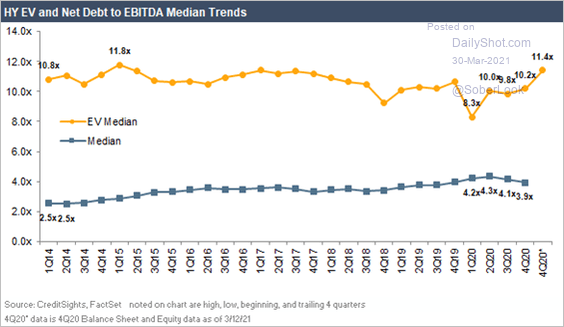 Source: CreditSights
Back to Index
Rates
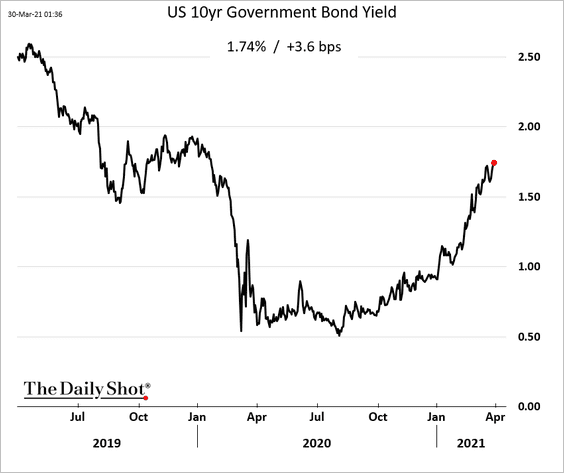
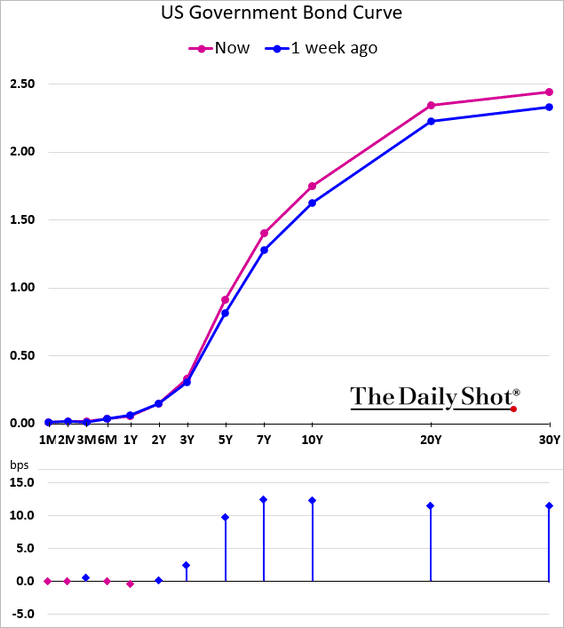
1. Treasury yields resumed their ascent.
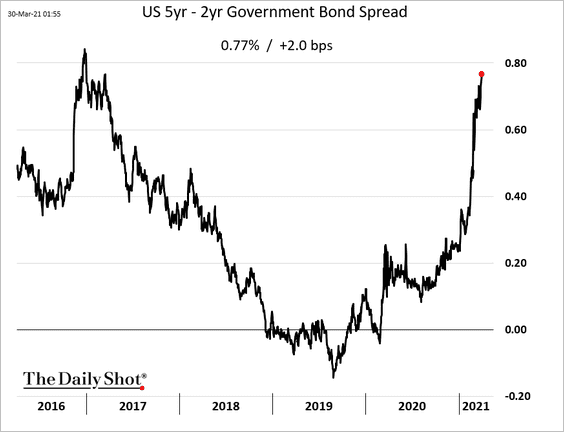
The curve is rapidly steepening in the intermediate maturities.
——————–
2. CTA exposure to government bonds turned negative, reacting to the trend reversal in yields.
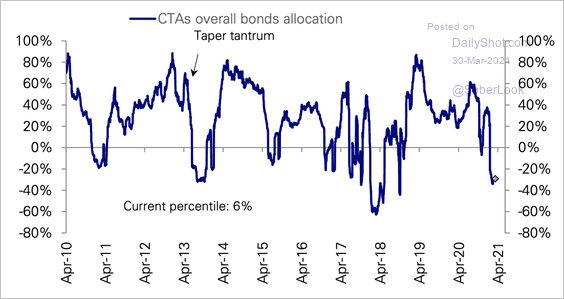 Source: Deutsche Bank Research
3. Here is the seasonal pattern for Treasuries.
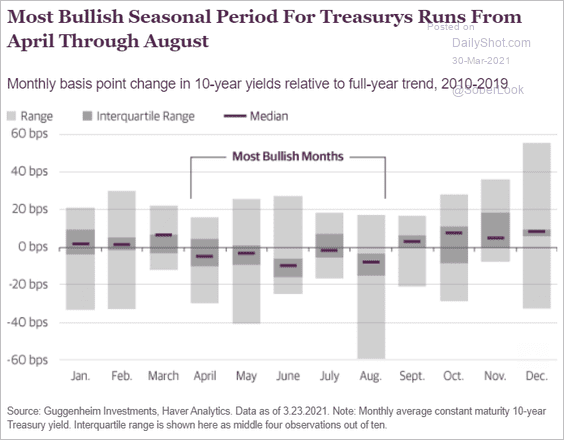 Source: Guggenheim
4. Next, we have some yield forecasts.
• Capital Economics:
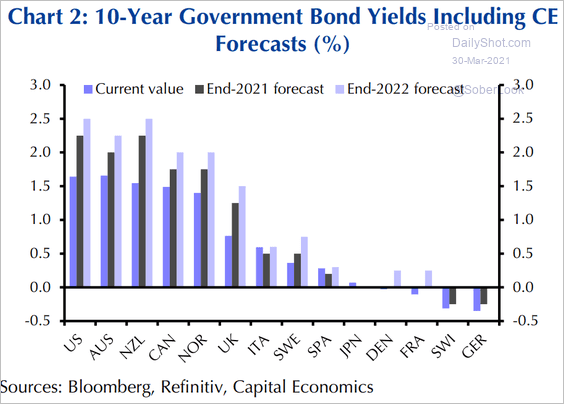 Source: Capital Economics
• Evercore ISI:
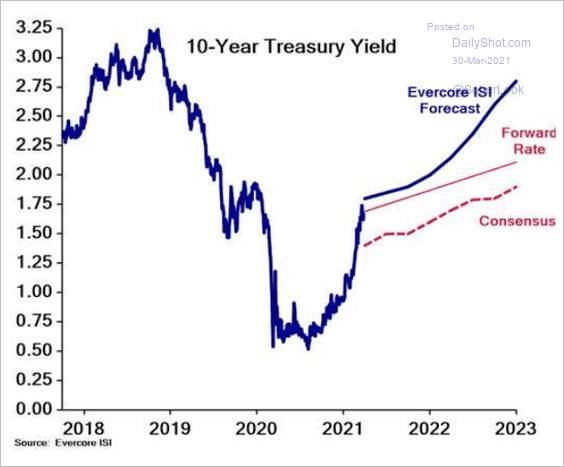 Source: Evercore ISI
——————–
5. Will Treasury yields catch up to reflation proxies?
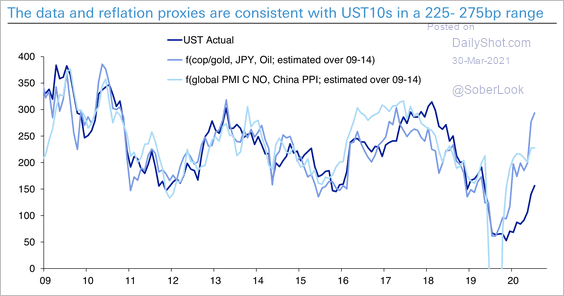 Source: Deutsche Bank Research
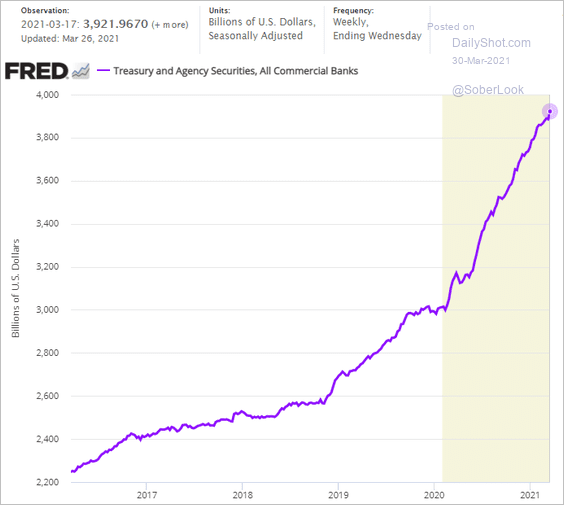
6. Treasuries and agency MBS held by banks keep climbing.
7. Here is the 10-year US breakeven rate vs. previous economic recoveries.
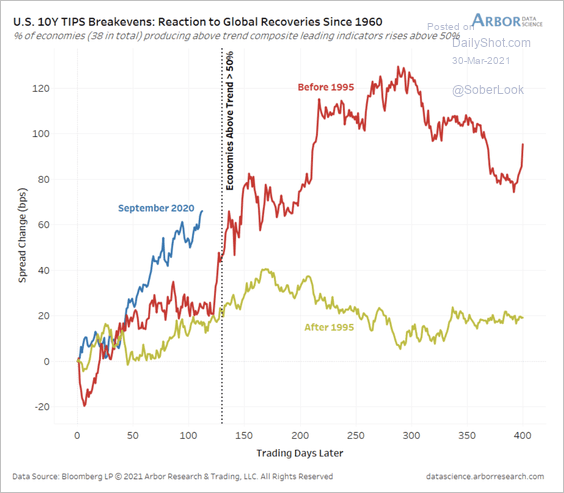 Source: Arbor Research & Trading
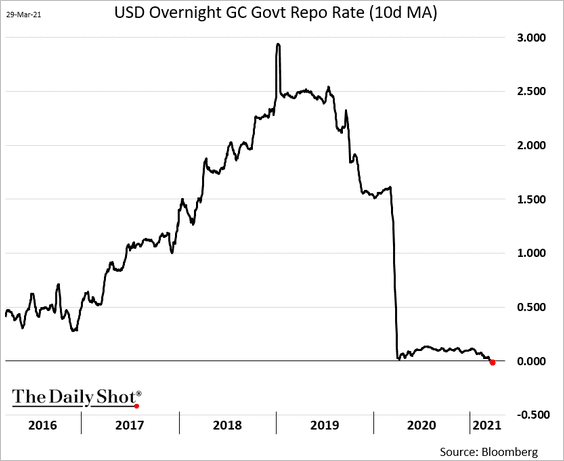
8. Overnight repo rates are trading near (or below) zero. Will the SOFR index hit zero as well?
——————–
Food for Thought
1. Container ship size growth (2 charts):
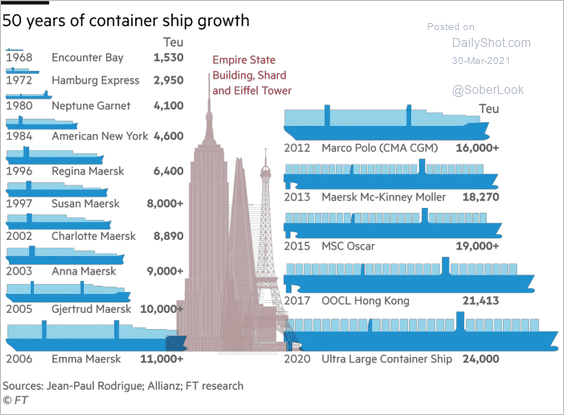 Source: @financialtimes Read full article
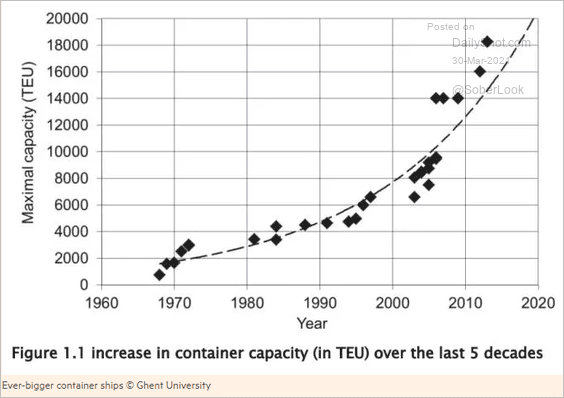 Source: @financialtimes Read full article
——————–
2. China’s population in perspective:
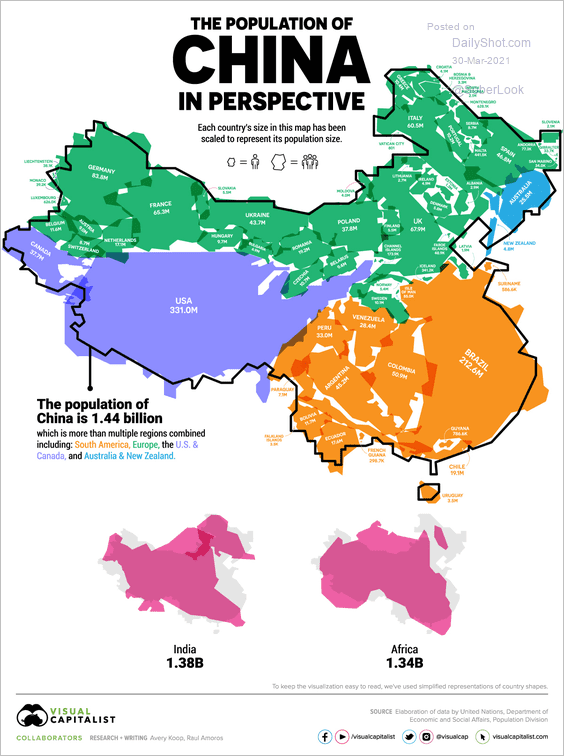 Source: Visual Capitalist Read full article
3. The benefits of performing well on China’s most important academic exam:
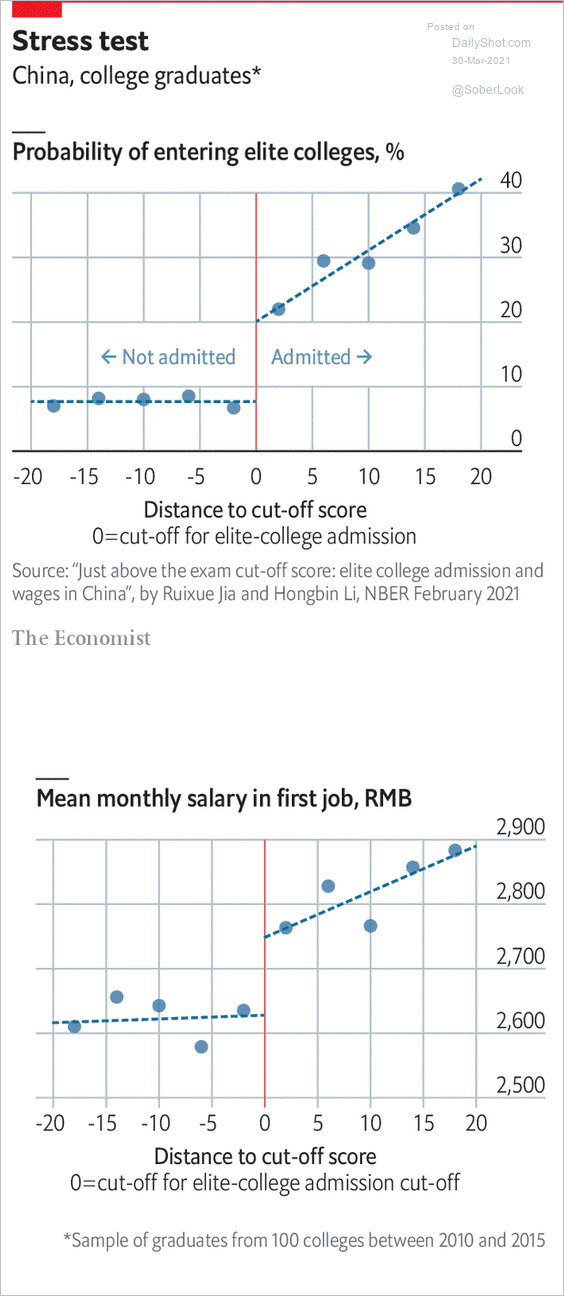 Source: The Economist Read full article
4. US life expectancy by race/ethnicity:
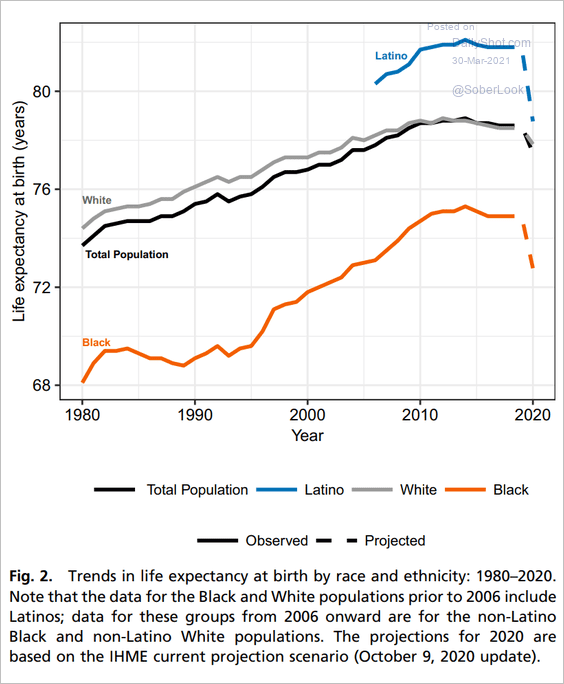 Source: PNAS Read full article
5. Ideological composition of Iran’s parliament:
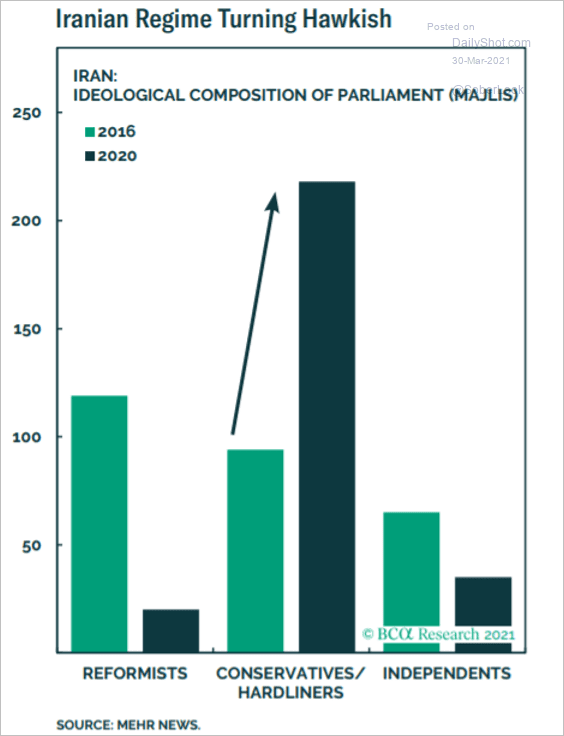 Source: BCA Research
6. Hospital beds vs. the share of older population:
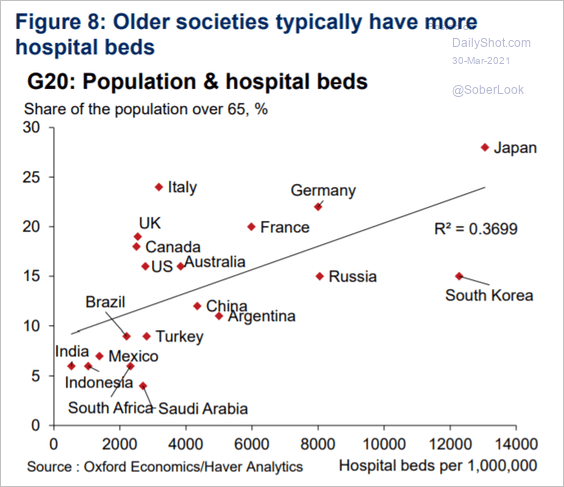 Source: Oxford Economics
7. Biden’s revenue and spending plans:
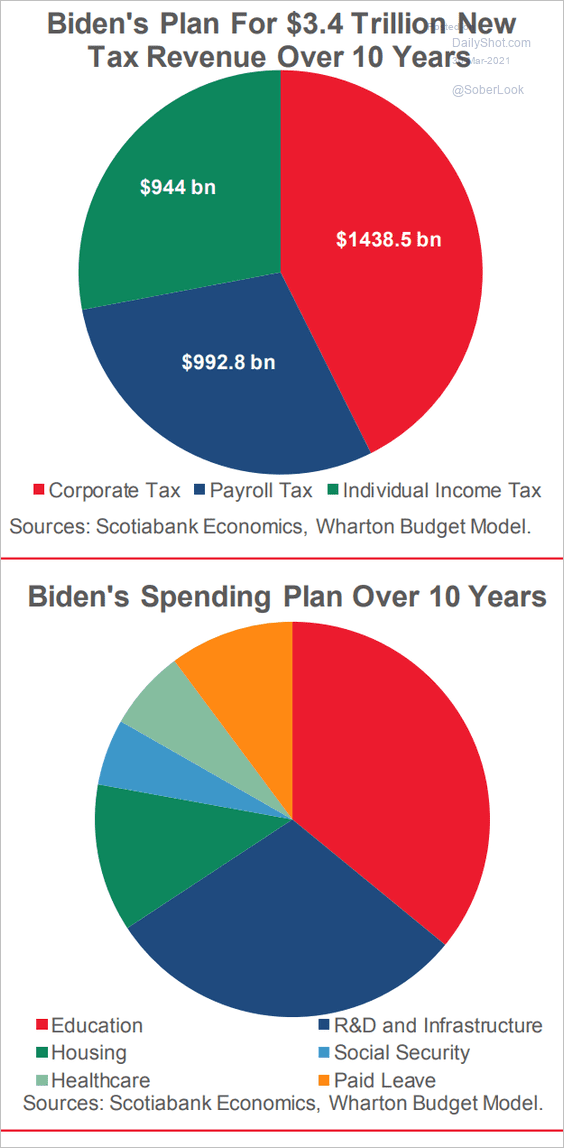 Source: Scotiabank Economics
8. US political news sources:
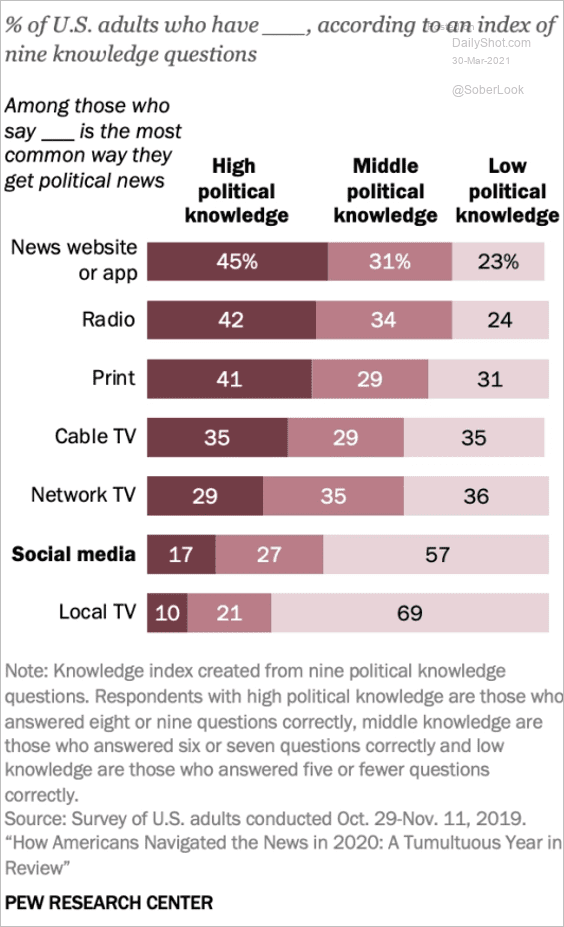 Source: Pew Research Center Read full article
9. Split US Senate delegations:
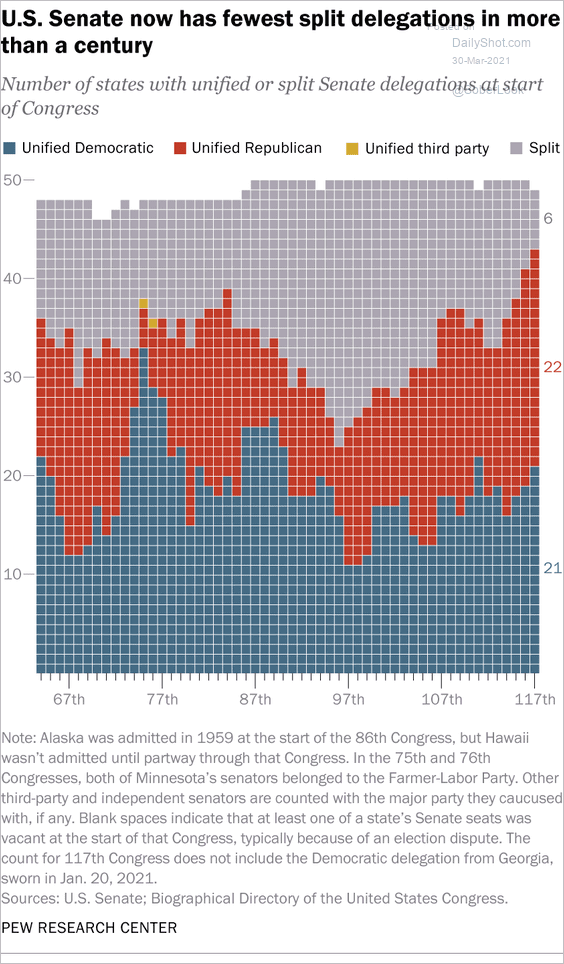 Source: Pew Research Center Read full article
10. EVs as a share of new passenger cars:
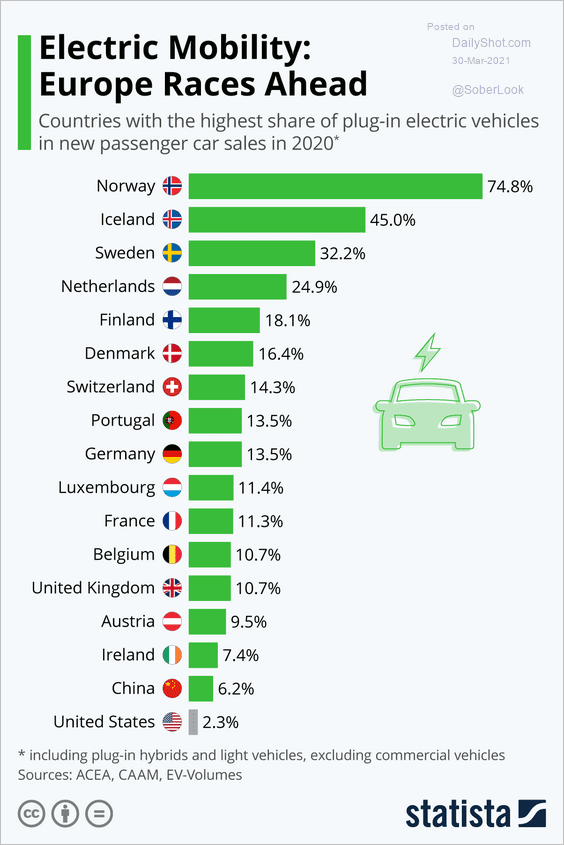 Source: Statista
11. Film rating vs. duration:
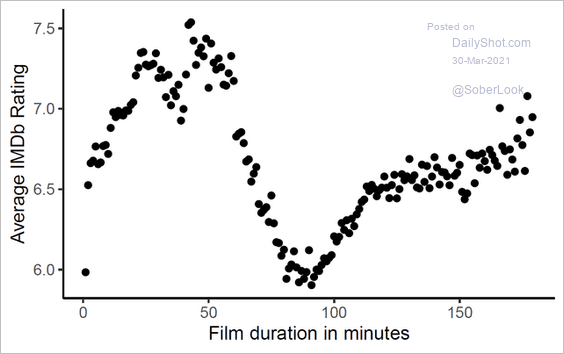 Source: r/dataisbeautiful
——————–
Back to Index