
The Daily Shot: 10-Sep-21
• The United States
• The United Kingdom
• The Eurozone
• Europe
• Asia – Pacific
• China
• Emerging Markets
• Cryptocurrency
• Commodities
• Energy
• Equities
• Rates
• Global Developments
• Food for Thought
The United States
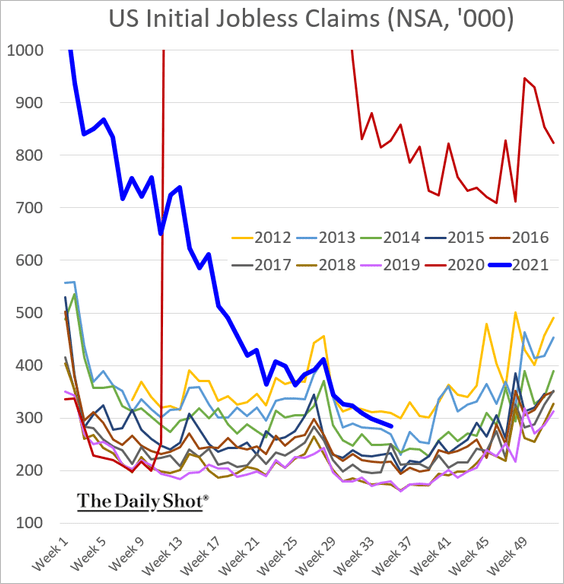
1. Let’s begin with the labor market.
• Applications for unemployment benefits continue to trend lower.
• Many indicators used to forecast payroll gains didn’t work well in August.
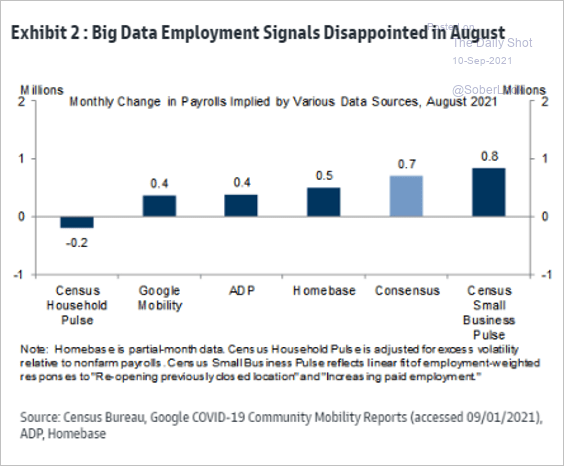 Source: Goldman Sachs
• The number of Americans staying out of the workforce due to COVID has been declining but appears to be leveling off.
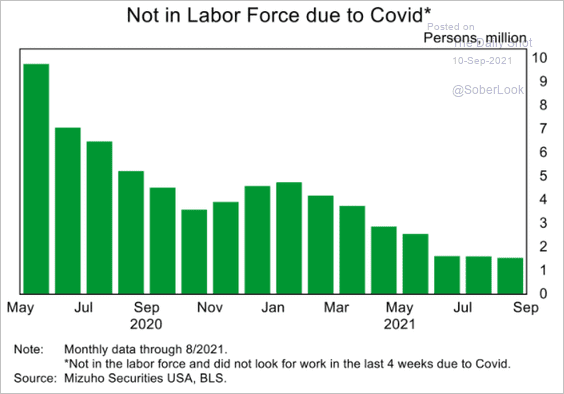 Source: Mizuho Securities USA
——————–
2. The Delta variant has had a limited impact on leisure activity, with restaurant booking data remaining high and, unlike before, uncorrelated to hospitalization levels.
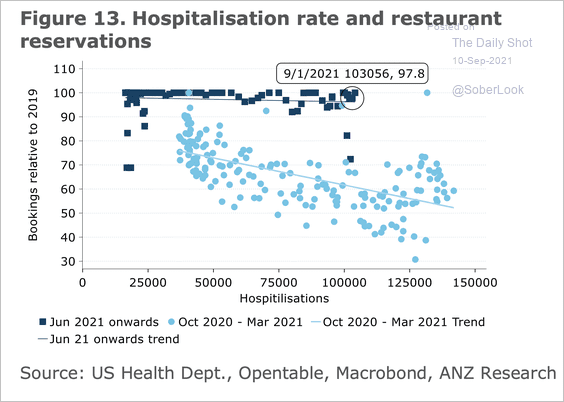 Source: ANZ Research
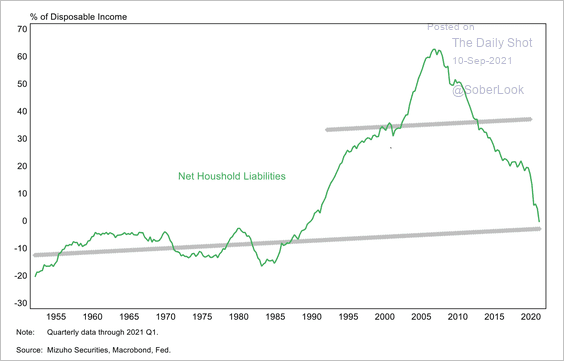
3. Is household deleveraging bottoming?
 Source: Mizuho Securities USA
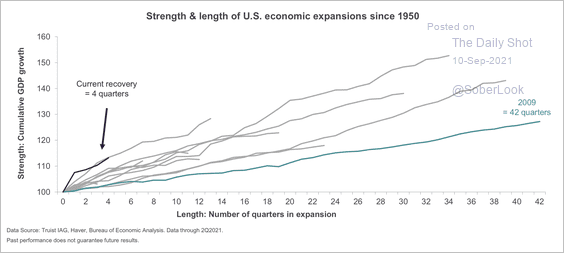
4. The economic recovery is still in its early stages compared to previous expansions.
 Source: Truist Advisory Services
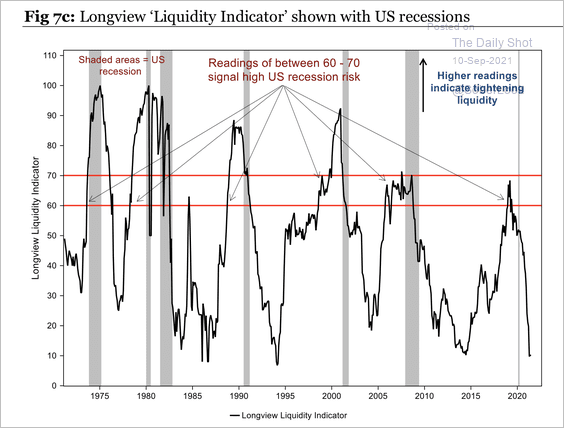
5. There appears to be ample liquidity in the US economy, which reduces the risk of a near-term recession.
 Source: Longview Economics
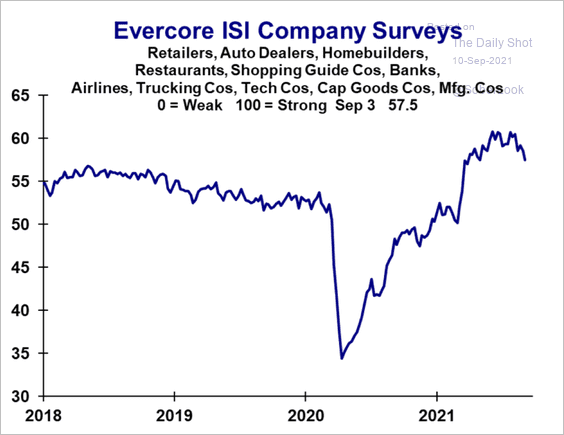
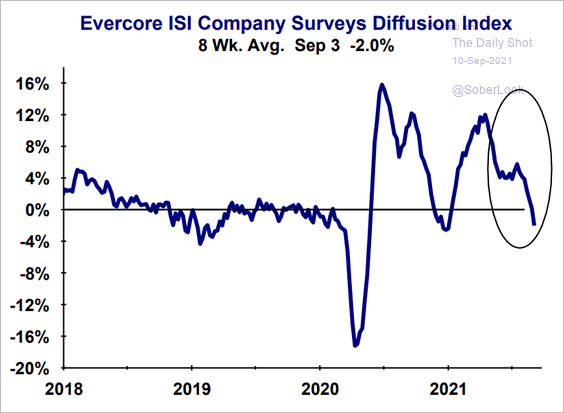
6. The Evercore ISI business activity indicator has been rolling over.
 Source: Evercore ISI
 Source: Evercore ISI
——————–
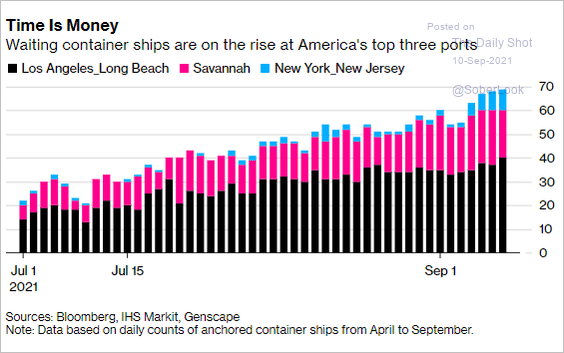
7. Here is the aggregate number of waiting container ships at the three largest US ports.
 Source: @tracyalloway Read full article
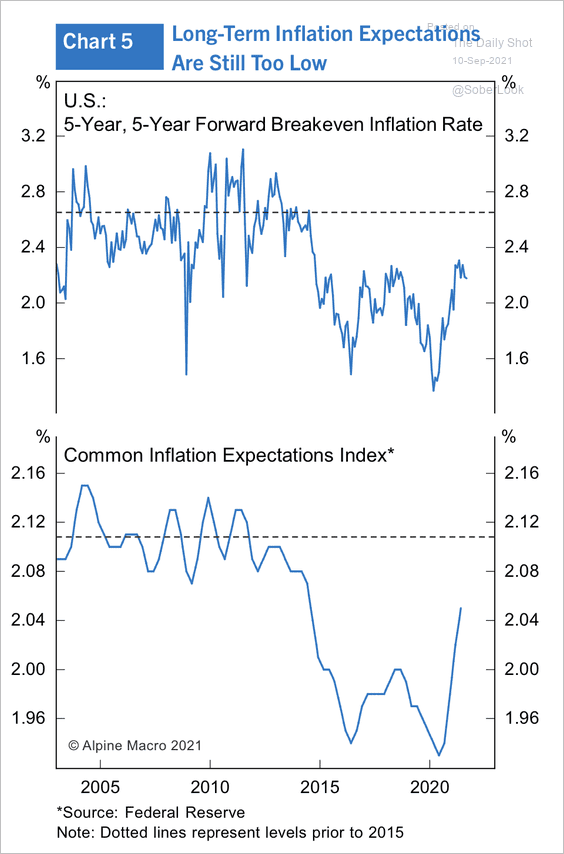
8. Next, we have some updates on inflation.
• Inflation expectations remain well below pre-2015 levels.
 Source: Alpine Macro
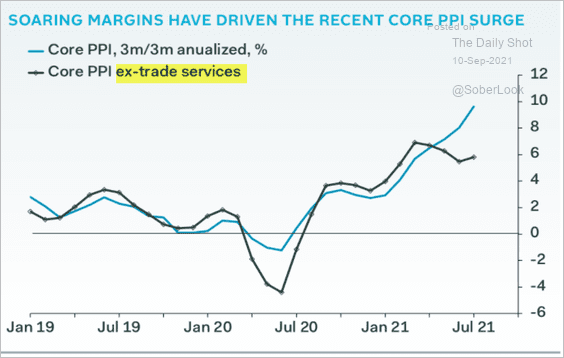
• Rapid gains in corporate margins have driven up producer prices (“trade services” = business markups).
 Source: Pantheon Macroeconomics
Nonfinancial corporate margins are now the highest since 1968.
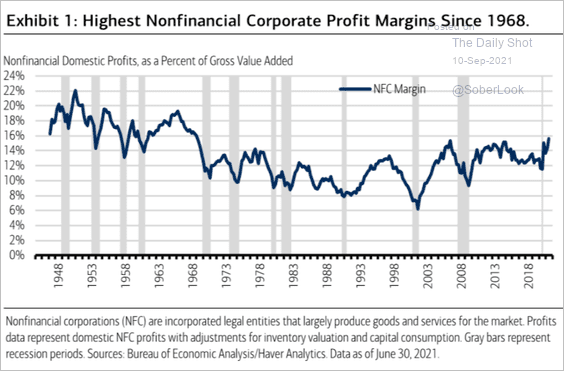 Source: BofA Global Research
• The “reopening sectors” that sent consumer inflation sharply higher will become a drag on the CPI next year.
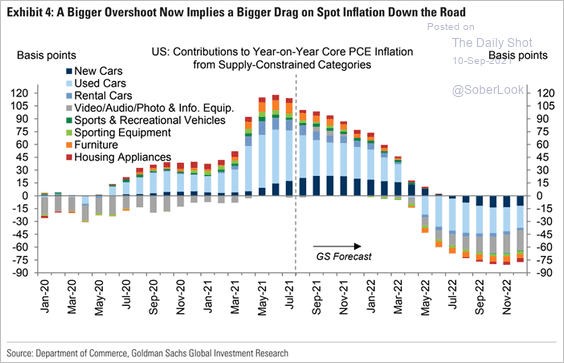 Source: @ISABELNET_SA, @GoldmanSachs
Back to Index
The United Kingdom
1. Layoffs have been unusually low (similar to the US).
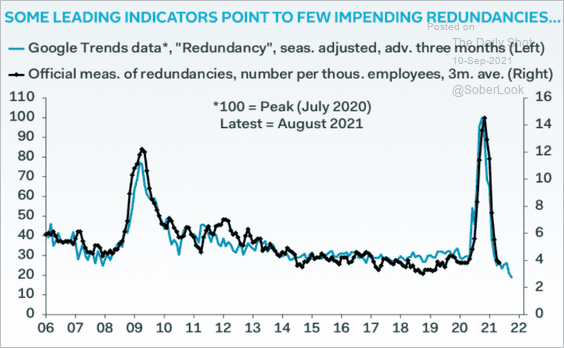 Source: Pantheon Macroeconomics
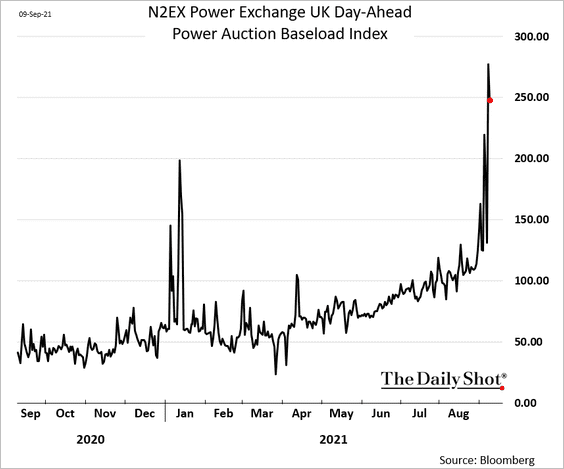
2. Electricity prices have been surging as natural gas costs hit record highs.
Back to Index
The Eurozone
1. The media coverage of the ECB’s modest (and expected) reduction in securities purchases has been entertaining.
 Source: Reuters Read full article
 Source: @WSJ Read full article
 Source: CNBC Read full article
• PEPP (pandemic QE program) will probably end after March.
 Source: ING Read full article
Here is a forecast from Nordea.
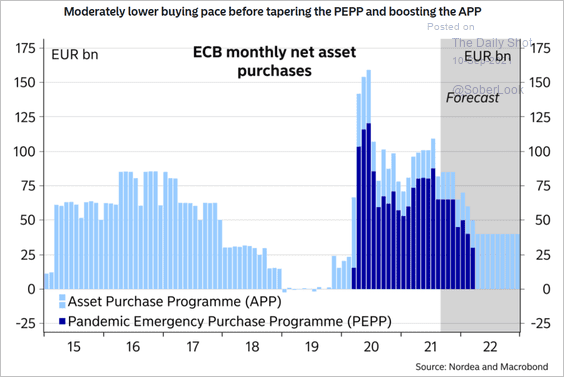 Source: Nordea Markets
• The ECB boosted its inflation forecasts.
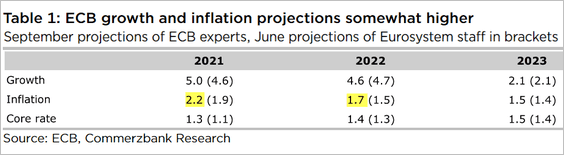 Source: Commerzbank Research
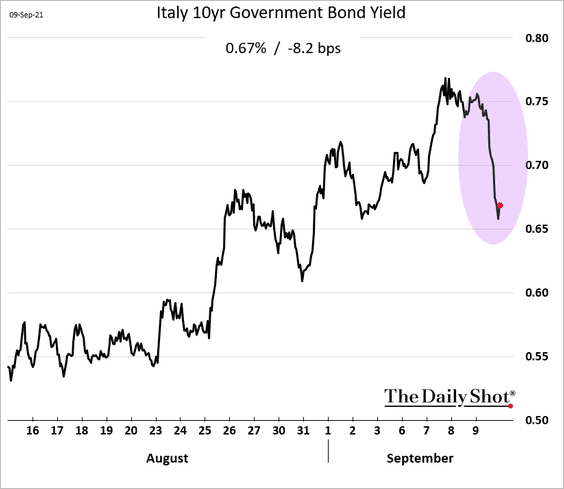
• Bonds rallied in response to the ECB’s decision.
——————–
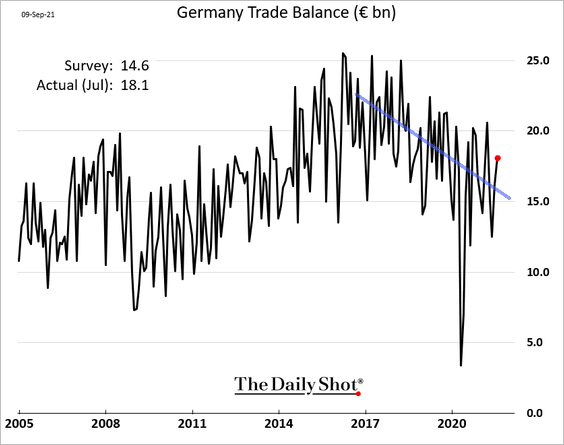
2. Germany’s exports continue to climb.
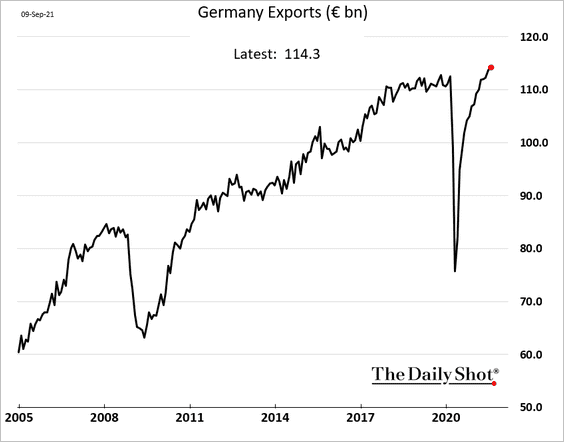
An unexpected drop in imports boosted the July trade surplus, but the downtrend remains in place.
• Separately, these two maps compare Germany’s latest polls with the 2017 election results.
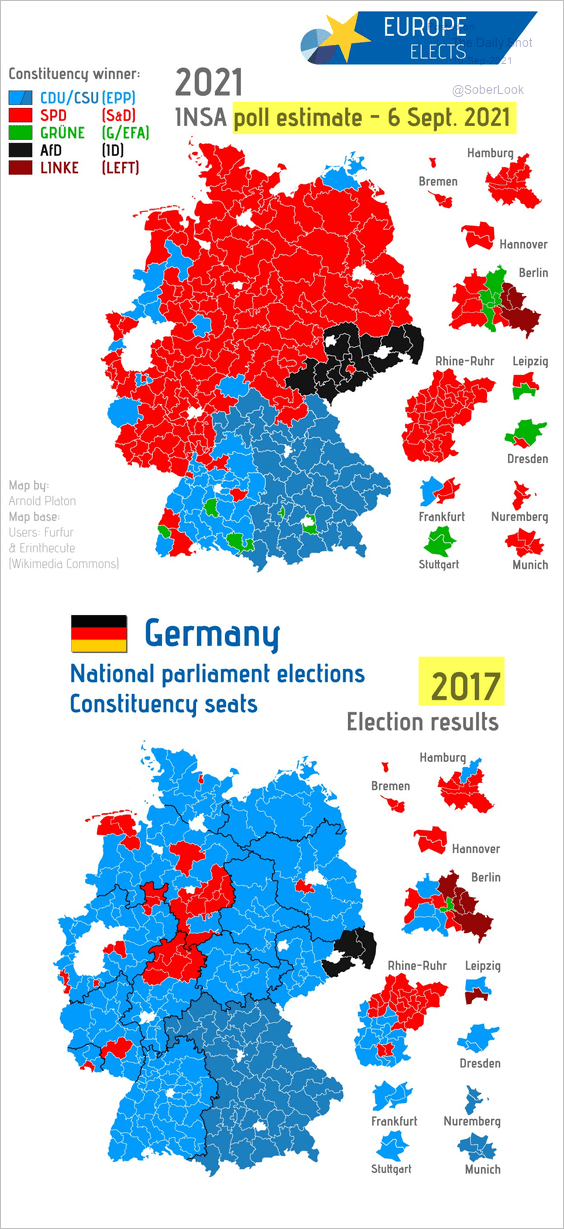 Source: @EuropeElects
——————–
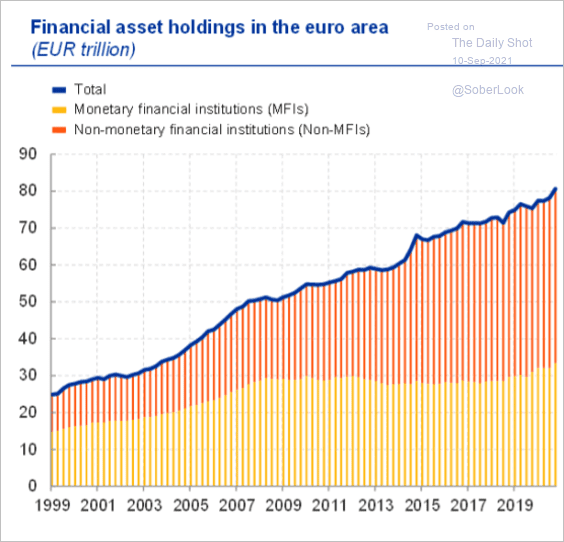
3. According to the ECB, non-banking organizations are increasingly dominant in the Eurozone’s financial system.
… based on the evolution of total financial assets, non-bank financial intermediaries – money market funds, investment funds, insurance companies, pension funds and a host of other, more specialised, financial institutions – have become increasingly relevant in the euro area.
 Source: ECB Read full article
Back to Index
Europe
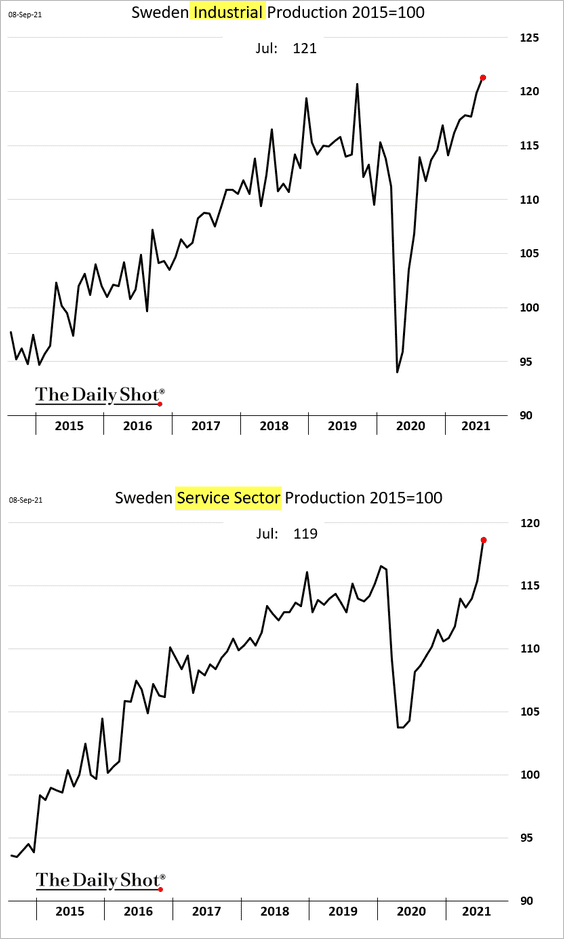
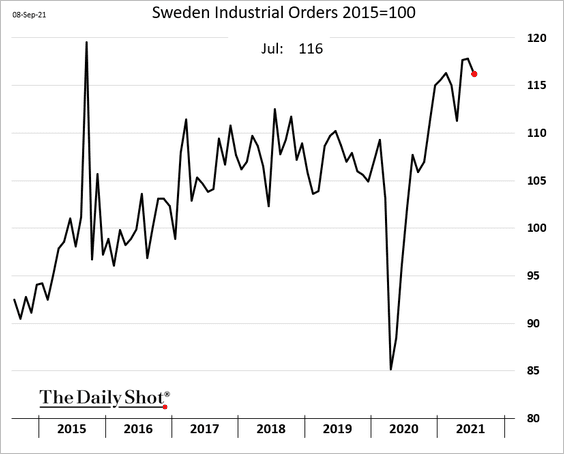
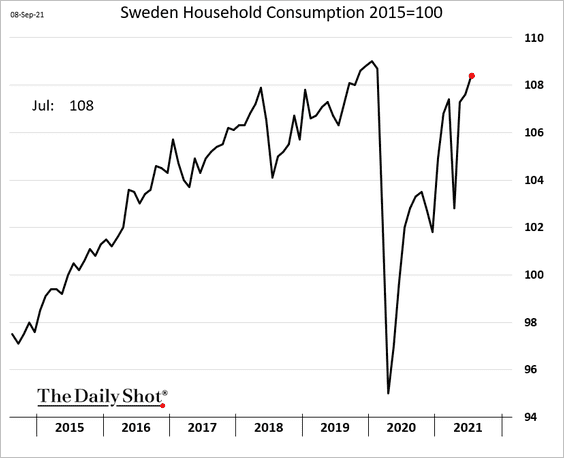
1. Sweden’s economic growth remains robust.
• Industrial and service-sector output:
• Industrial orders:
• Household consumption:
——————–
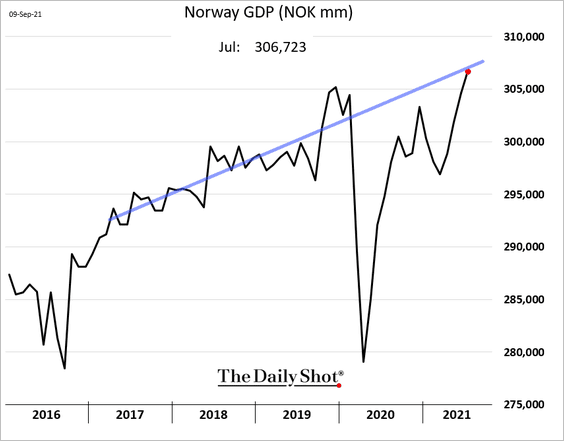
2. Norway’s GDP is back at the pre-COVID trend.
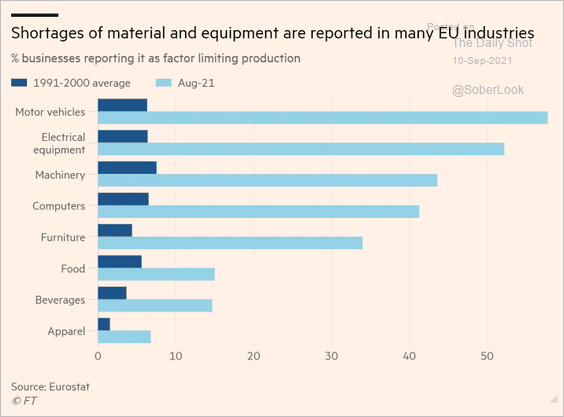
3. Shortages of material and equipment are limiting production in the EU (2 charts).
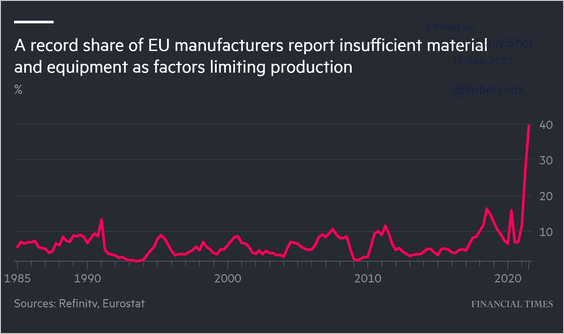 Source: @FinancialTimes Read full article
 Source: @macrocredit, @ft, @valentinaromei, @MAmdorsky, @davideghiglione Read full article
——————–
4. Hare are the trends in public transportation relative to pre-pandemic levels.
![]() Source: ING
Source: ING
Back to Index
Asia – Pacific
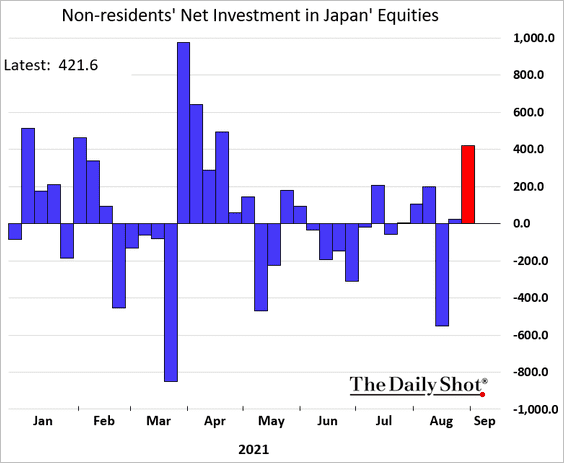
1. Foreigners have returned to Japan’s equity markets in recent days.
 h/t @shoko_oda
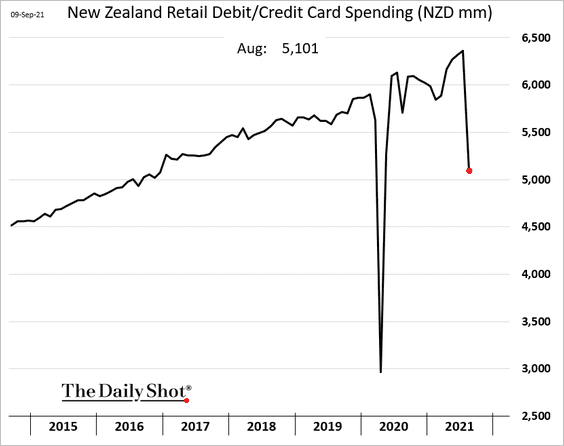
2. New Zealand’s retail card spending tumbled last month (similar to traffic trends).
Back to Index
China
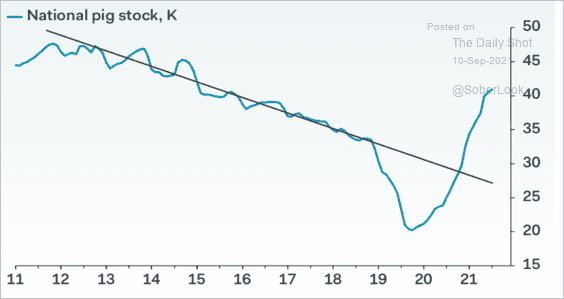
1. Pig herds have been recovering, causing food deflation and putting downward pressure on the headline CPI.
 Source: Pantheon Macroeconomics
2. International equity investors have been rotating out of China.
• EM ex-China ETFs:
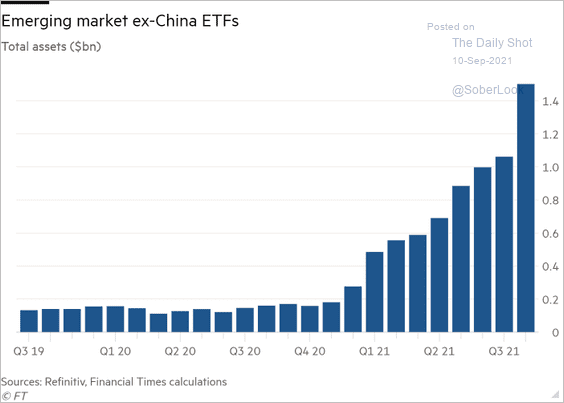 Source: @financialtimes Read full article
• Global equity funds’ exposure to China:
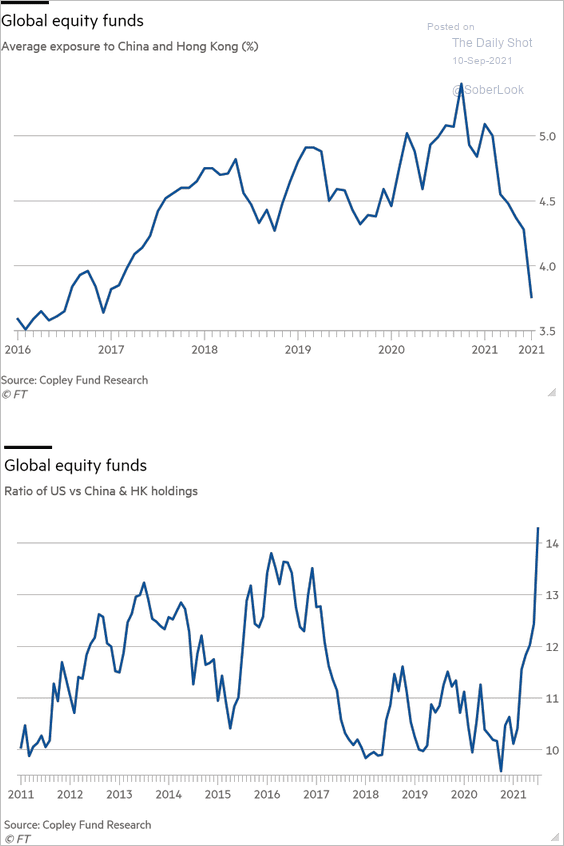 Source: @financialtimes Read full article
——————–
3. Chinese equities are least correlated to the S&P 500.
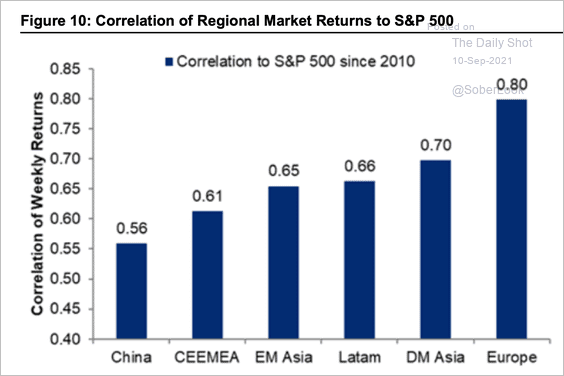 Source: Citi Private Bank
4. Analysts expect a regulatory crackdown-related slowdown in Chinese Internet company revenue growth (estimates are for top 20 companies).
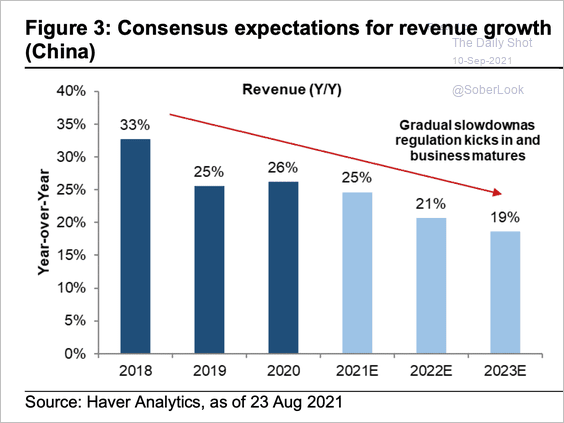 Source: Citi Private Bank
5. Revenues in the property sector have deteriorated this quarter.
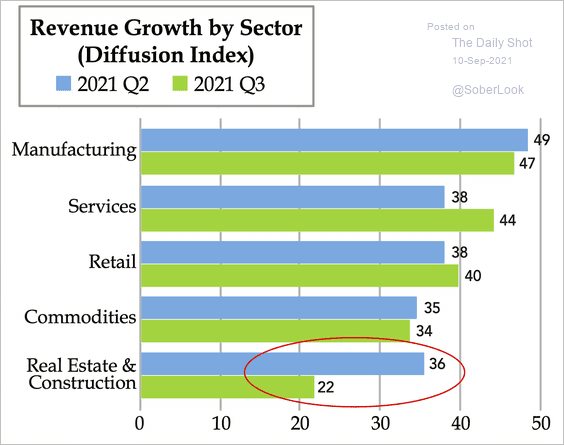 Source: Quill Intelligence, China Beige Book
6. There is ample room for fiscal stimulus to reignite economic growth, according to Alpine Macro.
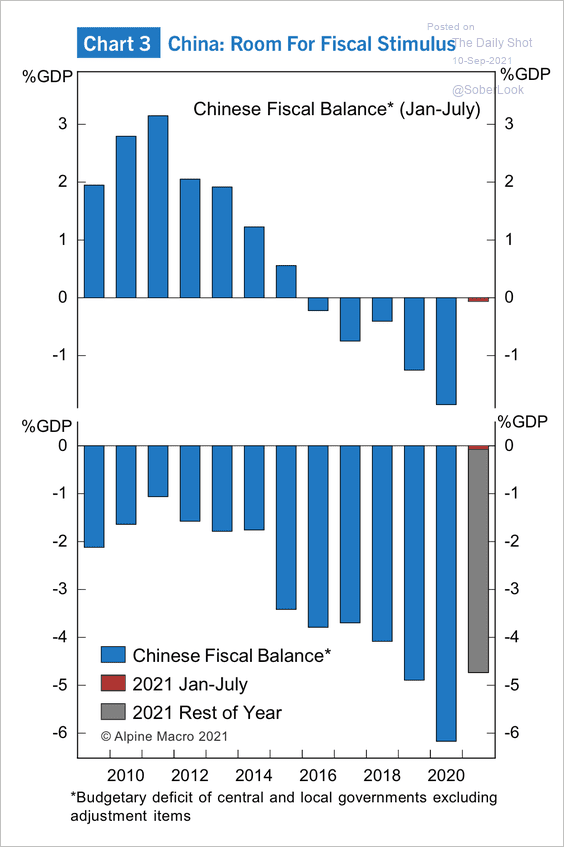 Source: Alpine Macro
Back to Index
Emerging Markets
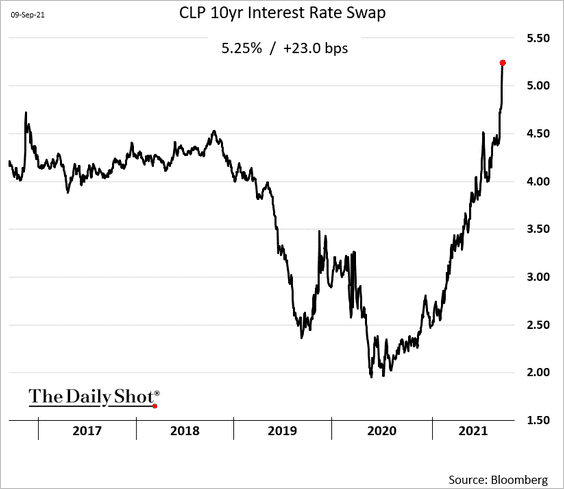
1. The Chilean peso resumed its decline.
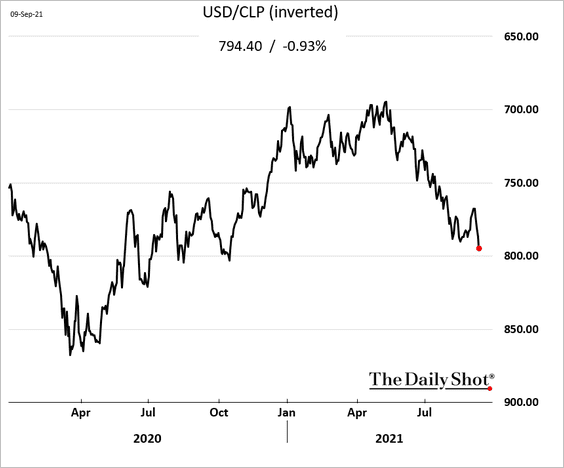
Long-term rates are surging.
——————–
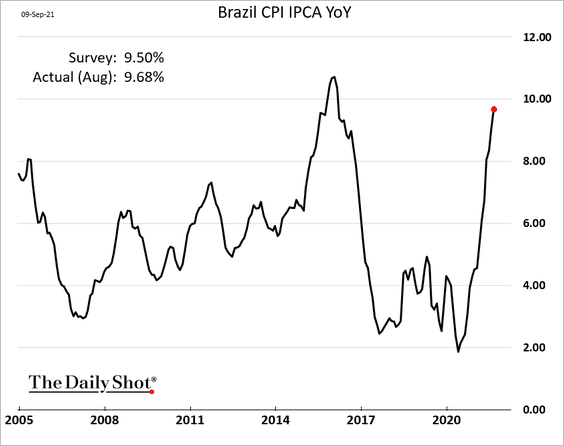
2. Brazil’s CPI is approaching 10%.
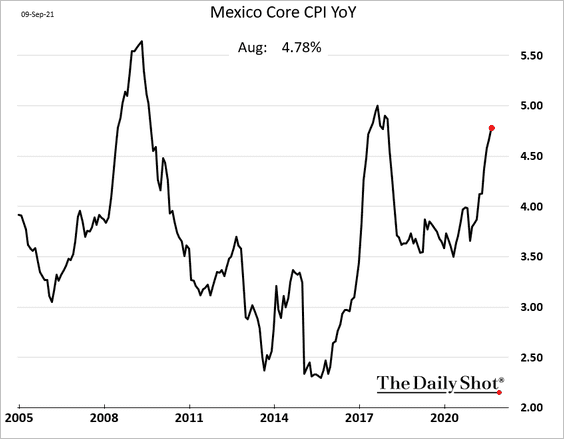
3. Mexico’s core inflation continues to climb.
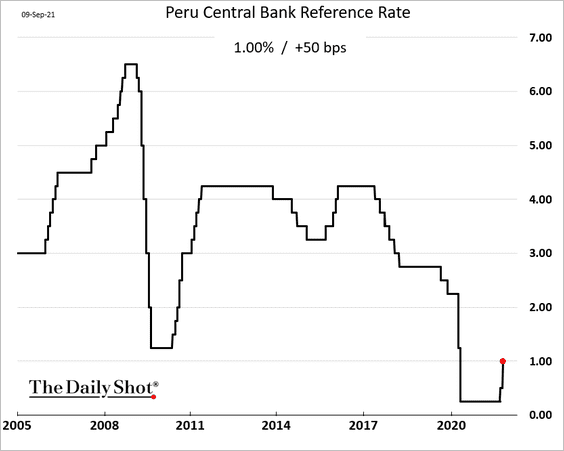
4. Peru’s central bank hiked rates again.
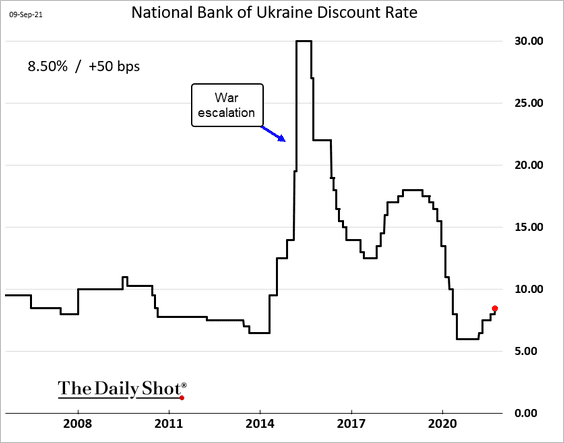
5. Ukraine’s central bank also lifted rates.
6. Here are some key EM policy rate trends (2 charts).
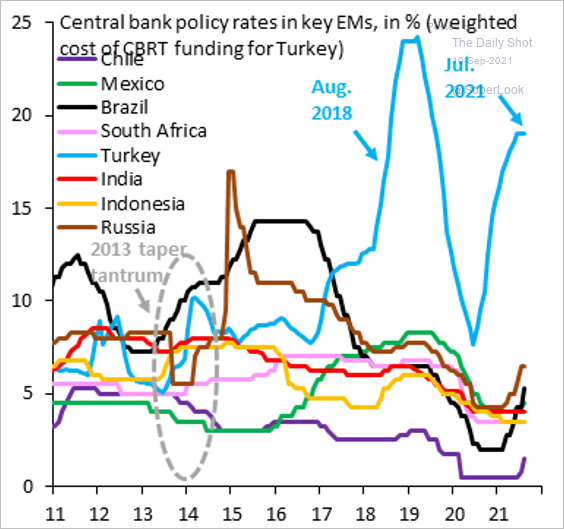 Source: @RobinBrooksIIF
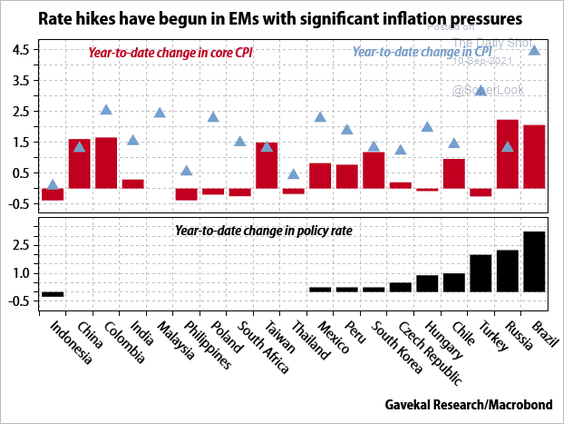 Source: Gavekal Research
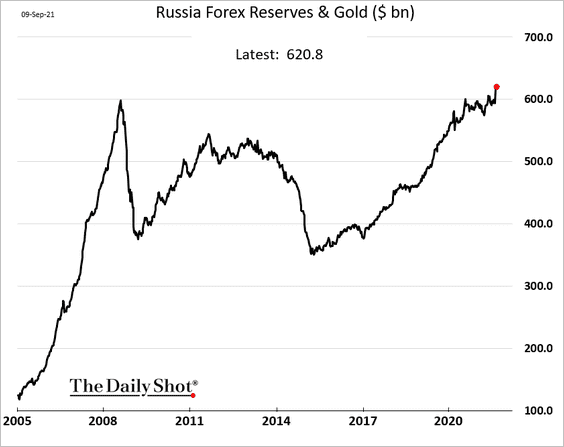
——————–
7. Russia’s F/X reserves (including gold) hit another record high.
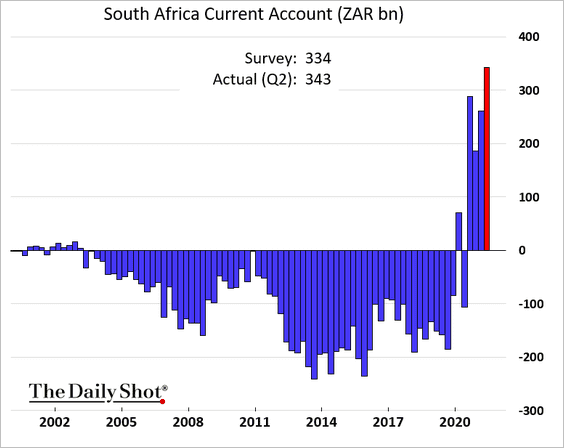
8. South Africa’s current account surplus surged last quarter.
9. The EM low-volatility factor has been a standout performer this quarter.
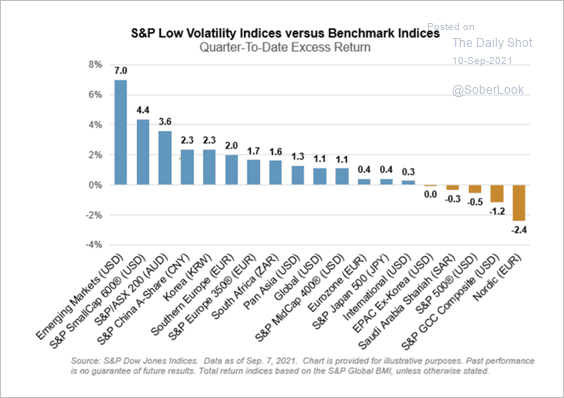 Source: S&P Global Market Intelligence
Back to Index
Cryptocurrency
1. Bitcoin’s network to transaction value ratio (NVT), which measures the relationship between BTC price and its intrinsic value, is unusually high, according to ByteTree.
![]() Source: ByteTree Read full article
Source: ByteTree Read full article
2. Bitcoin and ether’s realized volatility has been rising.
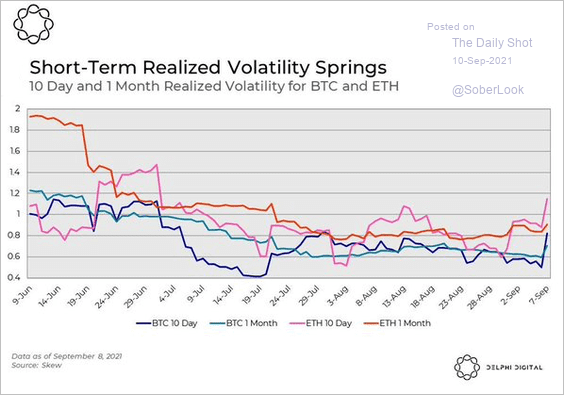 Source: @Delphi_Digital
Bitcoin’s implied volatility, however, is still low compared to the sell-off in May.
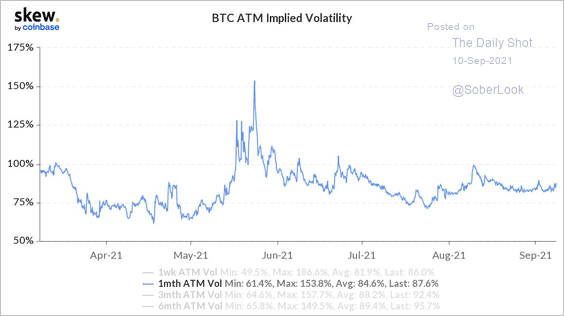 Source: Skew
——————–
3. How long has bitcoin been held?
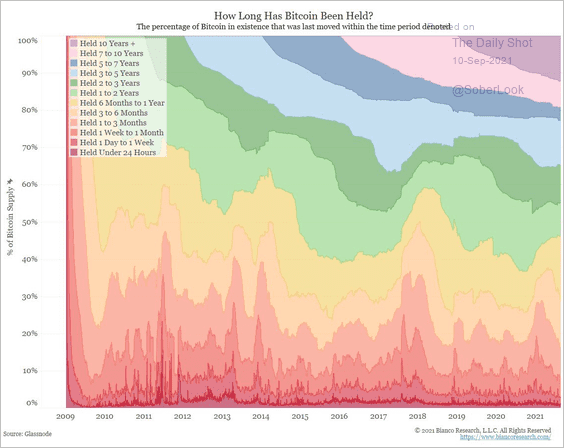 Source: @LizAnnSonders, @biancoresearch, @glassnode
4. Cartoon ape NFTs are fetching a hefty price.
 Source: CoinDesk Read full article

However, there are signs that the NFT boom may be slowing this month. OpenSea, an NFT marketplace, experienced lower trading volume over the past week.
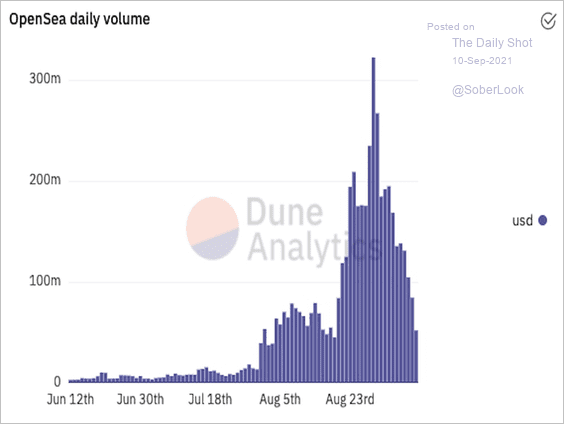 Source: Dune Analytics
——————–
5. This map shows the number of bitcoin ATMs by region.
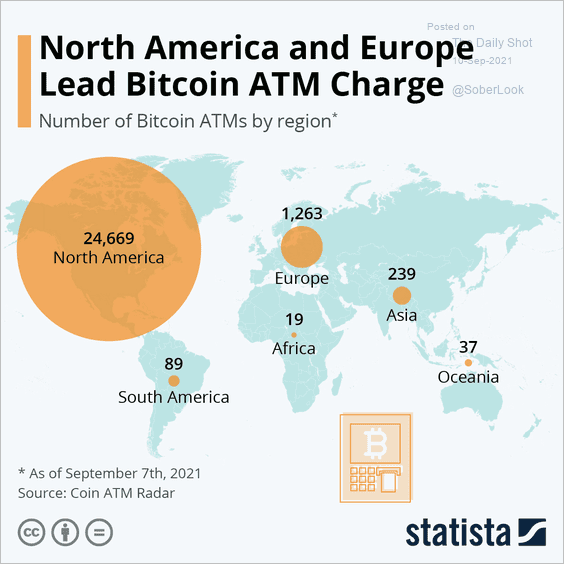 Source: Statista
Back to Index
Commodities
1. Nickel prices are surging, …
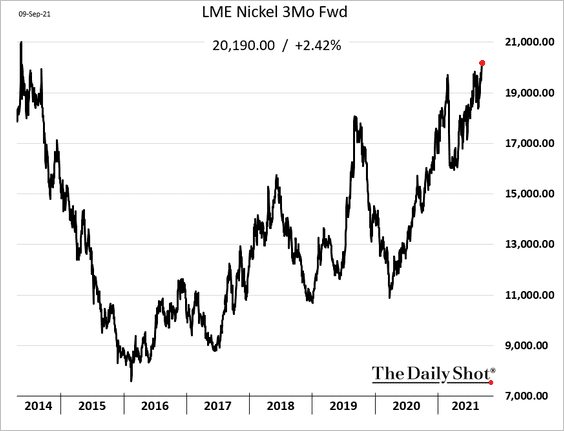
… with the market in deficit (driven by rising battery demand).
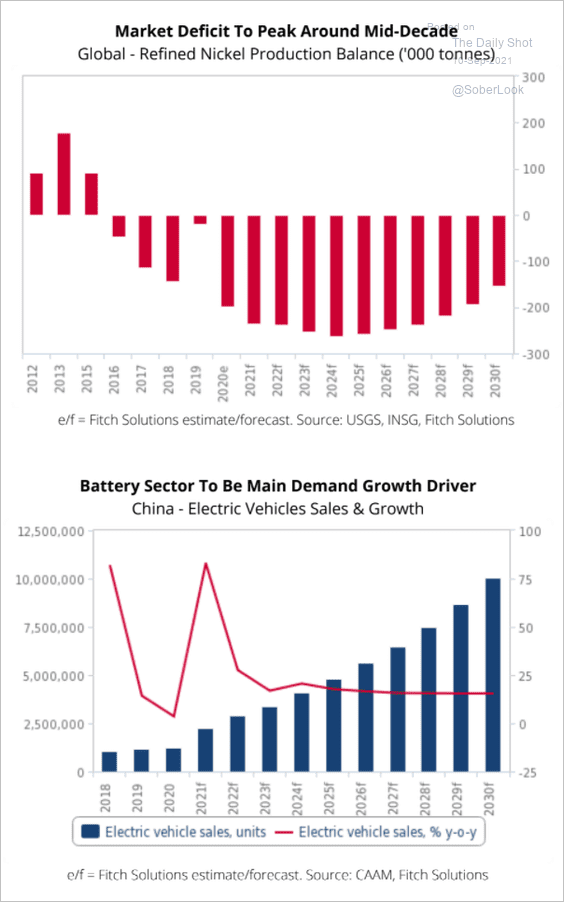 Source: Fitch Solutions Macro Research
——————–
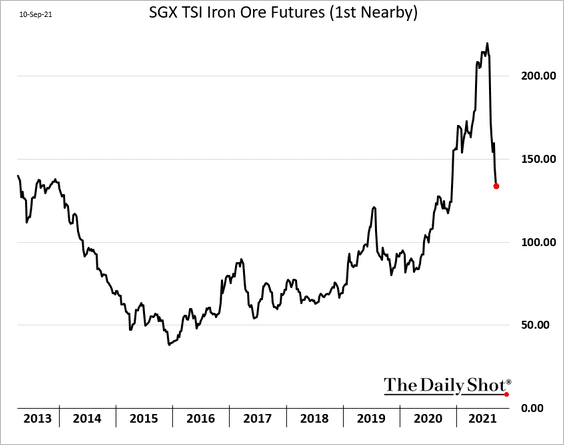
2. Iron ore continues to weaken.
 Source: Mining.com Read full article
——————–
3. Upside momentum is slowing in metal prices as China’s manufacturing PMI contracts.
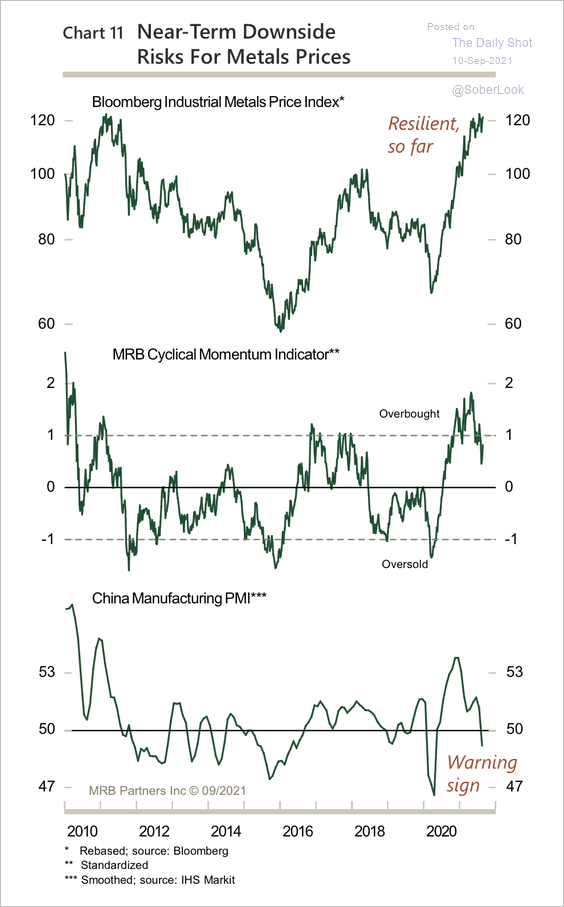 Source: MRB Partners
3. The US hog futures’ most active contract is at support (wedge pattern).
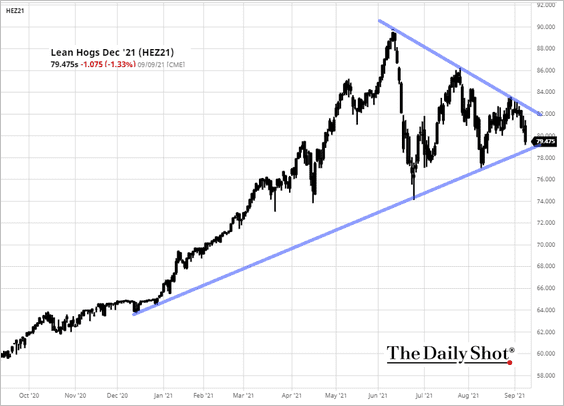 Source: barchart.com
Back to Index
Energy
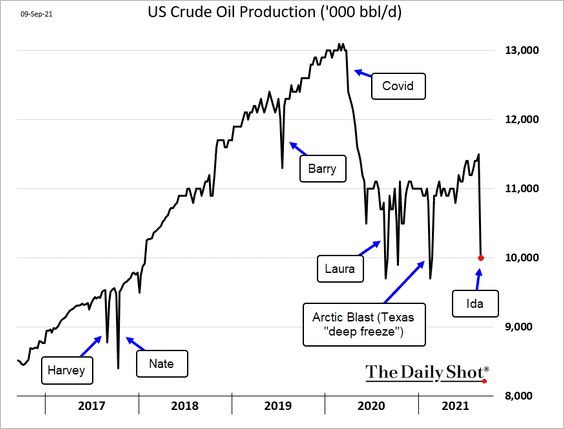
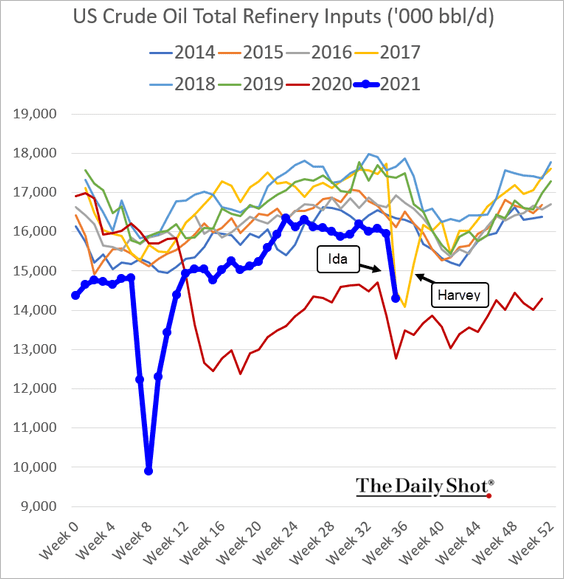
1. Hurricane Ida was quite disruptive for US energy markets.
• US crude oil production:
• Gulf of Mexico rigs:
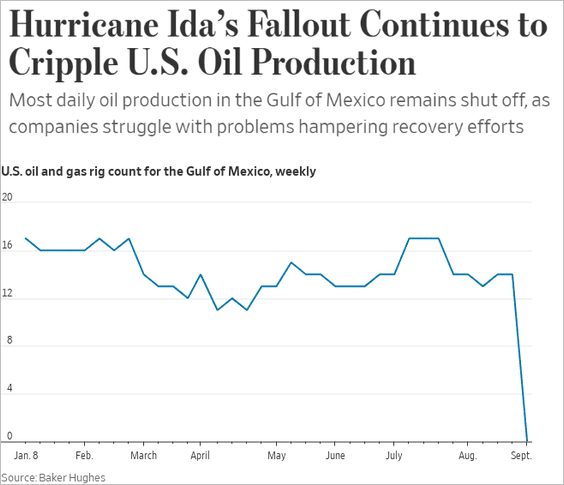 Source: @WSJ Read full article
• Refinery runs:
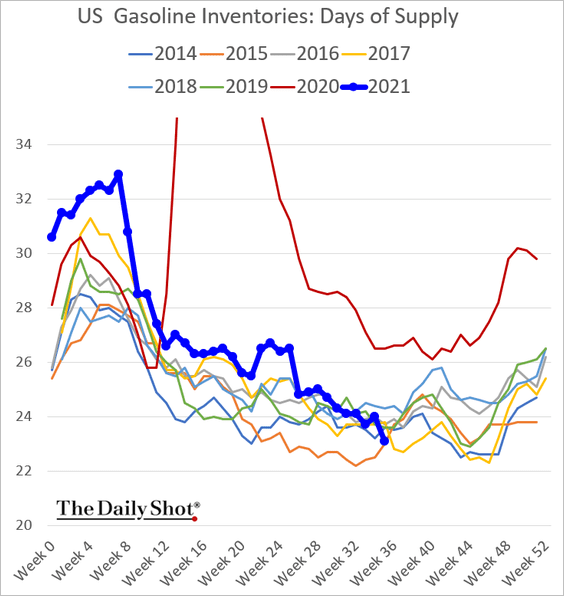
Gasoline inventories declined sharply.
——————–
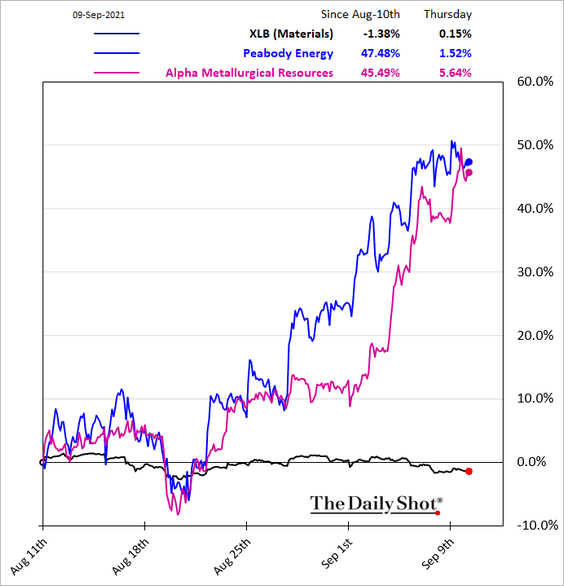
2. Metallurgical coal prices have been surging.
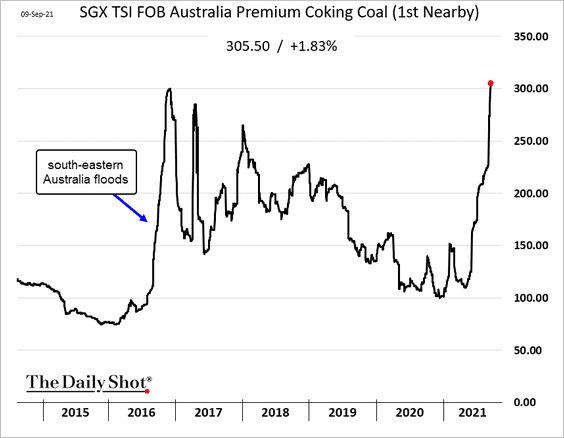
 Source: Argus Media Read full article
Coal mining companies’ shares are having a good run.
 h/t Walter
——————–
3. This chart shows US solar electricity generation.
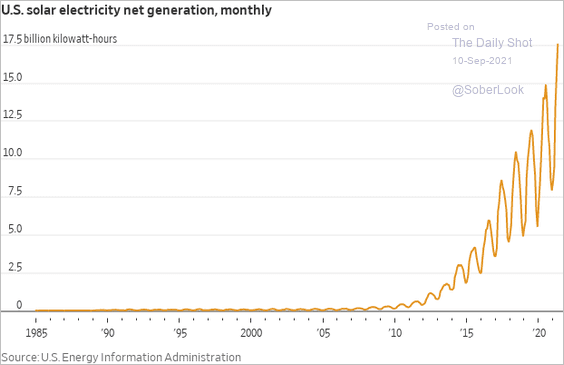 Source: @WSJ Read full article
Back to Index
Equities
1. 60% of Nasdaq stocks advanced over the past ten days, the greatest up-thrust since February.
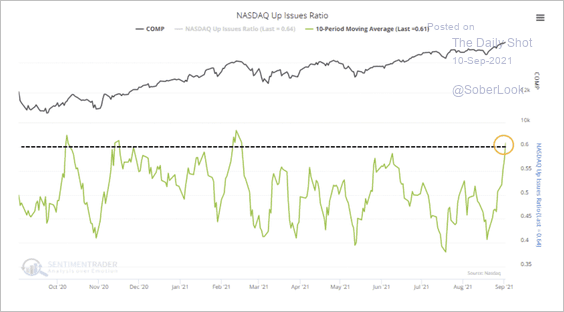 Source: SentimenTrader
The Nasdaq 100 Index is entering a seasonally weak period.
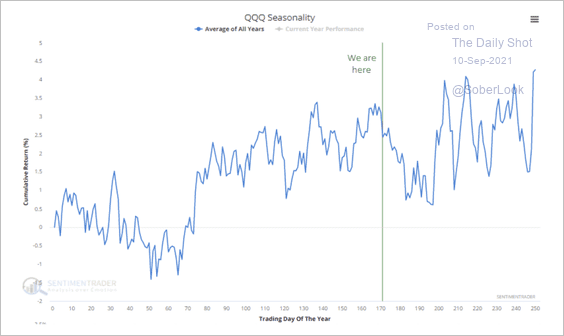 Source: SentimenTrader
——————–
2. The 2013 taper tantrum and the actual Fed tapering process did not sink stock prices.
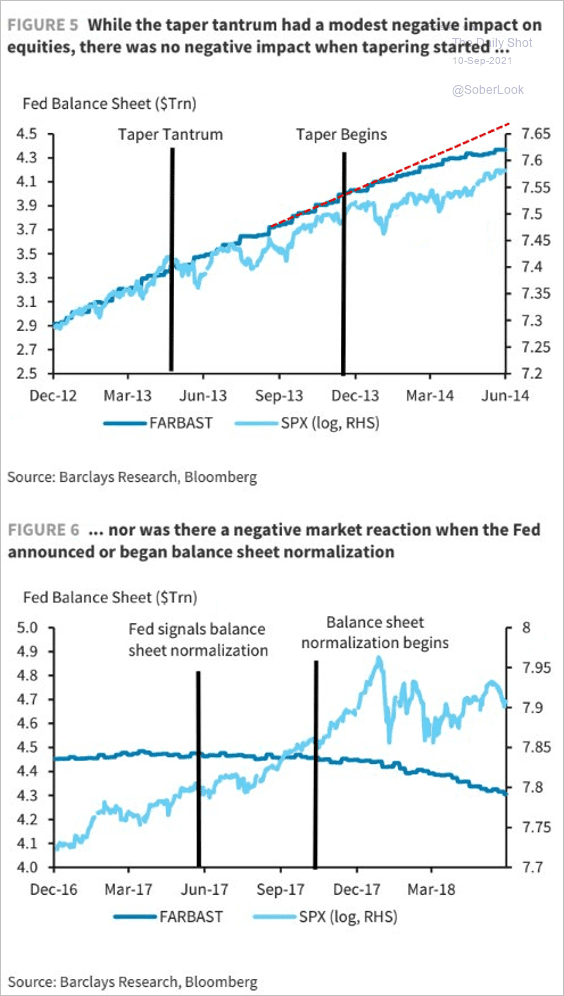 Source: Barclays Research
3. The S&P 500 Kensho Moonshots Index, made up of small/innovative tech companies, is outperforming small/mid-cap indices so far this month.
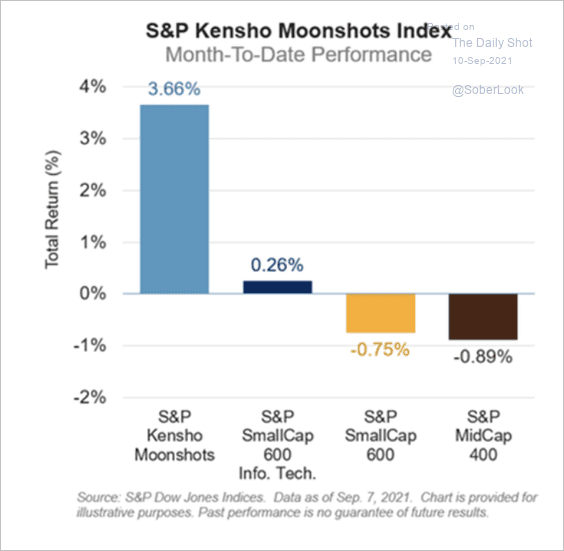 Source: S&P Global Market Intelligence
4. Growth stocks tend to underperform after a peak in the ISM manufacturing index.
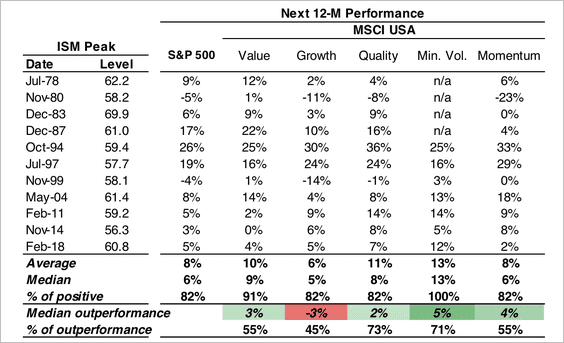 Source: Hugo Ste-Marie, Portfolio & Quantitative Strategy Global Equity Research, Scotia Capital
5. Stocks are still relatively attractive when compared to US Treasuries. Historically an equity risk premium above 300bps has meant a 14.4% next twelve-month return in the S&P 500.
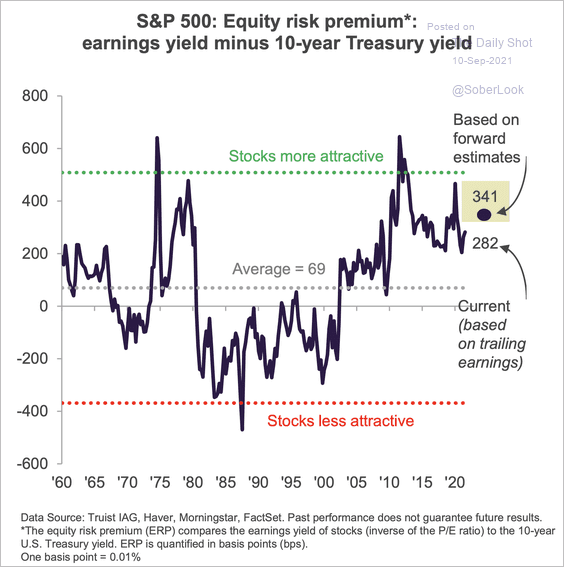 Source: Truist Advisory Services
Equity Risk Premium, when measured using real 10-year yield, is even higher, especially for global stocks. BCA suggests there is plenty of room for equities to absorb a 50bps increase in nominal yields.
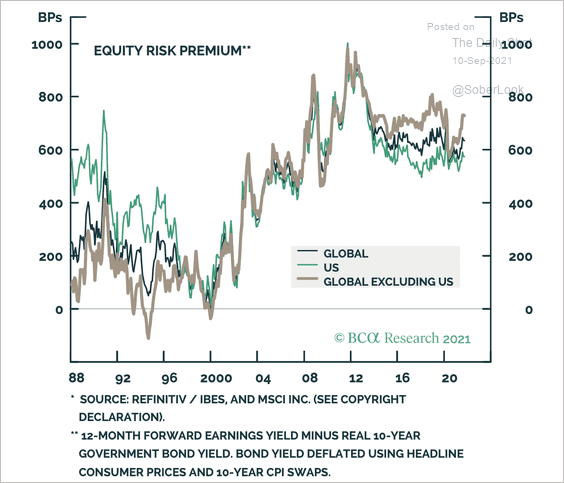 Source: BCA Research
——————–
6. Cyclically-adjusted P/E measures suggest that stocks are massively overvalued, …
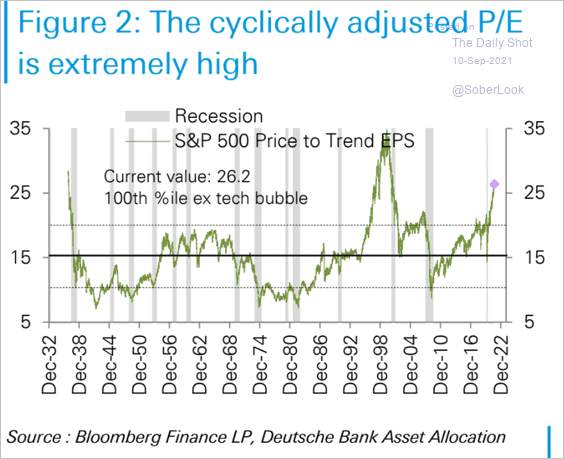 Source: Deutsche Bank Research
… pointing to poor returns over the next decade.
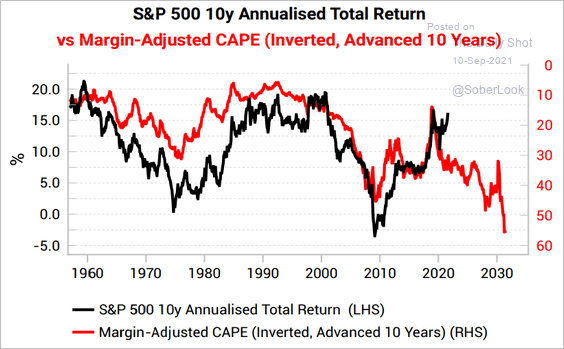 Source: Variant Perception
——————–
7. S&P 500 realized vol has been drifting lower, …
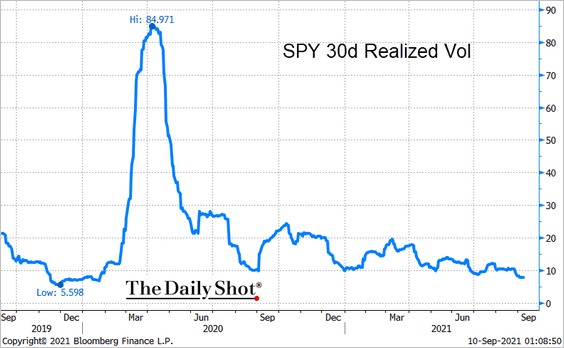
… diverging from implied volatility.
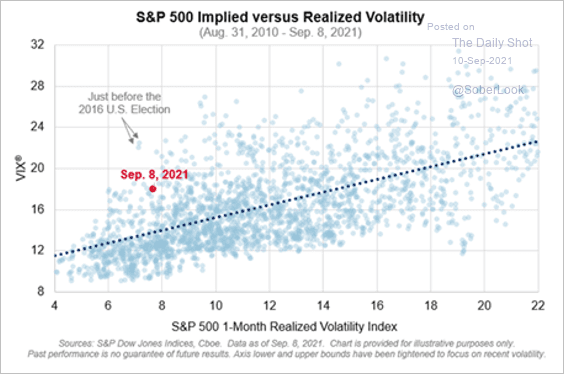 Source: S&P Global Market Intelligence
Here is the gap for tech stocks.
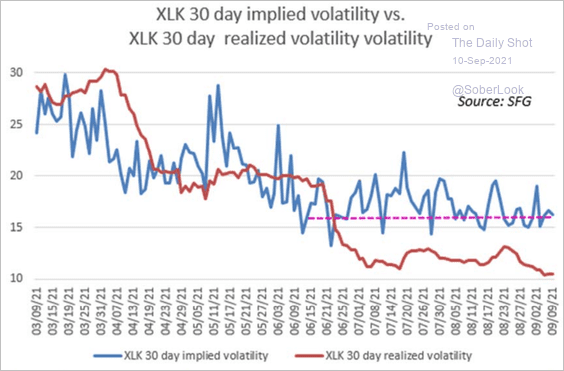 Source: Chris Murphy, Susquehanna
Back to Index
Rates
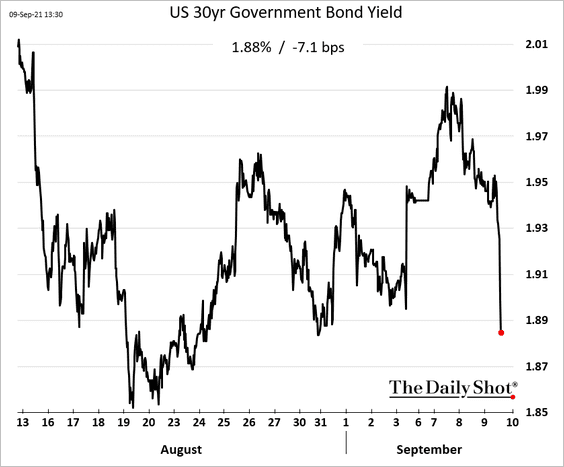
1. Demand for Treasuries has been robust.
 Source: Reuters Read full article
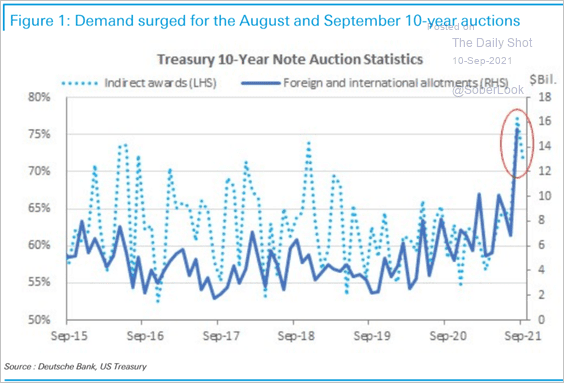 Source: Deutsche Bank Research
——————–
2. Foreign purchases of Treasuries have started to decline.
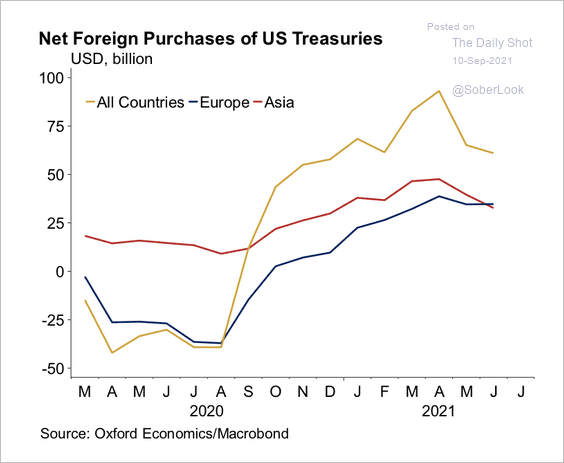 Source: Oxford Economics
3. Here is the seasonality of the JP Morgan Government Bond Index.
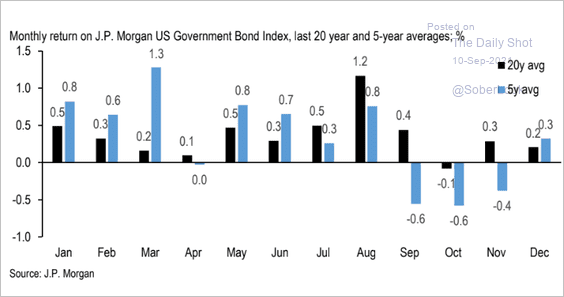 Source: JP Morgan Global Research
4. The difference in key indicators between now and the 2013 taper tantrum is remarkable.
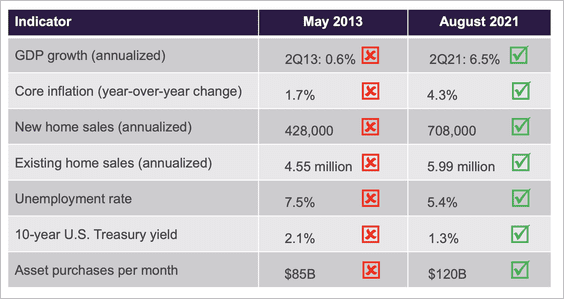 Source: Truist Advisory Services
Back to Index
Global Developments
1. The global stock/bond ratio is starting to decline along with moderating US manufacturing conditions.
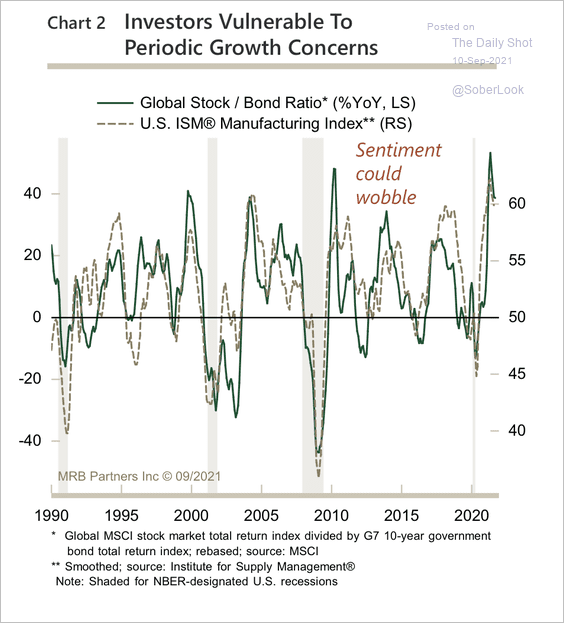 Source: MRB Partners
2. The convergence in Sharpe ratios signals incredibly low dispersion across assets, similar to past episodes before a rate hiking cycle.
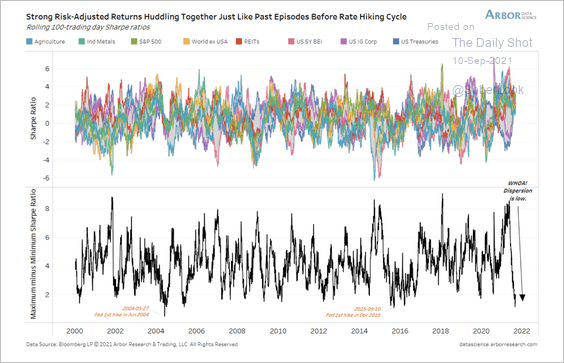 Source: Arbor Research & Trading
3. This chart shows governments’ interest expenses vs. debt levels (as % of GDP).
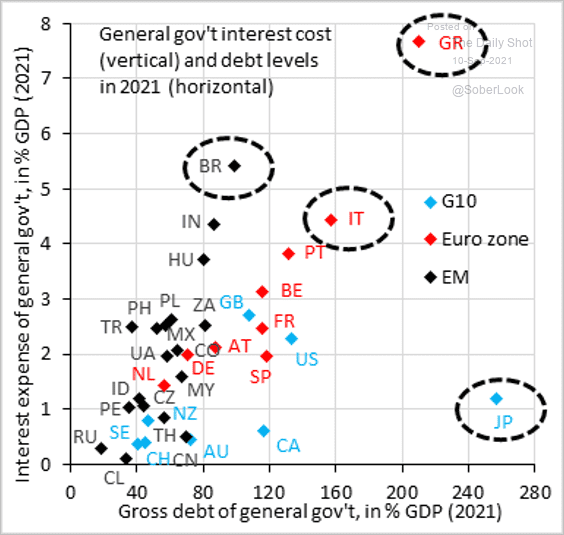 Source: @RobinBrooksIIF
——————–
Food for Thought
1. Share of US employees with a certification or license:
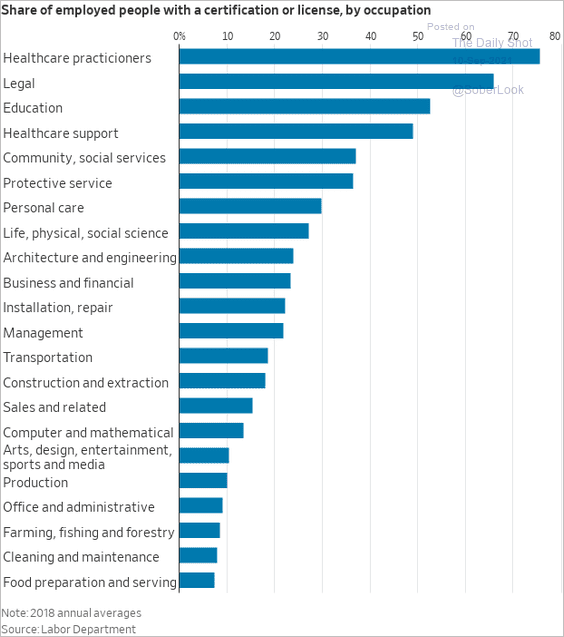 Source: @WSJ Read full article
2. Taking a pay cut to work from home:
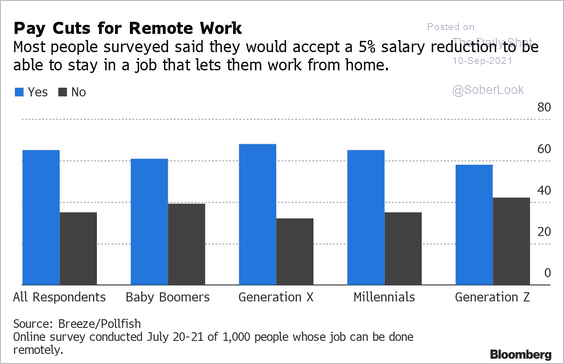 Source: @DiMartinoBooth, @wealth Read full article
• Will be looking for another job if forced to return to the office:
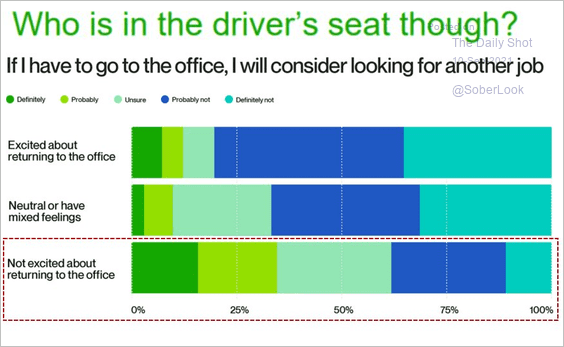 Source: @GregDaco, @Upwork, @ModeledBehavior
——————–
3. US consumer tech spending this year:
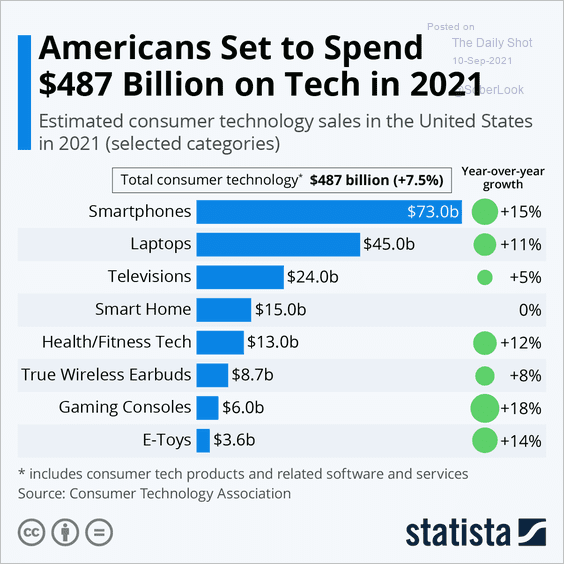 Source: Statista
4. States with the top tech salaries in 2021:
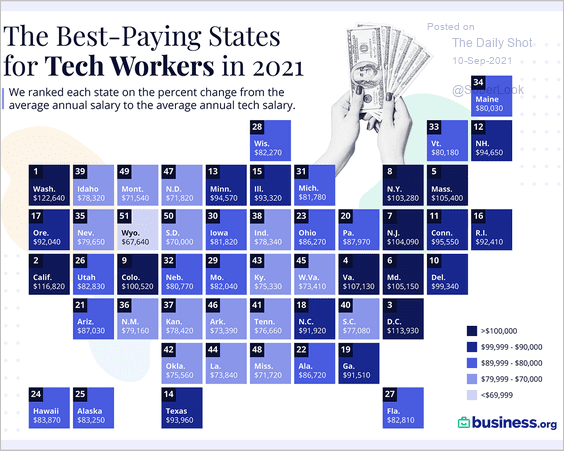 Source: Visual Capitalist Read full article
5. Facebook and Twitter active users:
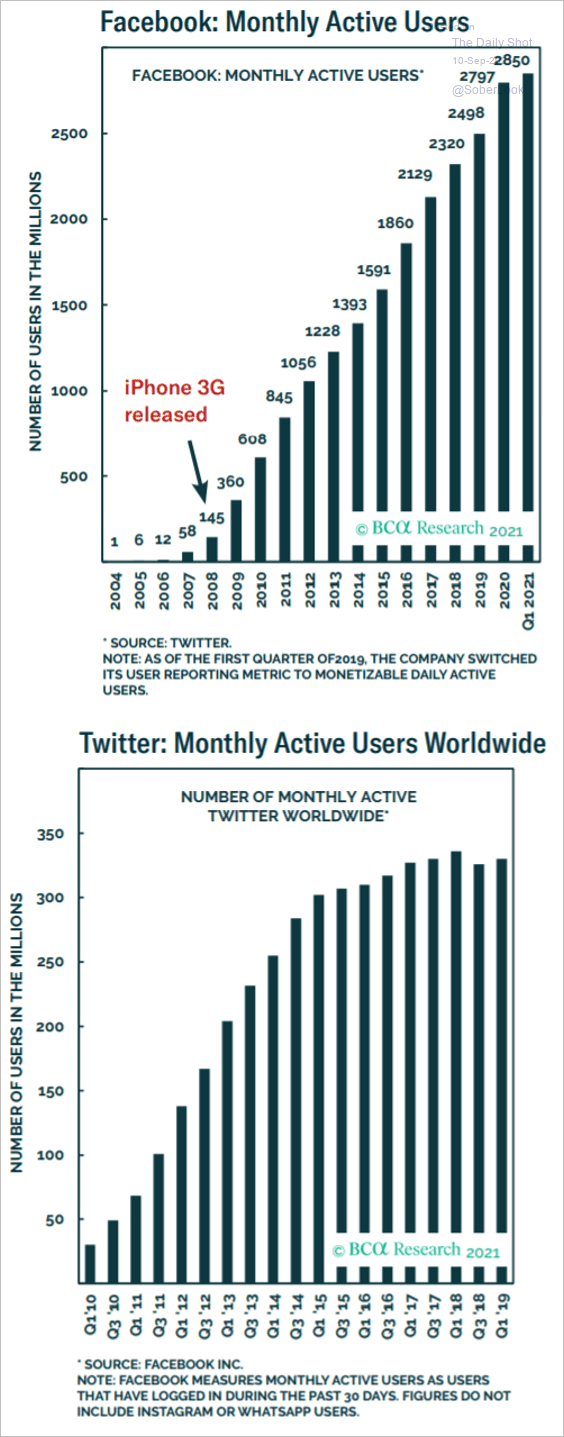 Source: BCA Research
6. EV sales (2 charts):
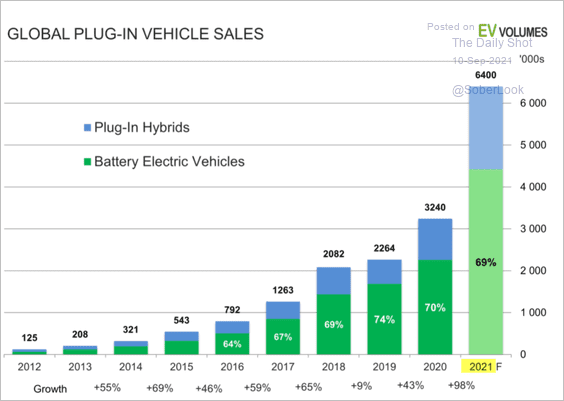 Source: EVvolumes.com
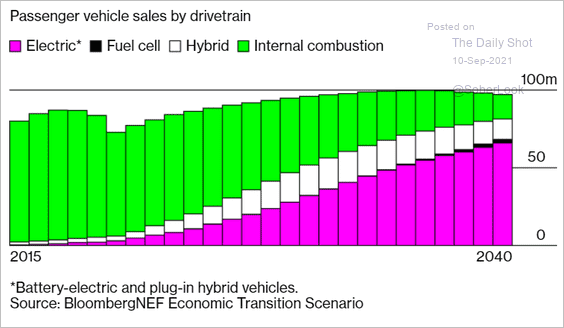 Source: @markets Read full article
——————–
7. EV charging stations:
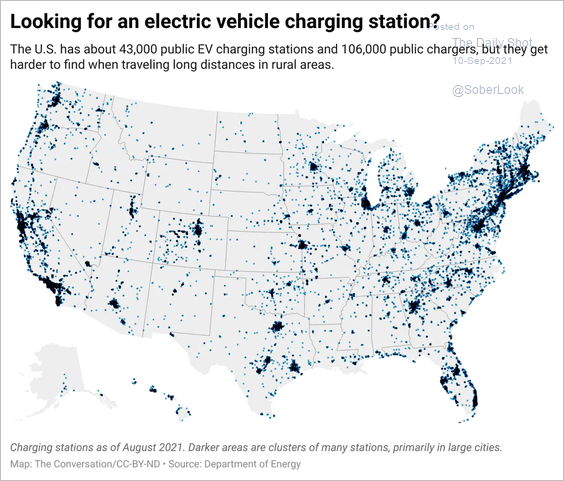 Source: Renewable Energy World Read full article
8. E-books vs. printed books:
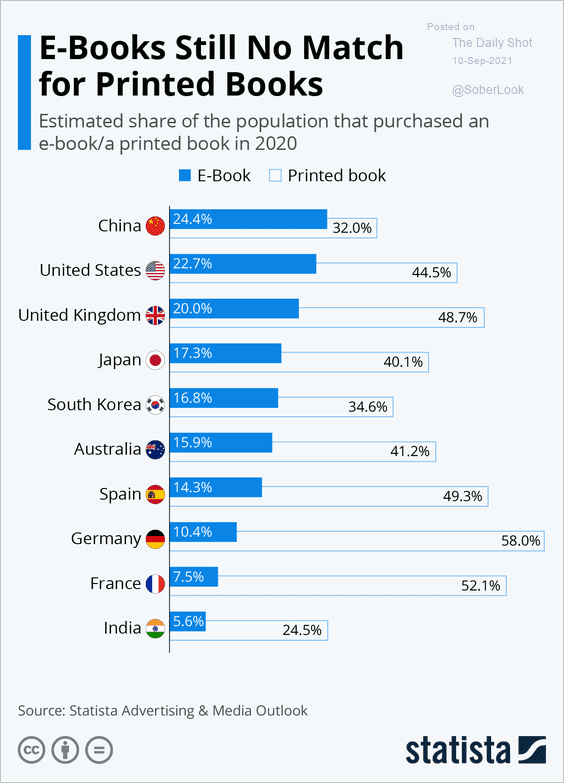 Source: Statista
9. Views on the US withdrawal from Afghanistan:
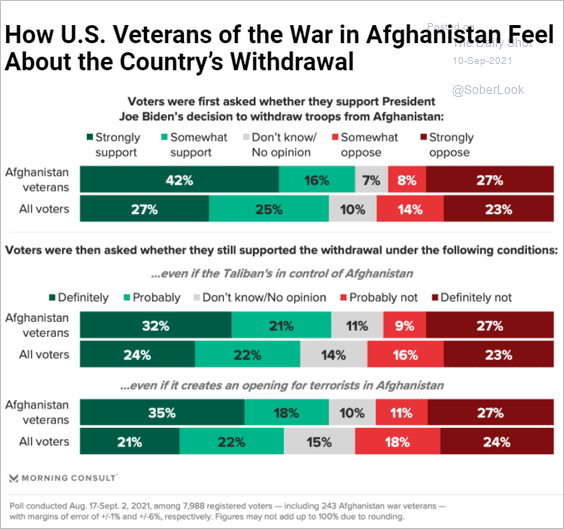 Source: Morning Consult Read full article
10. Used Rolex watch price index (in the Japanese luxury watch market):
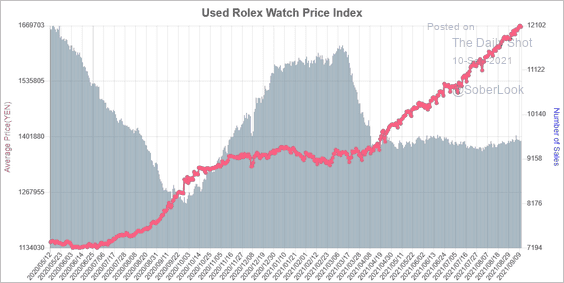 Source: Luxury Watch Auction & Consignment Timepeaks; h/t Garth
——————–
Have a great weekend!
Back to Index