
The Daily Shot: 15-Sep-21
• The United States
• The United Kingdom
• The Eurozone
• Asia – Pacific
• China
• Emerging Markets
• Cryptocurrency
• Commodities
• Energy
• Equities
• Credit
• Rates
• Food for Thought
The United States
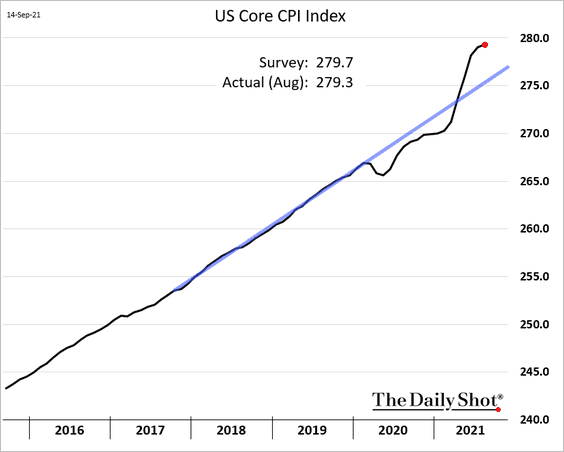
1. The CPI report surprised to the downside, with inflation easing in pandemic-sensitive sectors.
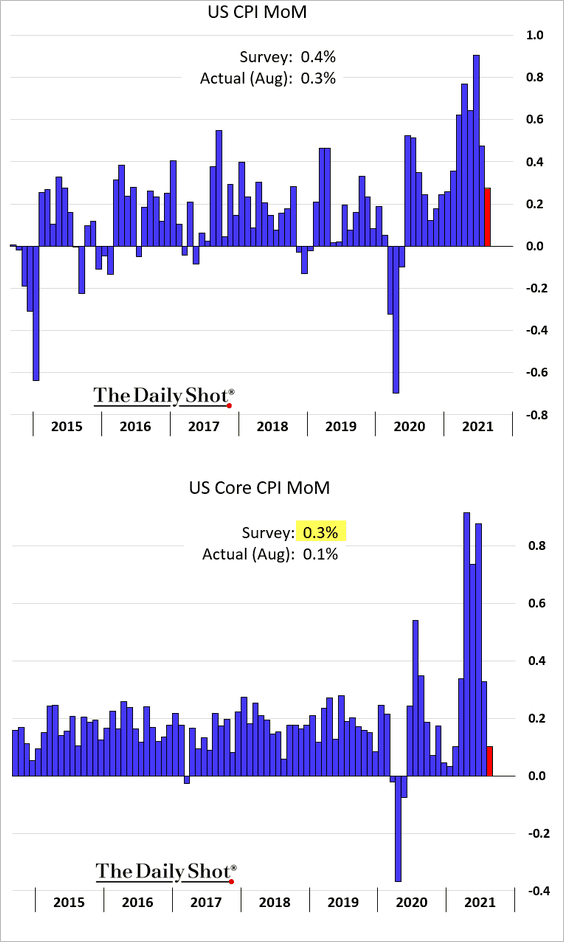
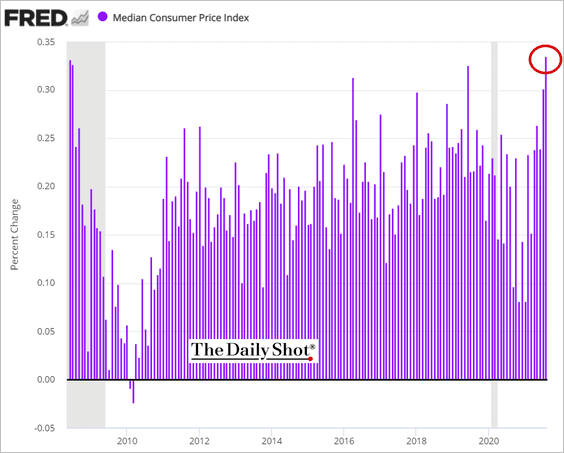
• Nonetheless, price pressures persisted in August as the median CPI gain was the highest in years.
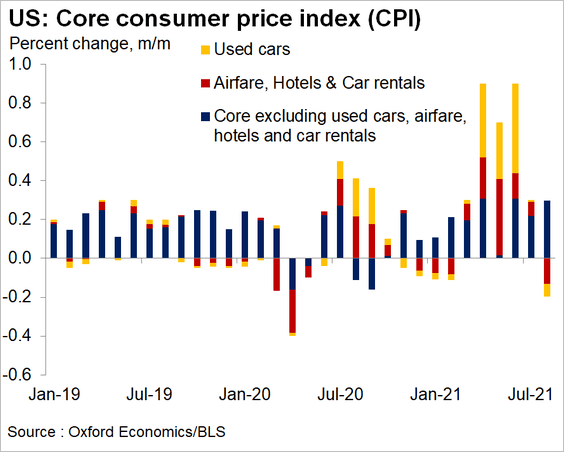
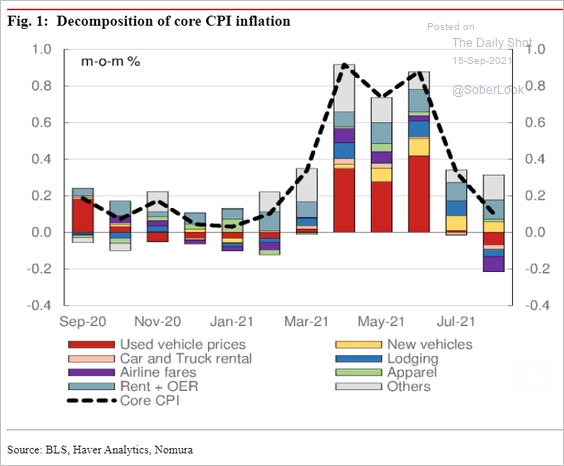
• Outside of the COVID-sensitive sectors, the core CPI gain was strong (2 charts).
 Source: Nomura Securities
• Price levels are well above the pre-COVID trend.
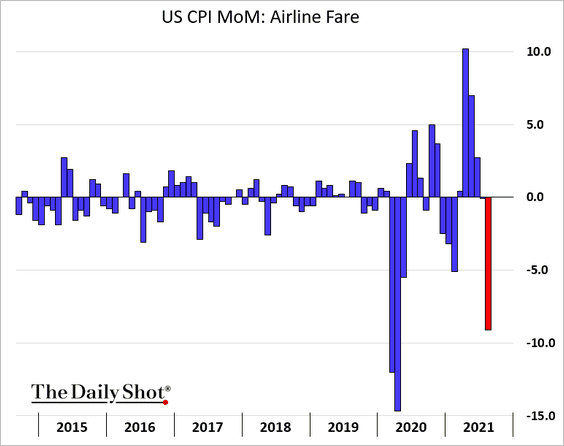
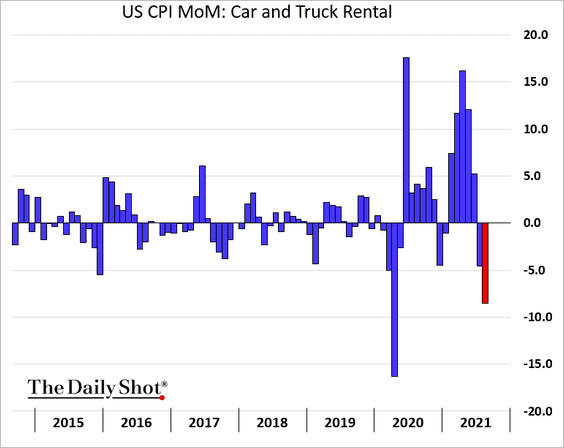
• The Delta variant put downward pressure on some of the “reopening” sectors.
– Airline fares:
– Car rentals:
– Hotels:
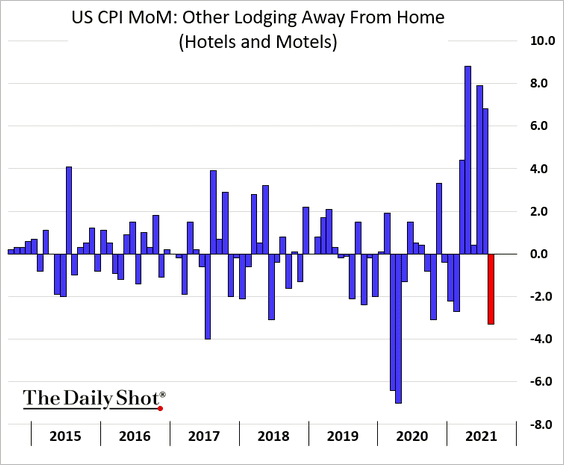
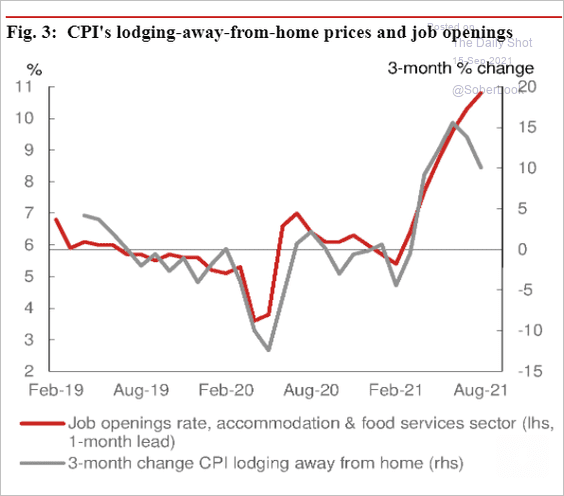
By the way, there is a disconnect between job openings in the accommodation/food-service sectors and the “lodging away from home” CPI. Something has to give.
 Source: Nomura Securities
We will have more on the inflation report tomorrow.
——————–
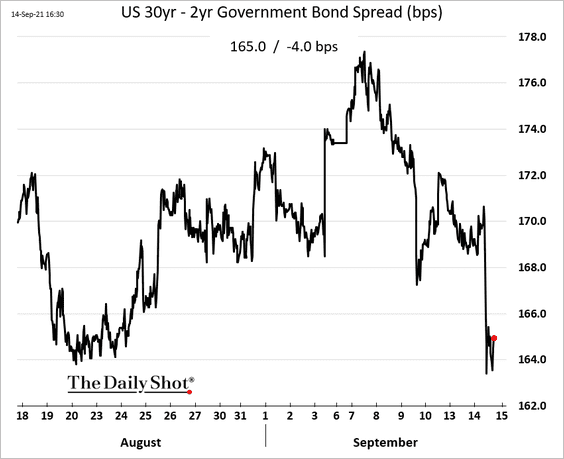
2. Treasury yields retreated in response to the CPI miss.
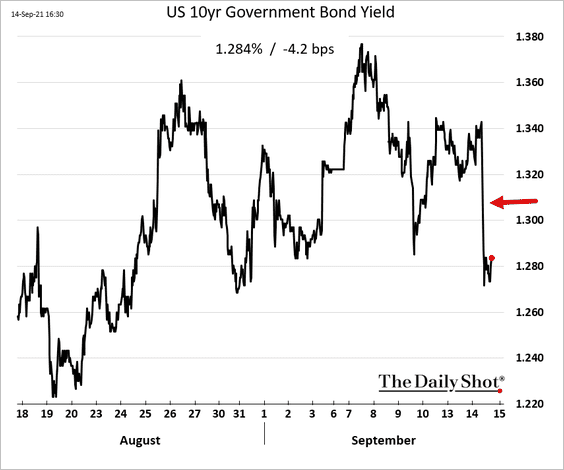
The curve flattened.
——————–
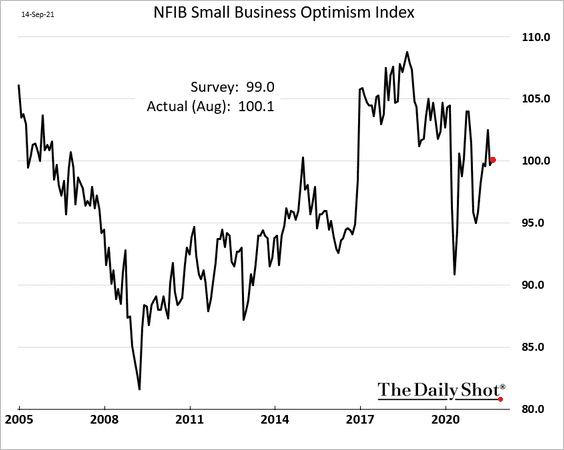
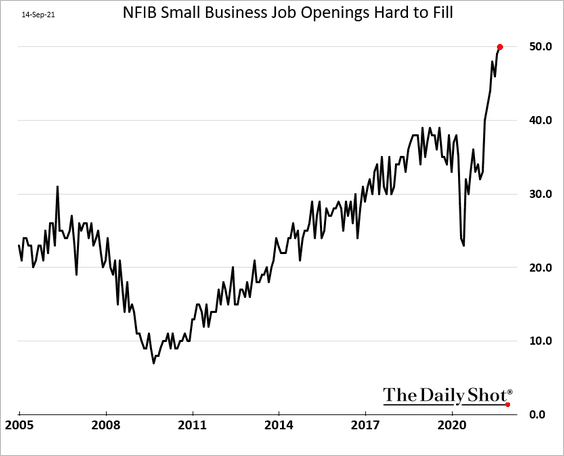
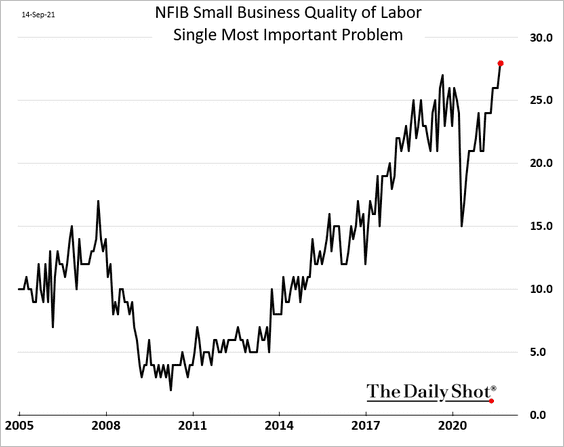
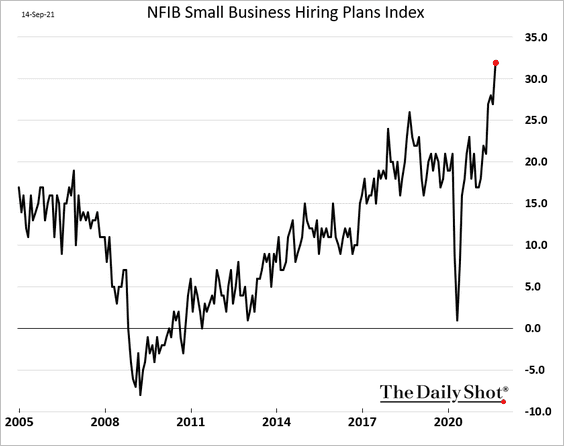
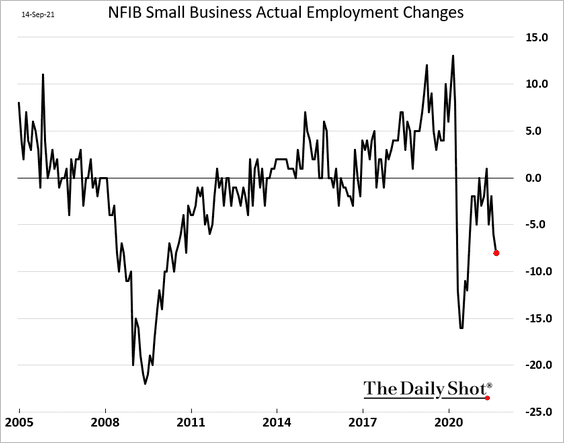
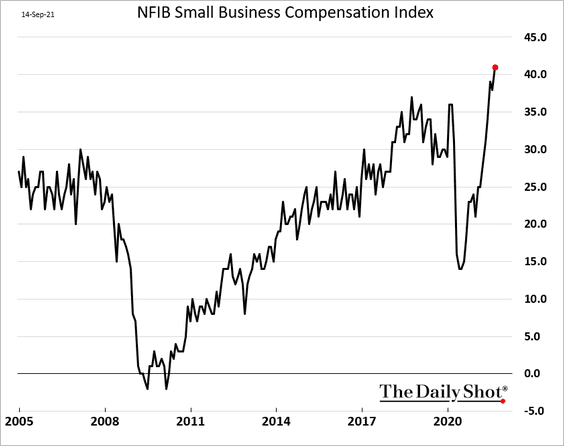
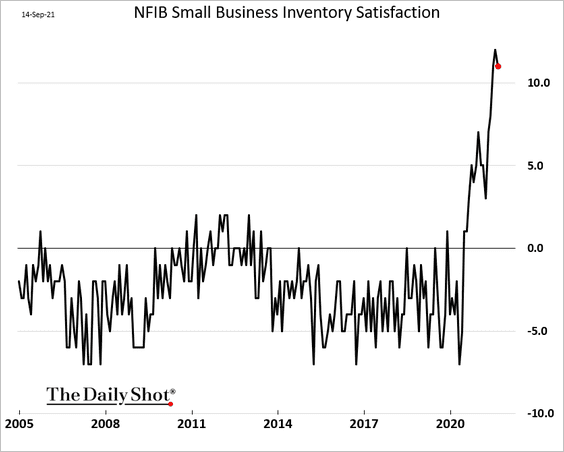
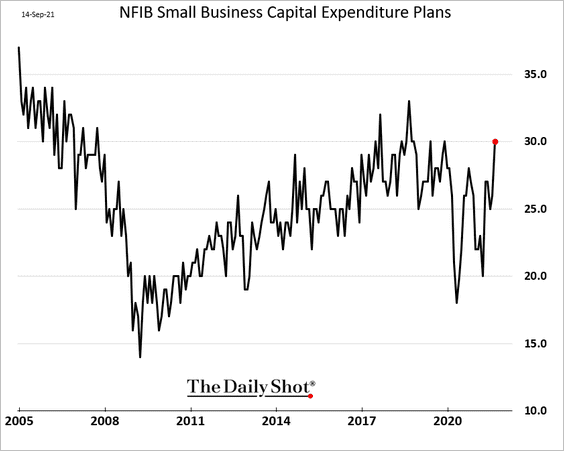
3. The NFIB small business index ticked higher last month.
• As discussed previously, labor shortages have been acute.
– Job openings hard to fill:
– Quality of labor is the most important problem:
– Hiring plans:
– Actual hires:
– Compensation:
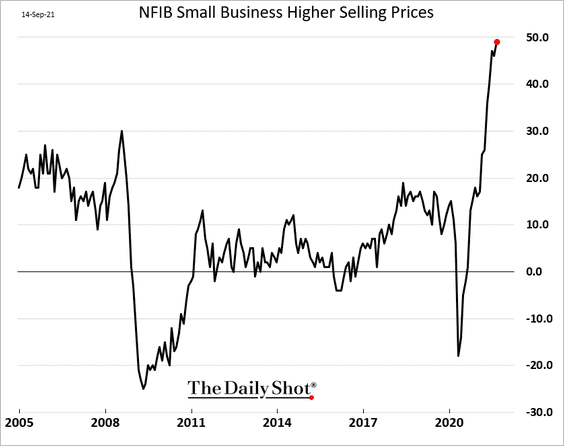
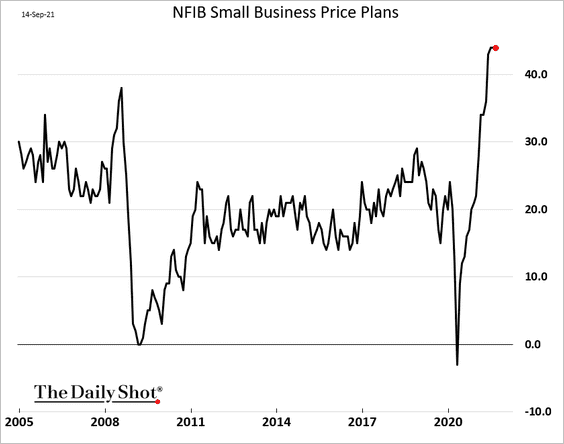
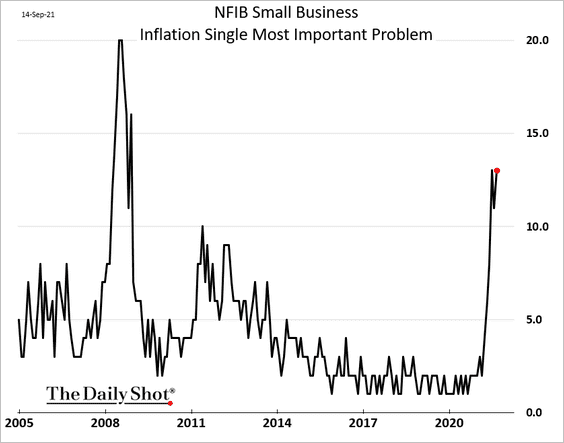
• Inflationary trends persist.
– Higher selling prices:
– Price plans:
– Inflation is the most important problem:
• Inventories remain tight.
• CapEx expectations improved.
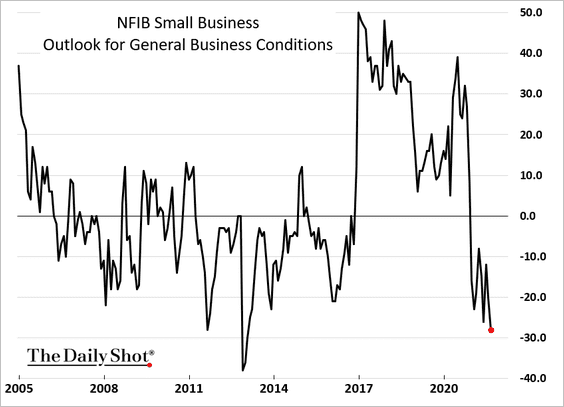
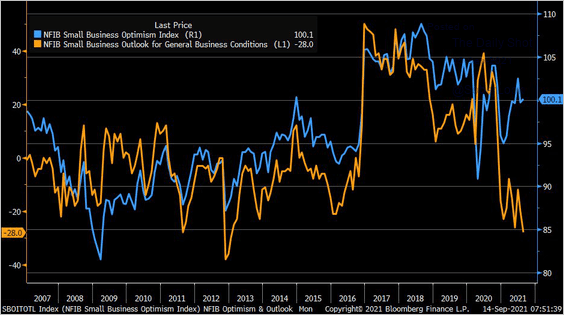
• Business outlook deteriorated further, diverging from the overall sentiment indicator.
 Source: @LizAnnSonders, @NFIB
——————–
4. Based on earnings calls data, companies are increasingly focused on labor market dynamics.
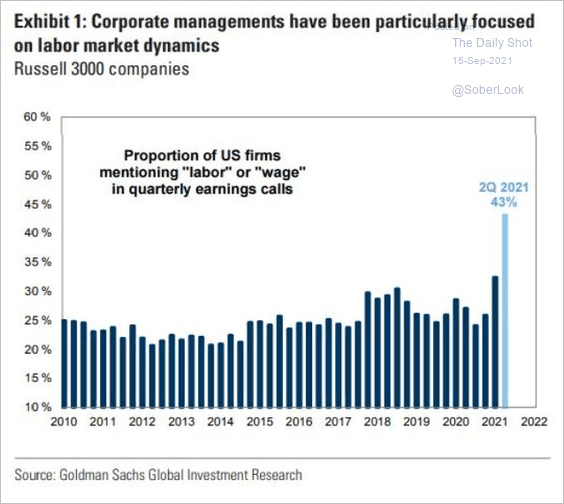 Source: Goldman Sachs; @TheStalwart
5. US imports remain robust.
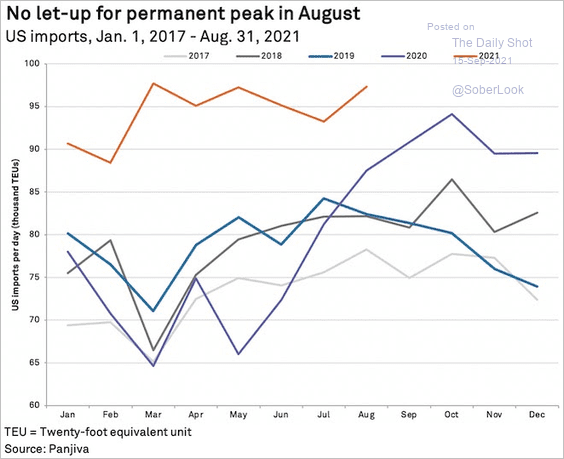 Source: S&P Global Market Intelligence
Back to Index
The United Kingdom
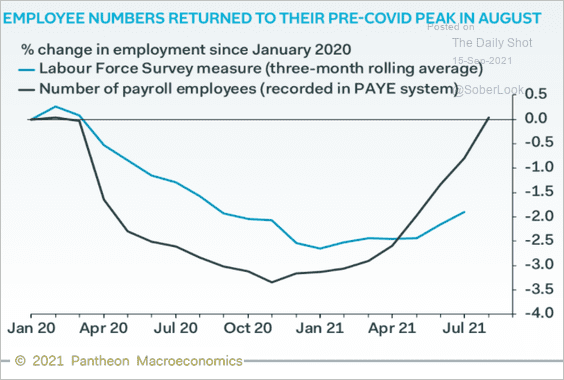
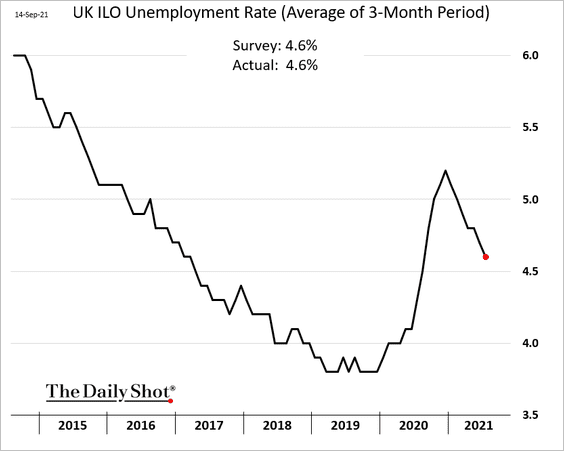
1. The employment situation continues to improve.
• The three-month average figures don’t provide a complete picture.
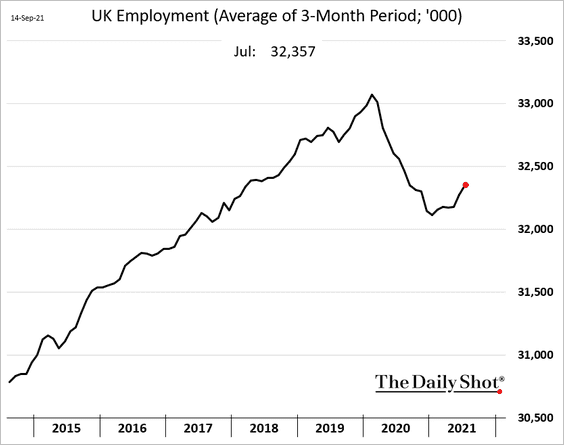
But the PAYE payroll data shows that the jobs market has fully recovered.
 Source: Pantheon Macroeconomics
• The unemployment rate is trending lower.
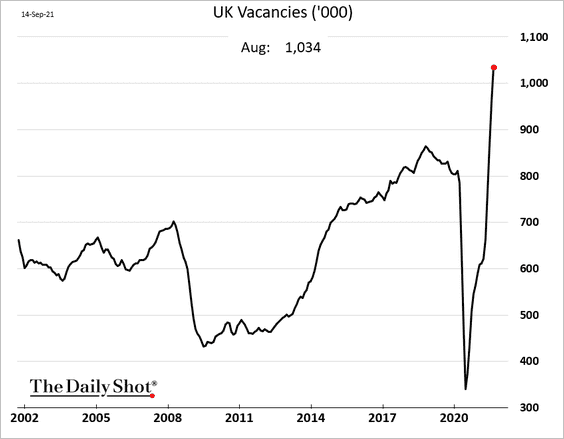
• Job vacancies are surging.
——————–
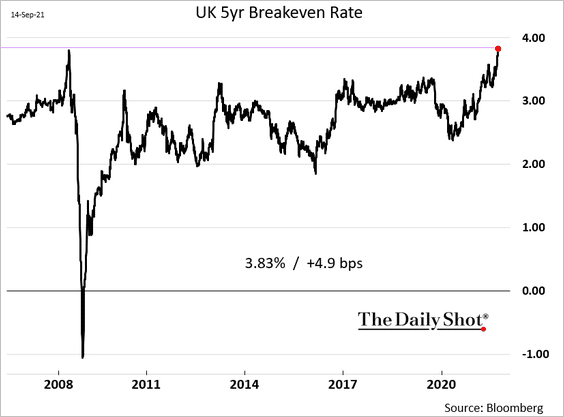
2. The 5yr breakeven rate (inflation expectations) hit the highest level in years.
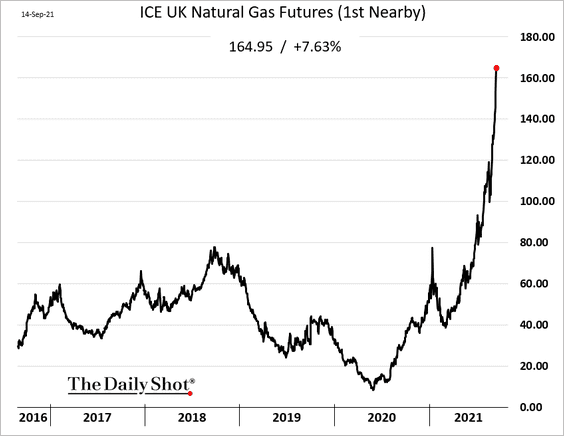
3. The natural gas situation has been unprecedented. LNG shipments are headed to Asia, leaving Europe’s energy markets severely undersupplied. The UK population will be paying much more for electricity this winter.
4. This chart shows the Bank of England’s balance sheet as a proportion of the nation’s financial sector (going back to 1696).
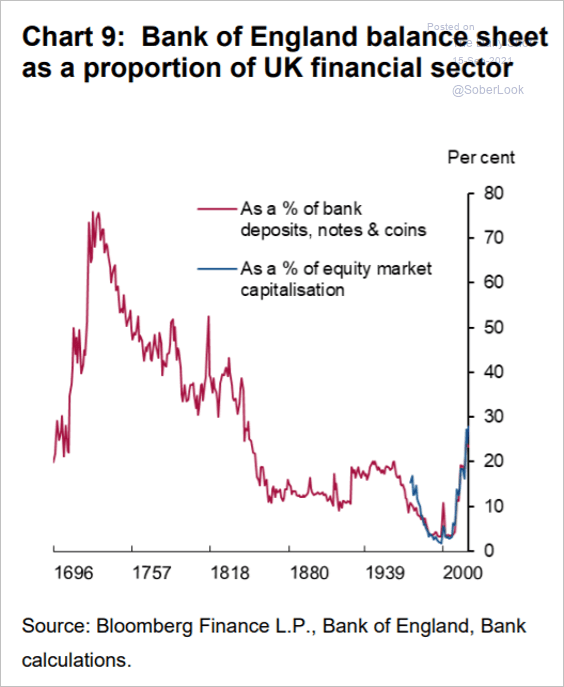 Source: BoE Read full article
Back to Index
The Eurozone
1. Italy could face a 40% rise in power prices.
 Source: @markets Read full article
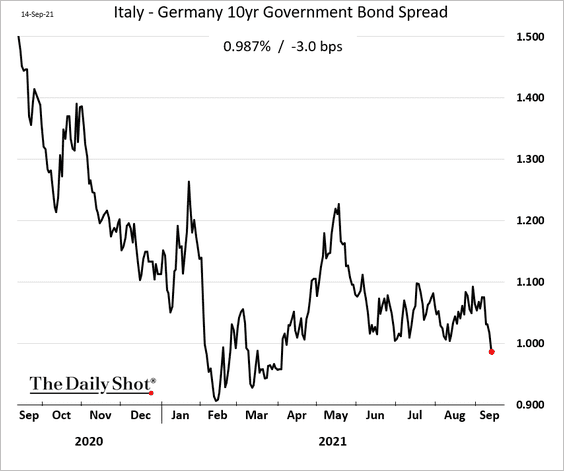
2. The Italy-Germany 10yr spread is back below 1%.
3. Here is the composition of the ECB’s (Eurosystem) balance sheet (LTRO and securities).
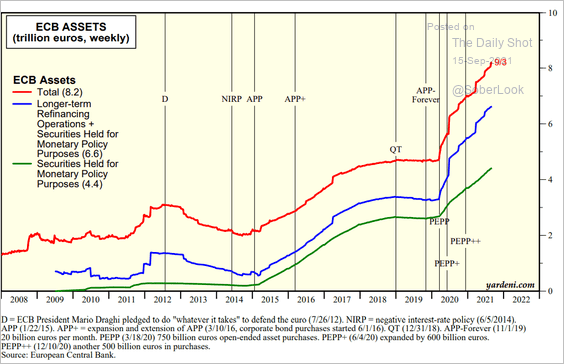 Source: Yardeni Research
How does the ECB’s balance sheet compare to other central banks?
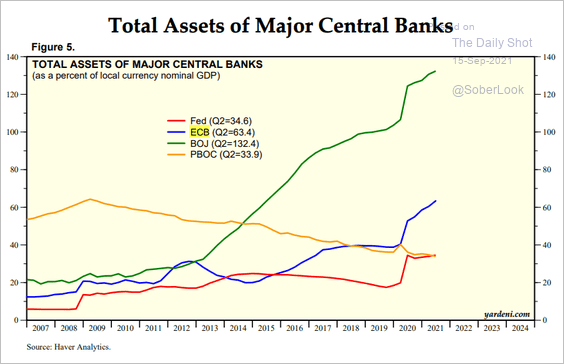 Source: Yardeni Research
——————–
4. This chart shows the ECB’s projection for the euro-area GDP growth.
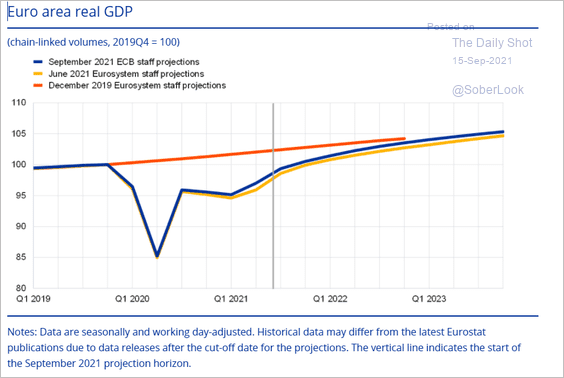 Source: ECB Read full article
5. Eurozone inflation, when broken into constituents, is largely due to higher commodity costs and supply chain issues.
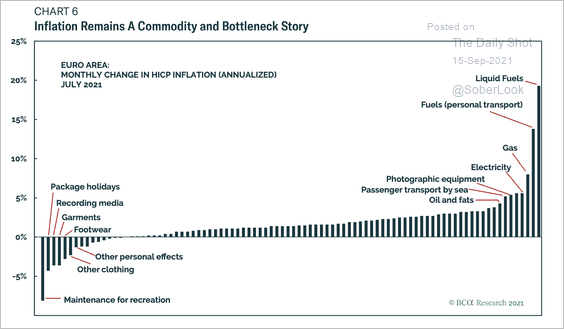 Source: BCA Research
The market is pricing in a 30% probability of Eurozone headline CPI above 2% over the next five years.
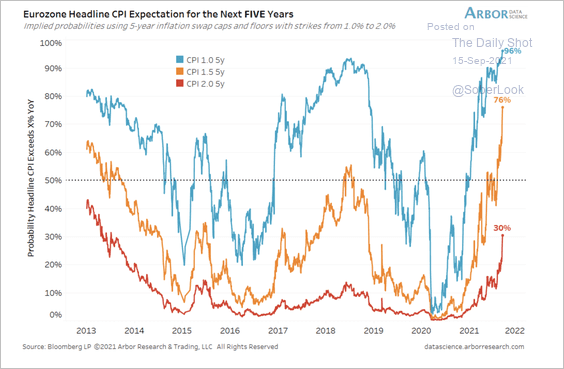 Source: Arbor Research & Trading
——————–
6. Next, we have some demographic data.
• Birth rates:
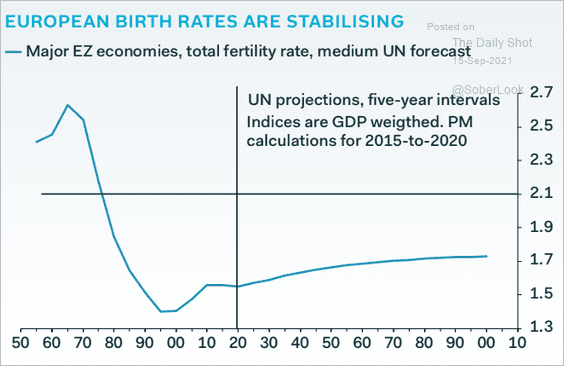 Source: Pantheon Macroeconomics
• Projected declines in the labor force:
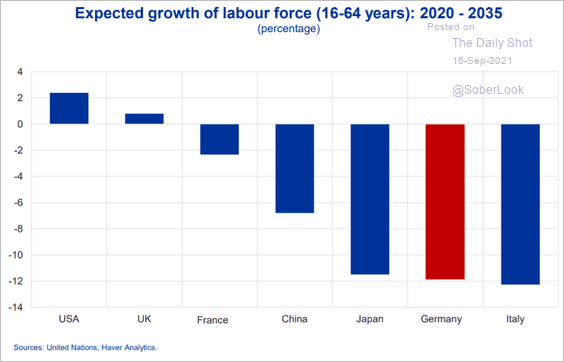 Source: ECB Read full article
Back to Index
Asia – Pacific
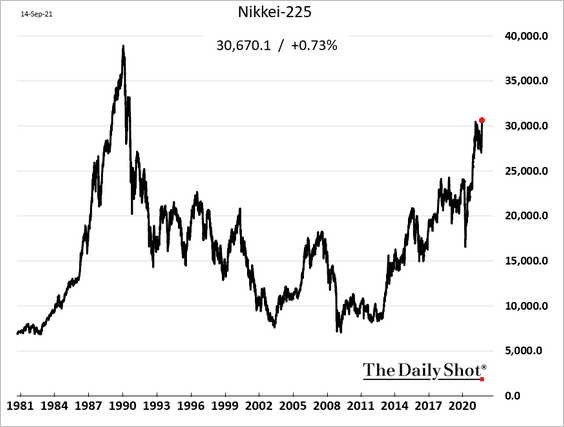
1. The Nikkei 225 hit the highest level in 31 years.
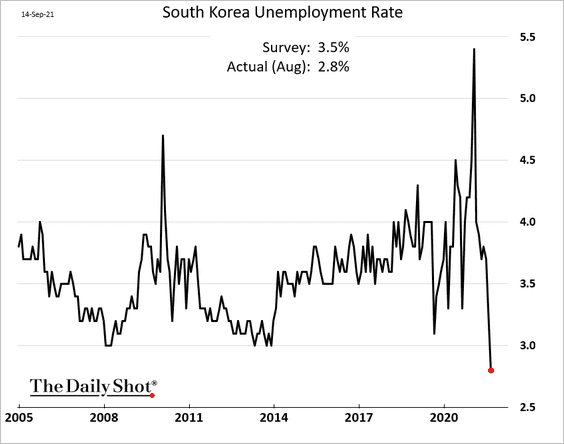
2. South Korea’s unemployment rate hit a record low. The upbeat report masks some persistent pandemic-related issues.
The KOSPI index held support at the 200-day moving average.
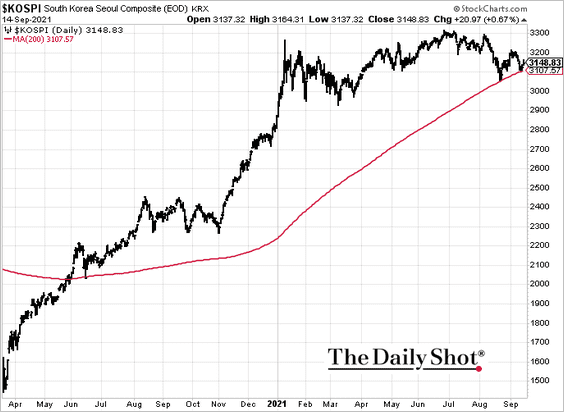 h/t @JaehyunEom
——————–
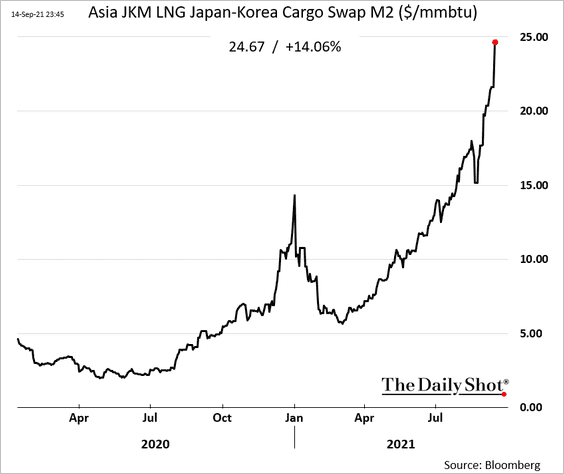
3. Asian LNG prices are surging.
Back to Index
China
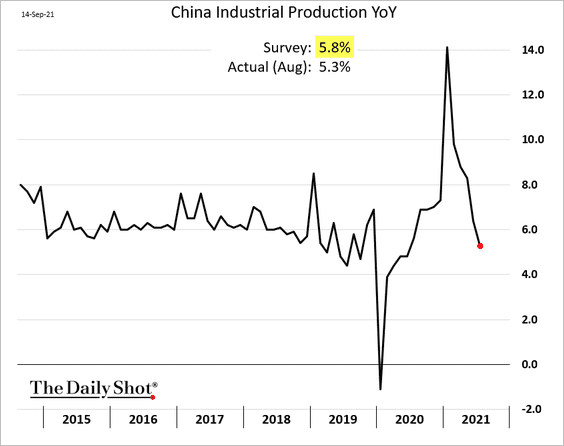
1. Key indicators missed Street forecasts again, pointing to slowing economic activity.
• Industrial production:
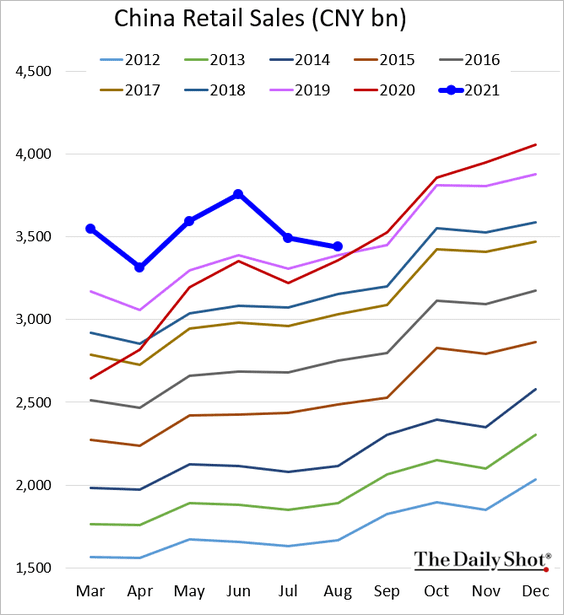
• Retail sales (well below expectations):
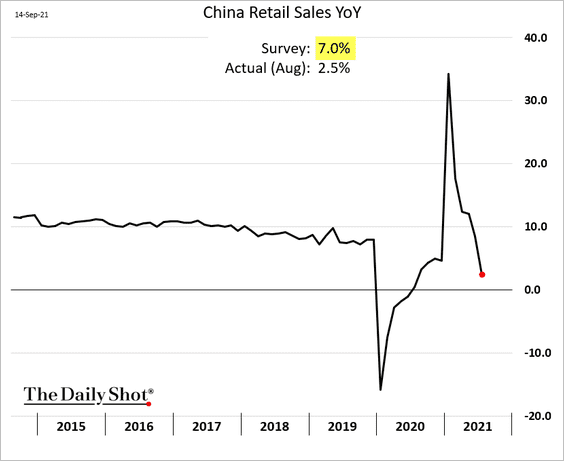
Retail sales typically climb this time of the year, but that wasn’t the case last month.
——————–
2. Home price appreciation is slowing, …
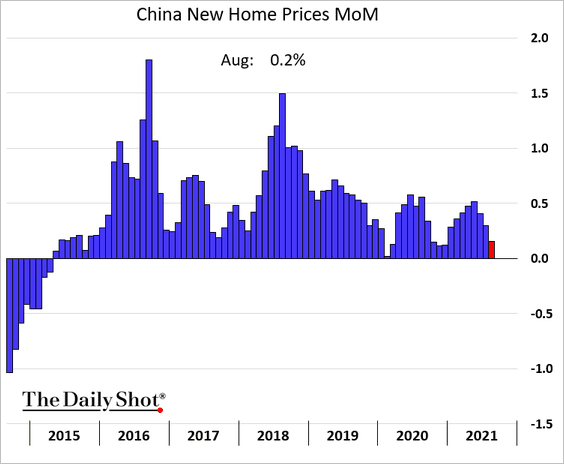
… as home sales deteriorate.
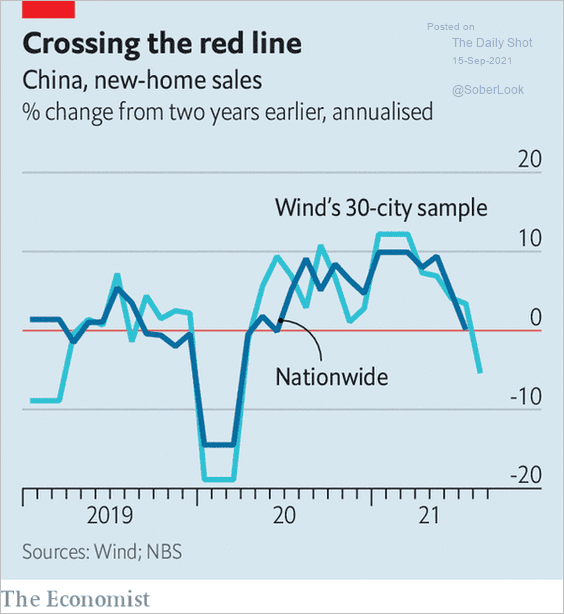 Source: The Economist Read full article
——————–
3. New steel orders have fallen to the lowest level since 2015 as credit growth declines.
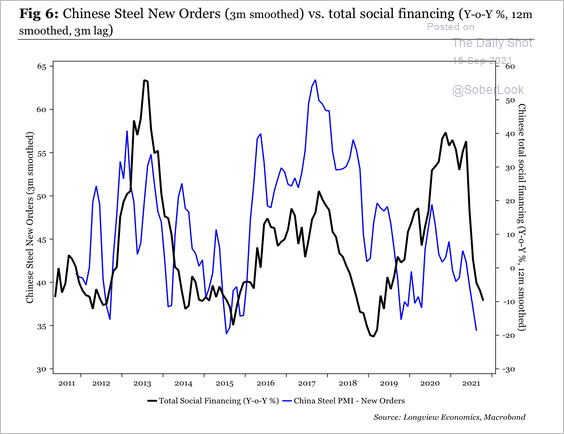 Source: Longview Economics
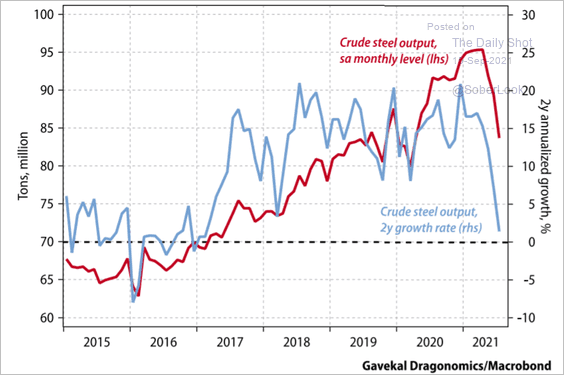 Source: Gavekal Research
——————–
4. China’s A-shares (domestic) held up well, even as H-shares tumbled.
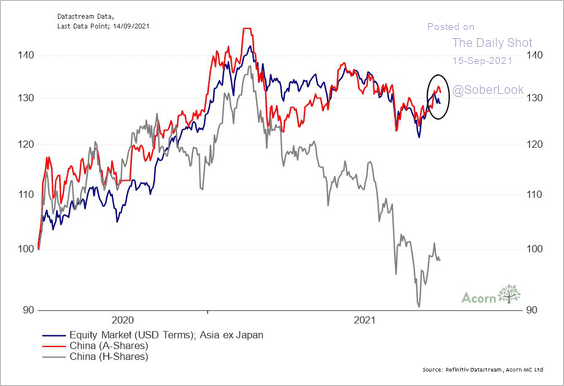 Source: @RichardDias_CFA
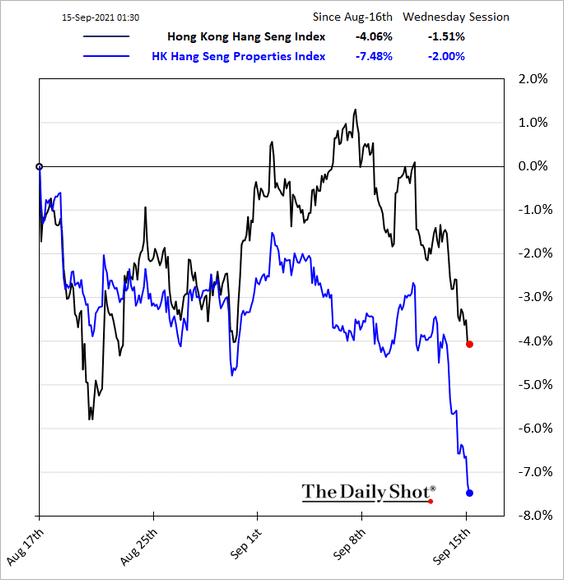
5. Property developers’ shares remain under pressure.
6. Who are the holders of China’s bonds?
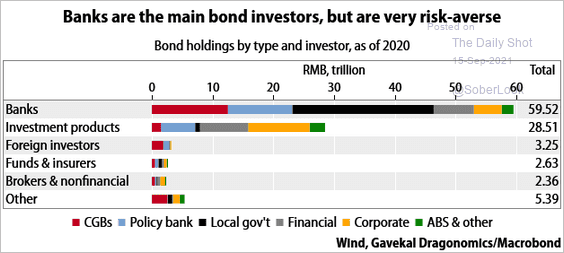 Source: Gavekal Research
Back to Index
Emerging Markets
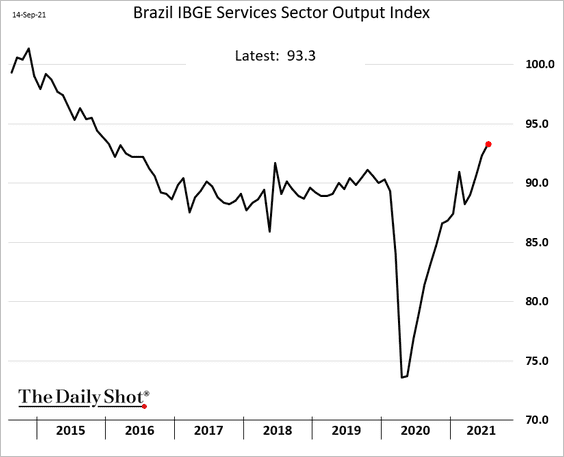
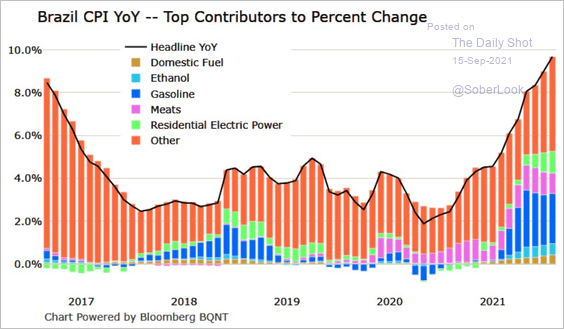
1. Brazil’s service-sector output continues to recover.
This chart shows the energy sector’s contribution to Brazil’s CPI.
 Source: @M_McDonough
——————–
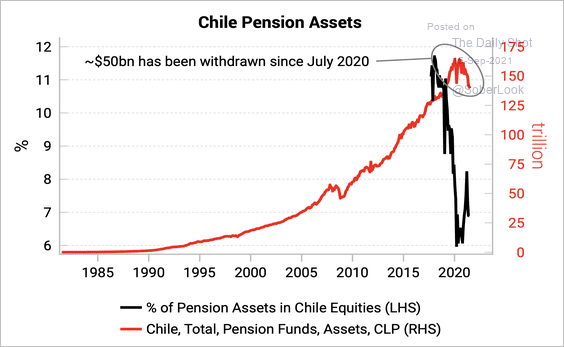
2. Chile is allowing three withdrawals up to 10% each from state-run private pension plans. So far, $50bn has been taken out. A fourth withdrawal is possible, but the flow impact on equities, given they are only 7% of assets, should be limited.
 Source: Variant Perception
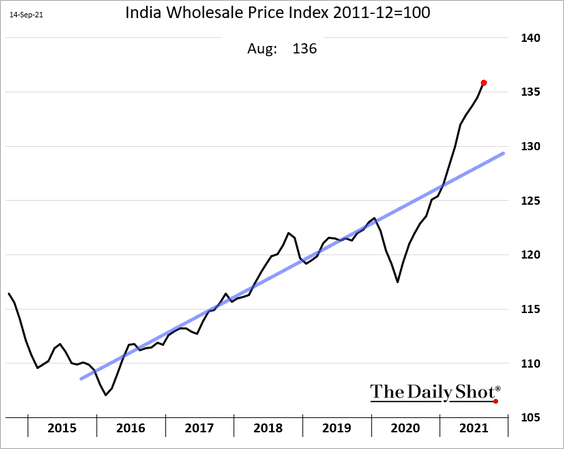
3. India’s wholesale prices are rising rapidly.
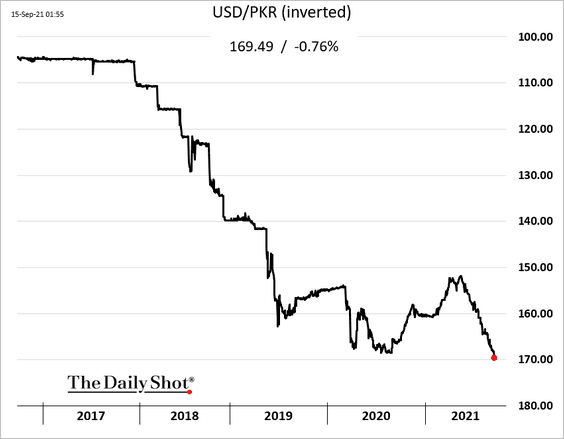
4. The Pakistani rupee hit a record low vs. USD.
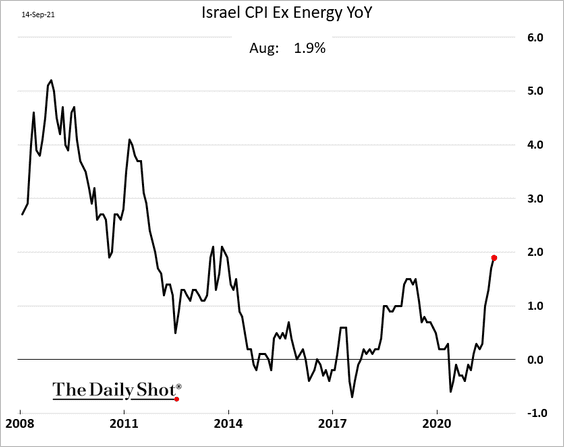
5. Israel’s inflation is finally rebounding (after years of disinflation).
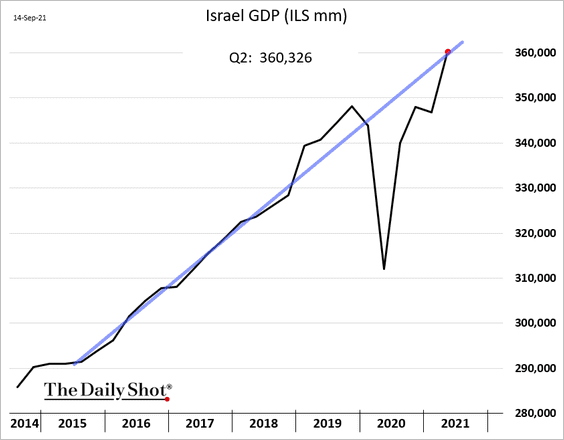
The GDP is back on the pre-COVID trend.
——————–
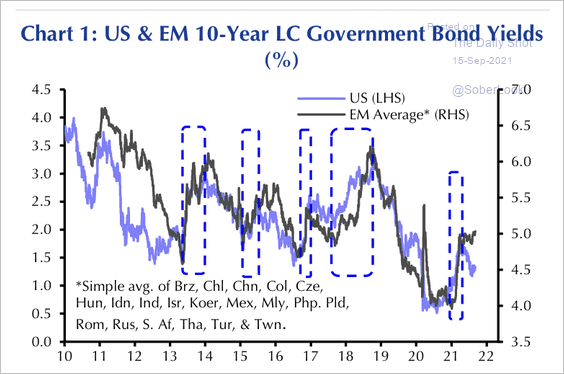
6. Capital Economics expects EM government bond yields to rise more than in the US, especially in countries with weak balance sheets.
 Source: Capital Economics
Back to Index
Cryptocurrency
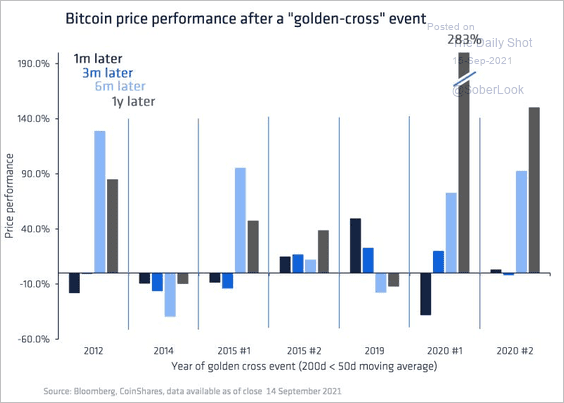
1. Historically, bitcoin’s “golden cross” has not been a consistent predictor of positive returns.
 Source: CoinShares
2. Bitcoin spot trading volume declined relative to futures volume this year.
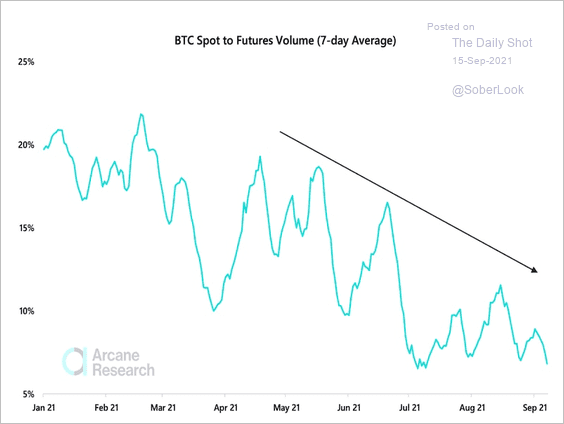 Source: Arcane Research Read full article
3. The chart below shows the 12-week improving cyclicality of altcoins relative to bitcoin (click here for animation).
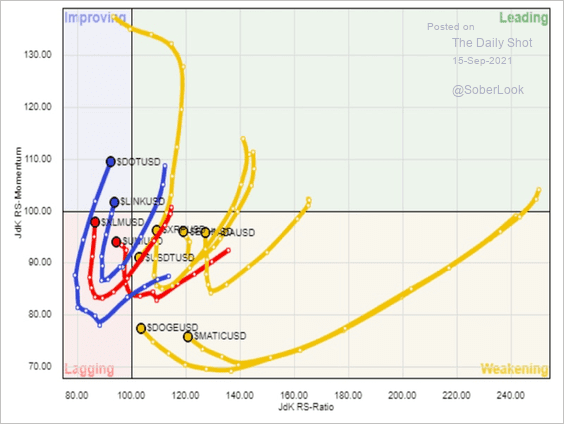 Source: Fairlead Strategies
4. Bitcoin’s Fear & Greed Index moved sharply into “fear” territory after the crypto sell-off last week.
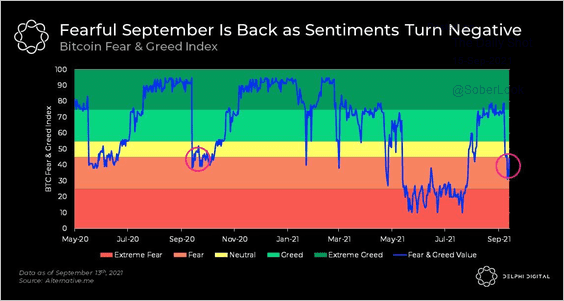 Source: @Delphi_Digital
5. This chart shows the P2P bitcoin trading activity by region.
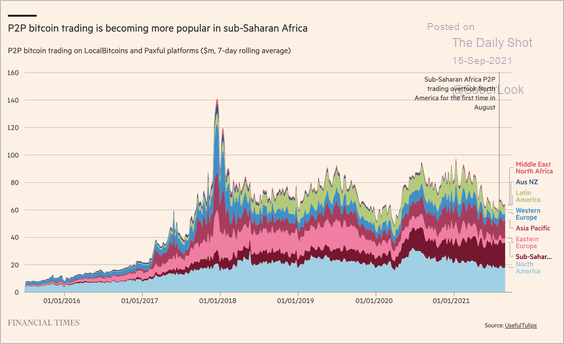 Source: @financialtimes Read full article
Back to Index
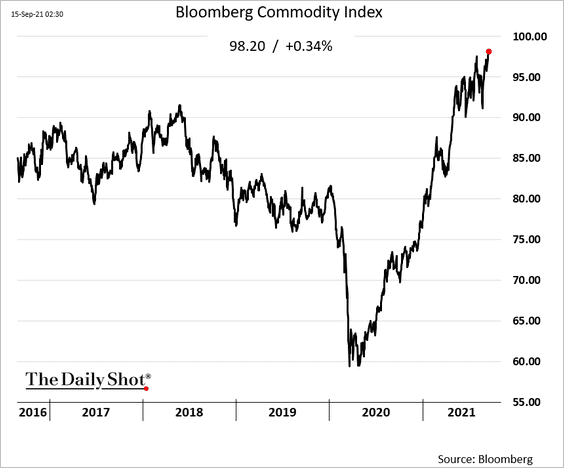
Commodities
1. Bloomberg’s broad commodity index is hitting multi-year highs, boosted by gains in energy.
2. This has not been a unified commodities rally (2 charts).
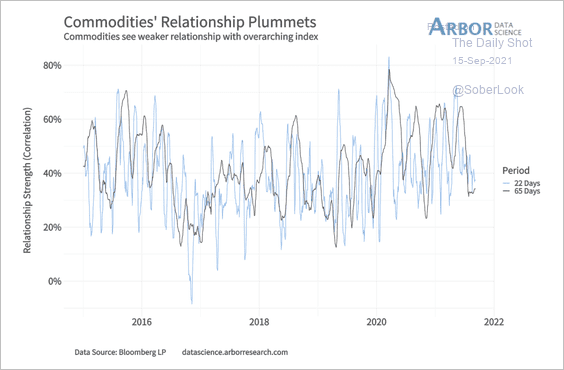 Source: Arbor Research & Trading
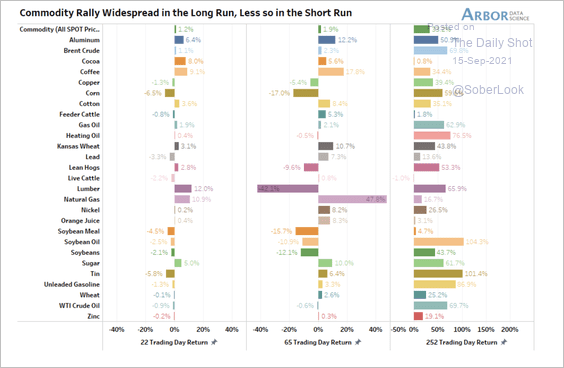 Source: Arbor Research & Trading
3. Iron ore remains under pressure, …
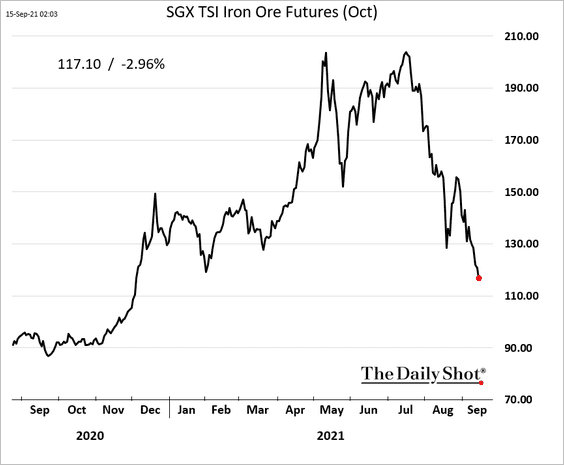
… diverging from other industrial commodities, such as copper.
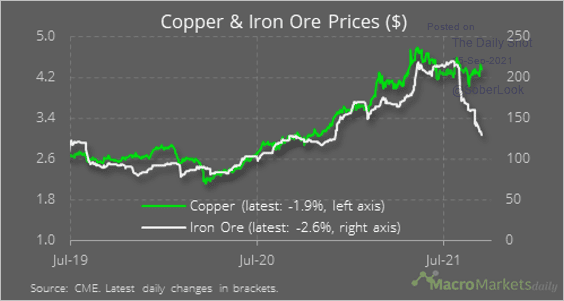 Source: @macro_daily
——————–
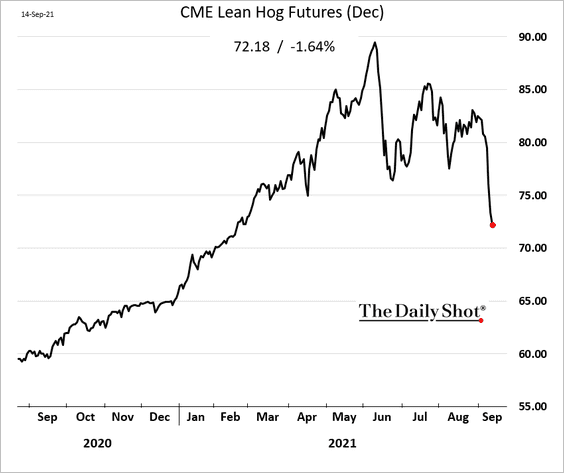
4. US hog futures continue to tumble, driven by weakness in China’s pork prices.
Back to Index
Energy
1. Global oil markets remain in deficit, widdling down crude oil in storage.
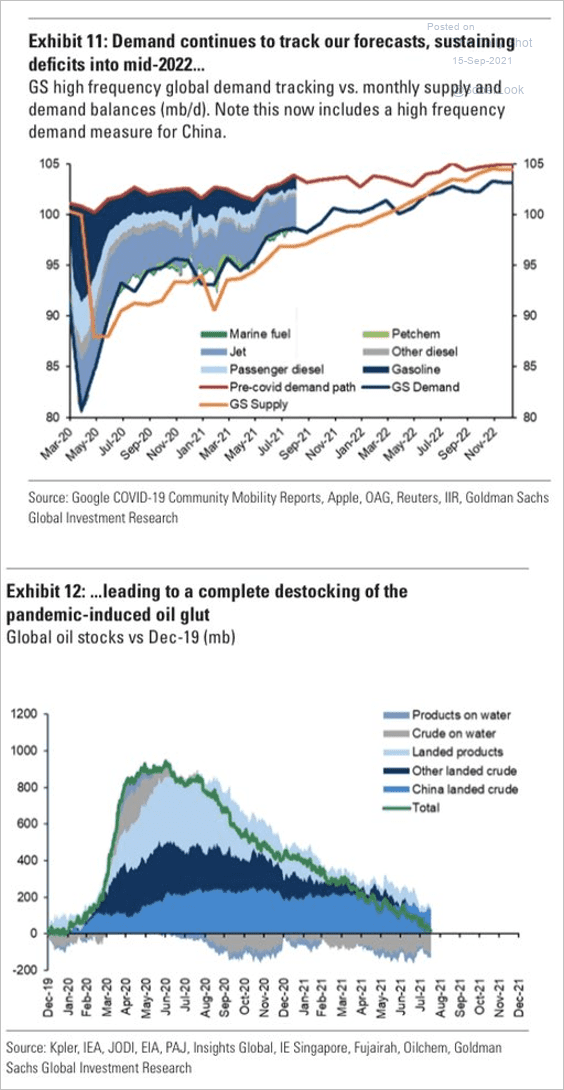 Source: Goldman Sachs; @HFI_Research
2. Since the 2015 Paris Agreement, 76% of planned global coal power plants have been canceled.
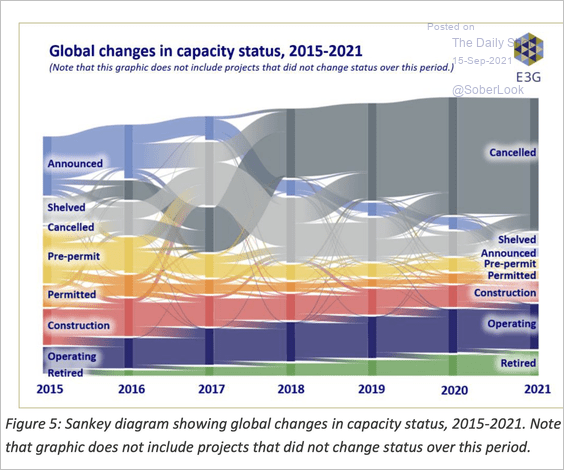 Source: @MaxCRoser Read full article
Back to Index
Equities
1. The advance-decline line has diverged from the S&P 500.
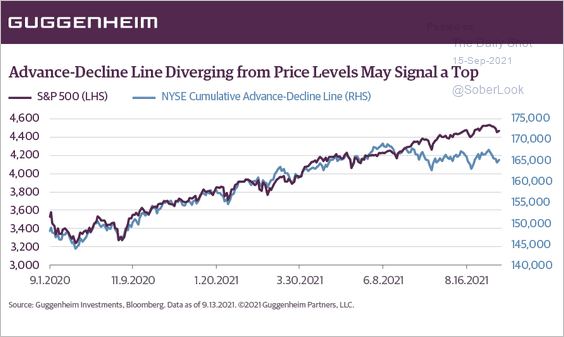 Source: @ScottMinerd
2. BofA’s private clients have never had this much exposure to stocks.
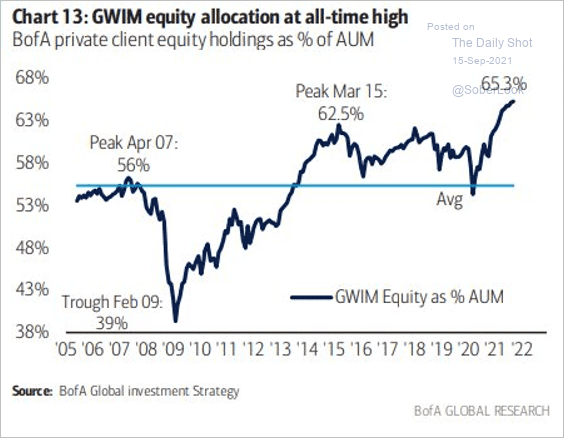 Source: BofA Global Research
3. Fund managers’ views on the economy have diverged from their stock allocations.
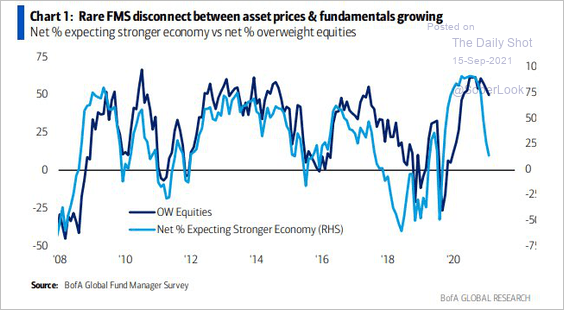 Source: @MichaelAArouet, @MikeZaccardi
4. Valuations remain a concern.
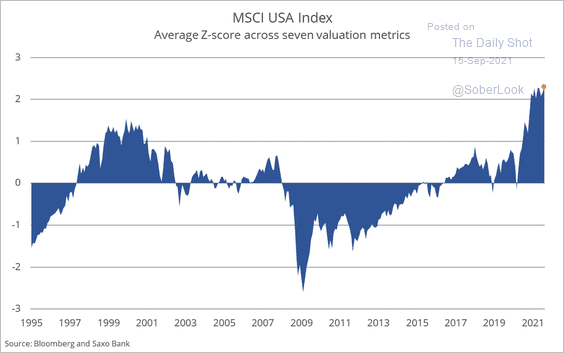 Source: @Steen_Jakobsen, @petergarnry
5. SPACs tied to alternative energy or sustainability have been popular.
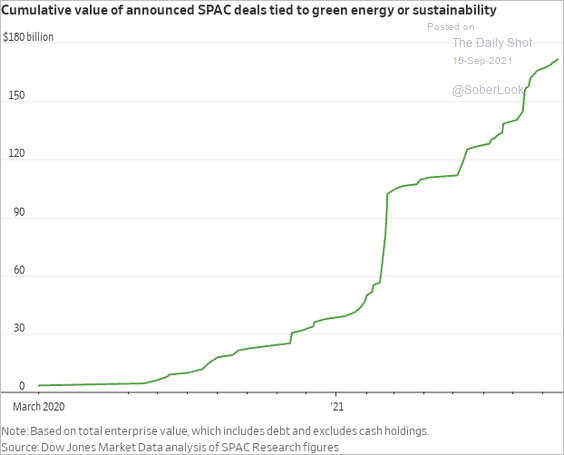 Source: @WSJ Read full article
6. VIX has been priced at the upper end of its 50-day range, while realized volatility has been relatively low. Options traders are not trusting the recent calm in equity markets.
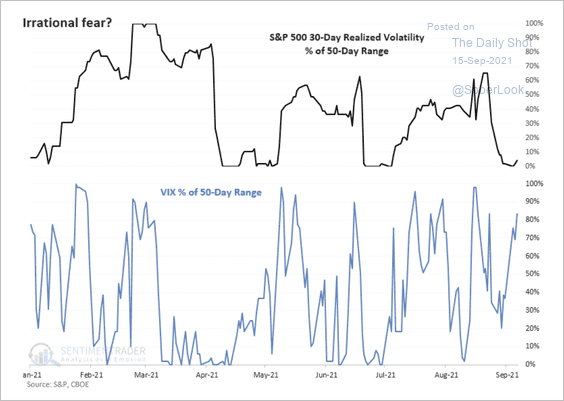 Source: SentimenTrader
7. This chart shows tech profit margins going back to 1953.
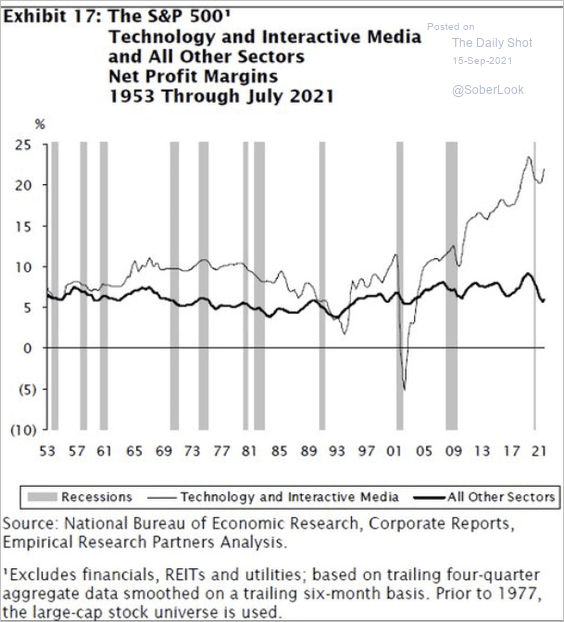 Source: @Callum_Thomas, @modestproposal1
Back to Index
Credit
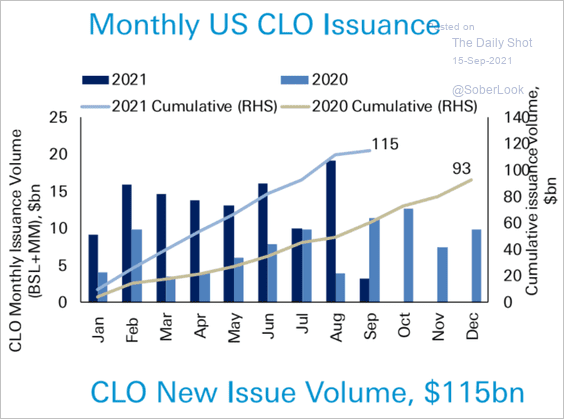
1. CLO activity remains robust, …
 Source: Deutsche Bank Research
… as managers rush to close deals before the transition from LIBOR.
 Source: @WSJ Read full article
——————–
2. It’s been a good year for leveraged finance debt issuance.
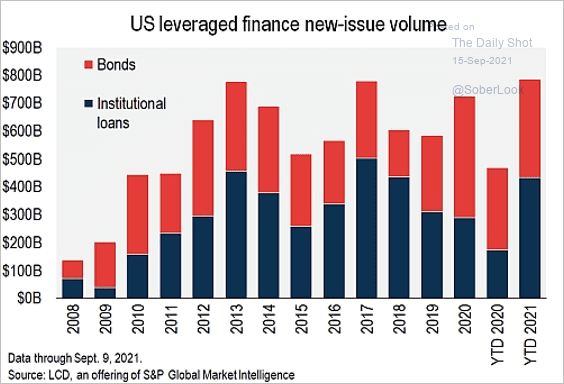 Source: S&P Global Market Intelligence
3. The US leveraged loan market experienced just one default over the last six months, bringing the default rate near 12-year lows (2 charts).
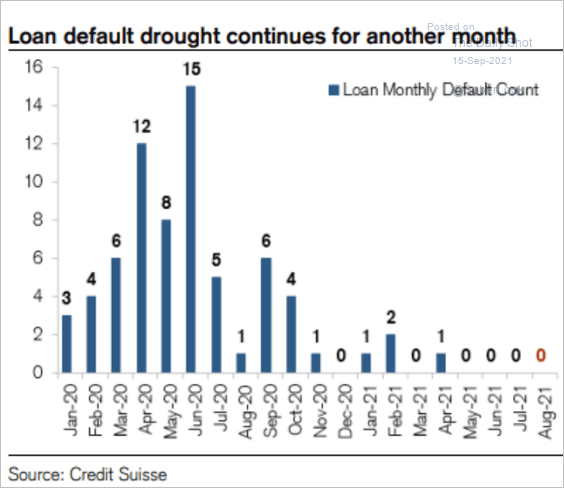 Source: Credit Suisse
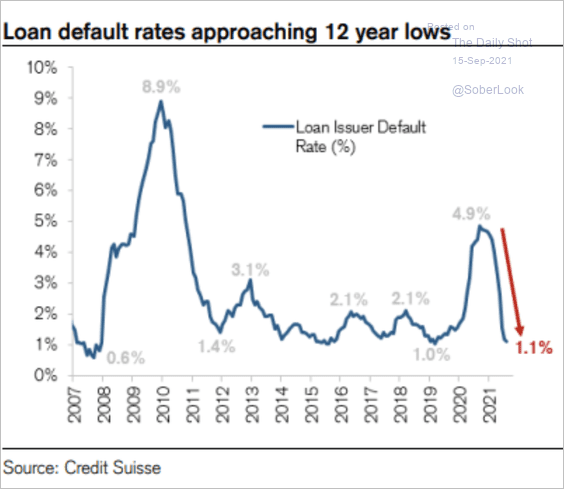 Source: Credit Suisse
——————–
4. Here is an illustration of IG bond spreads by sector.
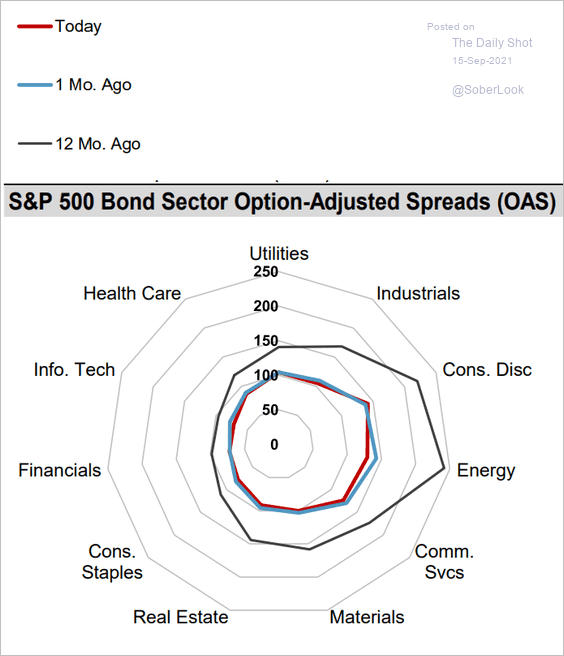 Source: S&P Global Market Intelligence
5. Airline debt surged since the start of the pandemic.
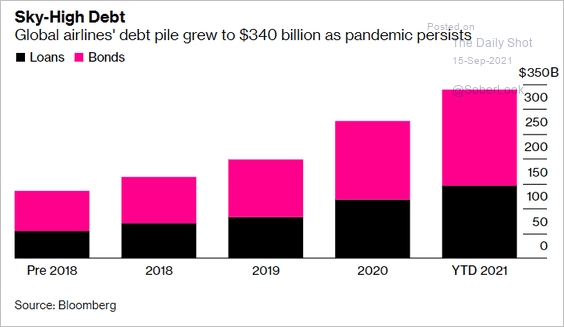 Source: @business Read full article
Back to Index
Rates
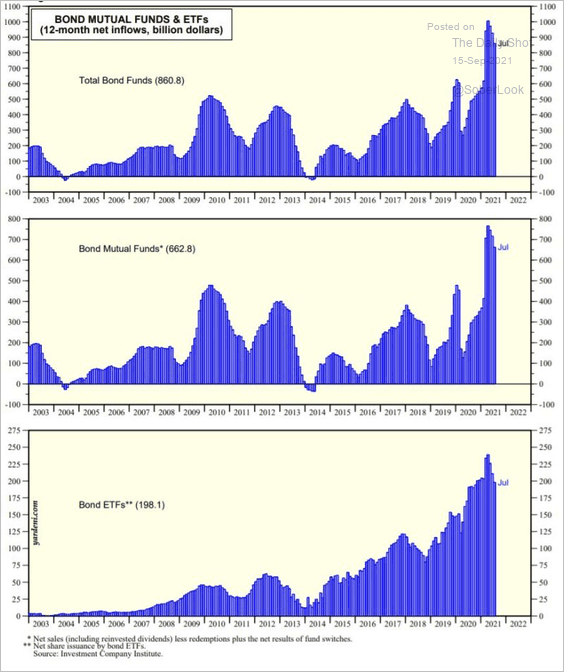
1. Net inflows into bond funds soared this year. That’s on top of the $1.6 trillion of Treasury and agency bonds purchased by the Fed and commercial banks through August, contributing to lower yields, according to Yardeni Research.
 Source: Yardeni Research
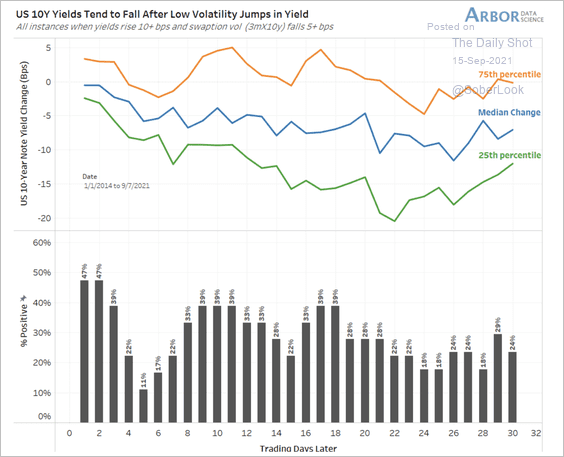
2. The 10-year Treasury yield tends to fall after a low volatility bounce.
 Source: Arbor Research & Trading
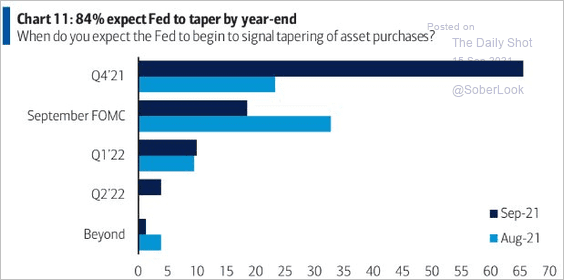
3. When will the Fed signal the start of taper?
 Source: BofA Global Research
4. Swaption volatility has fallen while Treasury yields have risen.
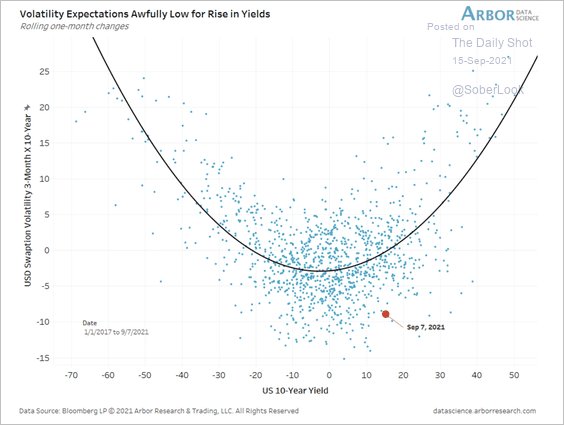 Source: Arbor Research & Trading
5. The Fed’s RRP balances are expected to surge further as the Treasury withdraws the rest of its cash from the account at the Fed (before the debt ceiling is lifted).
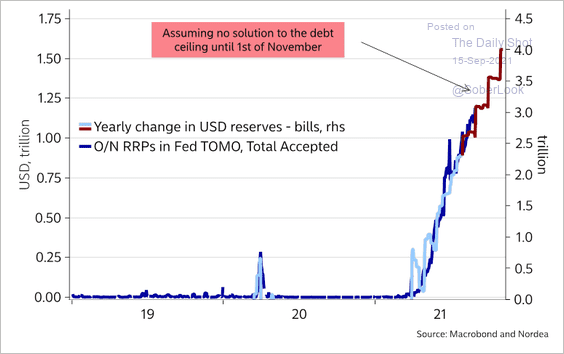 Source: @AndreasSteno
Back to Index
Food for Thought
1. Biggest GDP gainers and losers (year-over-year):
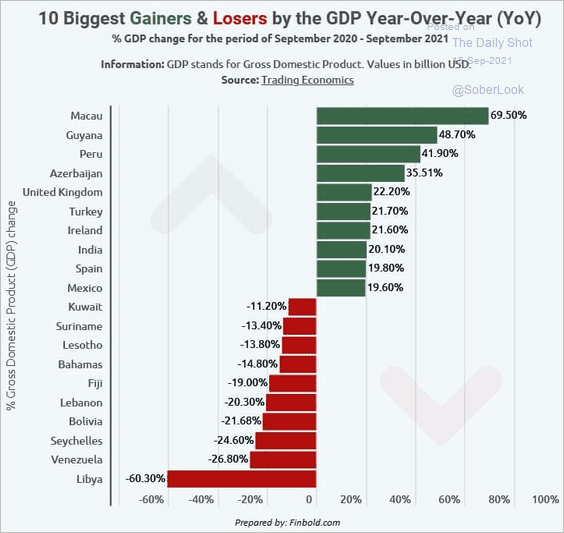 Source: Finbold.com
2. Advanced economies’ debt-to-GDP ratio and bond yields:
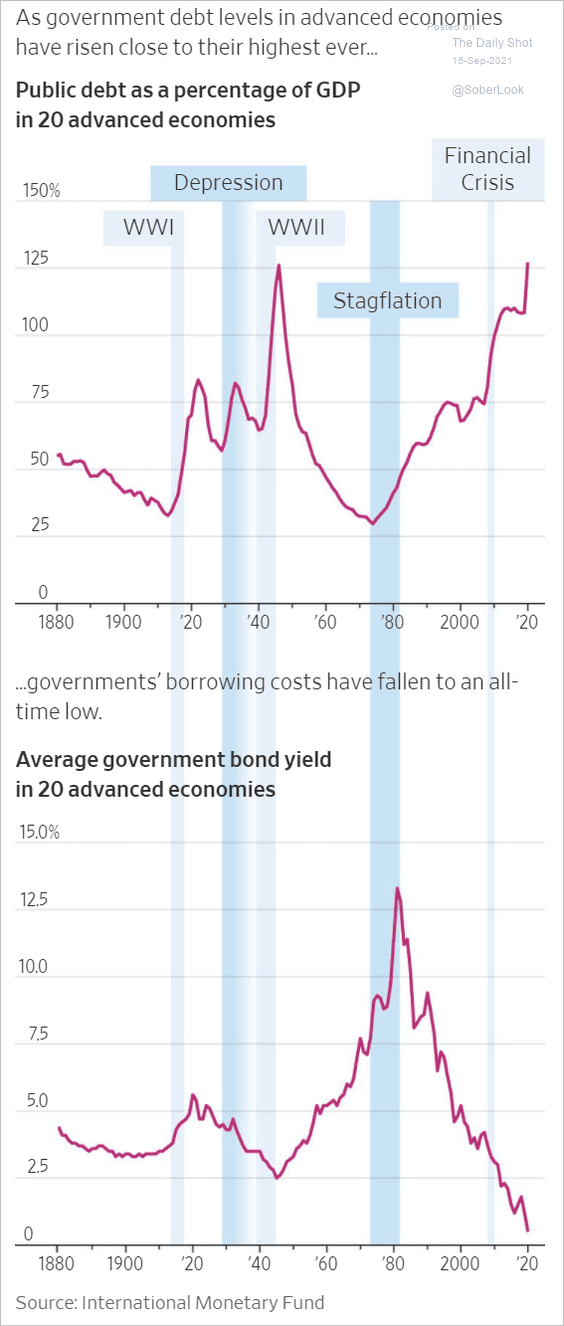 Source: @WSJ Read full article
3. Digital economy’s share of US total:
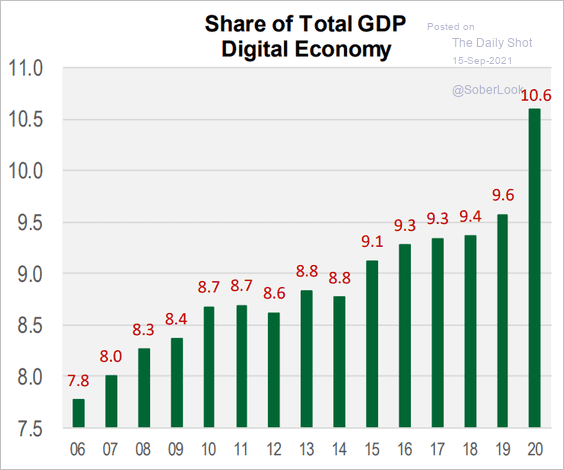 Source: Cornerstone Macro
4. GDP per capita around the world:
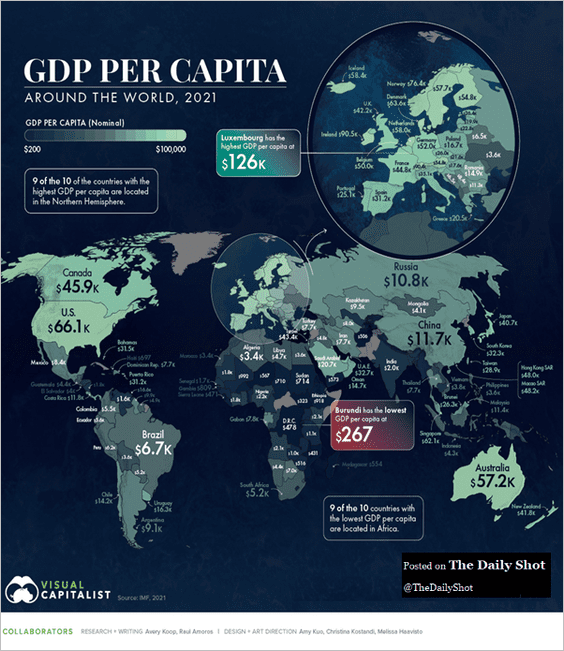 Source: Visual Capitalist Read full article
5. US credit score inflation:
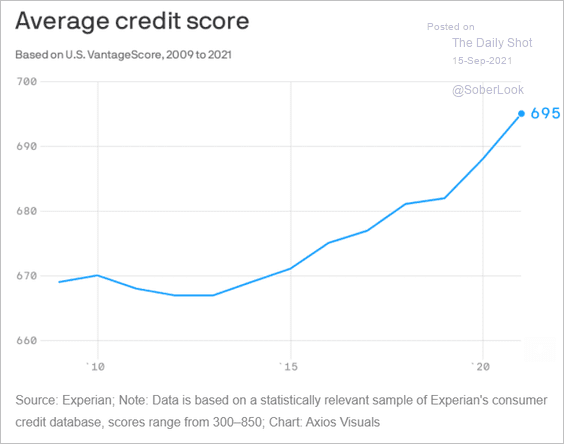 Source: @axios Read full article
6. Percent of US population with at least one COVID vaccine dose by race/ethnicity:
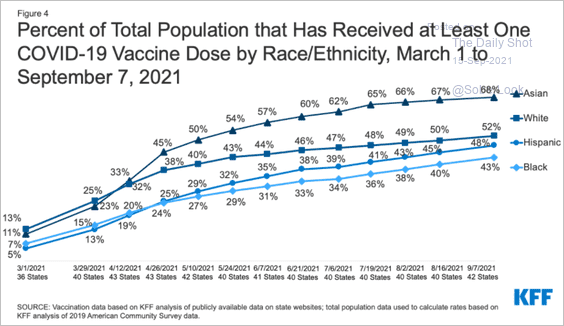 Source: KFF Read full article
7. Alcohol-impaired driving deaths:
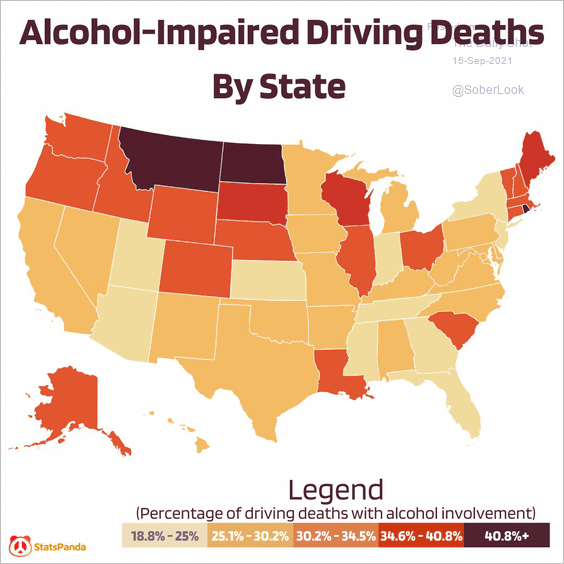 Source: @statspanda1
8. A minute on the internet:
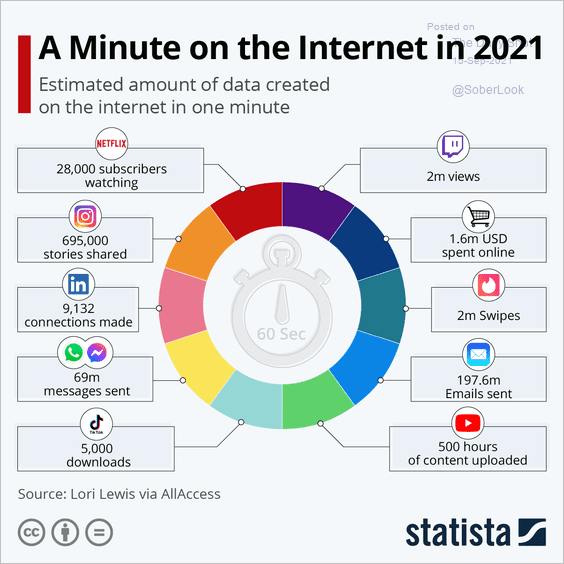 Source: Statista
9. Chip substrate shortages:
 Source: @asafitch, @WSJ Read full article
10. Unicorns and unicorn cities:
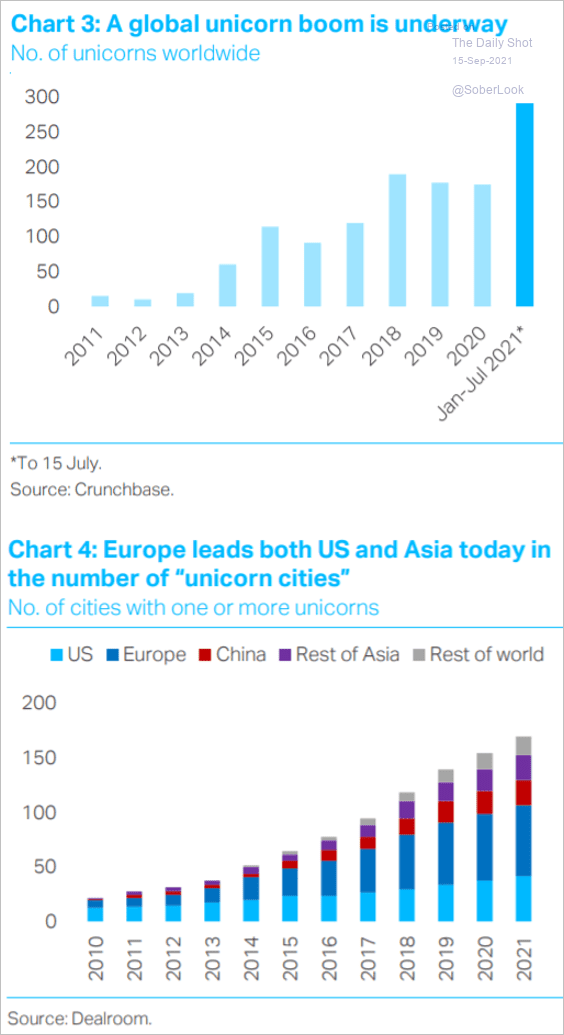 Source: TS Lombard
11. Plastic surgery procedures by country:
 Source: Statista
——————–
Back to Index