
The Daily Shot: 30-Oct-20
• The United States
• Canada
• The United Kingdom
• The Eurozone
• Europe
• Japan
• Asia – Pacific
• China
• Emerging Markets
• Commodities
• Equities
• Global Developments
• Food for Thought
The United States
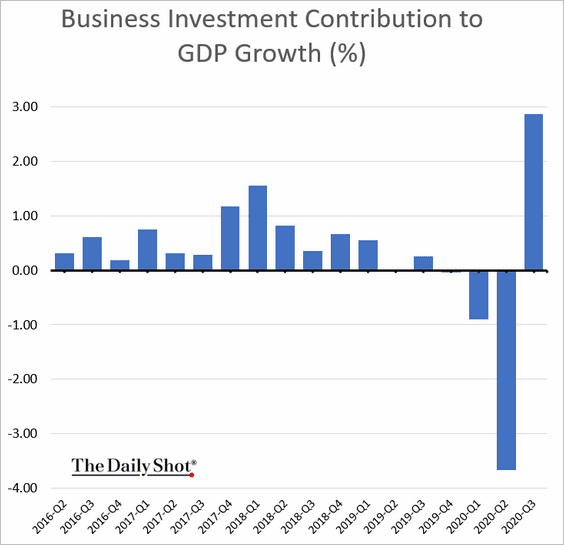
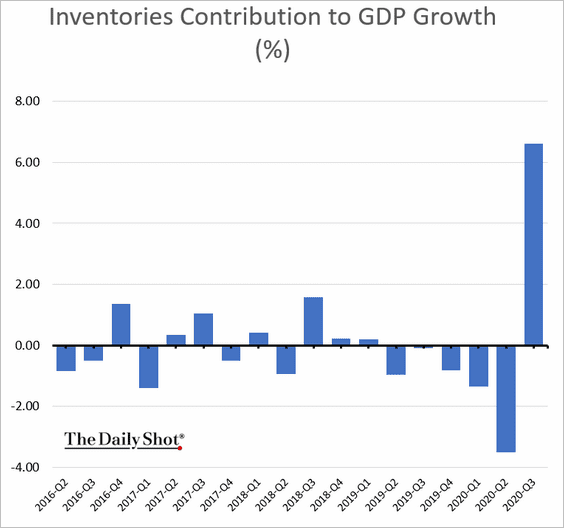
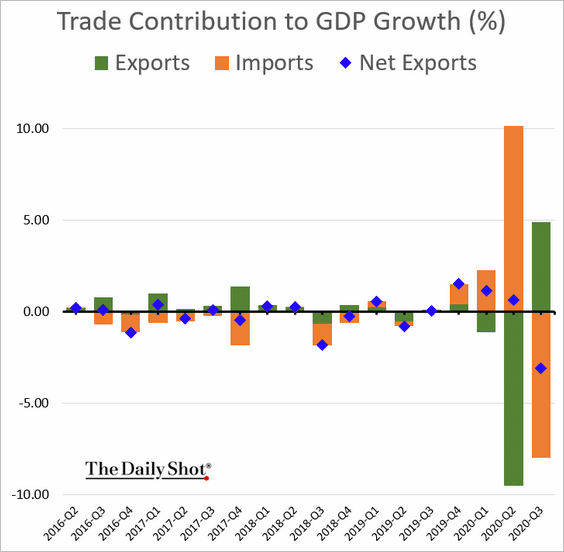
1. The economy rebounded in the third quarter, with the GDP climbing 33% (the highest increase on record).
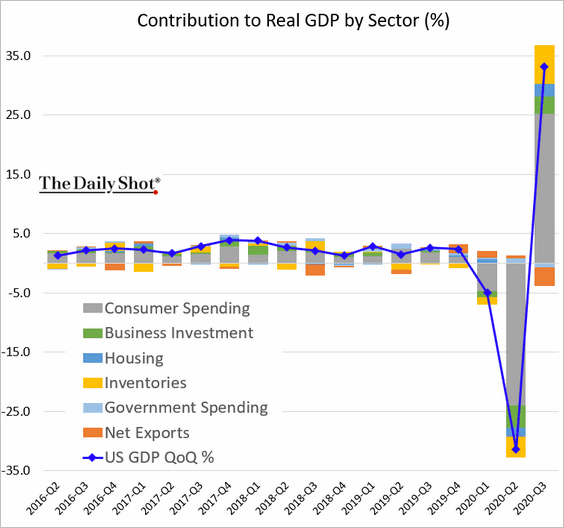
Consumer spending, business investment, housing, and inventory rebuilding contributed to growth.
This chart shows quarterly changes in consumer spending on goods and services.
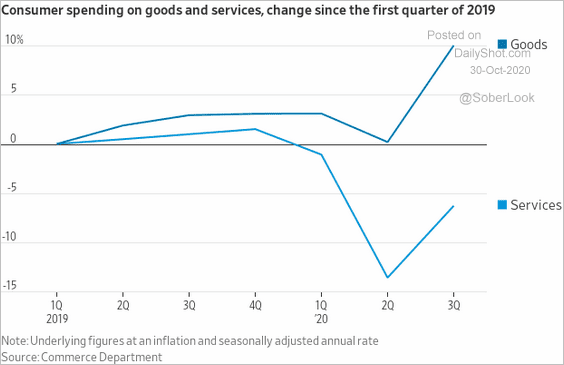 Source: @WSJ Read full article
Trade detracted from growth, with imports rising faster than exports.
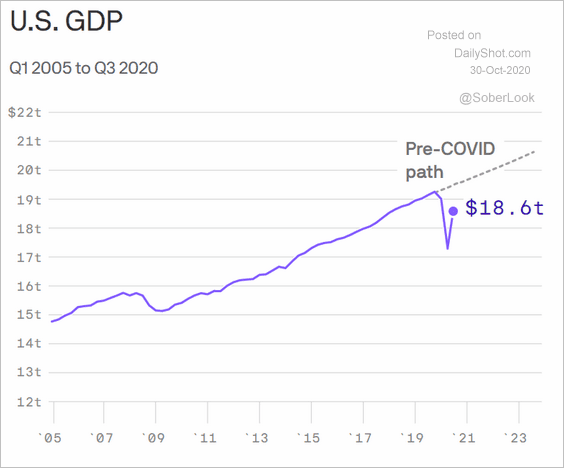
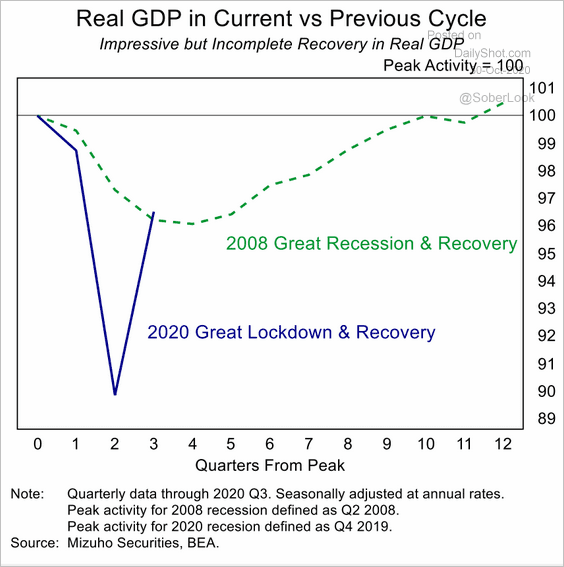
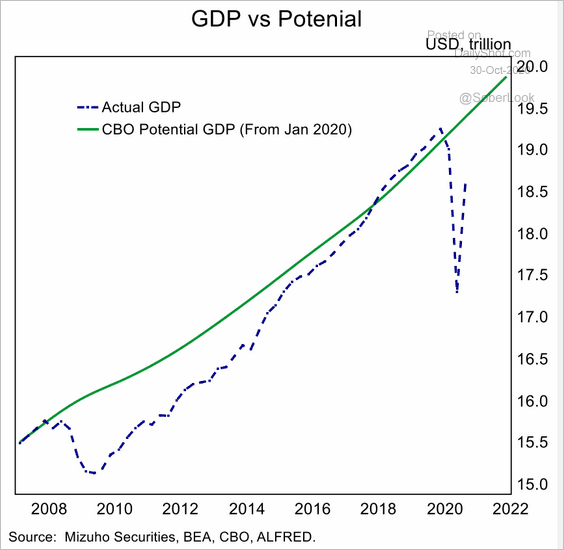
Here are some comparisons of the current GDP trajectory vs. …
• The pre-COVID trend:
 Source: @axios Read full article
• The Great Recession:
 Source: Mizuho Securities USA
• Potential GDP:
 Source: Mizuho Securities USA
——————–
2. Initial jobless claims have been drifting lower, but we continue to see more than one million Americans a week file for unemployment benefits.
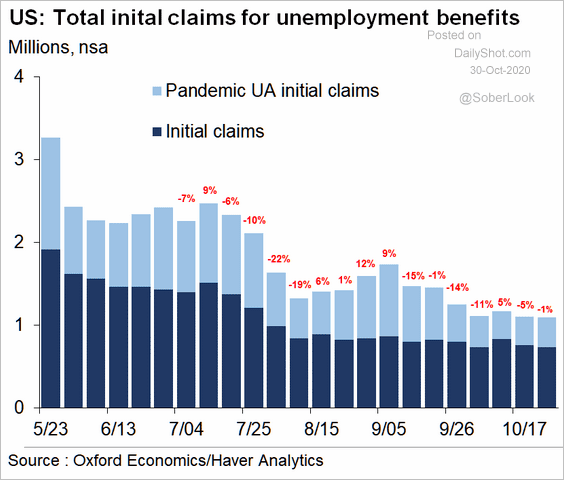 Source: Oxford Economics
This chart shows the total number of people receiving jobless benefits. Below the chart is a comment from Nancy Vanden Houten (Oxford Economics). This year-end income cliff is one of the key reasons economists would like to see another stimulus bill.
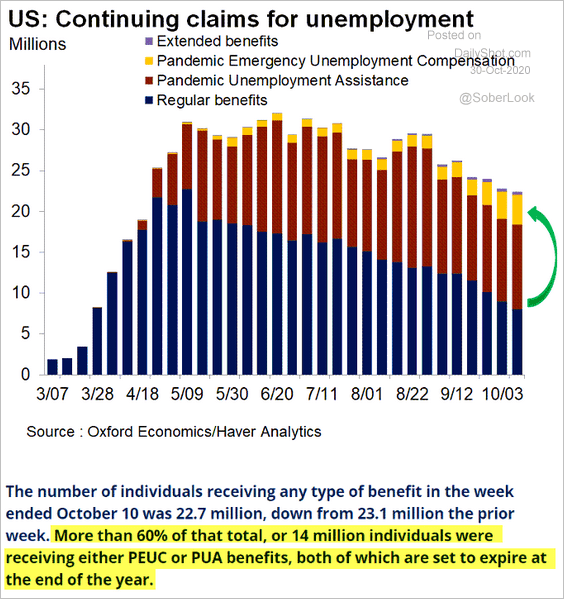 Source: @GregDaco, @nanc455 Read full article
——————–
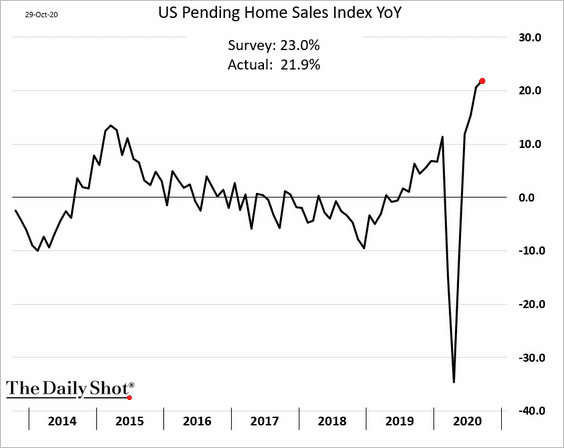
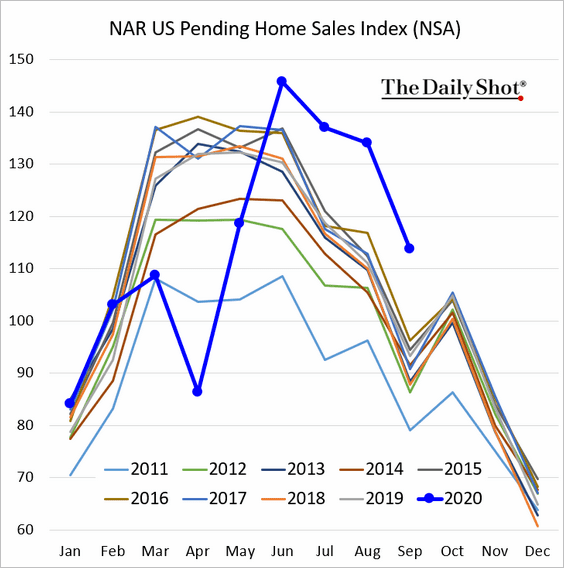
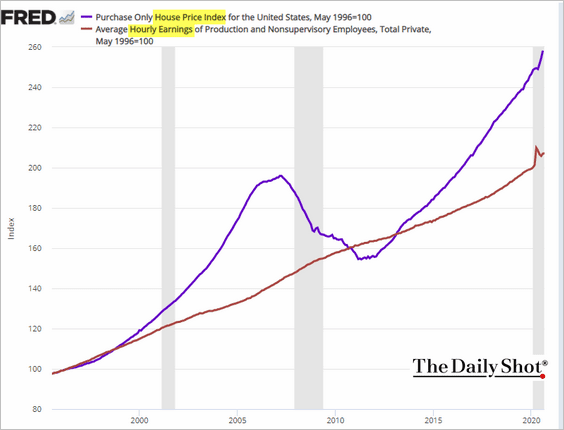
3. Pending home sales remain robust (well above 2019), but we are beginning to see some loss of momentum in housing. The second chart shows pending sales without seasonal adjustments.
Driven by falling mortgage rates, home prices have been outpacing wages. But mortgage rates appear to have bottomed for now.
——————–
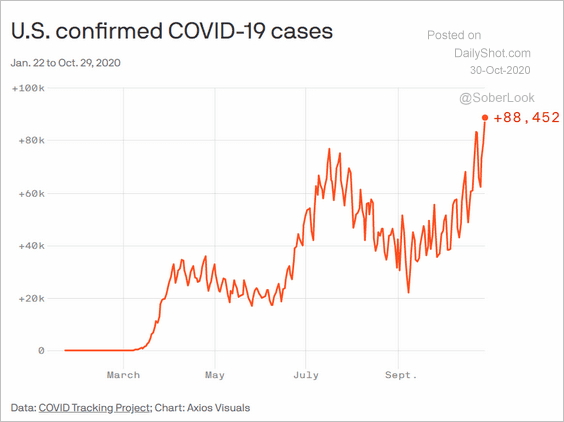
4. As we’ve seen with other indicators, consumer confidence recovery is now on pause. The daily COVID cases are approaching 90k.
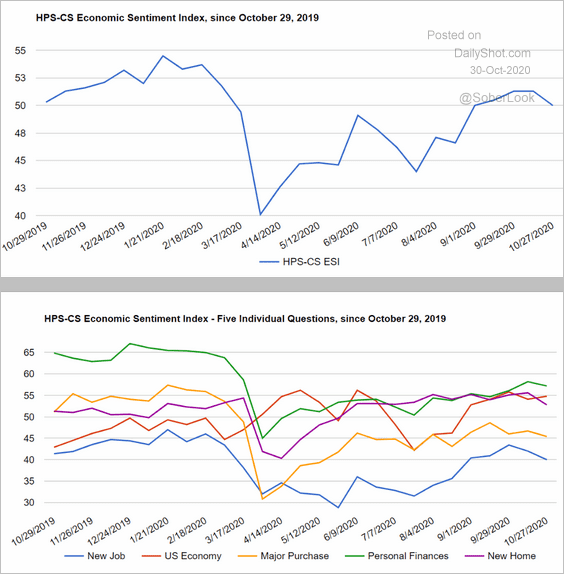 Source: @HPSInsight, @CivicScience
 Source: @axios Read full article
——————–
5. The recent slowdown in restaurant activity points to further troubles for the airline industry.
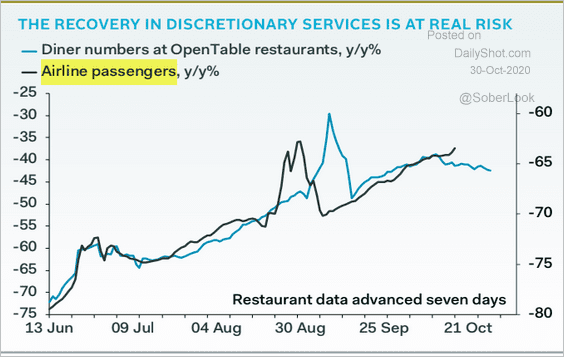 Source: Pantheon Macroeconomics
6. Highway freight traffic is now above 2019 levels, but passenger vehicle traffic is not.
 Source: @business Read full article
7. One of the reasons for this year’s spike in business formations is all the newly unemployed and furloughed employees trying to launch their own businesses. Anecdotal evidence suggests that working from home also prompted some to start a business on the side.
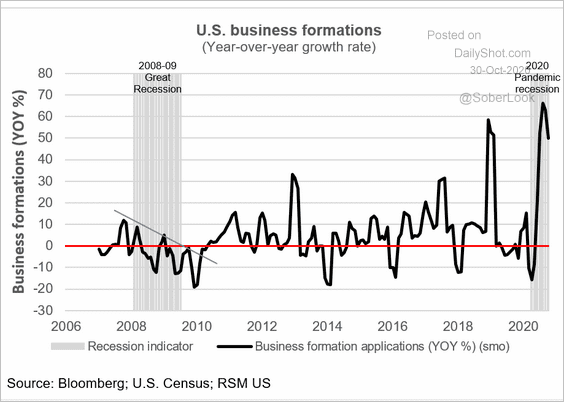 Source: @joebrusuelas Read full article
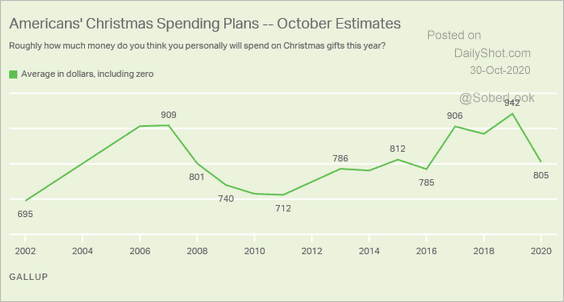
8. Next, we have some survey data on holiday shopping.
• Gallup’s spending plans survey (dollar amounts):
 Source: Gallup Read full article
• Holiday retail sales forecast (year-over-year):
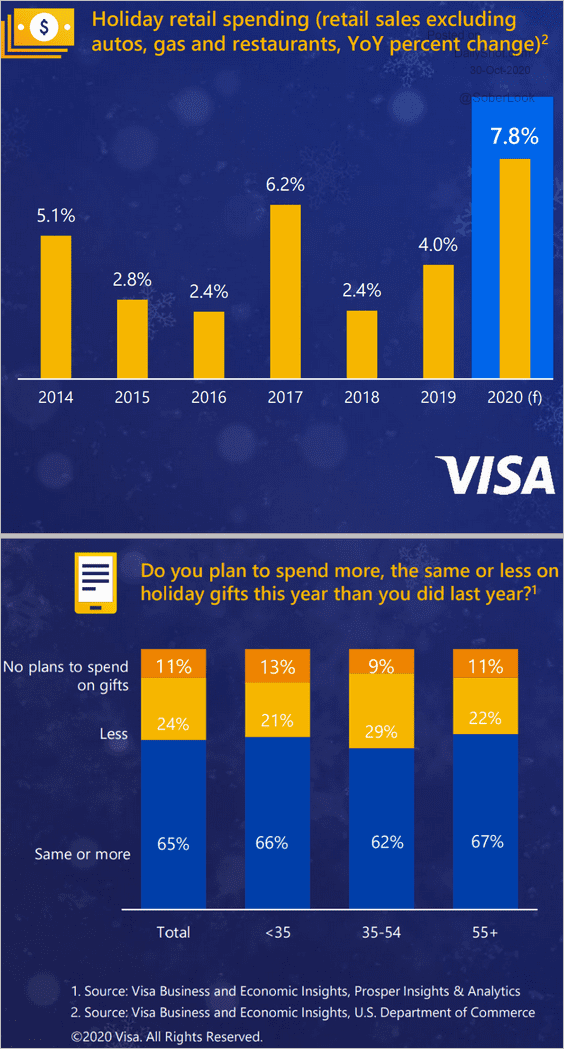 Source: Visa Business and Economic Insights
• Online shopping:
 Source: Visa Business and Economic Insights
• Retail (physical) store preferences vs. 2014:
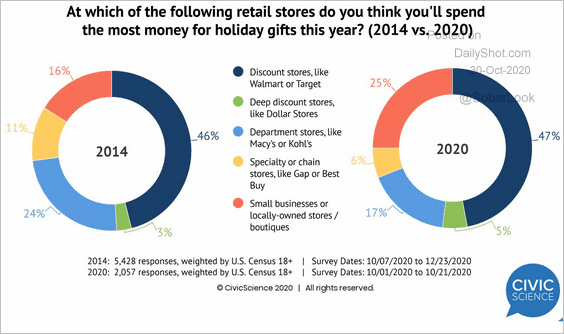 Source: @CivicScience
Canada
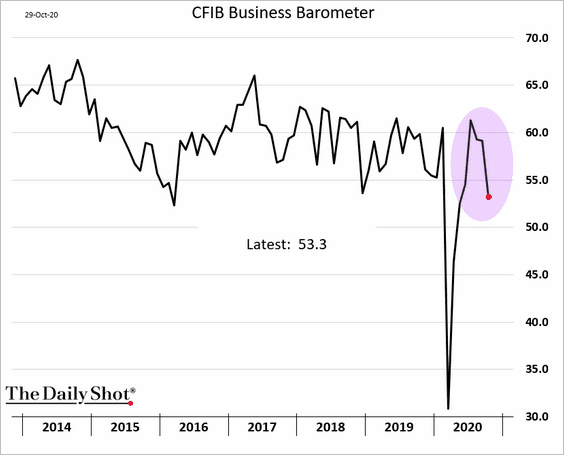
1. The recovery in small and medium-size business activity is slowing.
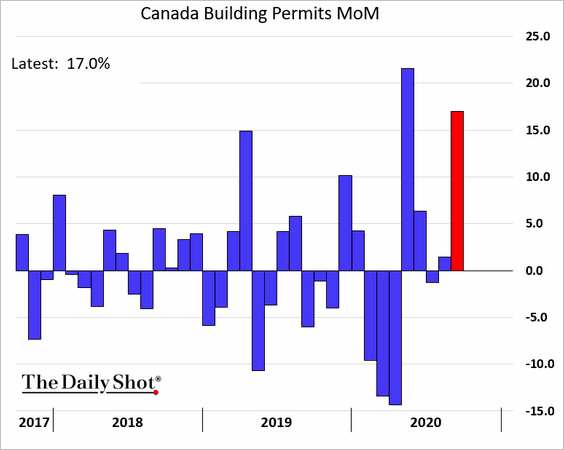
2. September building permits surprised to the upside.
3. What’s next for interest rates in Canada? Here is a forecast from Oxford Economics.
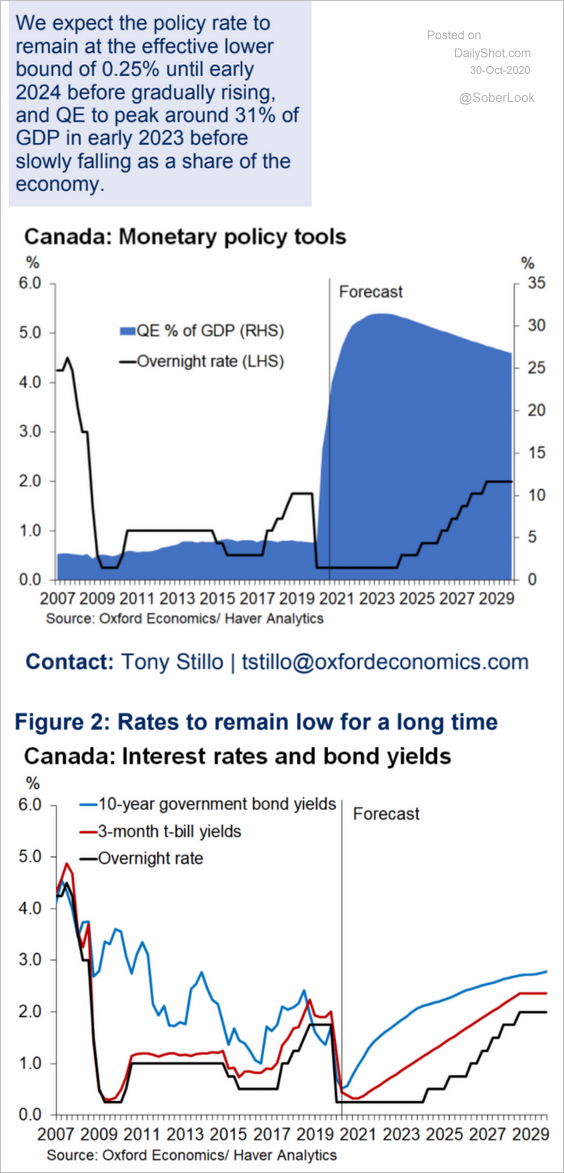 Source: Oxford Economics
The United Kingdom
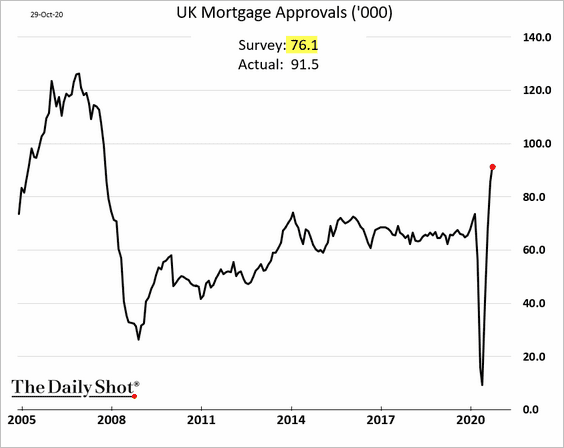
1. Mortgage approvals blew past economists’ forecasts.
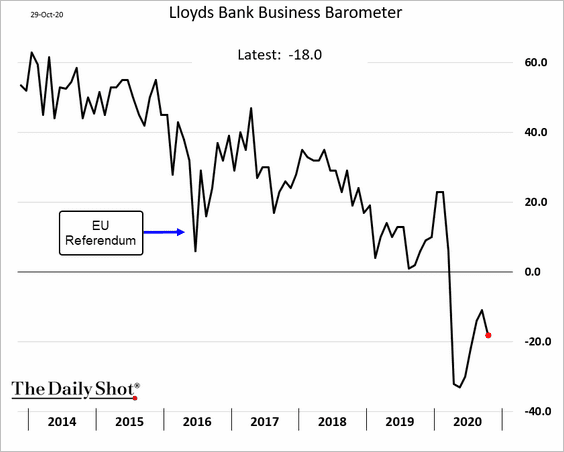
2. The Lloyds Bank business sentiment index deteriorated this month.
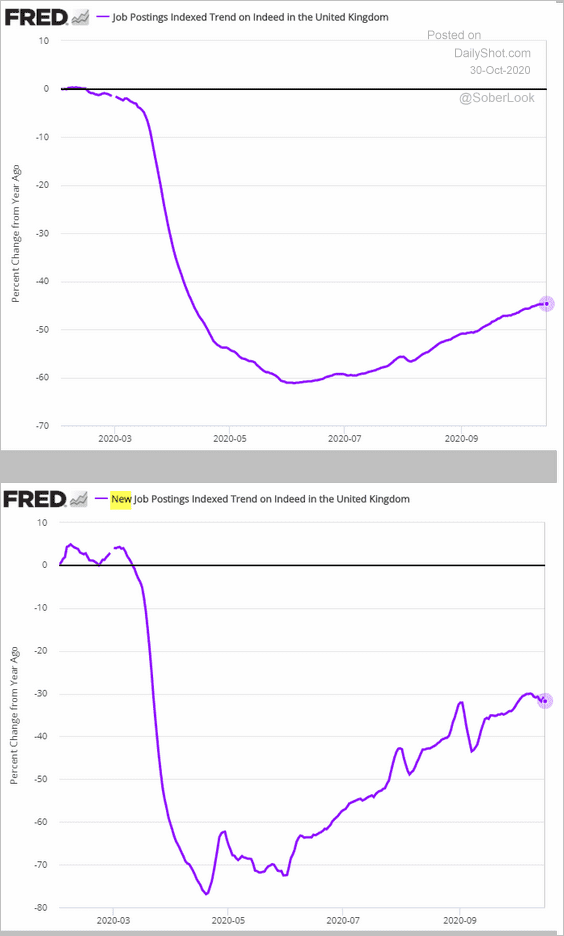
3. Here are some job posting trends (on Indeed).
The Eurozone
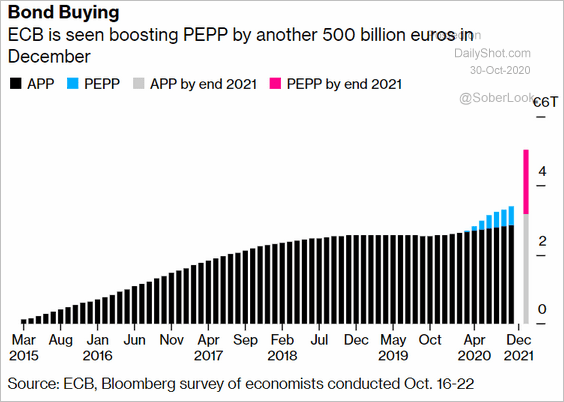
1. The ECB is getting a bazooka ready for December.
 Source: @WSJ Read full article
 Source: @business Read full article
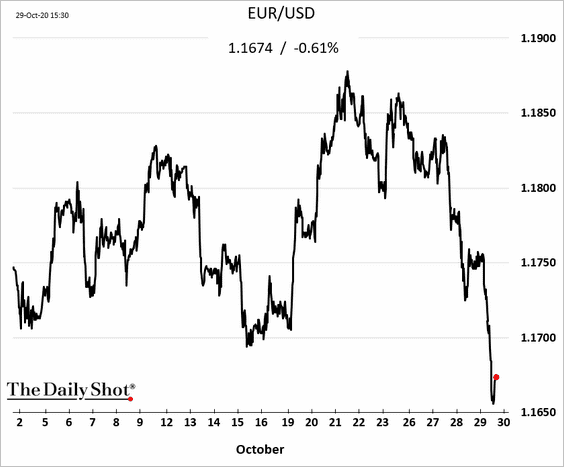
The euro took a hit.
——————–
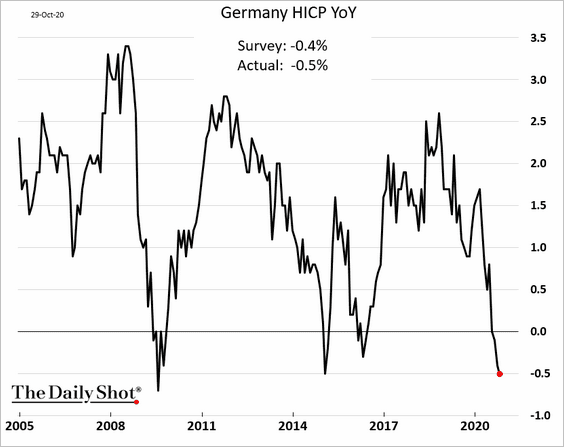
2. Germany’s inflation edged deeper into negative territory.
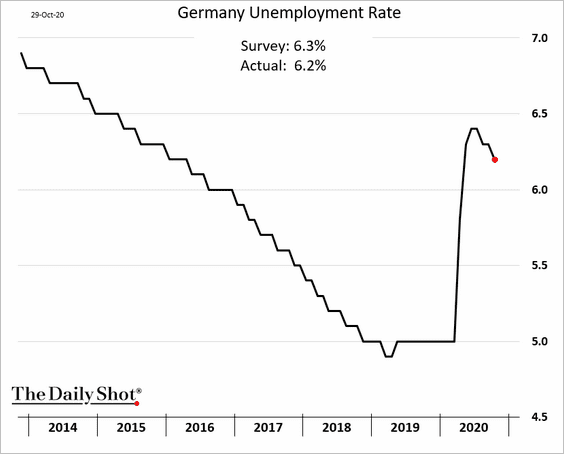
The nation’s labor market continues to recover.
• The unemployment rate:
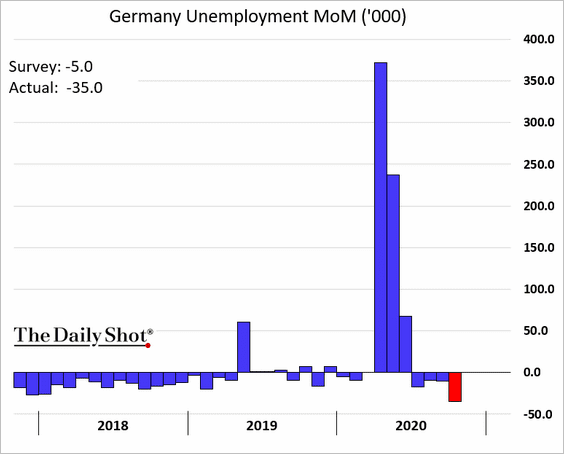
• Number of people unemployed (monthly changes):
• Vacancies:
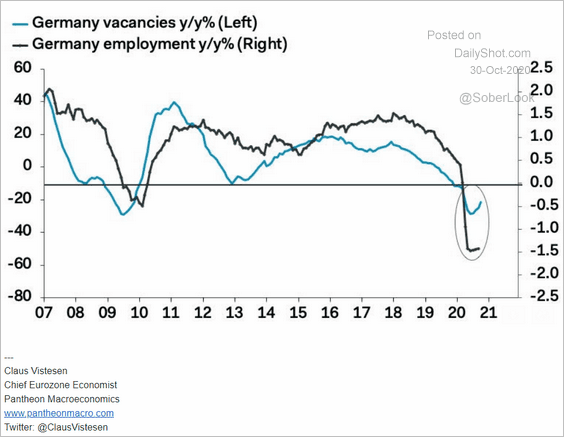 Source: Pantheon Macroeconomics
——————–
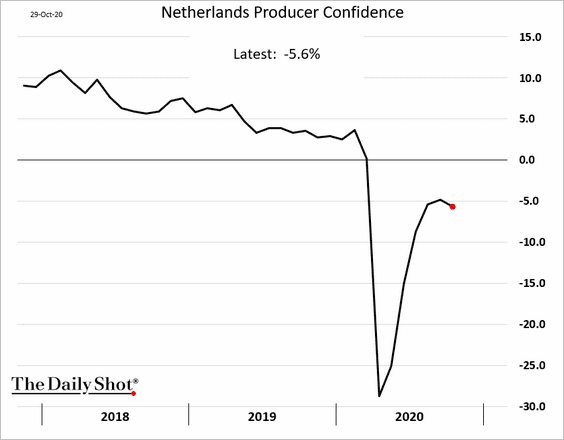
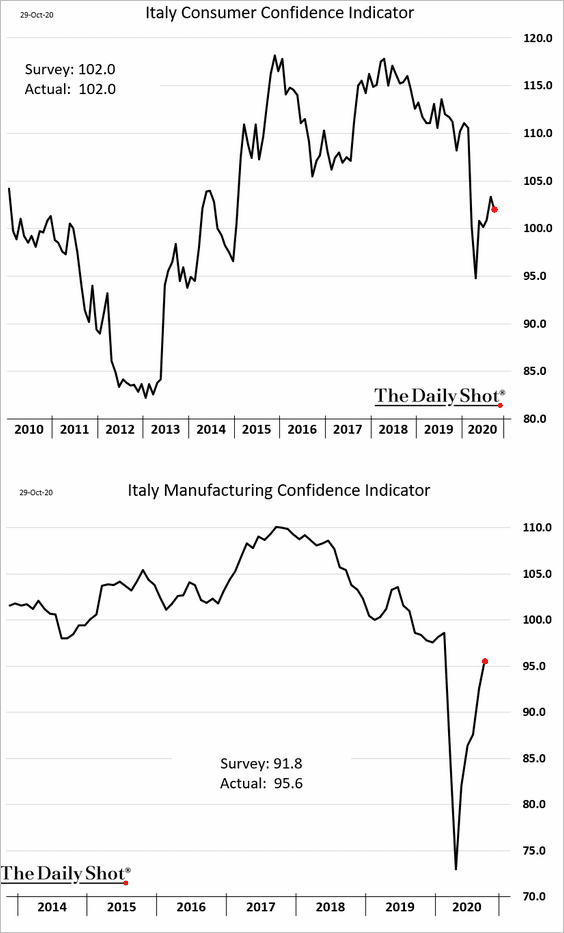
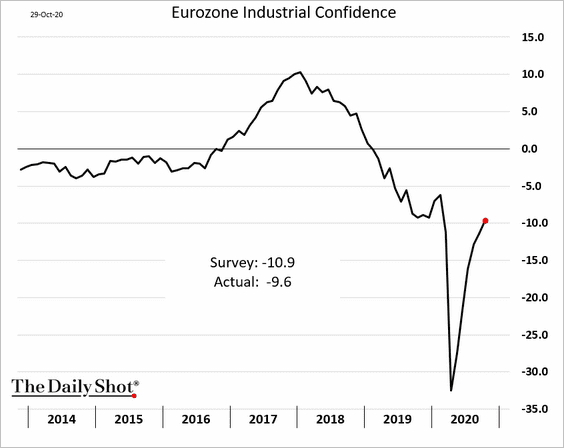
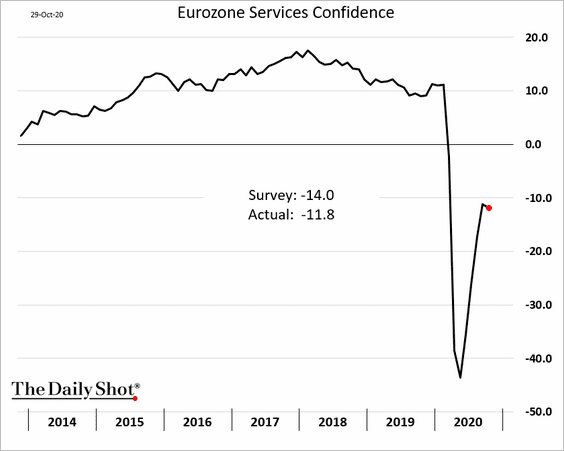
3. Next, we have some sentiment trends.
• Netherlands producer confidence:
• Italian consumer and manufacturing confidence:
• Eurozone industrial confidence:
• Eurozone service confidence (much stronger than expected given the COVID explosion):
——————–
4. Fiscal policy (stimulus) divergence has been driving the gap between the US and Eurozone inflation expectations.
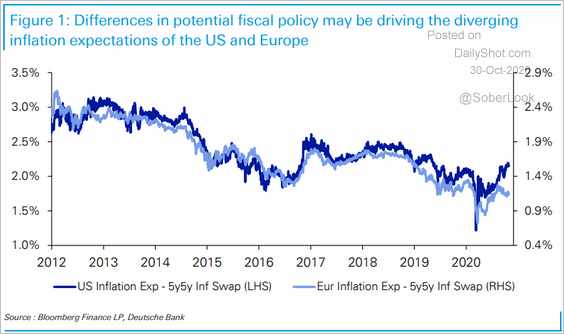 Source: Deutsche Bank Research
5. New-infections trend in France has gone vertical.
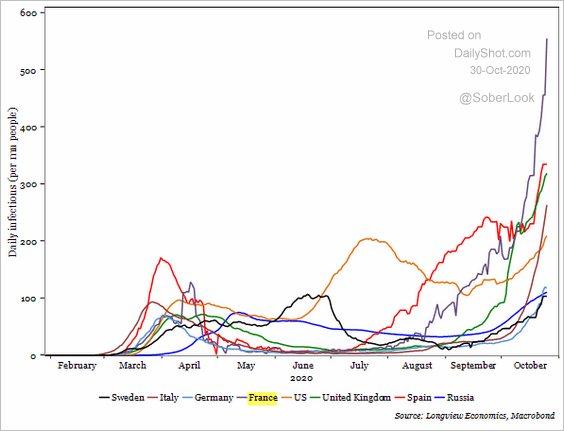 Source: Longview Economics
Europe
1. European shares failed to rebound with the US, as the STOXX 600 hits the lowest level since May.
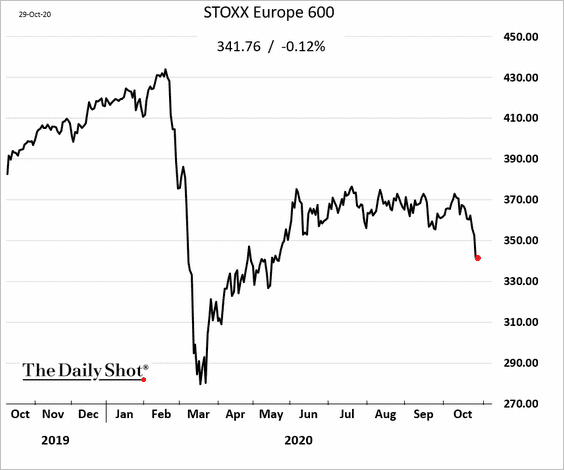
By the way, European large-caps are more reflective of global dynamics than EU activity.
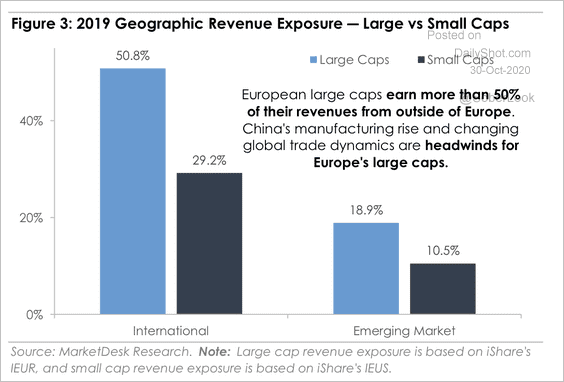 Source: MarketDesk Research
——————–
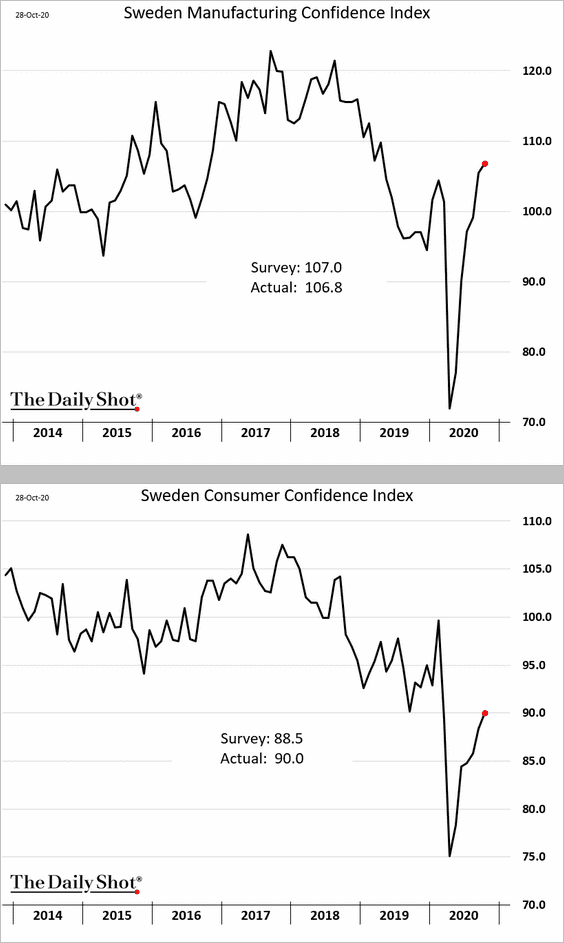
2. Here are a couple of updates on Sweden.
• Consumer and manufacturing confidence:
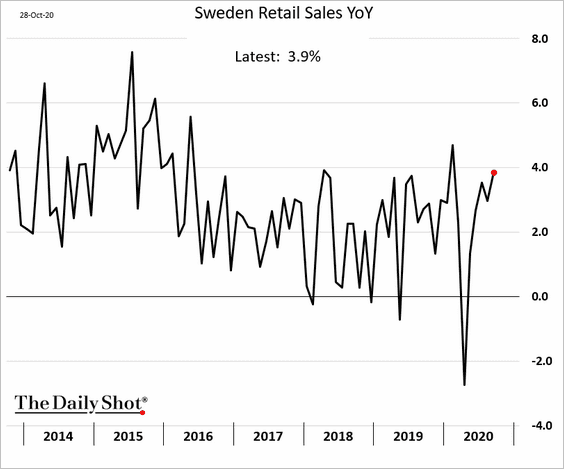
• Retail sales (through September):
——————–
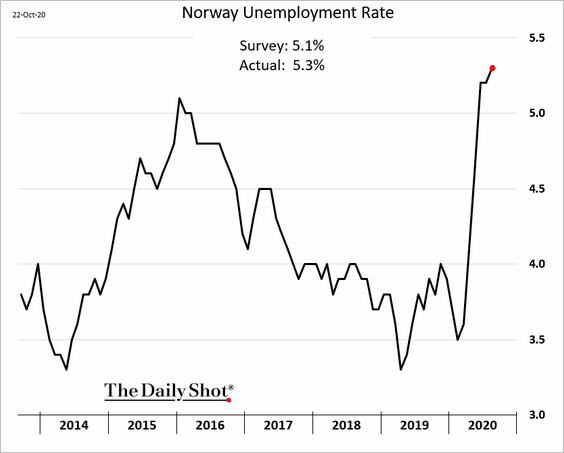
3. Norway’s unemployment rate remains elevated.
No job? Let’s go to the movies.
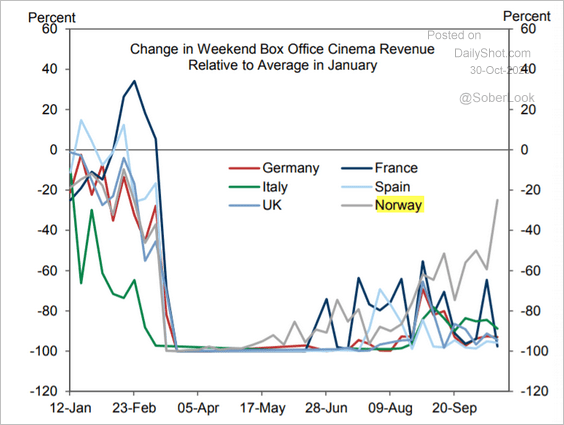 Source: Goldman Sachs
——————–
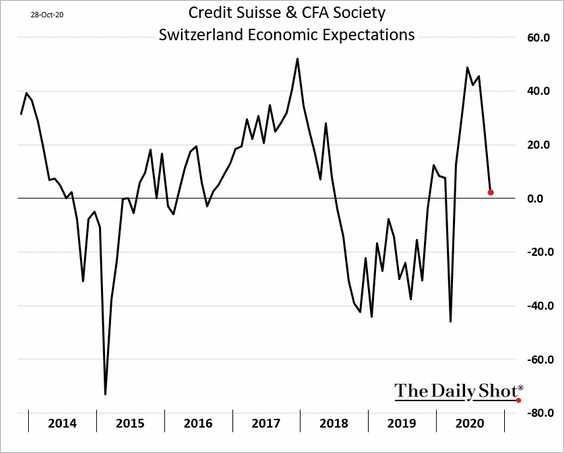
4. Swiss economic expectations weakened this month.
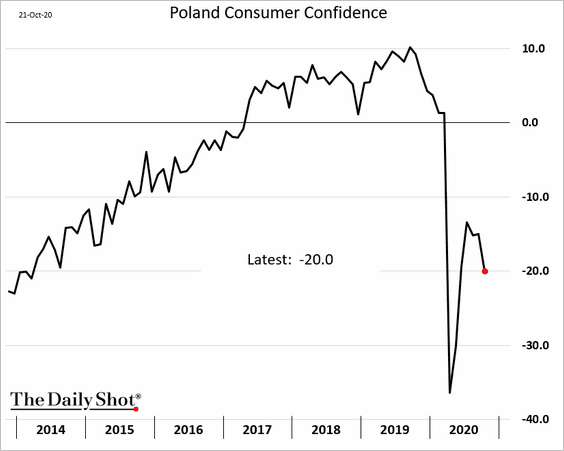
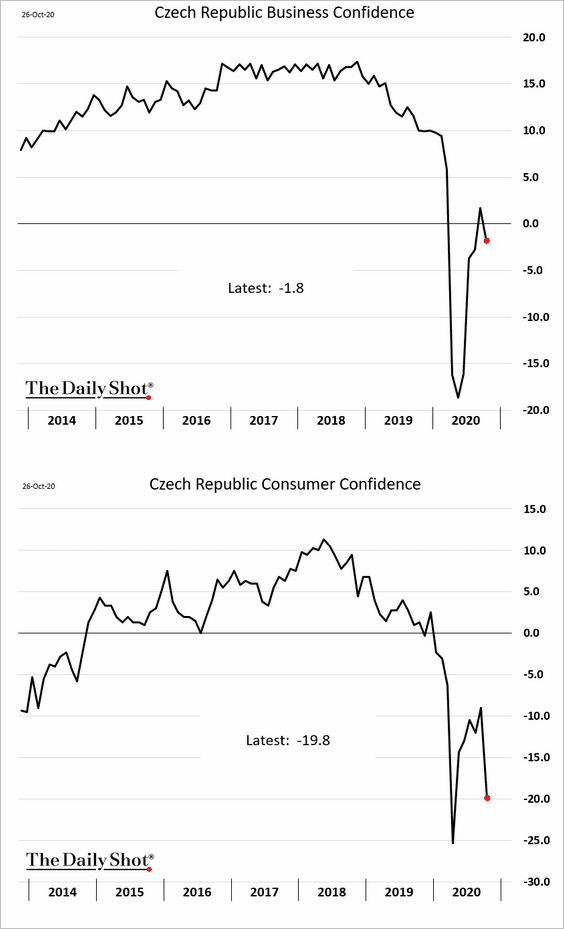
5. Here are some updates on Central Europe.
• Poland’s consumer confidence:
• Czech business and consumer confidence:
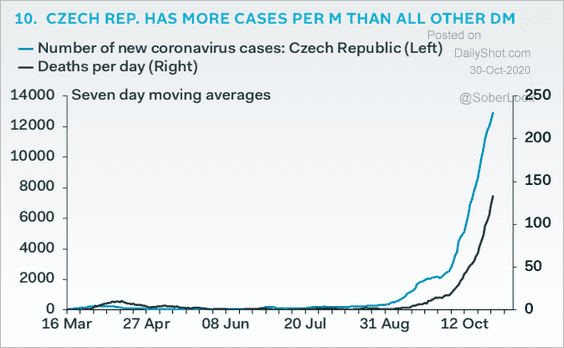
• Czech hospitalizations:
 Source: Pantheon Macroeconomics
——————–
6. COVID-related death rates in Europe are on the rise.
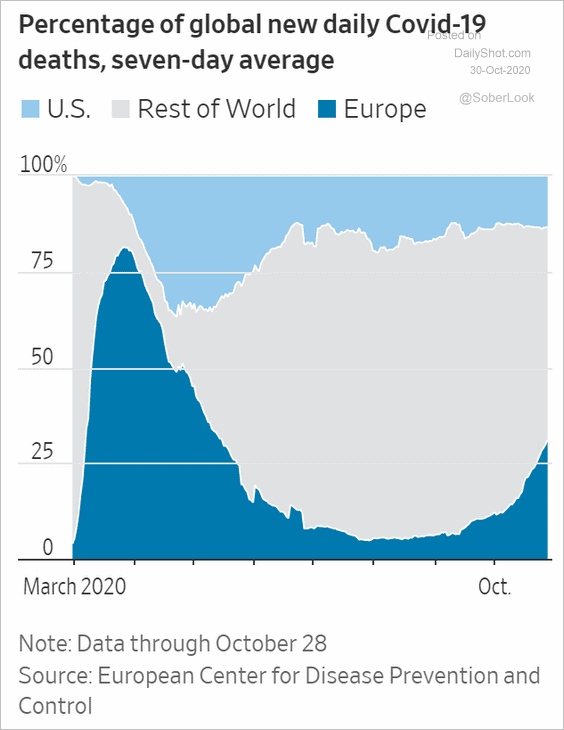 Source: @WSJ Read full article
7. Here are the government debt-to-GDP ratios across the EU.
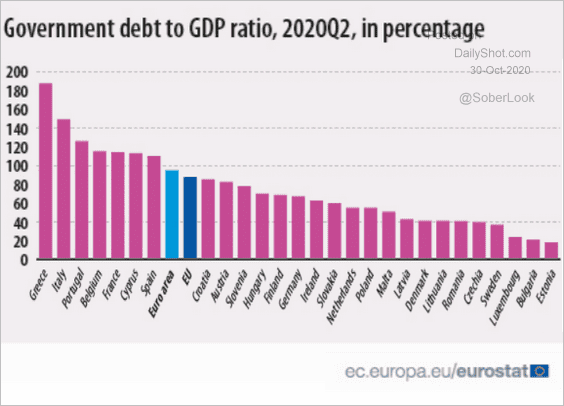 Source: Eurostat Read full article
8. Finally, we have the EU’s unemployment demographics.
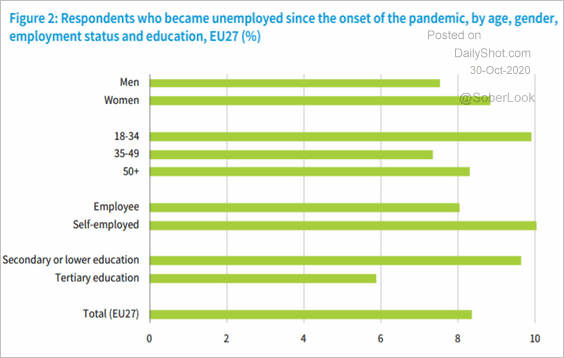 Source: Eurofound Read full article
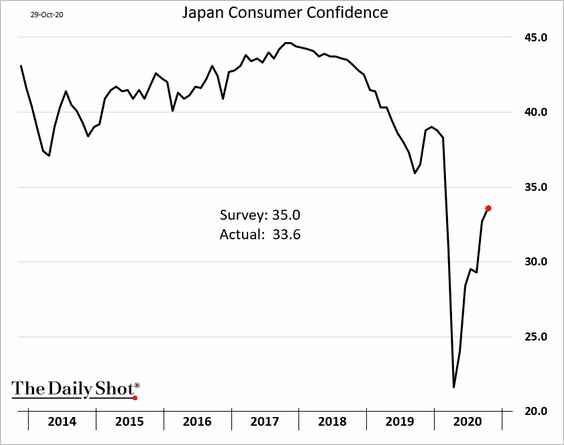
Japan
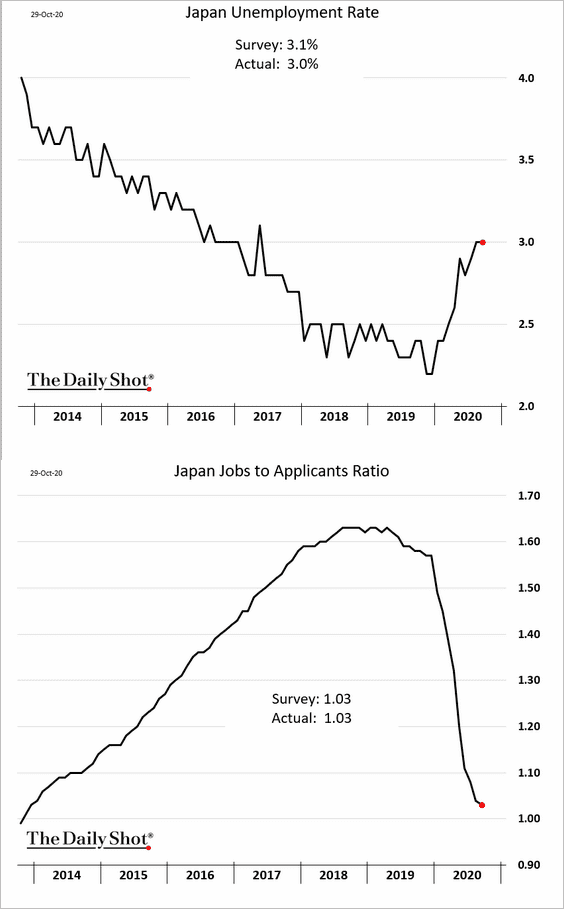
1. Consumer confidence is gradually recovering.
2. Is the labor market stabilizing?
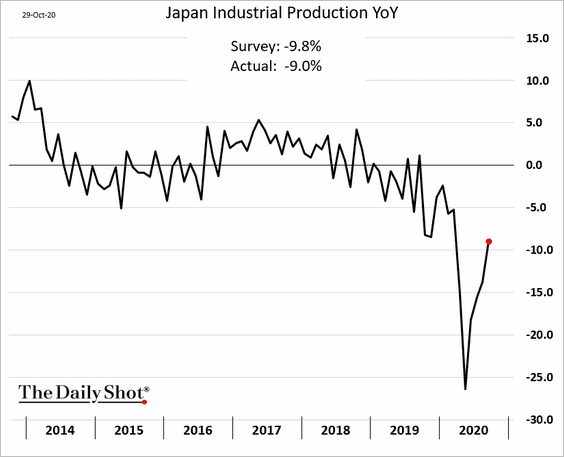
3. September industrial production surprised to the upside.
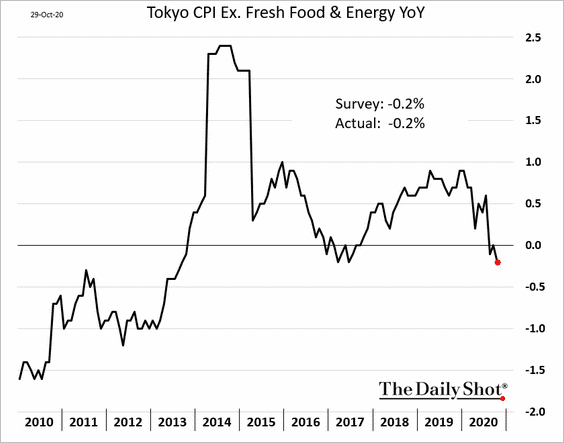
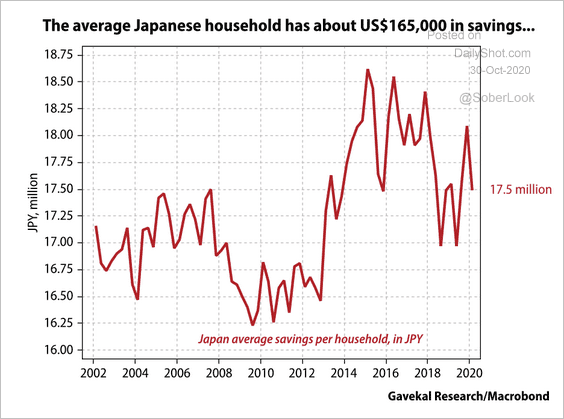
4. Tokyo’s core CPI points to deflationary pressures in Japan.
By the way, excess private-sector savings have been contributing to deflation.
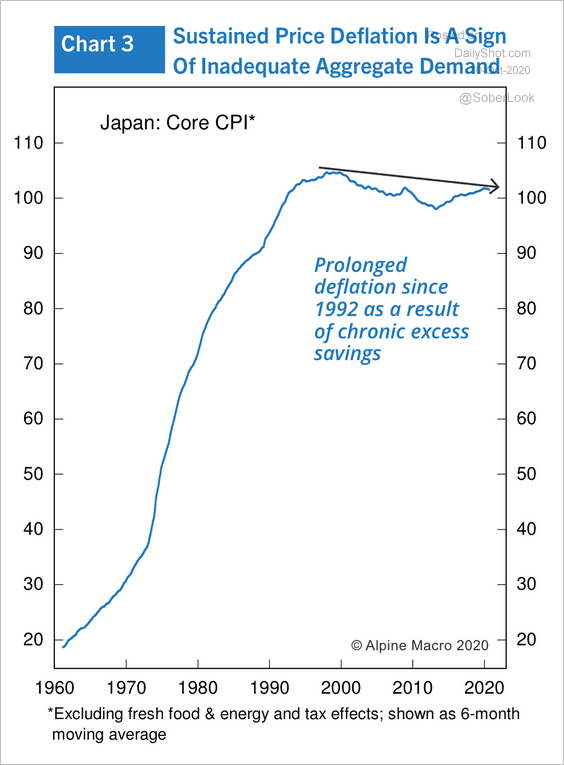 Source: Alpine Macro
The average household has about $165,000 in savings (compared to about one-tenth of that for US households).
 Source: Gavekal
Asia – Pacific
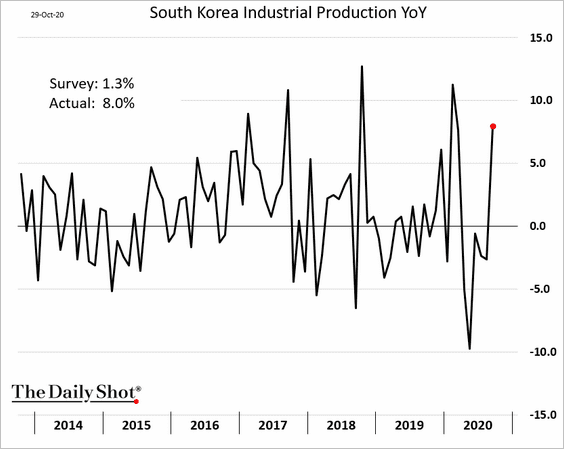
1. South Korea’s industrial production surprised to the upside.
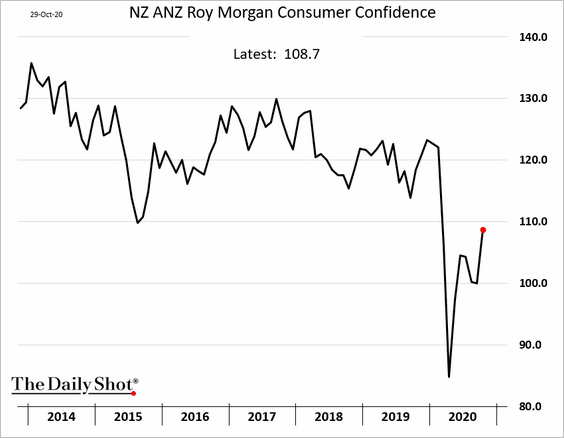
2. New Zealand’s consumer confidence is recovering.
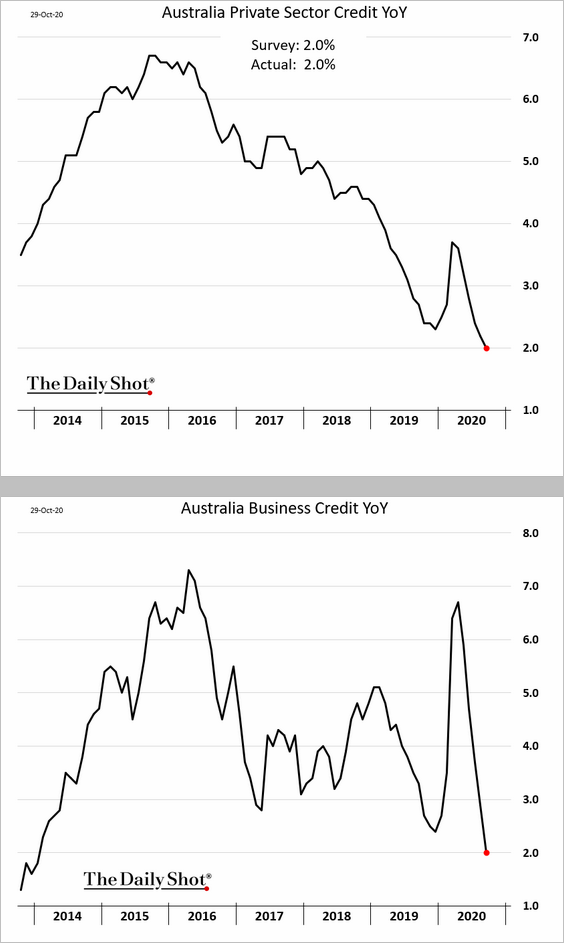
3. Australia’s private credit growth slowed further, driven by softer business lending. Housing credit growth remains stable.
4. This chart shows Australia’s money market rates.
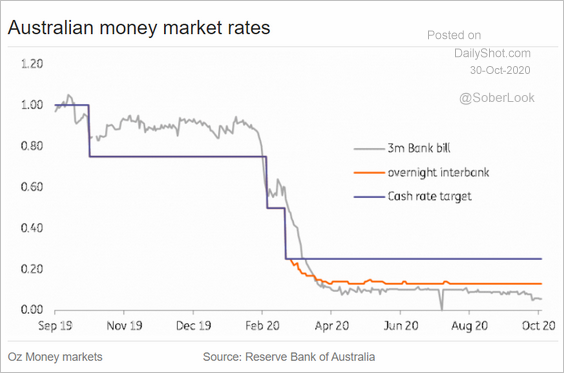 Source: ING
China
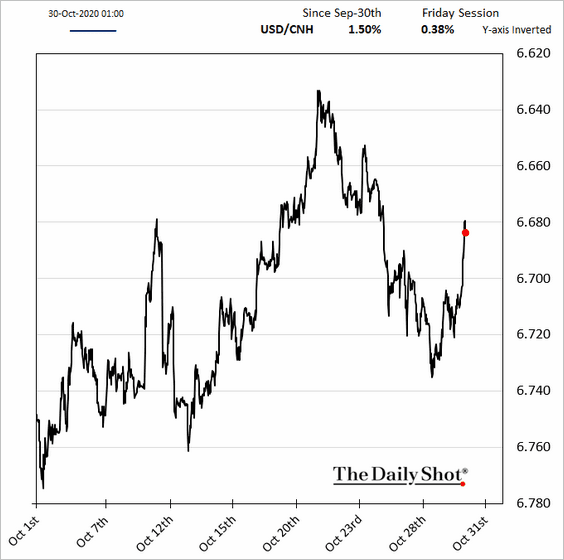
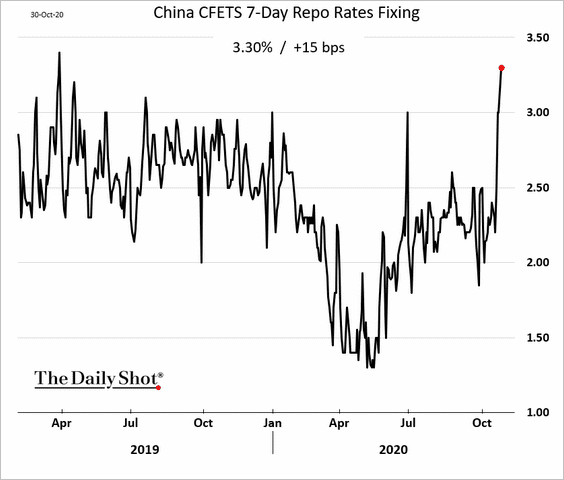
1. The renminbi is higher due to tight liquidity going into the month-end (2nd chart).
——————–
2. While money supply and credit continue to improve, monetary conditions have fallen sharply.
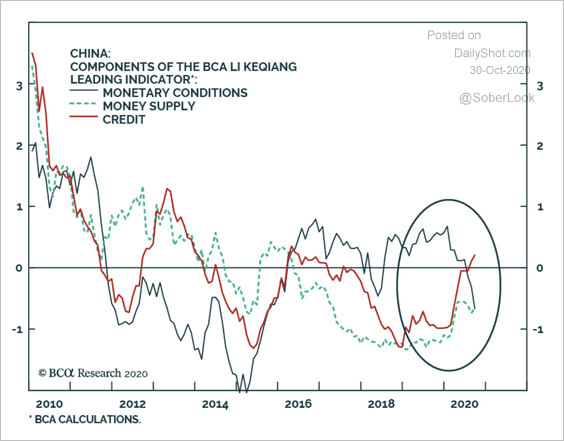 Source: BCA Research
3. Gavekal expects bank earnings to recover next year as pre-provision profits are already showing signs of improvement.
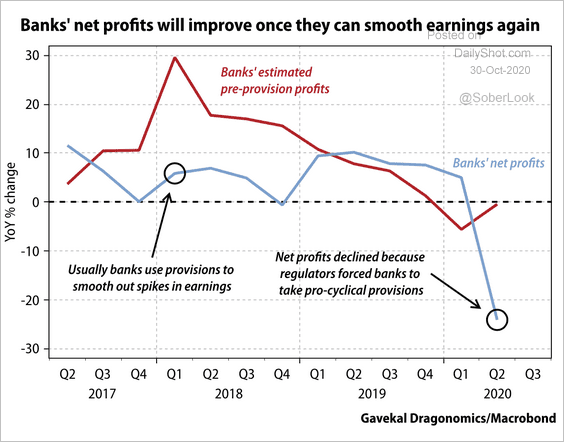 Source: Gavekal
Provisions and write-offs increased this year, mostly due to regulatory pressure.
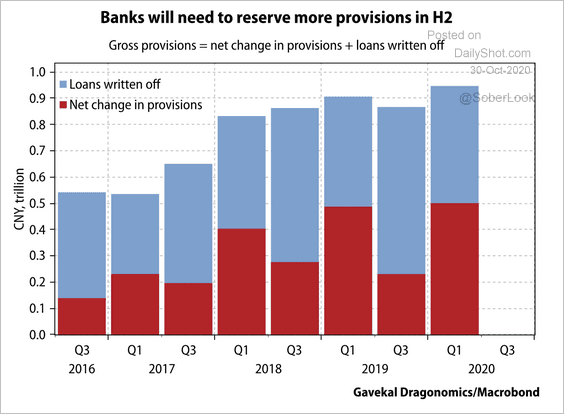 Source: Gavekal
——————–
4. Chinese production of various electronic goods has accelerated in recent months.
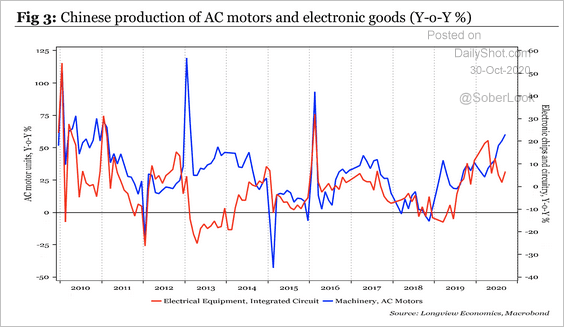 Source: Longview Economics
5. China’s imports from the US are falling further behind the Phase-1 deal targets.
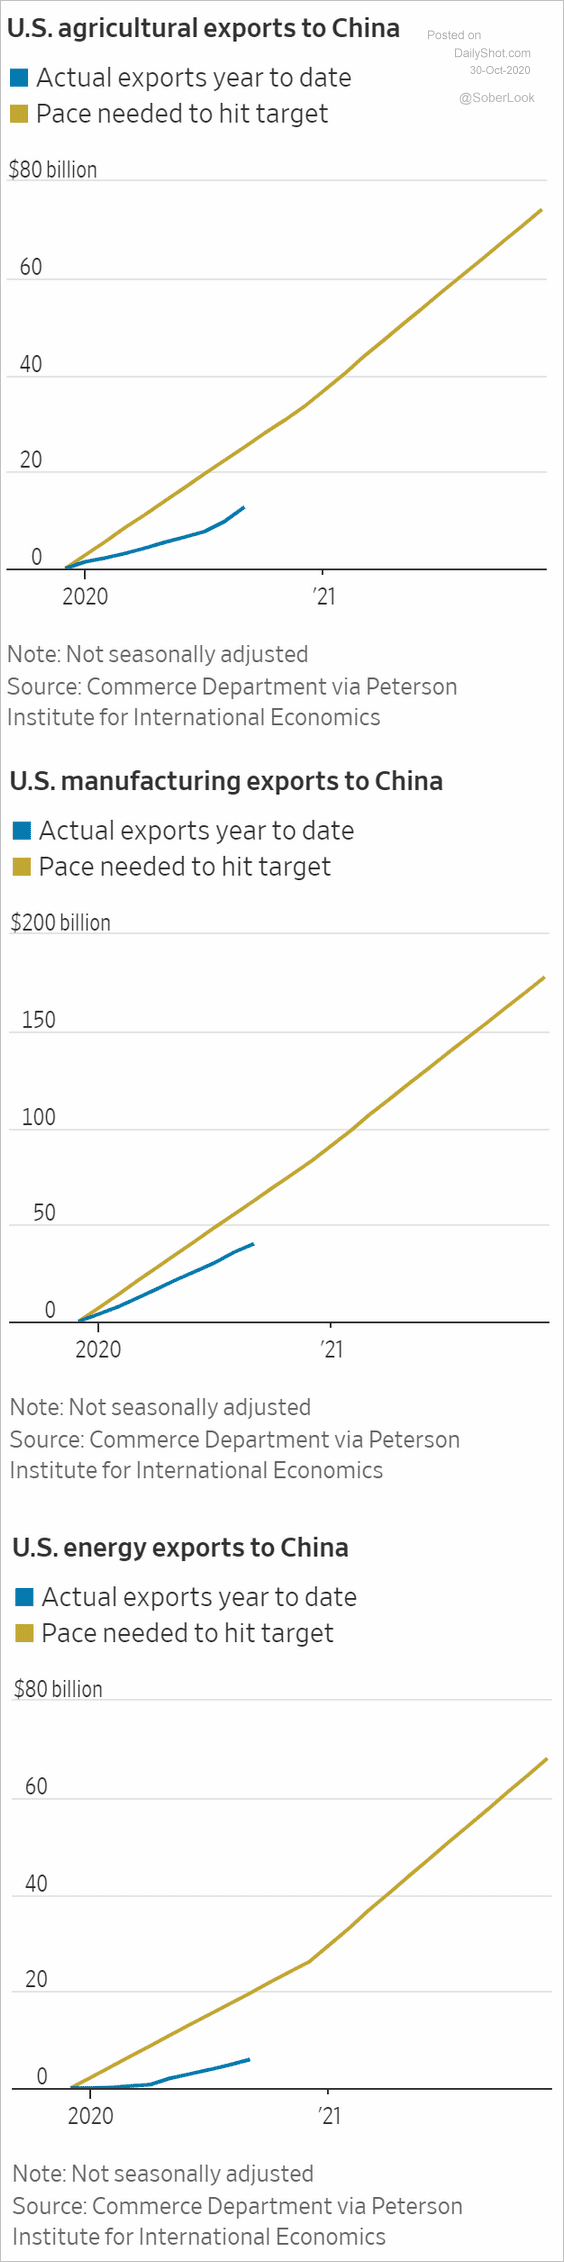 Source: @WSJ Read full article
6. China’s consumers mostly buy instant coffee.
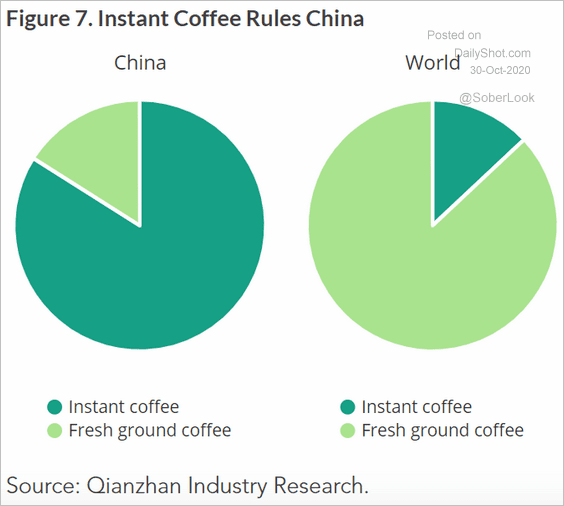 Source: @adam_tooze, MacroPolo Read full article
Emerging Markets
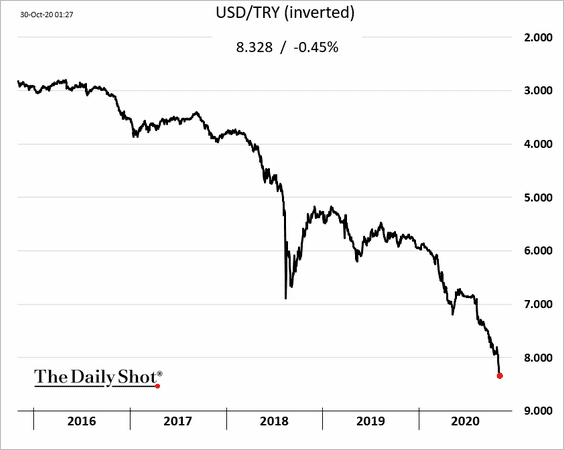
1. The Turkish lira selloff has been relentless. This is not going to end well.
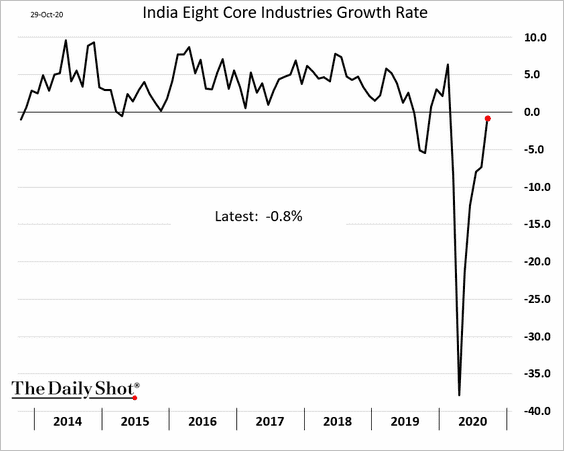
2. India’s key industries continue to recover.
Separately, lending growth in India remains weak despite lower rates.
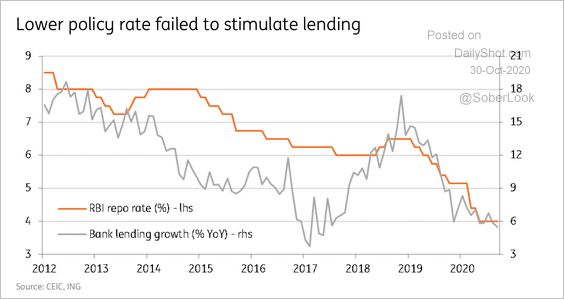 Source: ING
——————–
3. The Bank of Indonesia’s monetary operations have totaled roughly IDR 658 trillion, worth about 4.2% of GDP, according to ING.
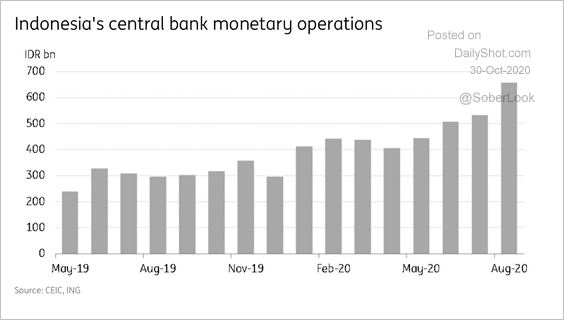 Source: ING
4. This chart shows direct fiscal support across Eastern and Central Europe.
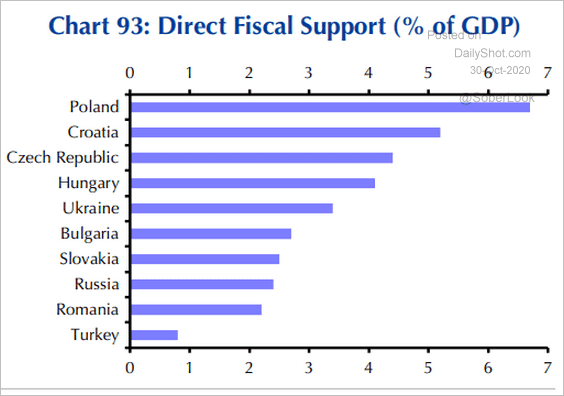 Source: Capital Economics
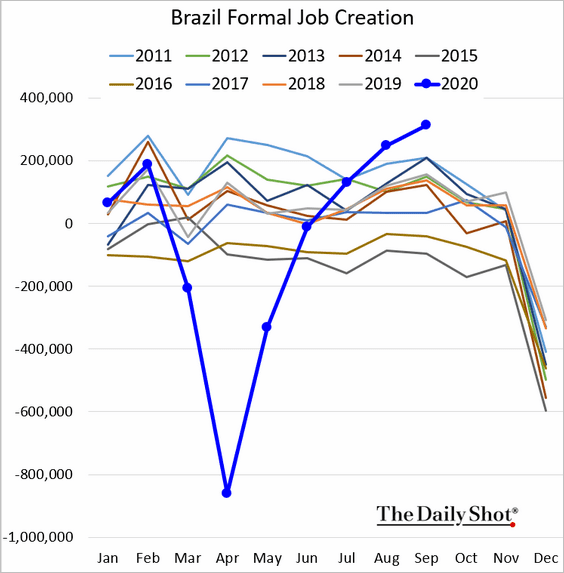
5. Brazil’s labor market continues to heal.
Commodities
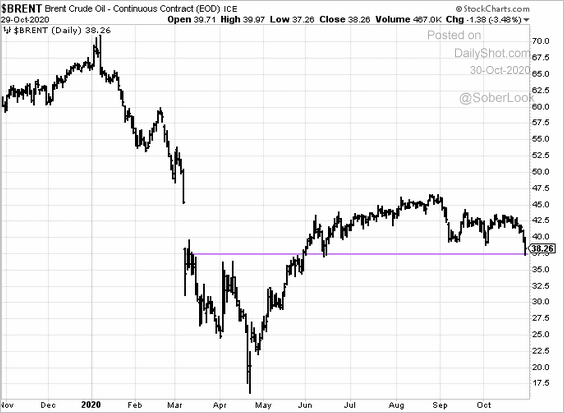
1. Brent crude hit the lowest level in months.
2. Central banks have been net sellers of gold.
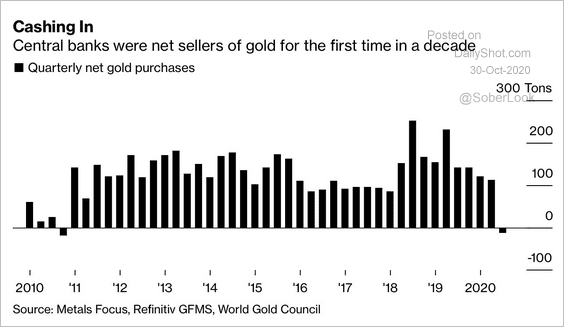 Source: @jessefelder, Bloomberg Read full article
3. Time for another commodities super-cycle?
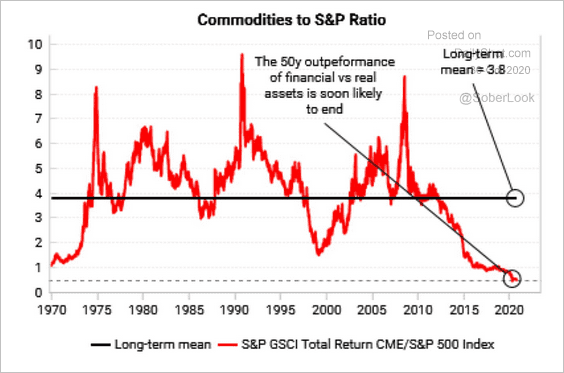 Source: @jessefelder, Bloomberg Read full article
4. US sugar futures held resistance.
 Source: barchart.com
5. Fitch expects a prolonged decrease in China’s grain and meat production, which will lead to rising domestic import demand.
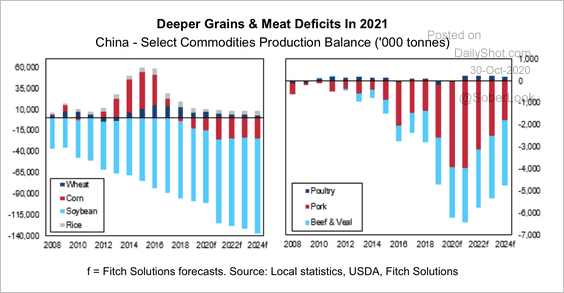 Source: Fitch Solutions Macro Research
Local grain prices in China are rising due to supply constraints.
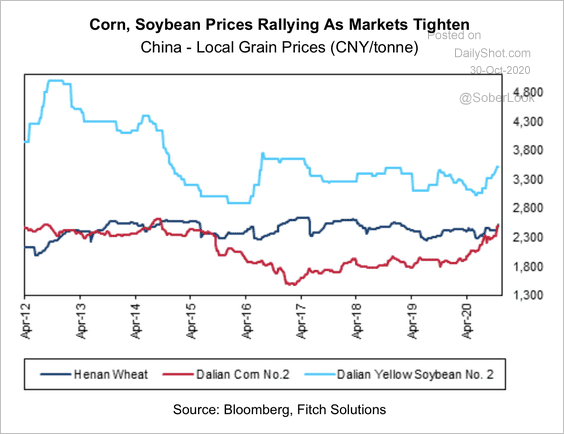 Source: Fitch Solutions Macro Research
Equities
1. US tech stocks have been priced to perfection.
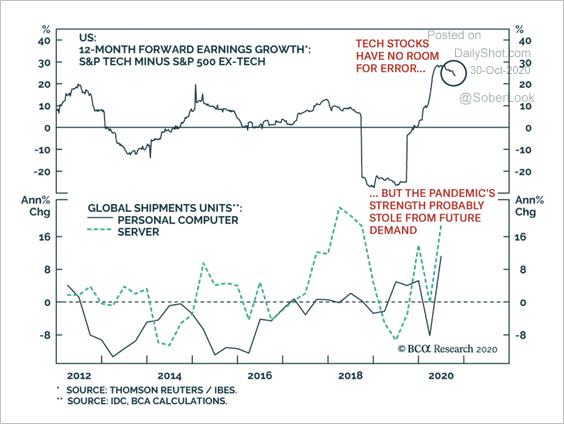 Source: BCA Research
Even what appears to be strong Q3 results may not be good enough to support lofty valuations.
 Source: @WSJ Read full article
While Alphabet’s stellar performance sent shares sharply higher after the close, …
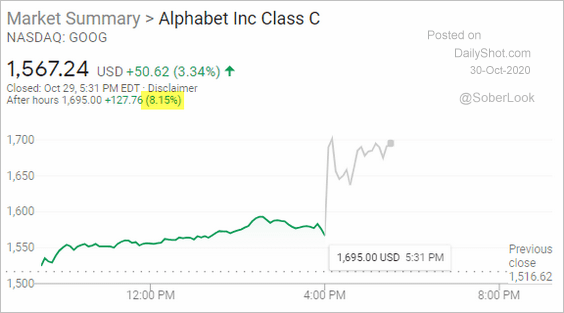 Source: google.com
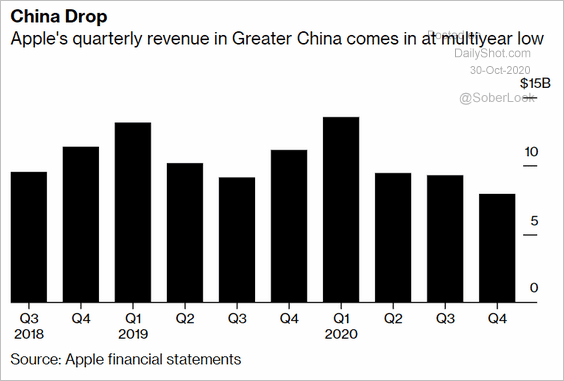
… it wasn’t the case for Apple.
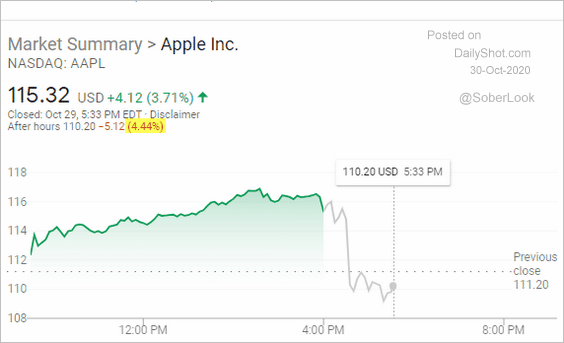 Source: google.com
Here is one concern, for example.
 Source: @technology Read full article
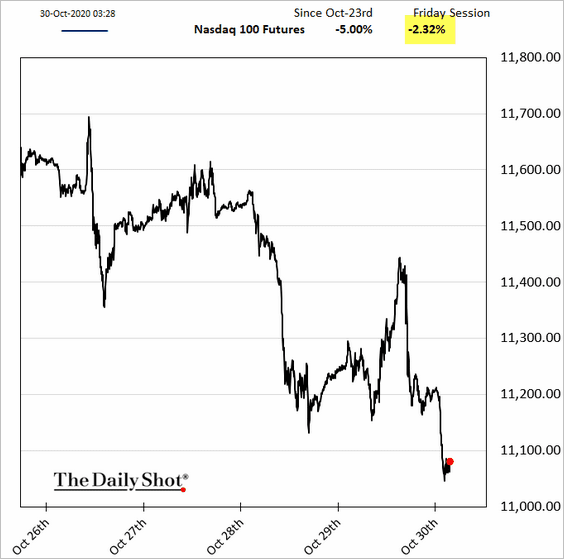
Amazon was also lower after reporting earnings.
Nasdaq 100 futures are heavy in early trading, pointing to a selloff.
——————–
2. Small caps had a good month (relative to large caps) as investors bet on Democrat-sponsored stimulus.
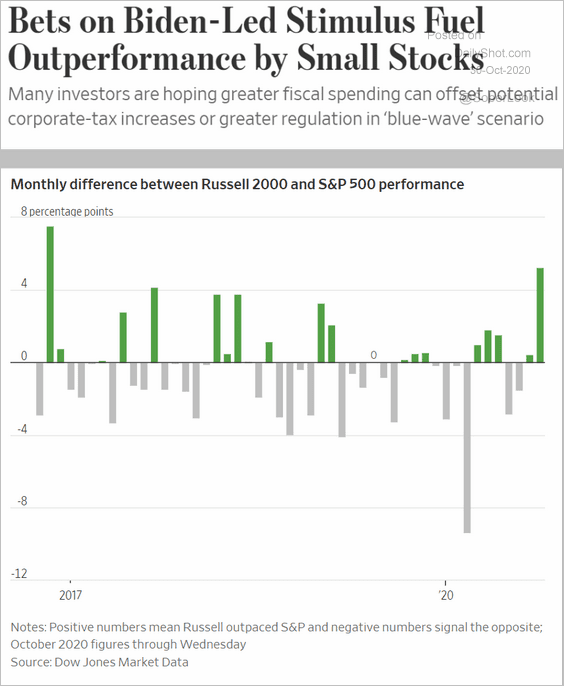 Source: @WSJ Read full article
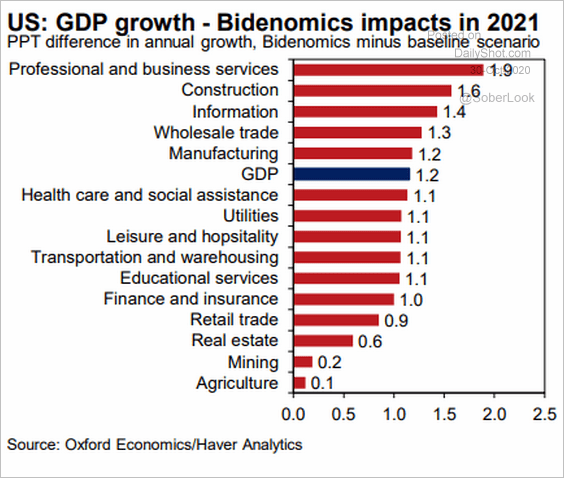 Source: @OxfordEconomics, @OrenKlachkin Read full article
Other stocks that would benefit from a Biden win have also outperformed.
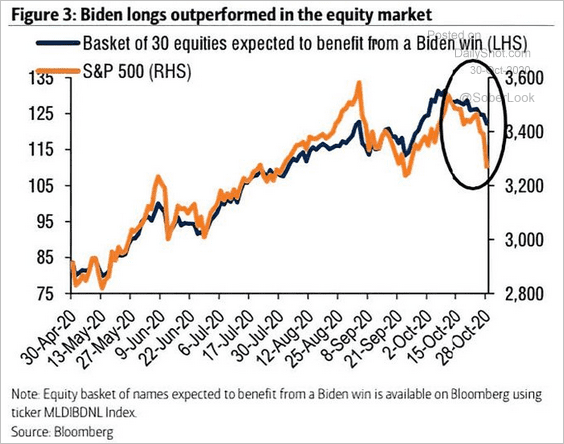 Source: @ISABELNET_SA, @BofAML
——————–
3. Analysts now expect smaller earnings declines in 2020 and a slightly weaker recovery in 2021.
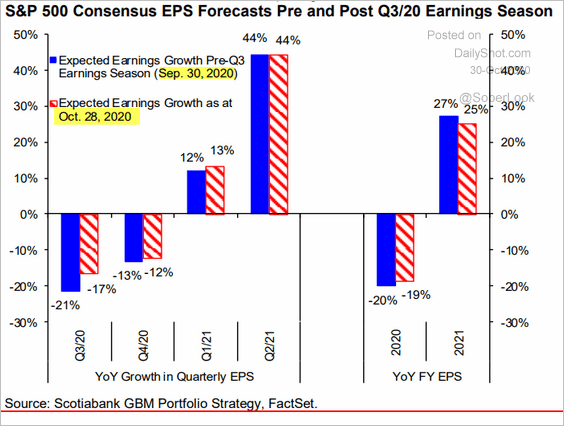 Source: Hugo Ste-Marie, Portfolio & Quantitative Strategy Global Equity Research, Scotia Capital
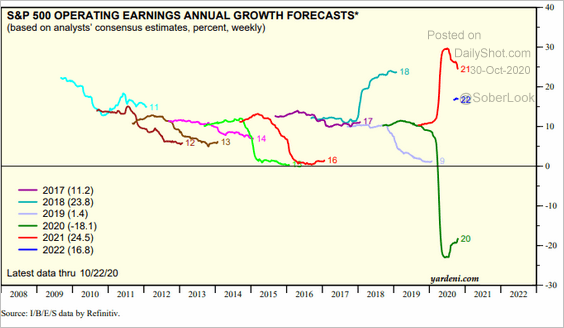 Source: Yardeni Research
——————–
4. When VIX spikes above 40, it often stays there for a few days (vol autocorrelation).
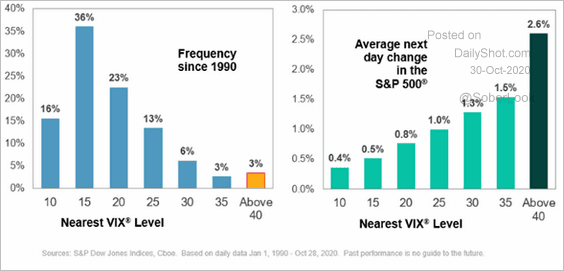 Source: S&P Global Market Intelligence
Global Developments
1. Let’s start with some GDP forecasts.
• 2020 forecasts:
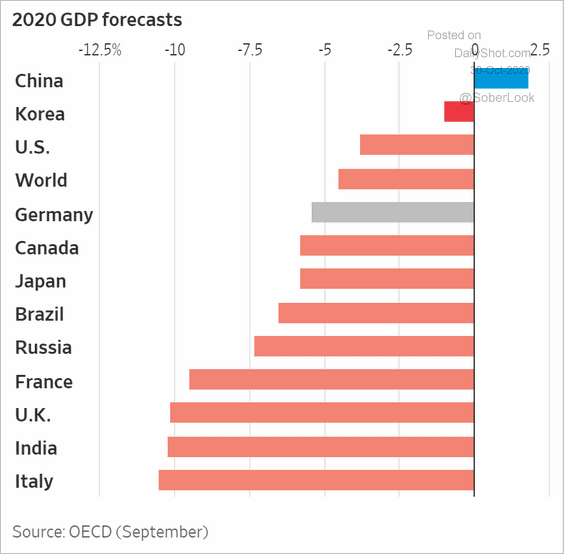 Source: @WSJ Read full article
• GDP trajectory expectations (IMF):
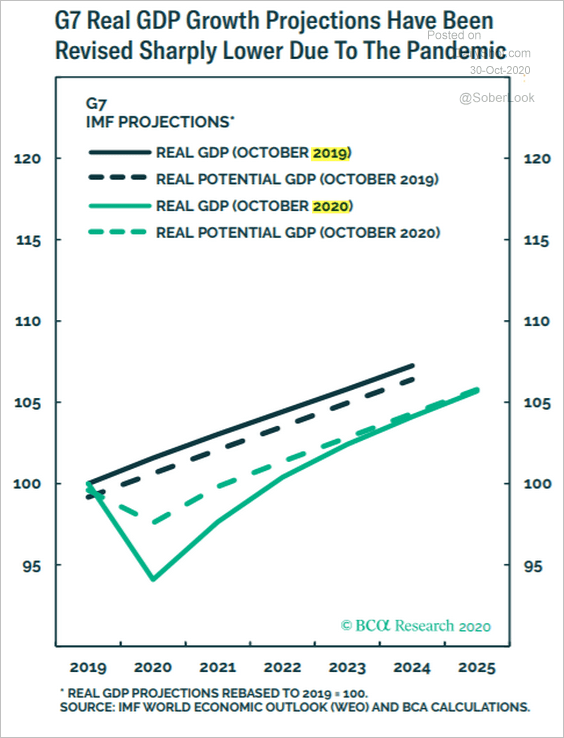 Source: BCA Research
——————–
2. Who are the largest semiconductor manufacturers?
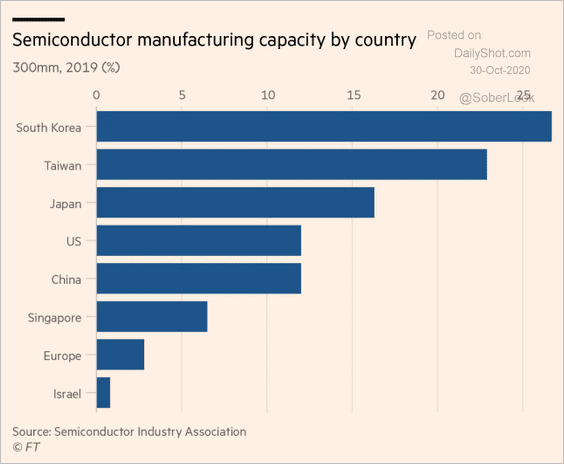 Source: @financialtimes Read full article
3. Sovereign wealth funds are staying away from US and European real estate.
![]() Source: SWFI Read full article
Source: SWFI Read full article
4. Global trade is rebounding.
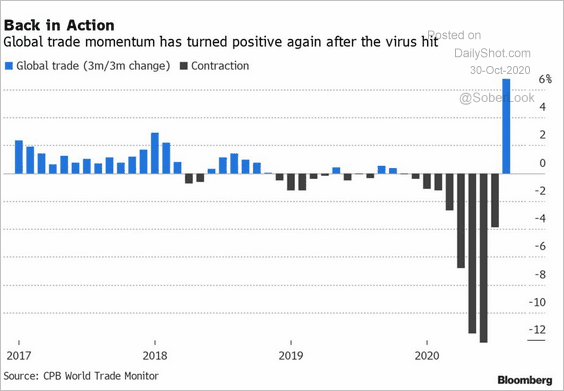 Source: @markets Read full article
——————–
Food for Thought
1. US state and local employment:
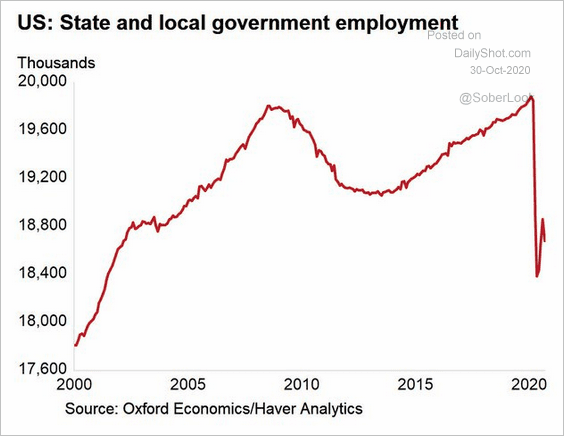 Source: @GregDaco
2. Warehouse jobs:
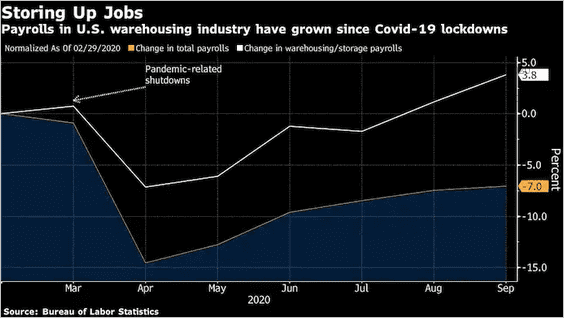 Source: @business Read full article
3. Child-care provider’s status:
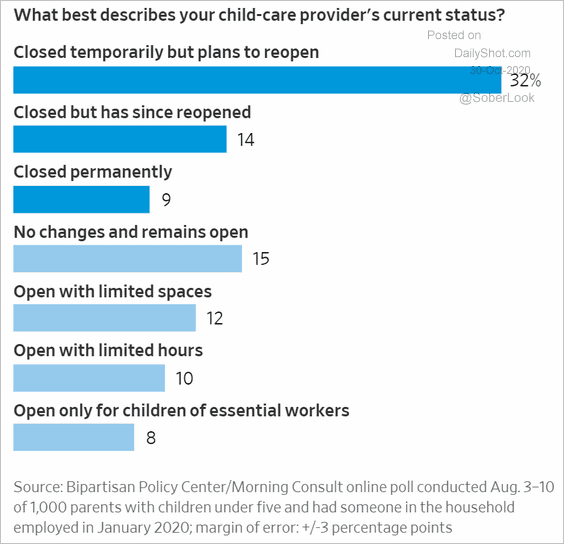 Source: @WSJ Read full article
4. US military presence in the Persian Gulf:
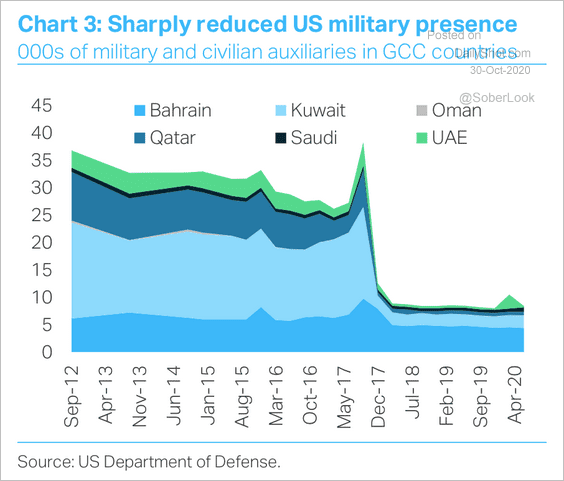 Source: TS Lombard
5. Preference for president by gender, race, and education:
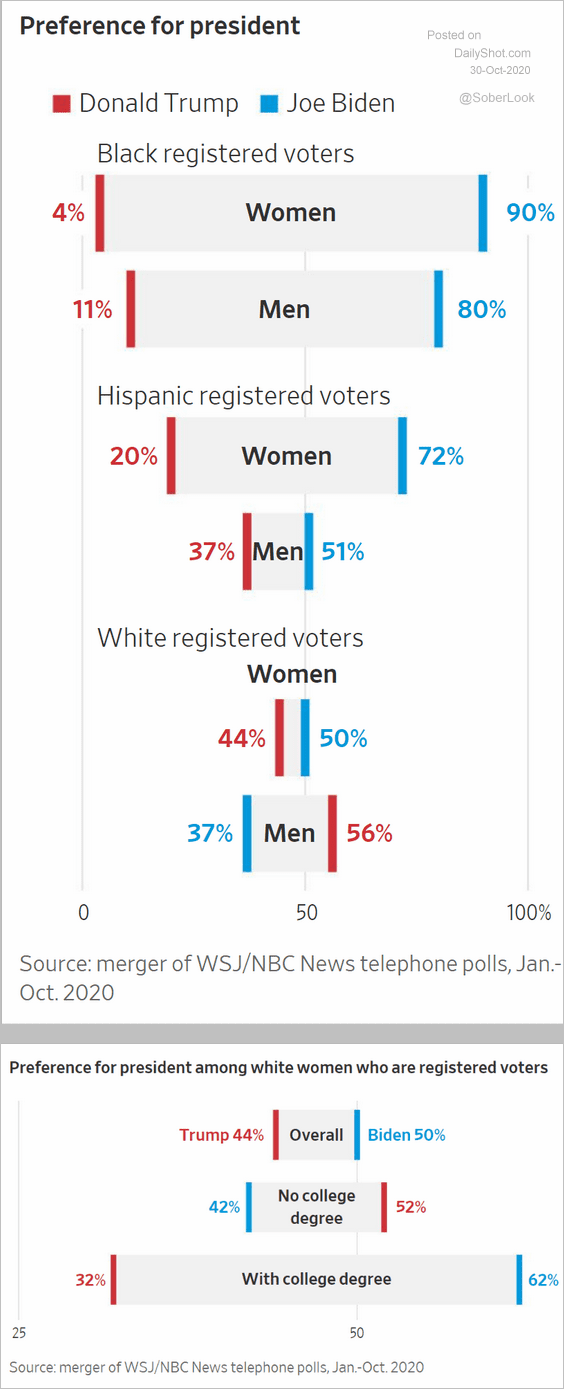 Source: @WSJ Read full article
6. Voter regret:
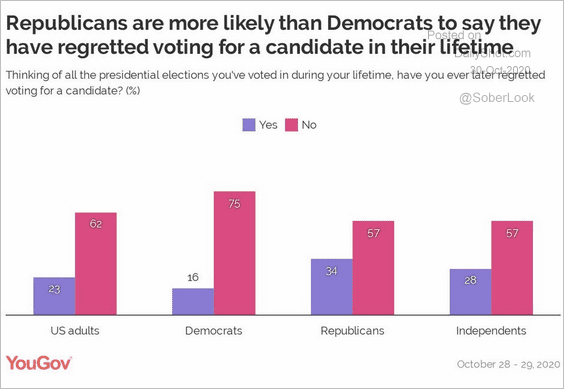 Source: YouGov Read full article
7. World leaders that contacted COVID:
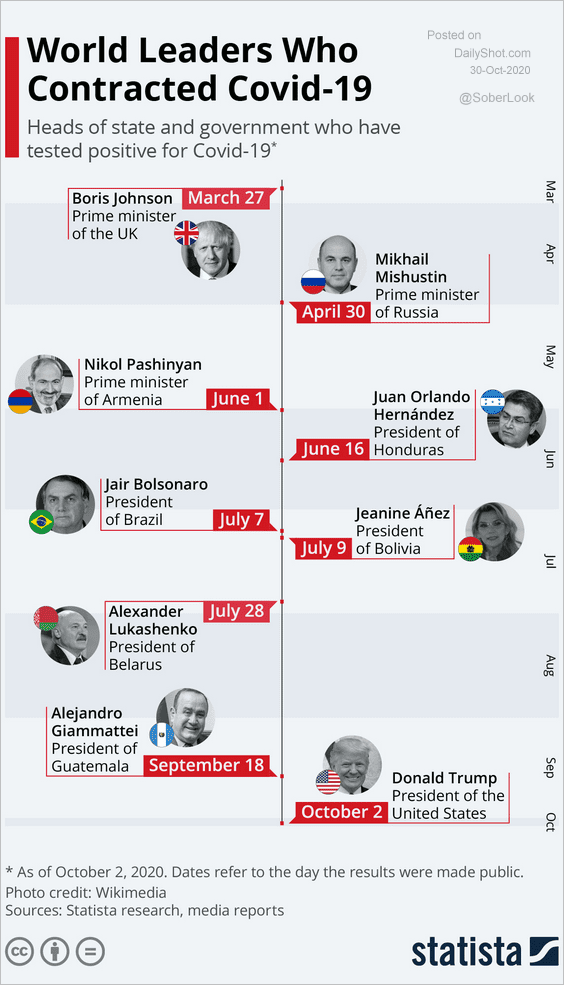 Source: Statista
8. Views on trick-or-treating:
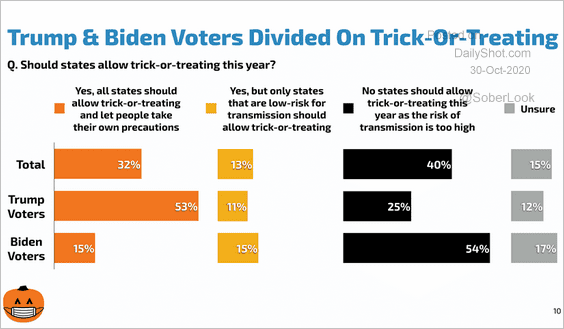 Source: Echelon Insights
9. Halloween costumes:
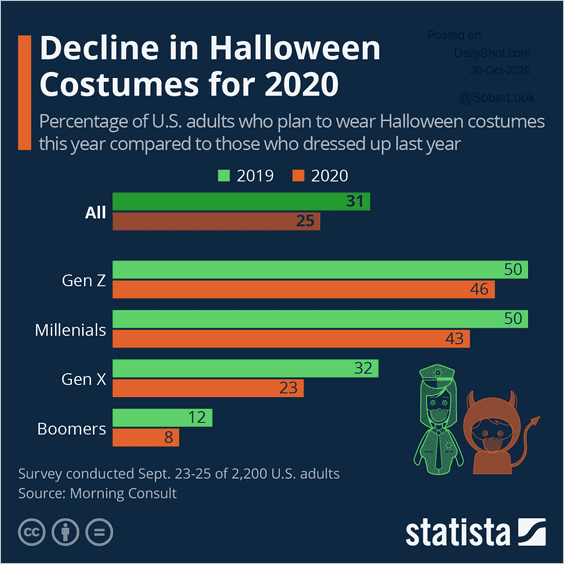 Source: Statista
——————–
Have a great weekend!