
The Daily Shot: 10-Dec-20
• The United States
• The United Kingdom
• The Eurozone
• Japan
• Asia – Pacific
• China
• Emerging Markets
• Cryptocurrency
• Commodities
• Energy
• Equities
• Global Developments
• Food for Thought
The United States
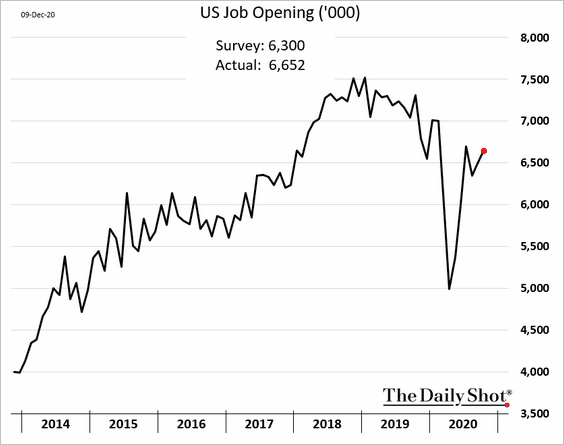
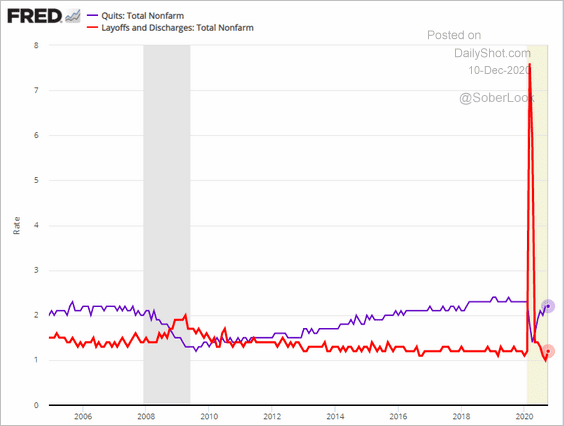
1. Job openings firmed up in October.
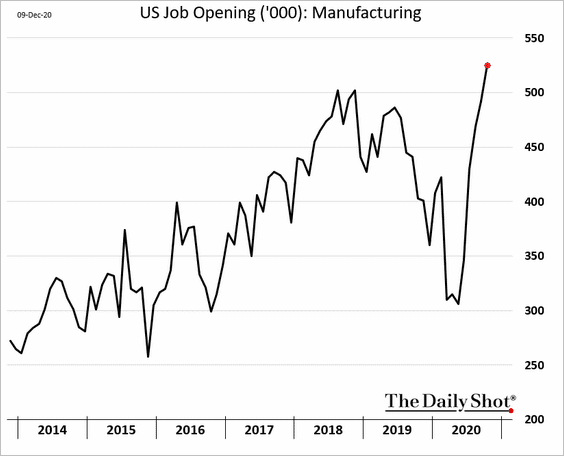
• Demand for factory workers hit a new high.
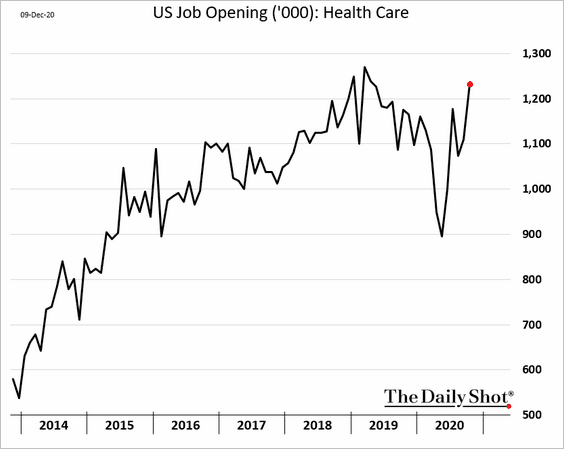
• Healthcare vacancies continue to strengthen.
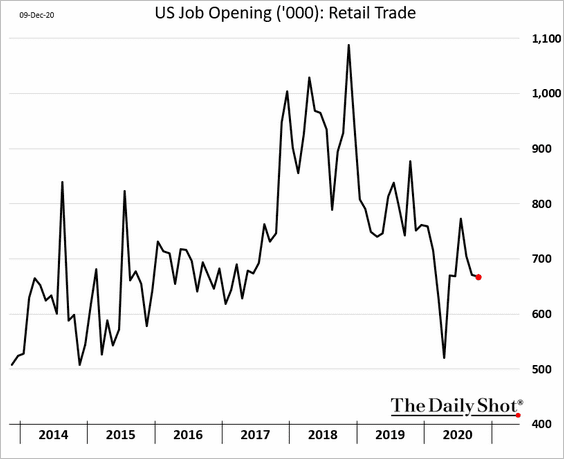
• However, job openings in retail have been moderating.
• Layoffs ticked higher, while the quit rate (voluntary resignations) has nearly recovered to pre-pandemic levels.
• Here is the Beveridge curve (job openings vs. the unemployment rate). This labor market downturn has been very different from the financial crisis.
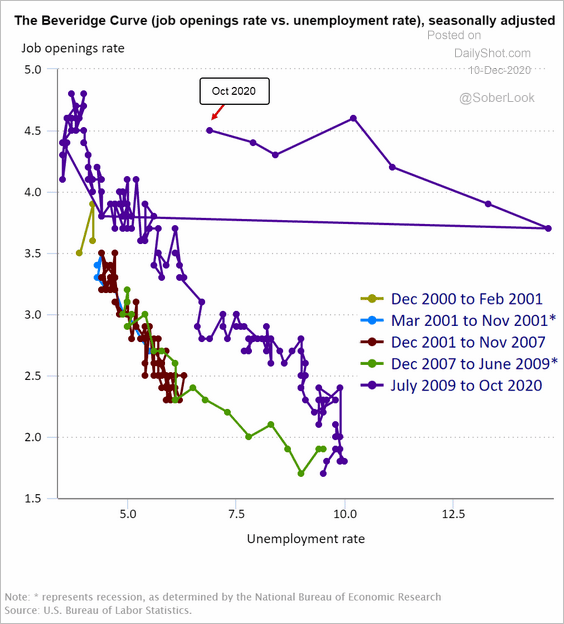 Source: BLS
——————–
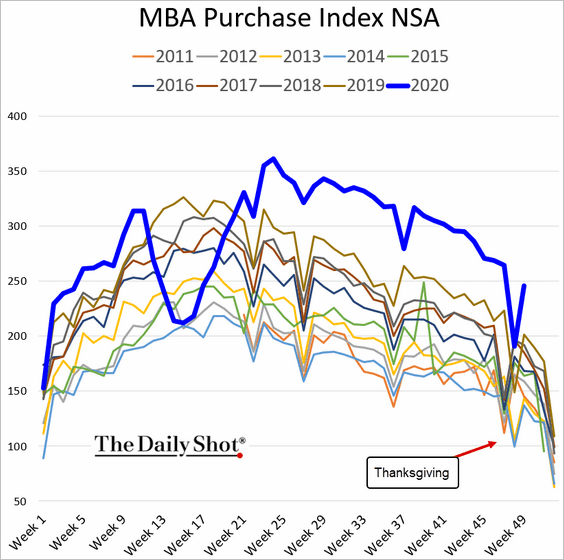
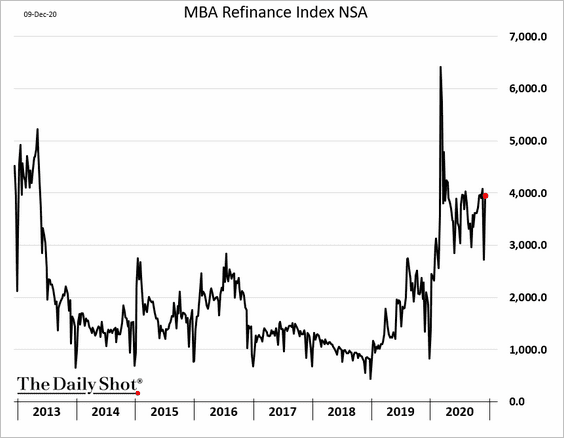
2. Post-Thanksgiving mortgage activity remained robust.
• House purchase applications:
• Refinance applications:
——————–
3. The migration out of highly populated areas is showing up in rent inflation data.
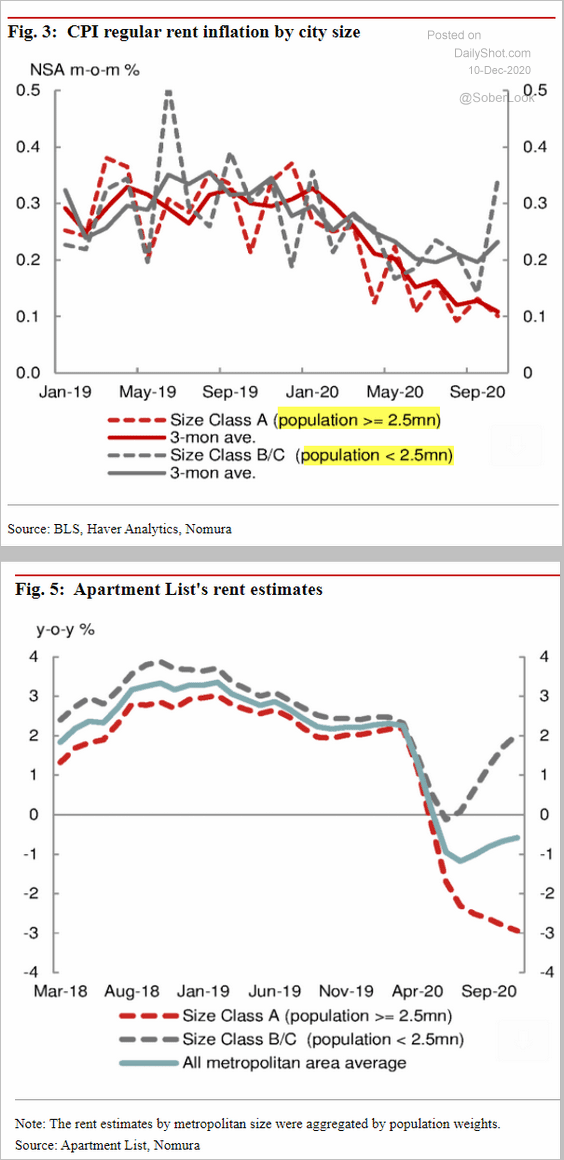 Source: Nomura Securities
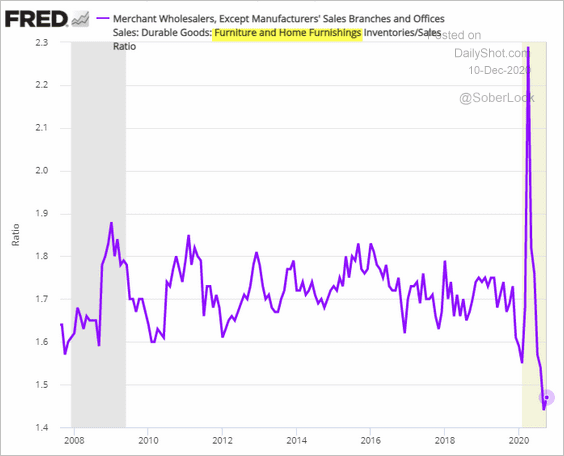
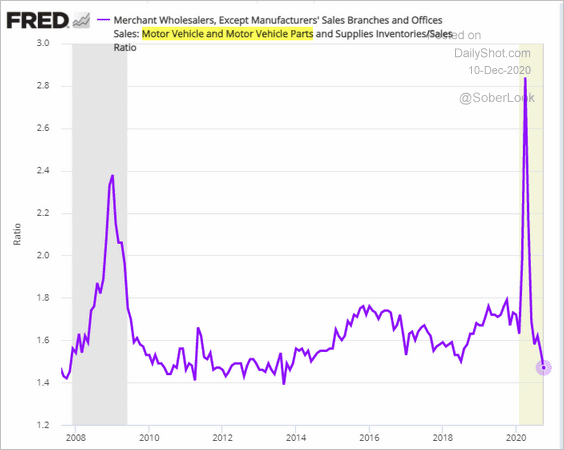
4. As discussed previously (see chart), inventories in many industries are relatively low. The largest inventory declines have been in durable goods sectors related to housing and autos.
• Furniture inventories-to-sales ratio:
• Vehicles inventories-to-sales ratio:
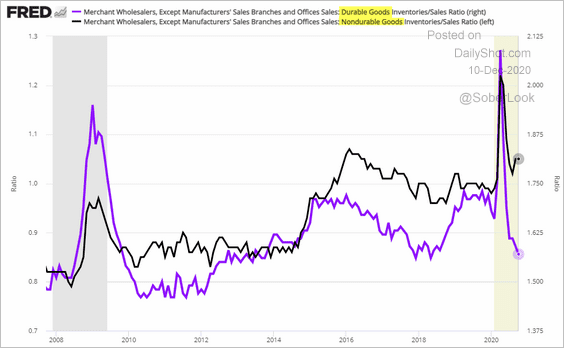
Nondurable goods, on the other hand, include items such as petroleum. That’s why we see this massive divergence in inventory trends for durables and nondurables.
——————–
5. Consumer confidence among higher-income Americans is recovering. That’s not the case for those in the lower-income brackets.
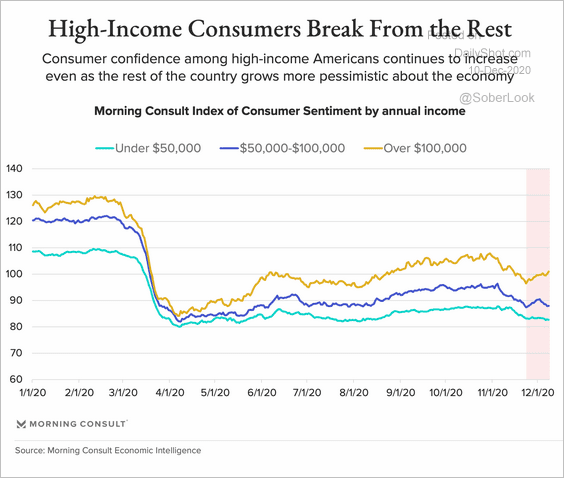 Source: Morning Consult Read full article
6. Here are some high-frequency indicators.
• The Oxford Economics Recovery Tracker (pulled lower by the deteriorating health situation):
![]() Source: @GregDaco, @OxfordEconomics
Source: @GregDaco, @OxfordEconomics
• Office occupancy:
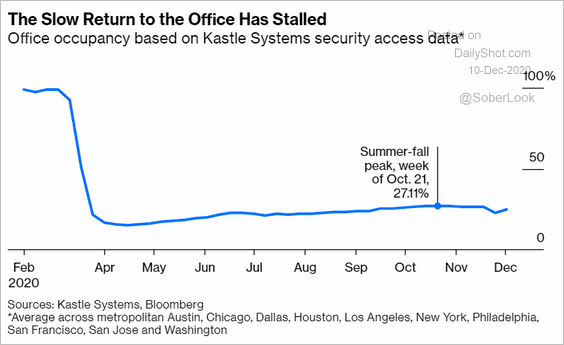 Source: @bopinion Read full article
• Restaurant reservations:
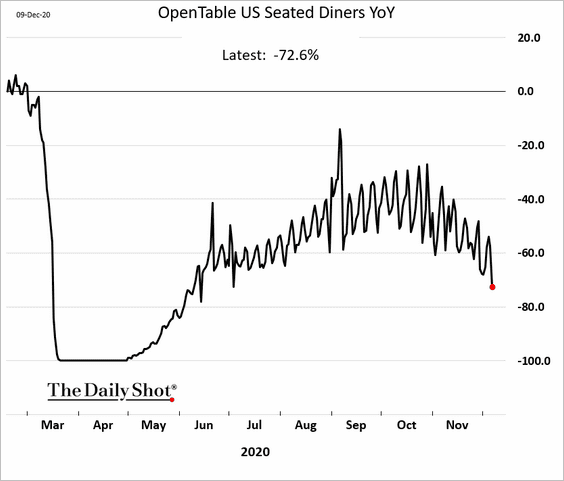 h/t @LizAnnSonders
The United Kingdom
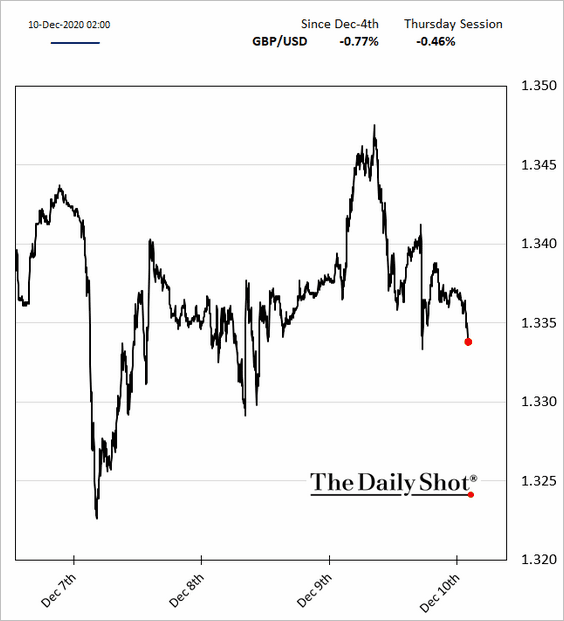
1. A trade deal remains elusive for now.
 Source: BBC Read full article
The pound is softer this morning.
The three-week EUR/GBP risk reversal, which would take us into the year-end, hit the highest level since the referendum.
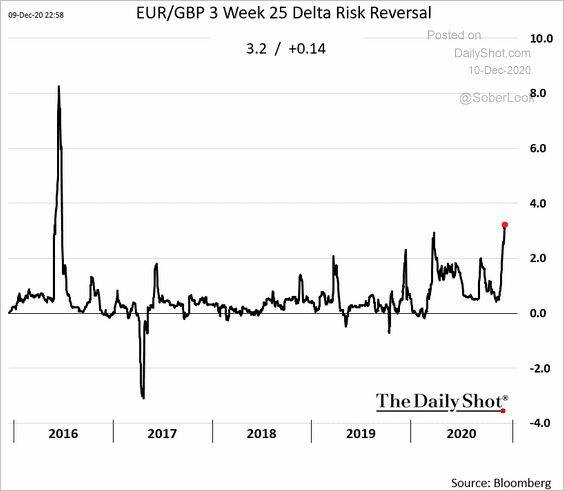 h/t @greg_ritchie Read full article
——————–
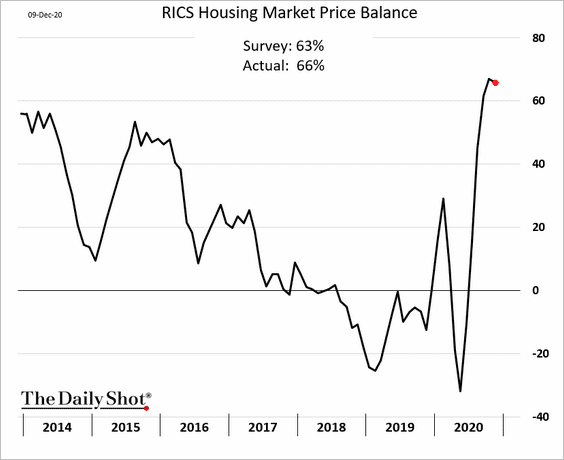
2. The RICS housing index surprised to the upside as home prices continue to climb.
The Eurozone
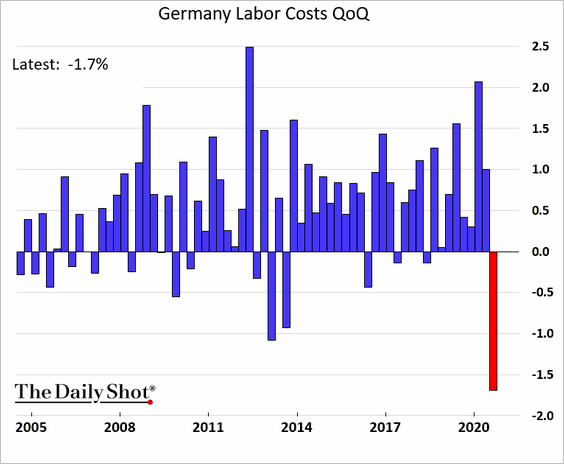
1. Let’s begin with Germany.
• Labor costs tumbled last quarter.
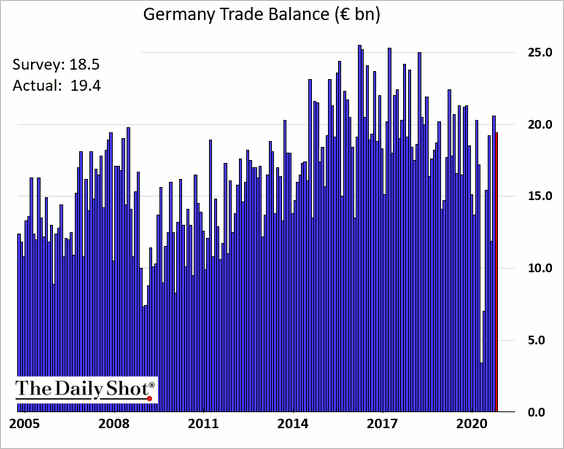
• The trade surplus topped economists’ forecast.
——————–
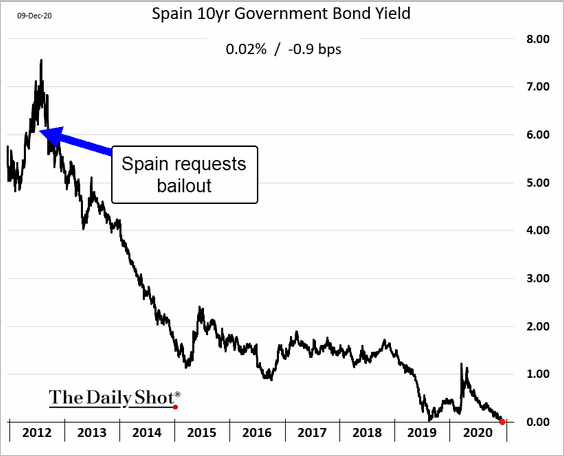
2. Spanish industrial output continues to recover (as of October).
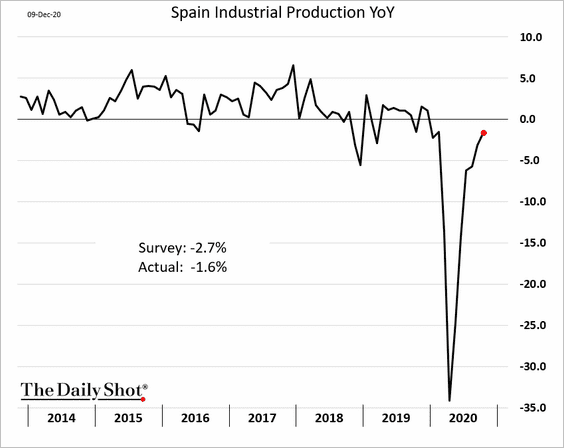
The 10-year Spanish government bond yield is testing support at zero.
——————–
3. Here is a forecast for the ECB’s balance sheet from Pantheon Macroeconomics.
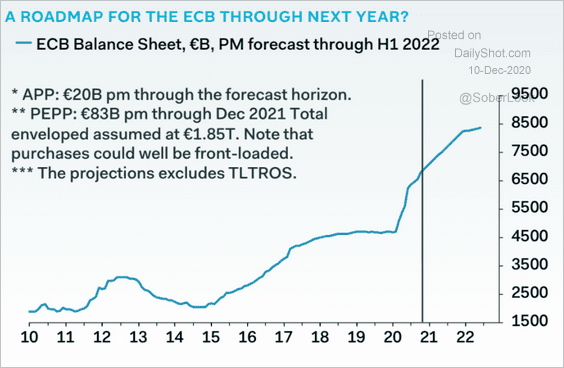 Source: Pantheon Macroeconomics
Japan
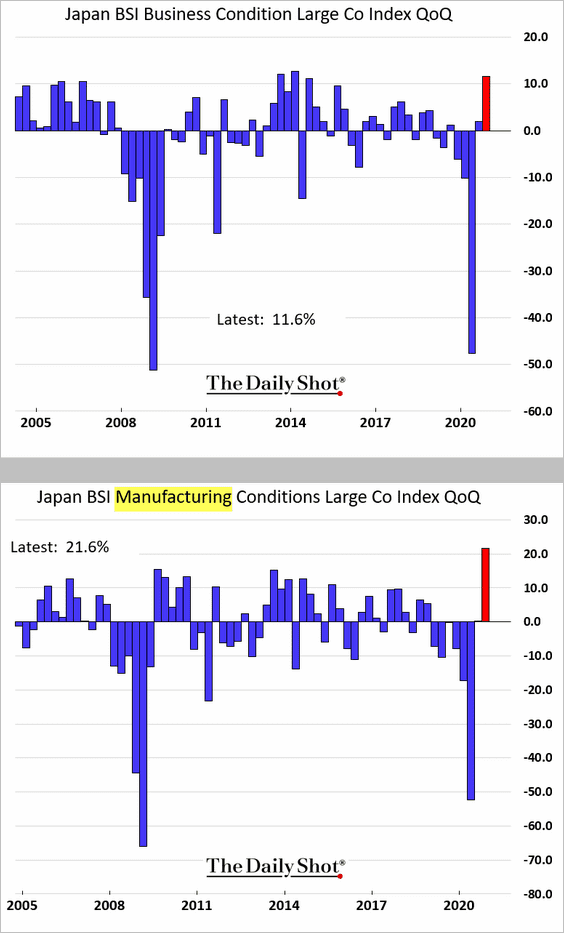
1. Business sentiment improved sharply this quarter, especially among manufacturers.
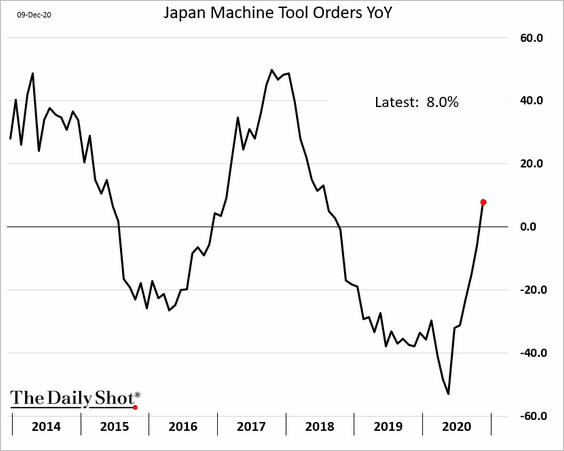
2. Machine tool orders are rebounding.
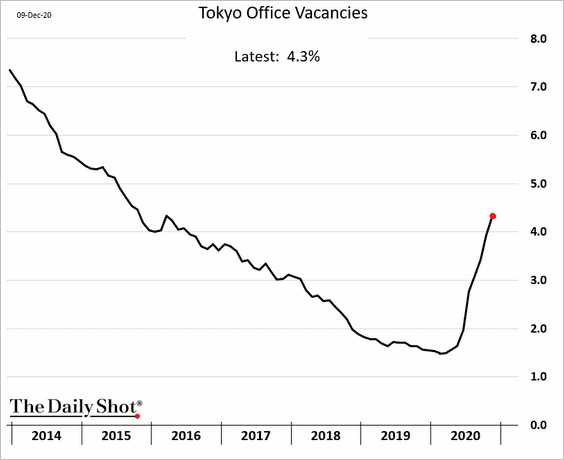
3. The Tokyo office vacancy rate is grinding higher.
4. Medium to long-term inflation expectations have weakened as prices continue to stagnate (two charts).
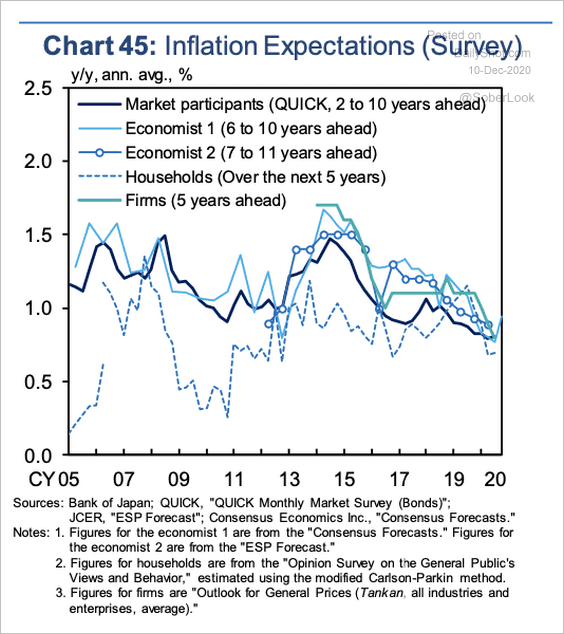 Source: Bank of Japan
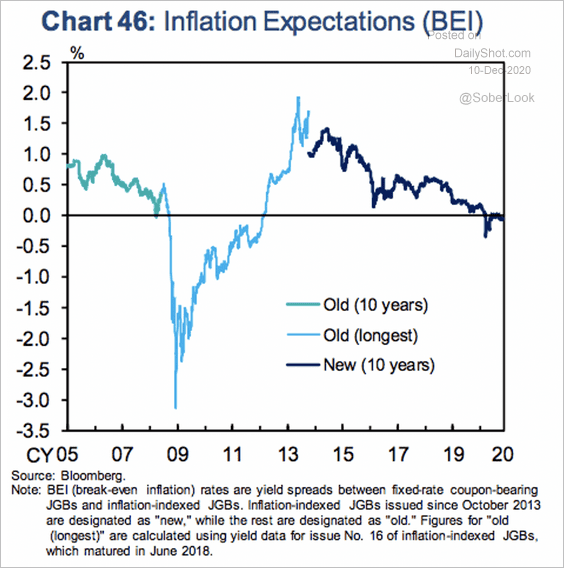 Source: Bank of Japan
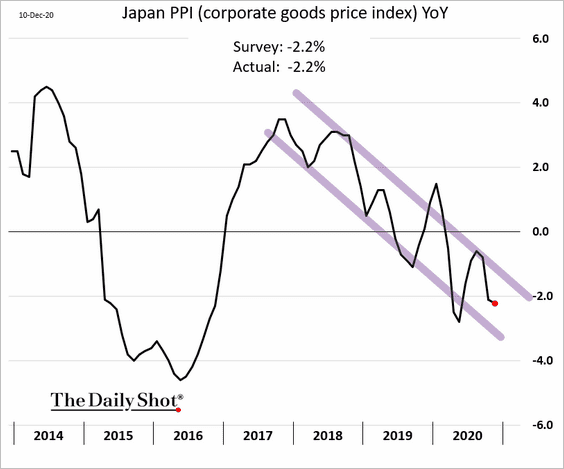
5. Producer prices are trending lower.
——————–
6. The BoJ has been supporting Japan’s corporate finance markets.
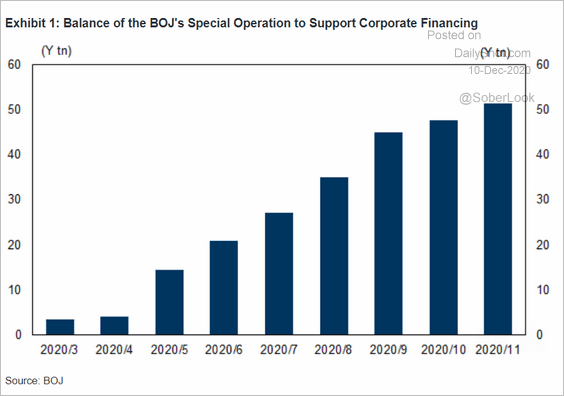 Source: Goldman Sachs
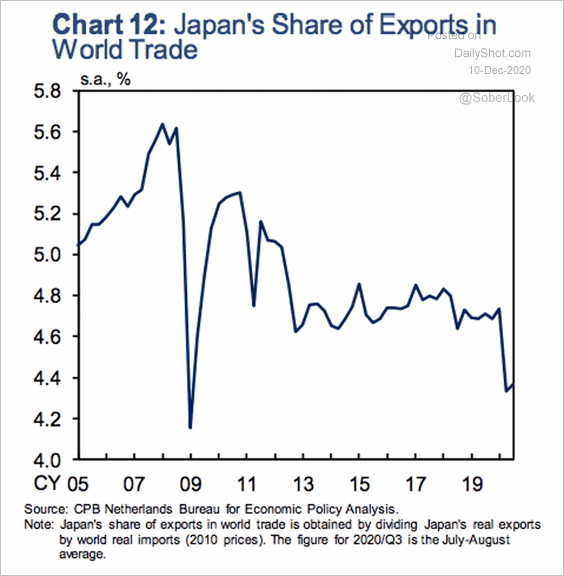
7. Japan’s share of exports in world trade has been trending lower over the past decade.
 Source: Bank of Japan
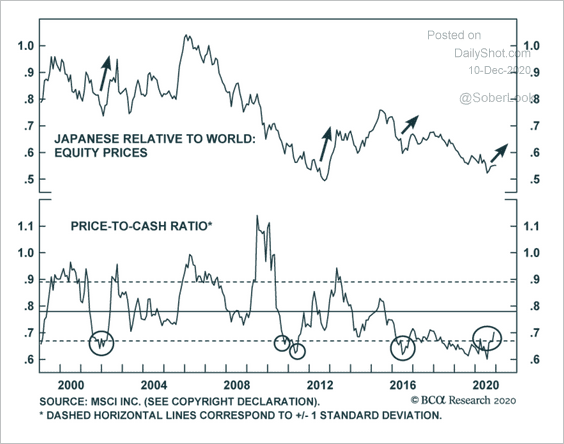
8. A low price-to-cash ratio suggests continued outperformance of Japanese equities.
 Source: BCA Research
9. Japan’s hydrogen fuel-cell car target is impressive.
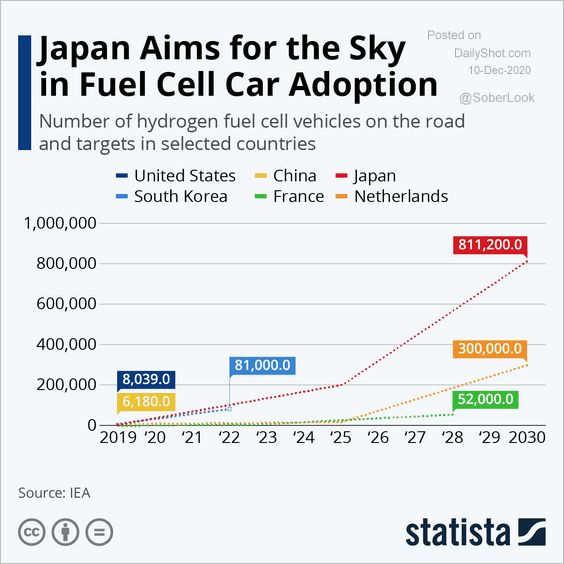 Source: Statista
Asia – Pacific
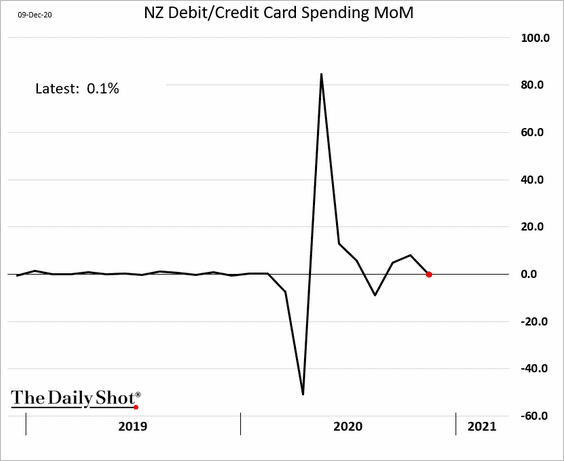
1. New Zealand’s credit card spending was flat in November.
2. Taiwan’s stock trading volume hit a multi-year high.
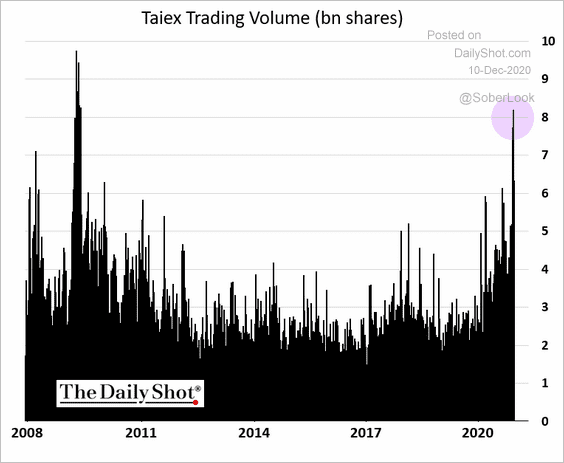 h/t @heguisen
3. Asian countries are increasing their market share of luxury store openings.
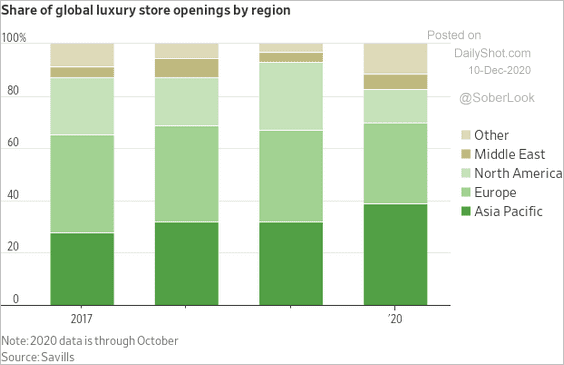 Source: @WSJ Read full article
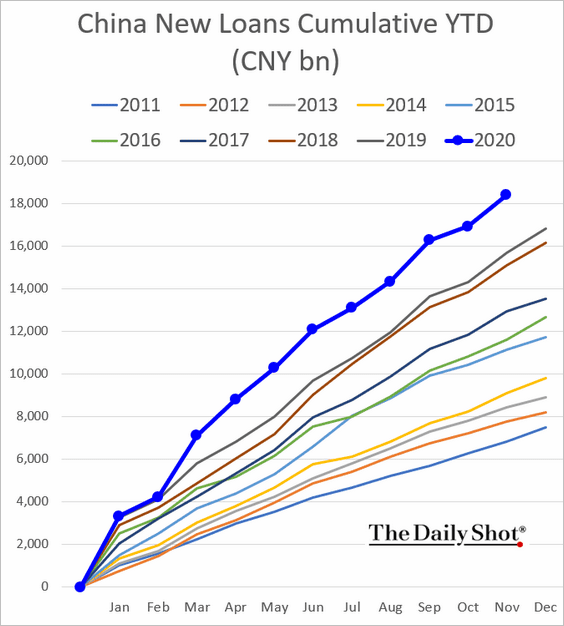
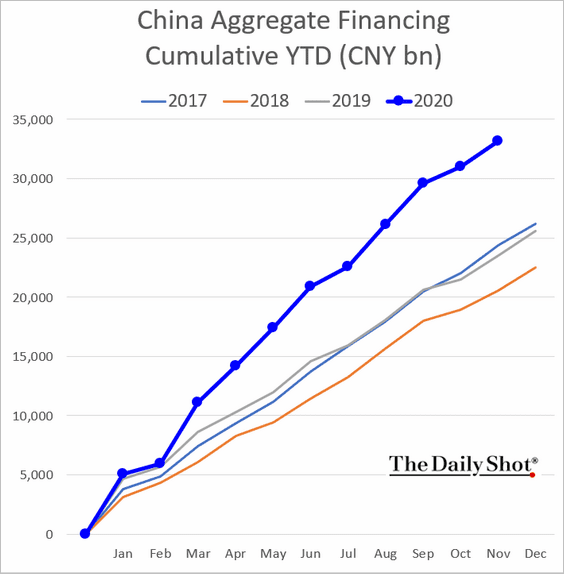
China
1. Credit growth remains robust, with the year-to-date trend well above last year’s levels.
– Bank loans:
– Aggregate financing (including bonds):
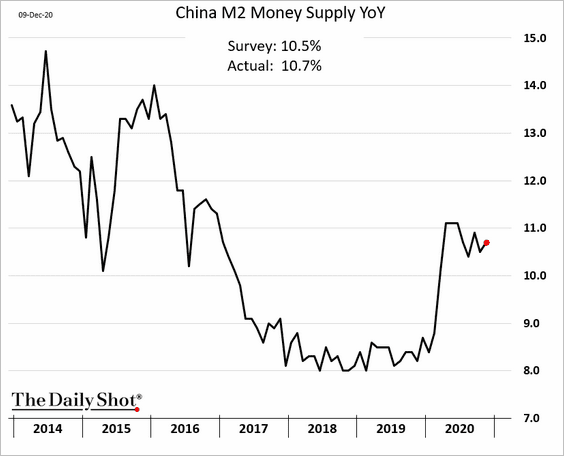
• Here is the broad money supply growth.
• This chart shows China’s bank assets as a percentage of the GDP.
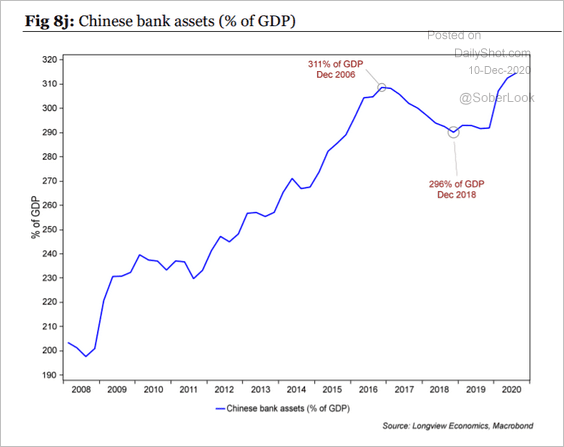 Source: Longview Economics
• This year’s accumulation in China’s household debt has been impressive.
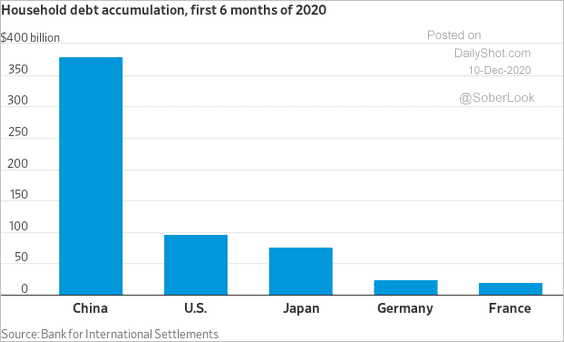 Source: @WSJ Read full article
• Morgan Stanley expects China’s credit impulse to slow next year.
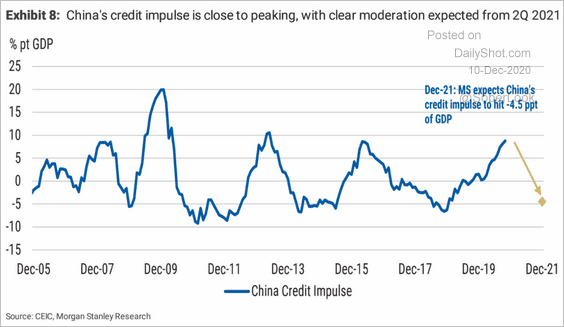 Source: Morgan Stanley Research
——————–
2. The recent surge in household savings is starting to normalize.
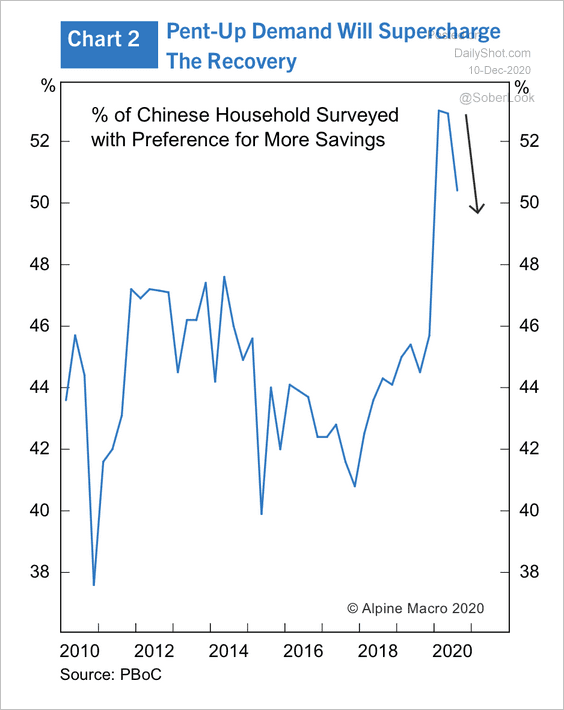 Source: Alpine Macro
3. Lockups on substantial amounts of China’s stock holdings will be ending shortly, which could put some pressure on the market.
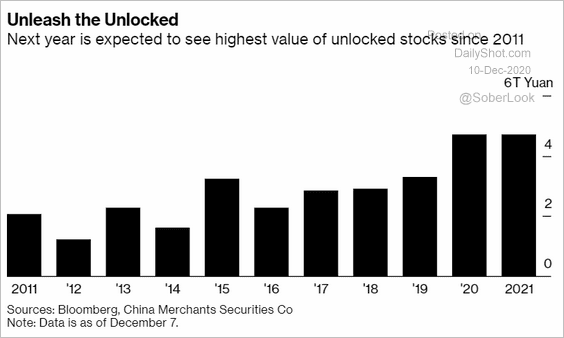 Source: @markets Read full article
4. Imports from the US continue to lag the Phase-1 deal target.
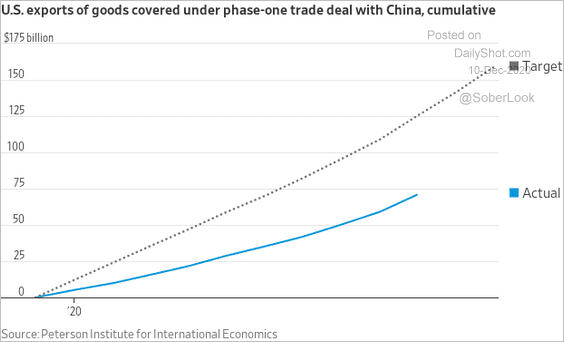 Source: @WSJ Read full article
Separately, here is China’s share of global exports.
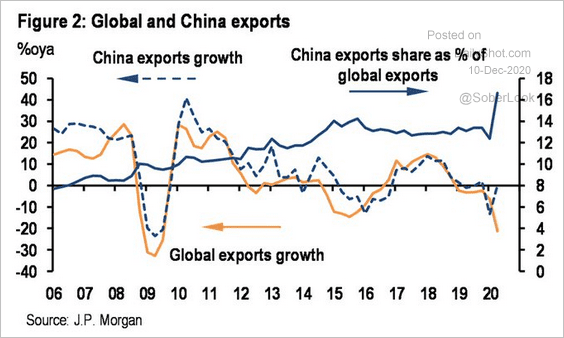 Source: @dlacalle_IA
——————–
5. Next, we have some updates on Hong Kong.
• The government’s fiscal relief package has been modest compared to the US.
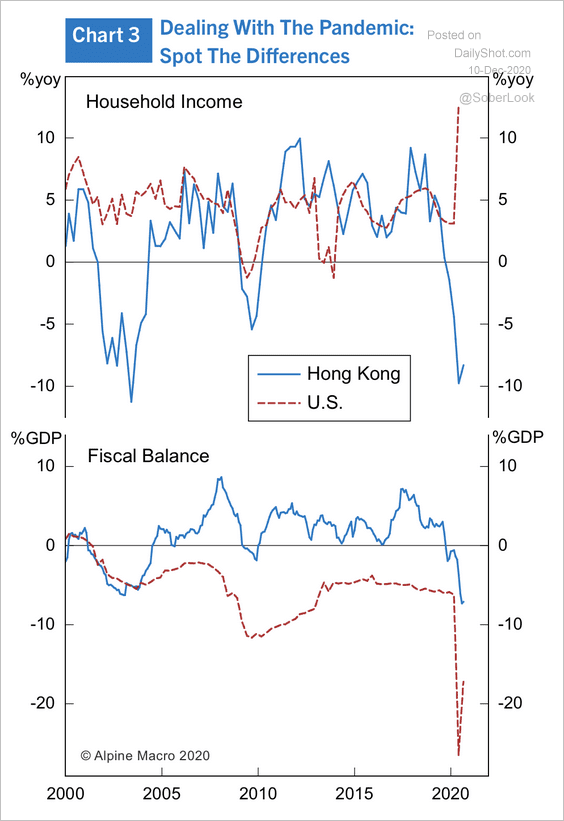 Source: Alpine Macro
• Further weakness in the Hong Kong dollar (REER) could support equity market outperformance.
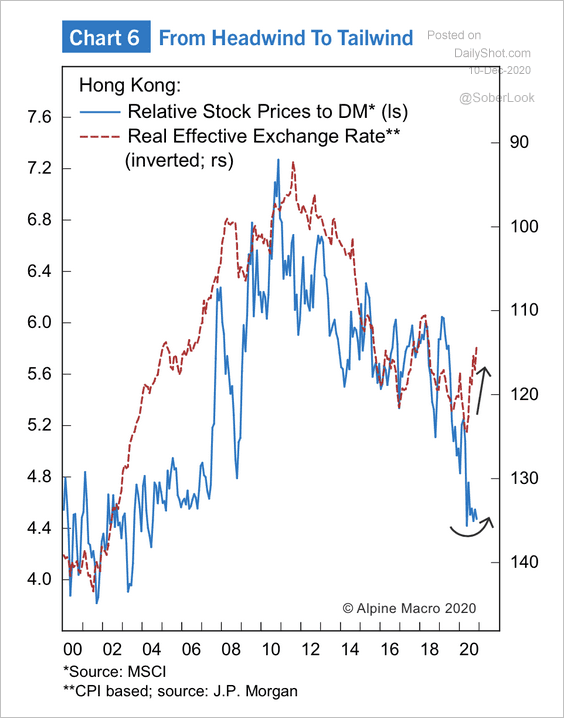 Source: Alpine Macro
Fundamentals are supportive of Hong Kong property stocks.
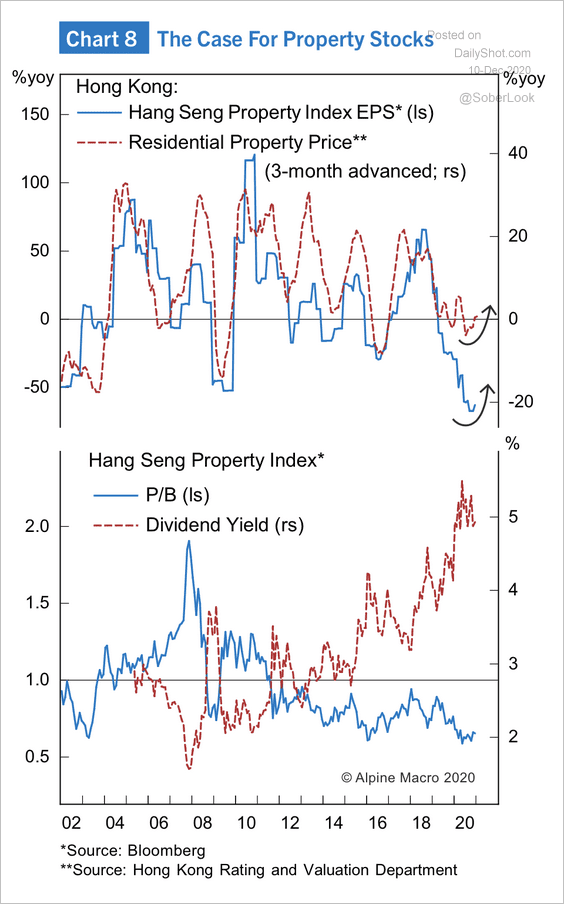 Source: Alpine Macro
• Hong Kong residents are increasingly applying for UK passports.
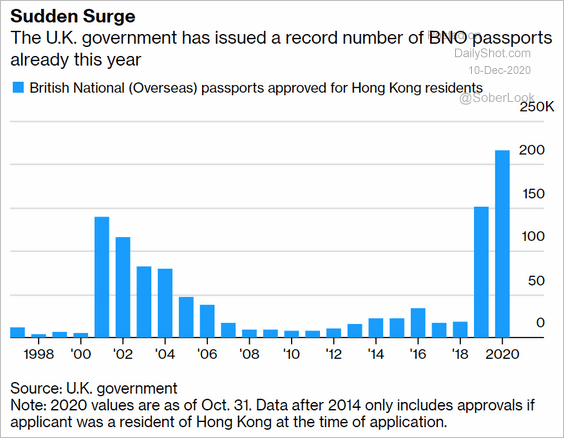 Source: @business Read full article
Emerging Markets
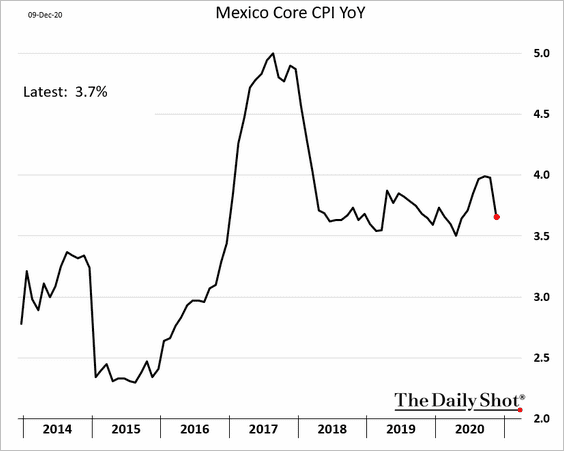
1. Mexico’s inflation appears to be slowing.
2. Latin America has been devastated by COVID.
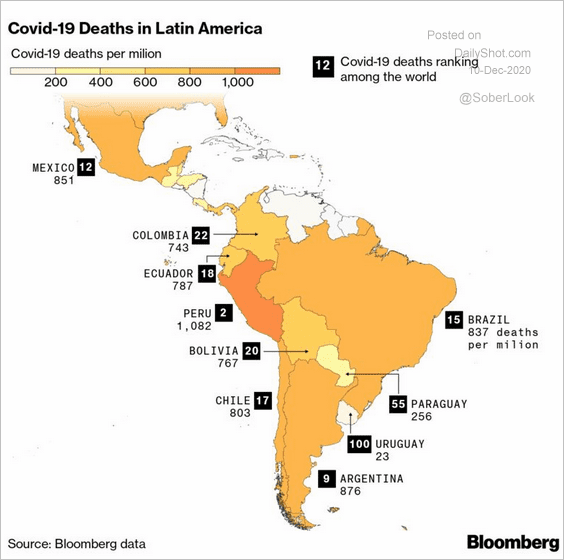 Source: @bpolitics Read full article
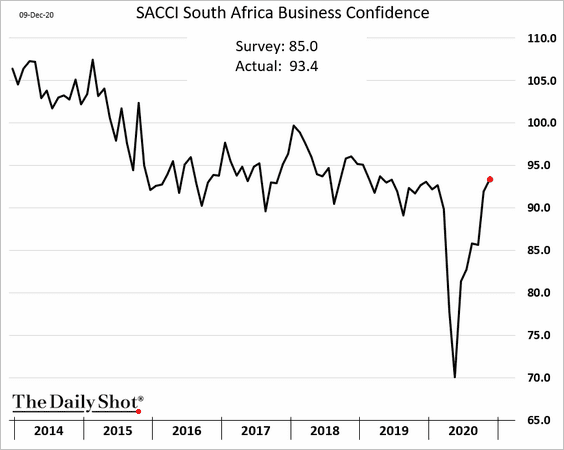
3. South Africa’s business confidence is back at pre-pandemic levels.
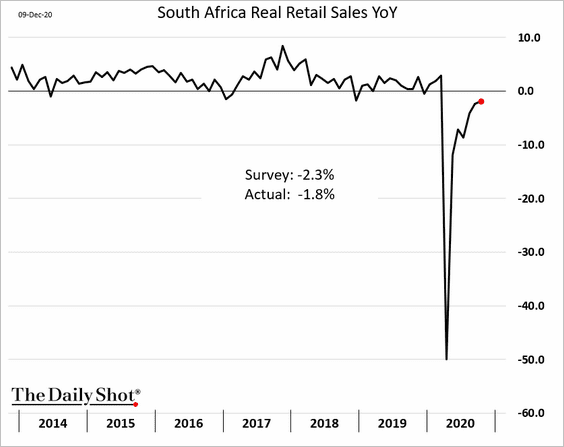
The recovery in retail sales is not quite complete (as of October).
——————–
4. Wich currencies offer the most carry?
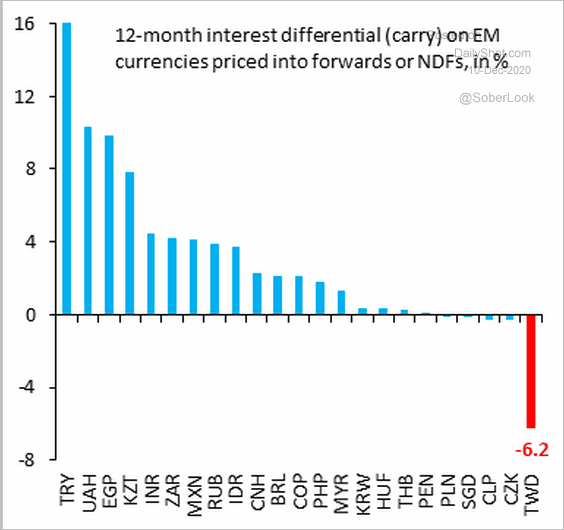 Source: @RobinBrooksIIF
5. This chart shows GDP growth rates over the past decade.
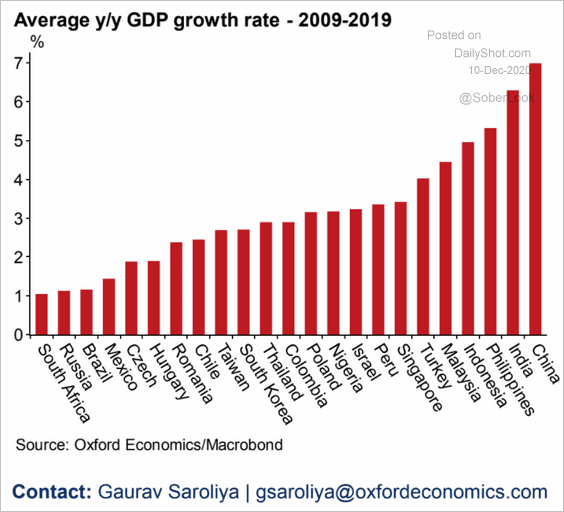 Source: Oxford Economics
Cryptocurrency
1. It’s been a tough week for cryptocurrencies.
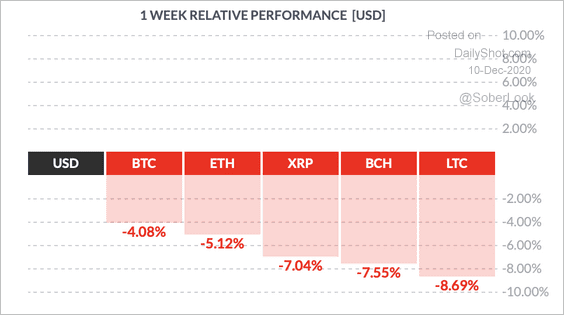 Source: FinViz
2. Ethereum’s transaction volume surged this year, outpacing bitcoin.
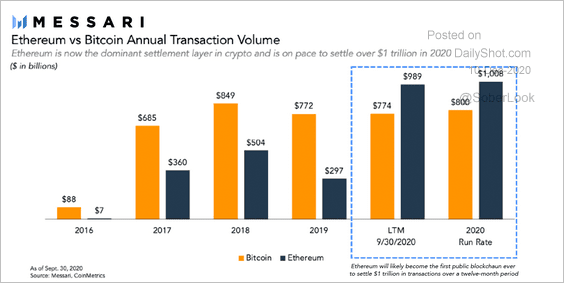 Source: Messari
3. Tether’s daily transaction volume is now higher than Bitcoin. (Tether is a “stablecoin,” which is meant to be “pegged” to the dollar and is often used as a form of cash in crypto trading.)
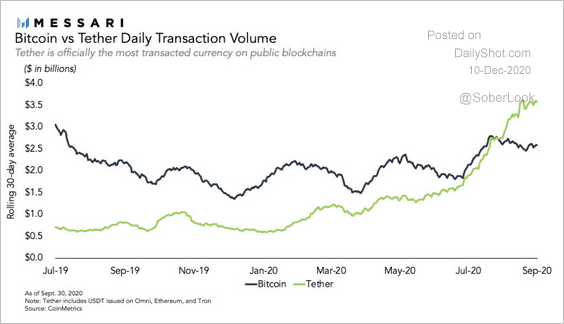 Source: Messari
4. JP Morgan suggested that Bitcoin presents a significant competition for gold. Does it?
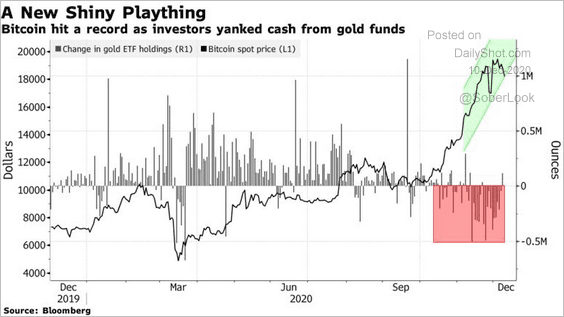 Source: @markets Read full article
Commodities
1. Iron ore prices have gone vertical.
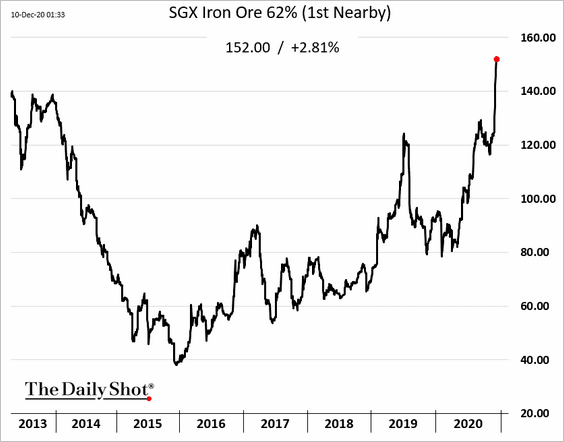
 Source: China Macro Economy Read full article
Oil and iron ore producers have reduced supply capacity over the past decade. Will a recovery in global growth encourage greater capital spending next year?
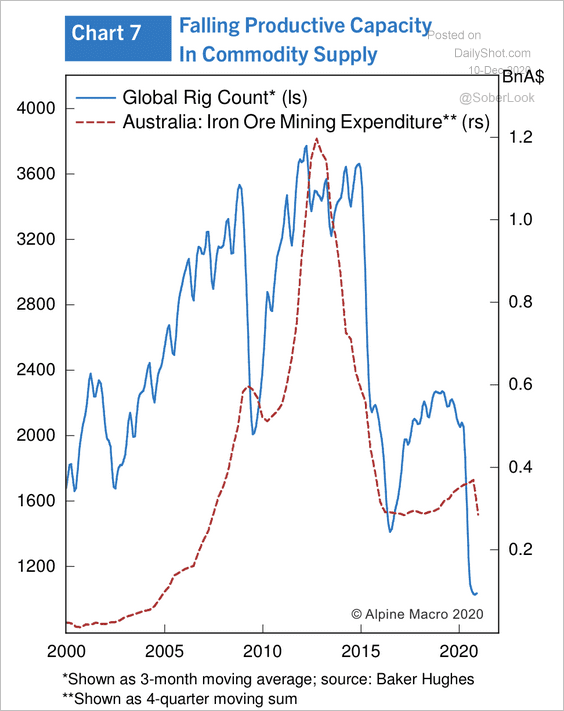 Source: Alpine Macro
——————–
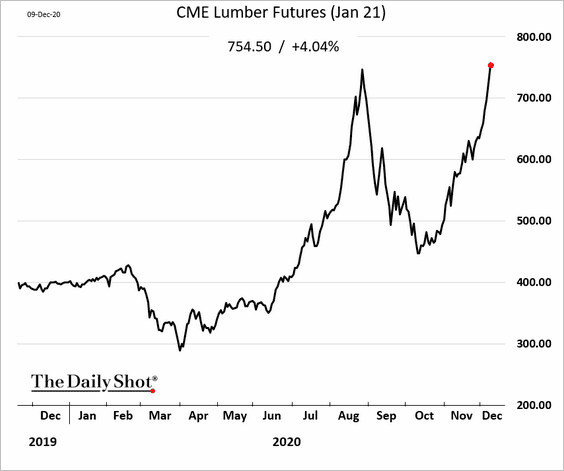
2. US lumber prices have roared back.
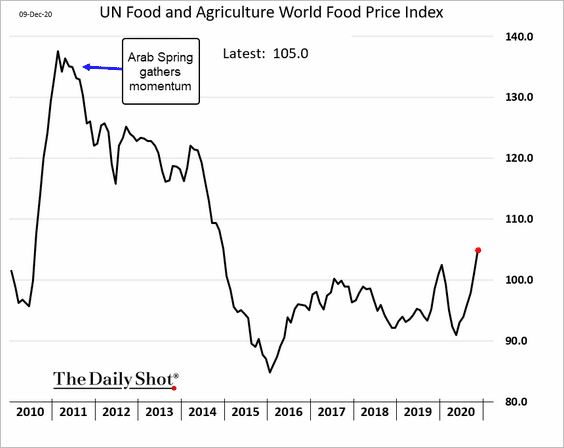
3. Global food prices are on the rise, …
 h/t @LizAnnSonders
… which is boosting demand for fertilizer.
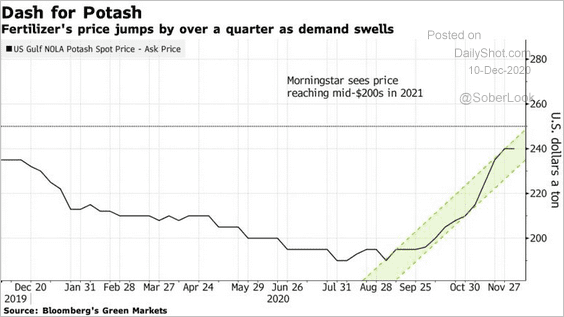 Source: @markets Read full article
Energy
1. OPEC spare capacity remains elevated. The move to increase output in January suggests that the group is confident in future demand remaining robust, according to Variant Perception.
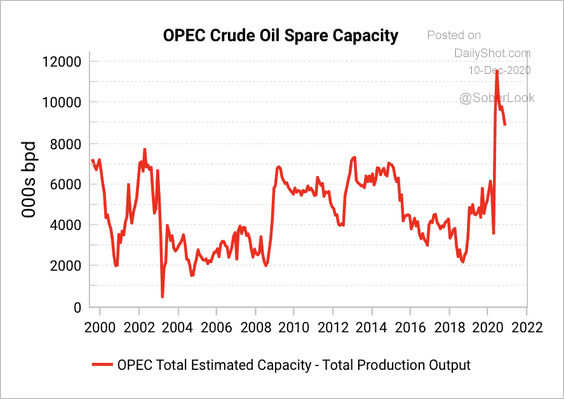 Source: Variant Perception
Here is the OPEC+ production cut schedule.
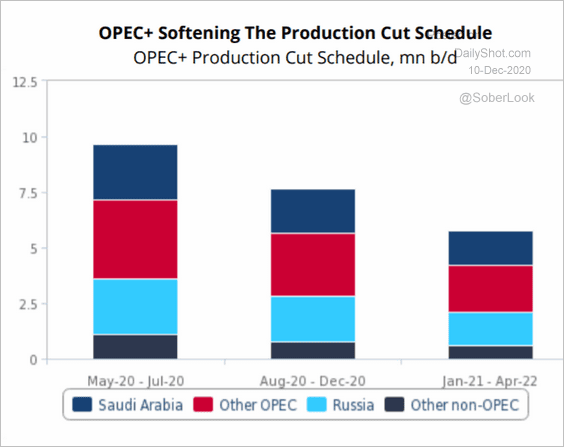 Source: Fitch Solutions Macro Research
——————–
2. Apple’s market cap as a share of the S&P 500 is now significantly higher than the whole energy sector.
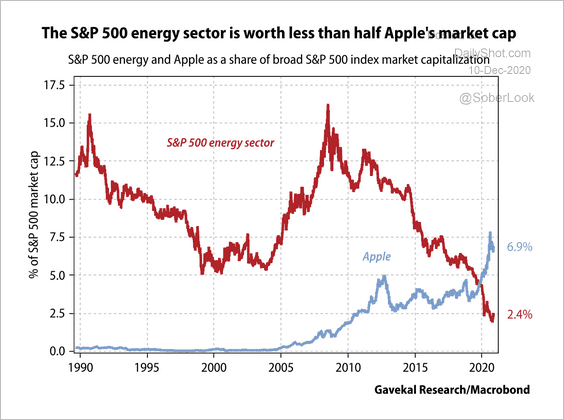 Source: Gavekal
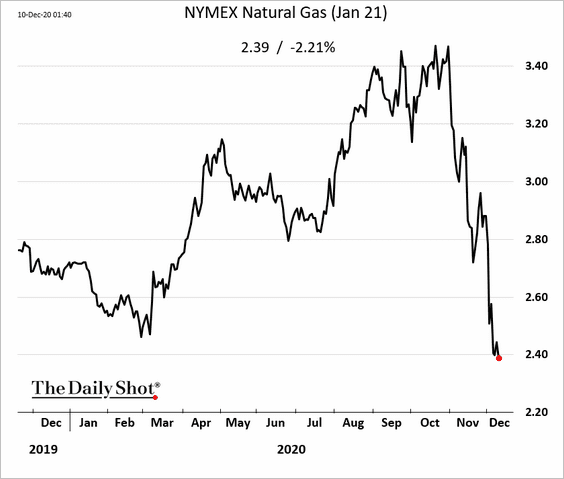
3. The slump in US natural gas futures continues.
Equities
1. Greed is good?
 Source: Movieclips
Perhaps. But being unprofitable may be fine as well.
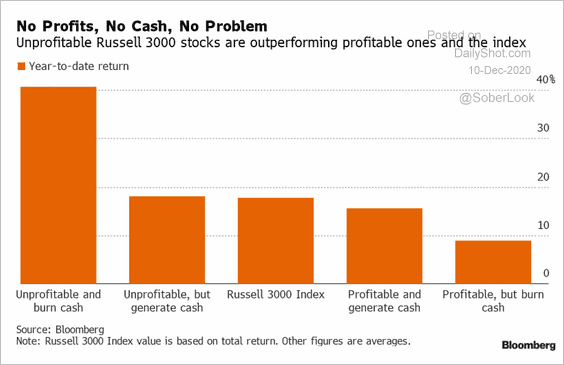 Source: Tom Contiliano, @technology Read full article
——————–
2. Here is BofA’s chart showing the recent spike in call option volume.
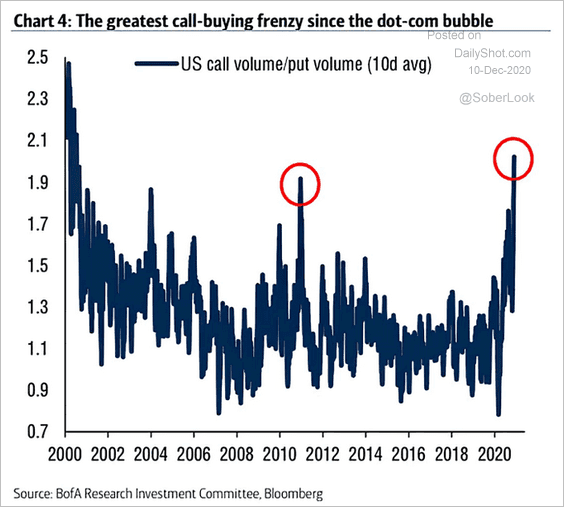 Source: @ISABELNET_SA, @BofAML
3. January is the best month for equity fund flows.
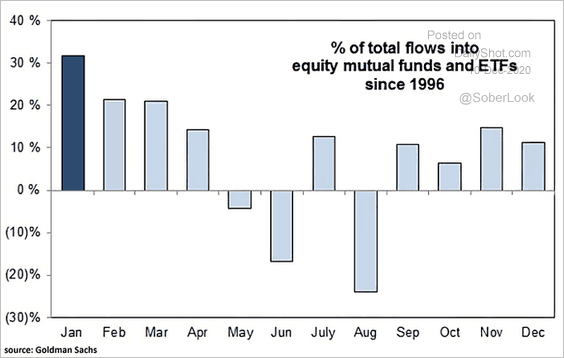 Source: @ISABELNET_SA, @GoldmanSachs
4. The value vs. growth relative ETF flows have been unprecedented.
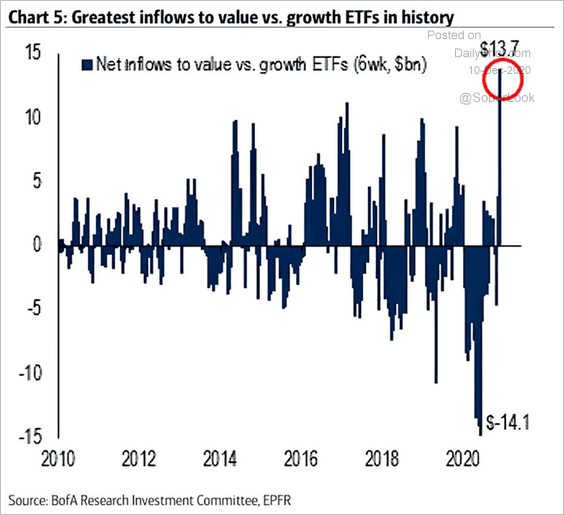 Source: @ISABELNET_SA, @BofAML
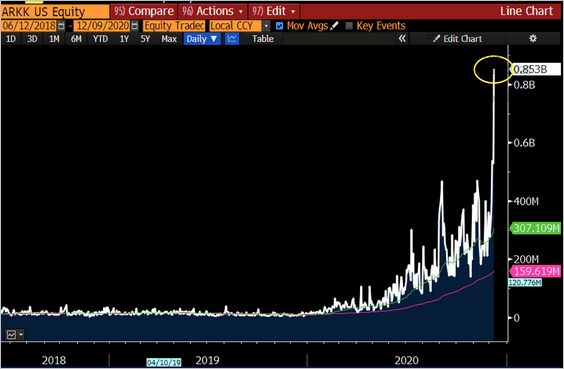
5. As discussed previously (#6 here), flows into thematic strategies have been massive. The ARK Innovation ETF (ARKK) daily volume is approaching $1 billion, placing it in the top 1% of ETFs by volume in recent trading.
 Source: @EricBalchunas
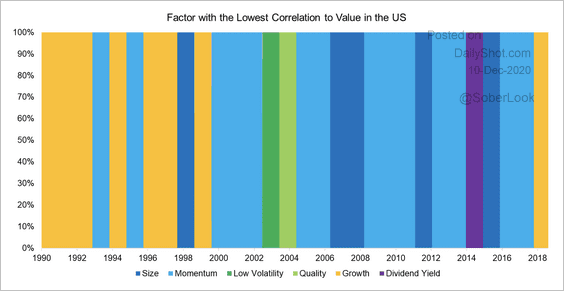
6. Here is a look at how US factor correlations to value varied over the last 30 years.
 Source: Factor Research
Global Developments
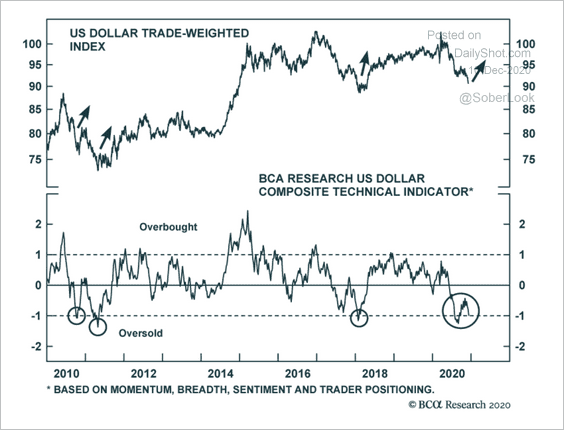
1. Technicals suggest that the dollar is oversold.
 Source: BCA Research
But massive twin deficits in the US could cap short-term gains in the dollar.
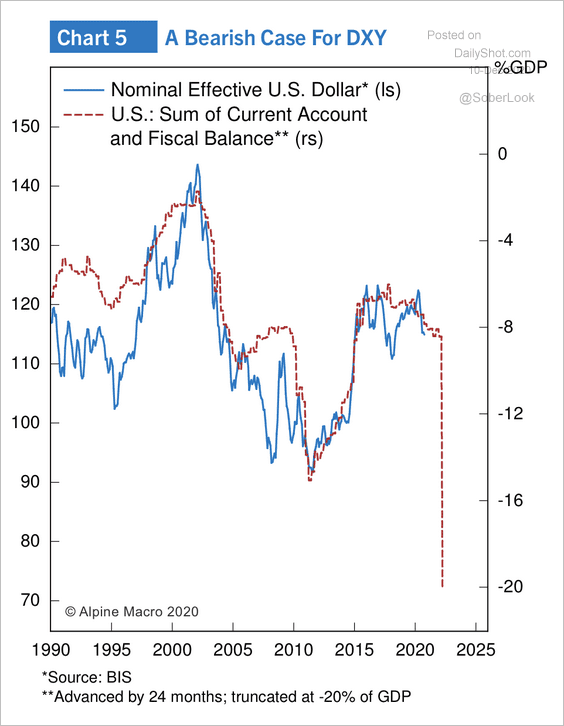 Source: Alpine Macro
——————–
2. Global debt levels continue to climb.
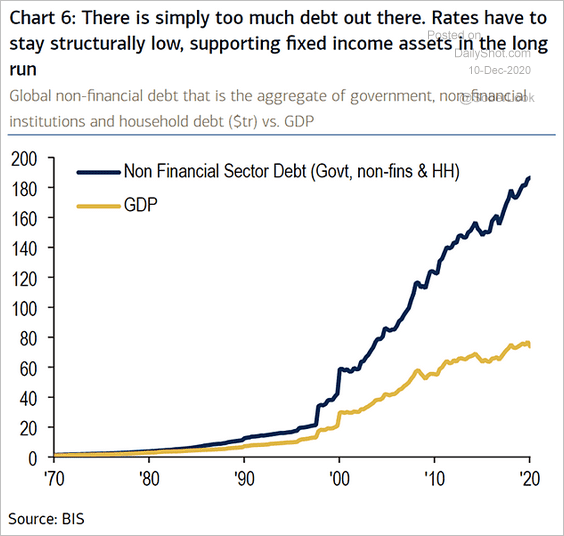 Source: @ISABELNET_SA, @BofAML
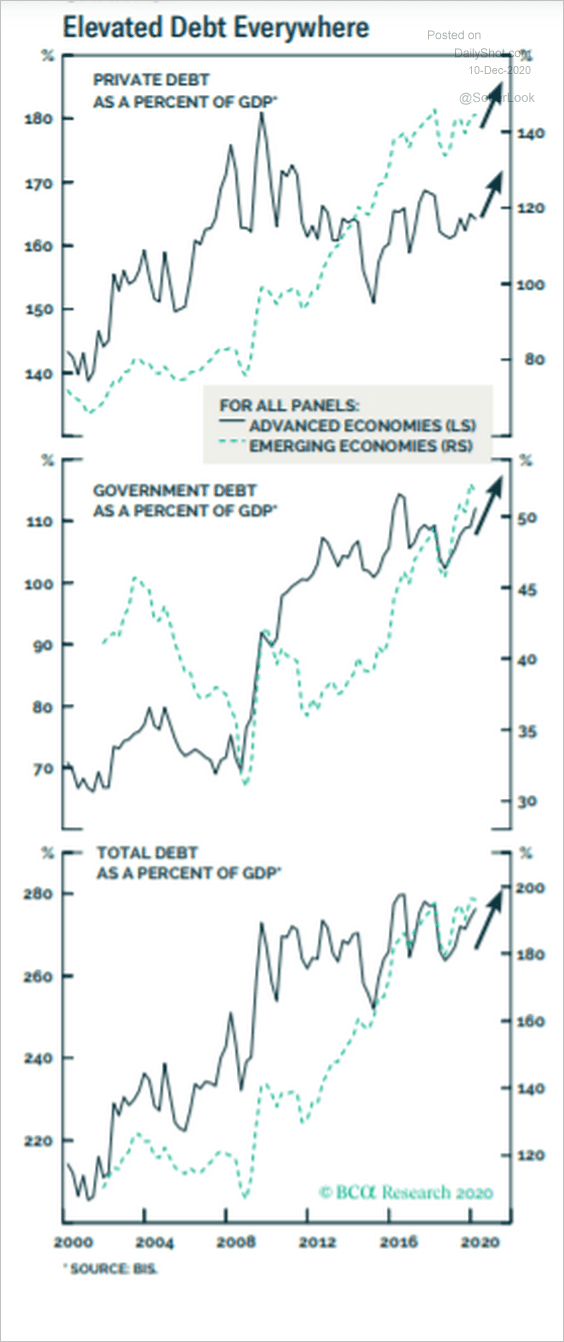 Source: BCA Research
3. Here is the OECD nations’ public debt not held by central banks.
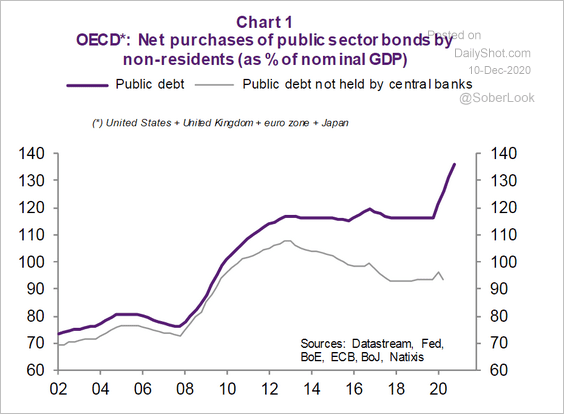 Source: Natixis
4. Will too much liquidity generate higher inflation? The expansion in money supply after the financial crisis coincided with weaker CPI.
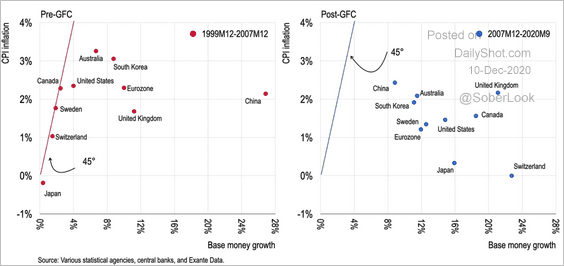 Source: Exante Data Read full article
——————–
Food for Thought
1. Reasons for working from home:
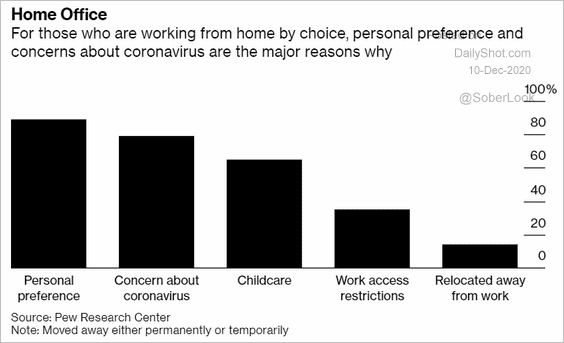 Source: @business Read full article
2. Applications to US medical schools:
 Source: @chartrdaily
3. Reasons for not participating in contact-tracing systems:
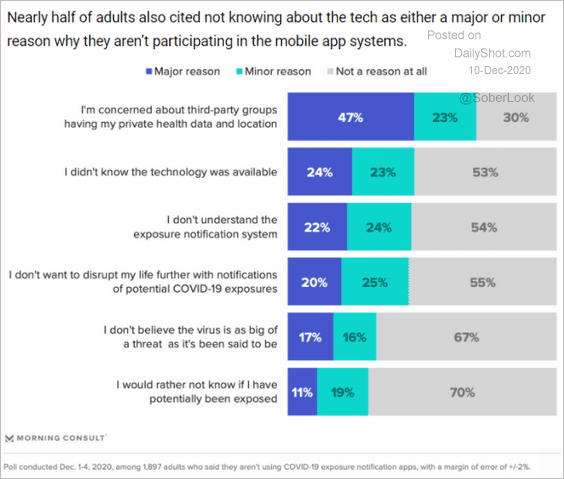 Source: Morning Consult Read full article
4. Support for cannabis decriminalization:
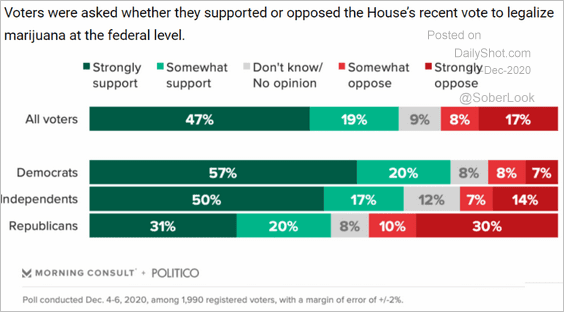 Source: Morning Consult Read full article
5. Party affiliation of US counties with the largest economies:
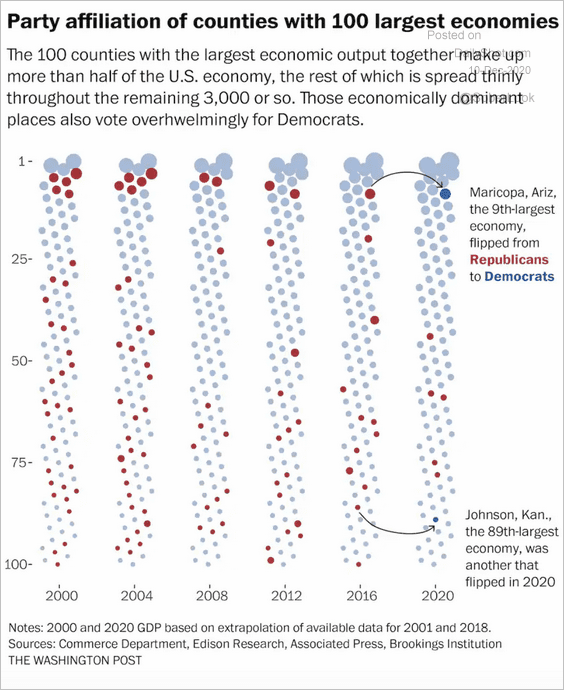 Source: The Washington Post Read full article
6. Work-sharing in the US:
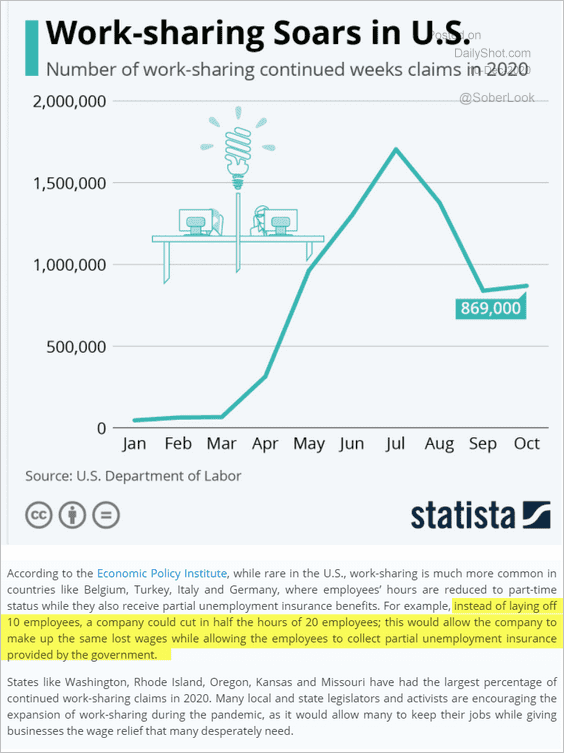 Source: Statista
7. Businessman, entrepreneur, consultant, and artist:
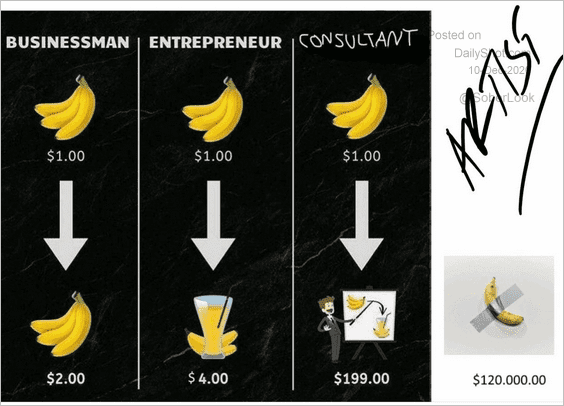 Source: @pascal_bornet
——————–