
The Daily Shot: 08-Sep-21
• The United States
• The United Kingdom
• The Eurozone
• Europe
• Asia – Pacific
• China
• Emerging Markets
• Cryptocurrency
• Commodities
• Energy
• Equities
• Alternatives
• Credit
• Global Developments
• Food for Thought
The United States
1. Automobile sales continue to weaken, with factories cutting output due to supply shortages.
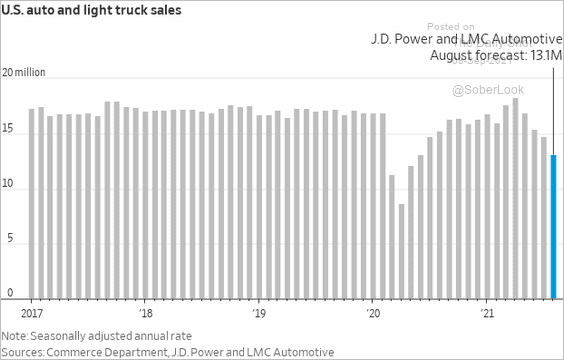 Source: @WSJ Read full article
 Source: @WSJ Read full article
• Here is the Evercore ISI auto dealer sales survey.
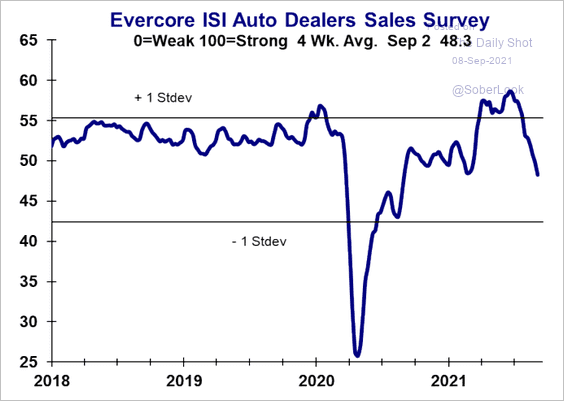 Source: Evercore ISI
• Heavy truck sales are also slumping despite robust demand.
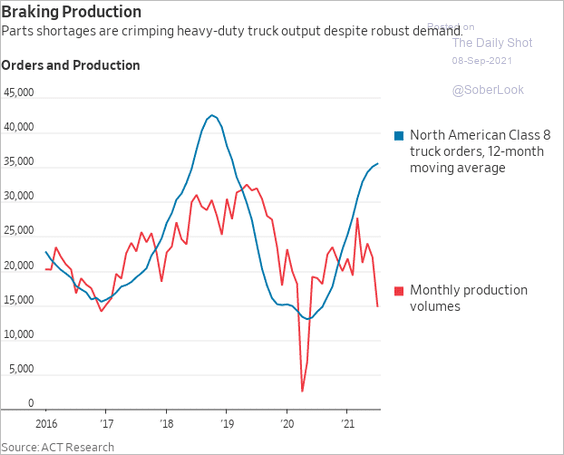 Source: @WSJ Read full article
——————–
2. This chart shows output PMI indicators by sector (August vs. July).
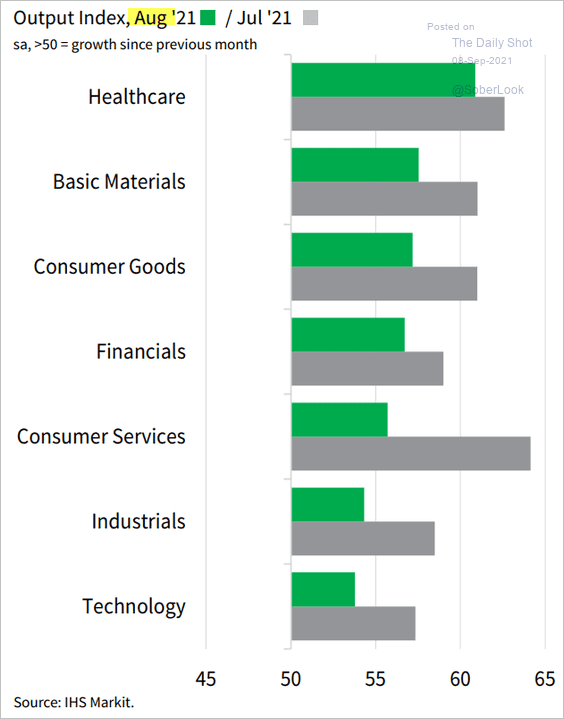 Source: IHS Markit
3. Economists have been downgrading their forecasts for the current quarter’s GDP growth.
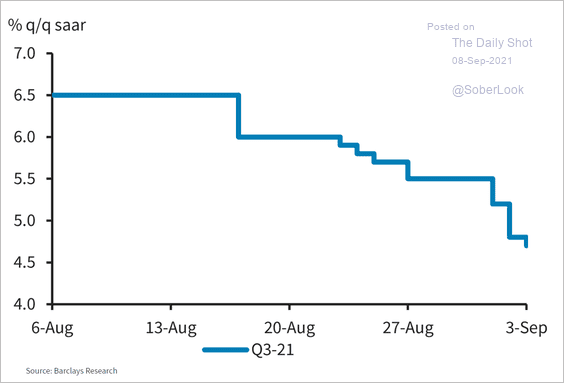 Source: Barclays Research
Goldman expects growth to remain robust through the middle of next year, driven by pent-up demand. But the bank sees deterioration after that point.
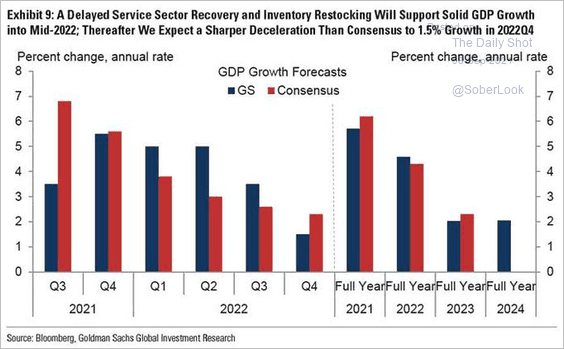 Source: @ISABELNET_SA, @GoldmanSachs
——————–
4. Fiscal austerity is unlikely to be repeated in future cycles (no matter which party is in charge).
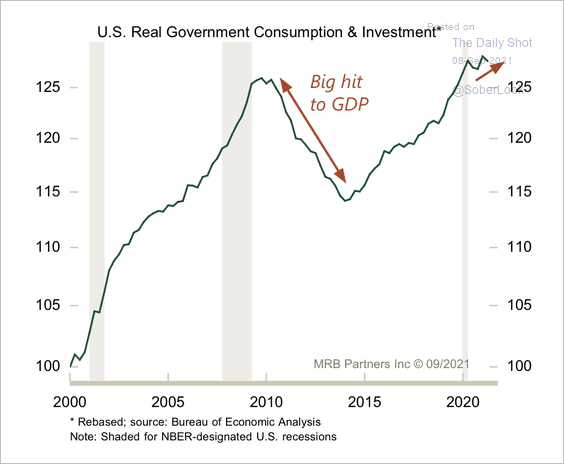 Source: MRB Partners
5. Without an increase in the debt ceiling, the US Treasury is expected to lose the ability to pay its bills by early November (the “X date”). Here is a forecast from Deutsche Bank.
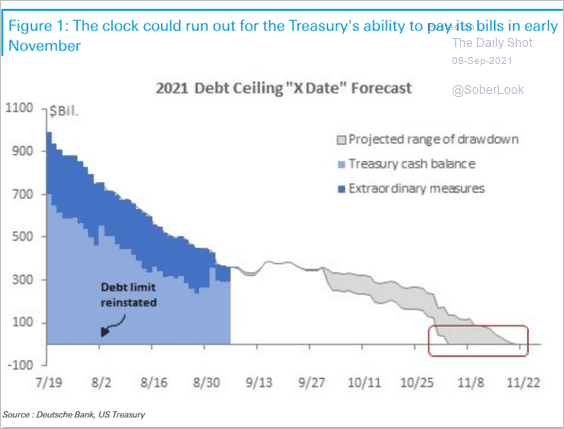 Source: Deutsche Bank Research
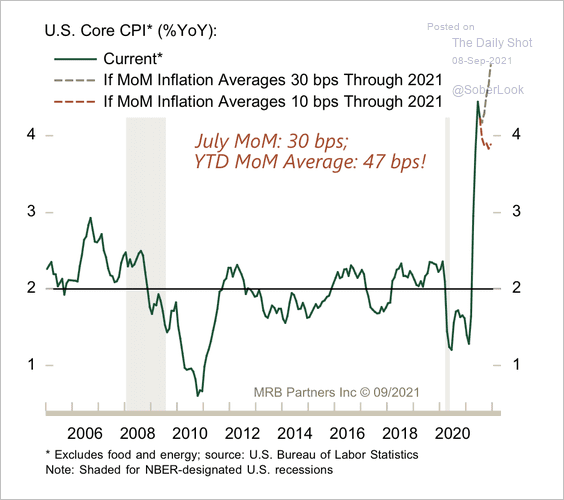
6. Next, we have a couple of updates on inflation.
• MRB Partners expects core inflation to end the year near 4%.
 Source: MRB Partners
• The recent PPI-CPI divergence is not sustainable.
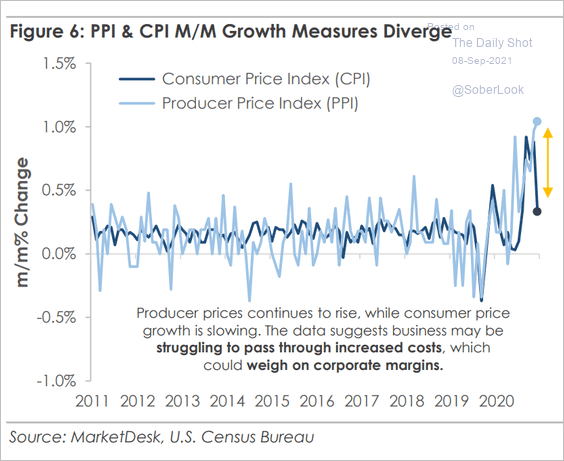 Source: MarketDesk Research
——————–
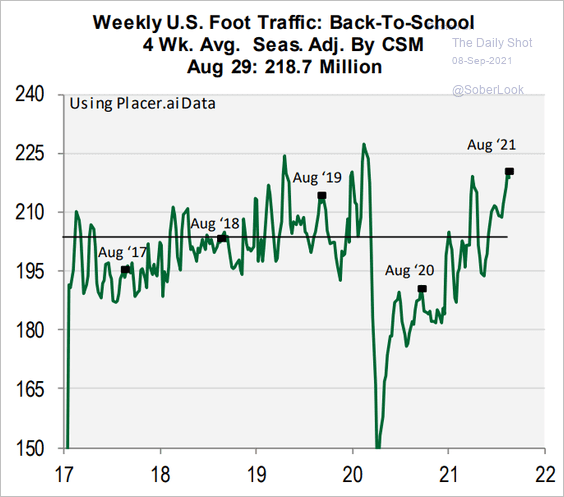
7. Back-to-school retail traffic has been robust.
 Source: Cornerstone Macro
Back to Index
The United Kingdom
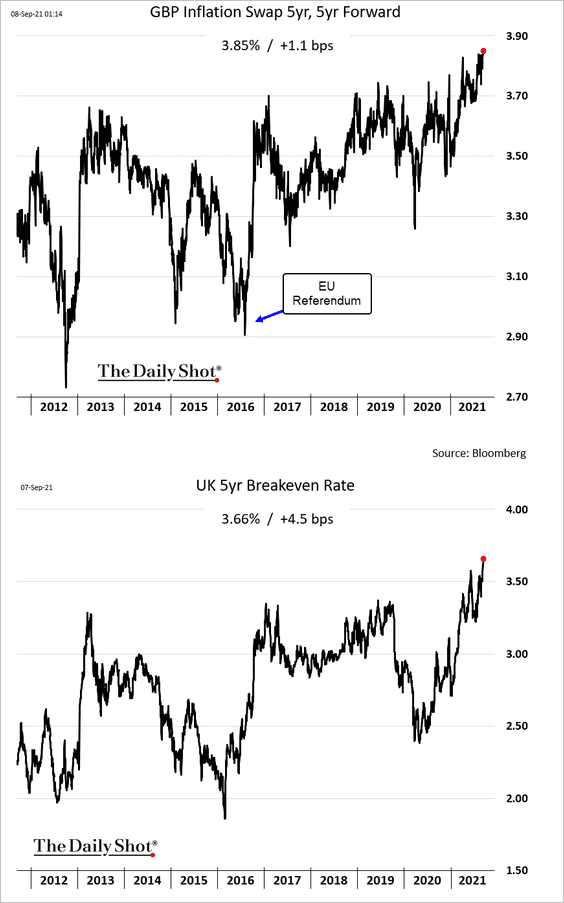
1. Market-based inflation expectations are at multi-year highs.
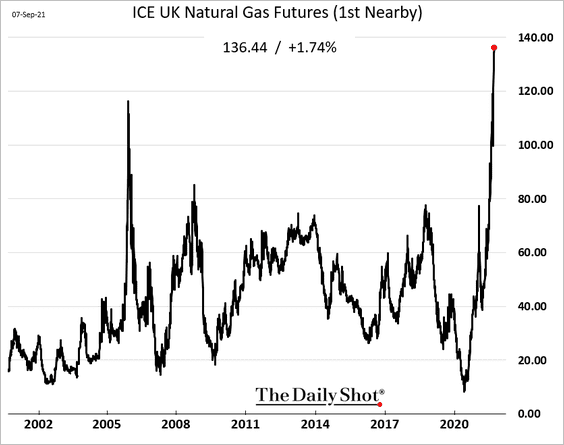
2. The relentless surge in natural gas prices (to record highs) will be a drag on economic growth.
3. Retail deposit levels suggest that saving is slowing (pointing to stronger spending).
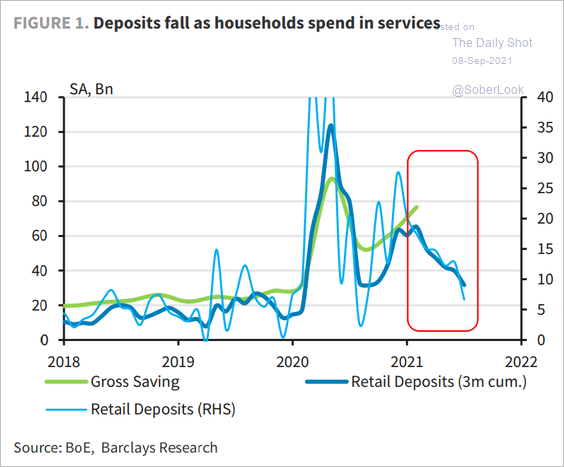 Source: Barclays Research
4. Staying out of the labor force since the start of the pandemic doesn’t seem to be linked to childcare challenges.
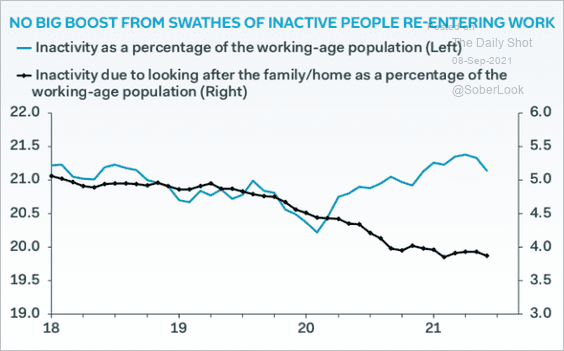 Source: Pantheon Macroeconomics
Back to Index
The Eurozone
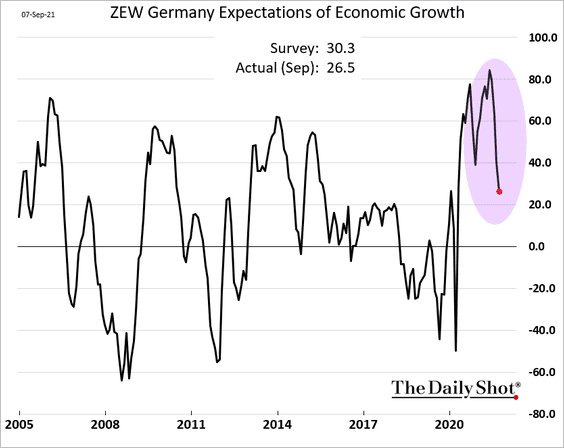
1. Germany’s ZEW expectations index declined further, pointing to a pullback in economic activity this month.
2. Service-sector growth remained robust in Spain and Italy last month.
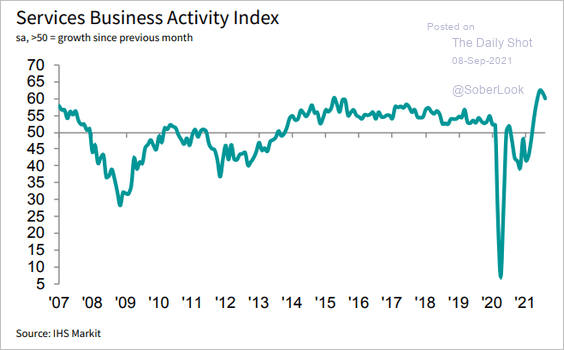 Source: IHS Markit
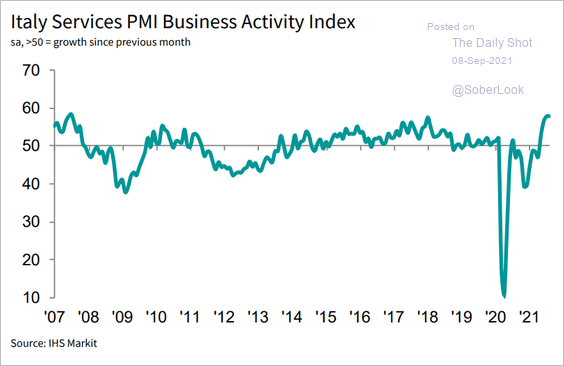 Source: IHS Markit
Here is Italy’s composite PMI.
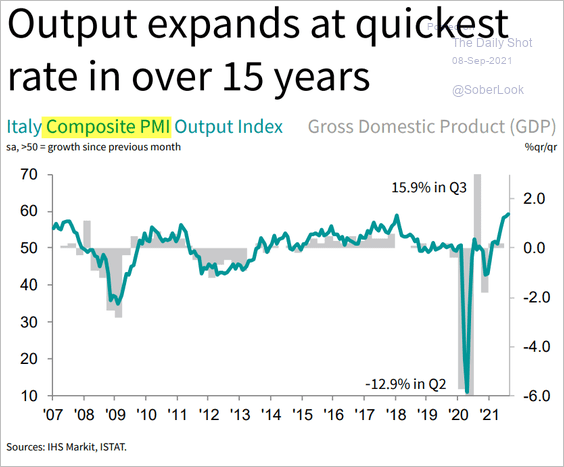 Source: IHS Markit
——————–
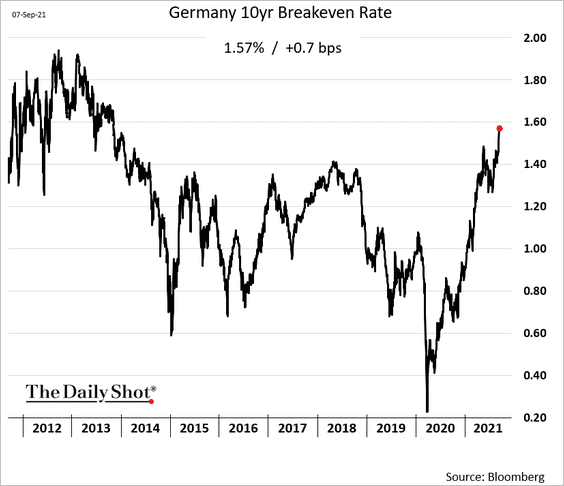
3. Next, we have some updates on inflation.
• Germany’s 10yr breakeven rate (inflation expectations) hit the highest level since 2013.
• Inflation trends across the euro area have diverged.
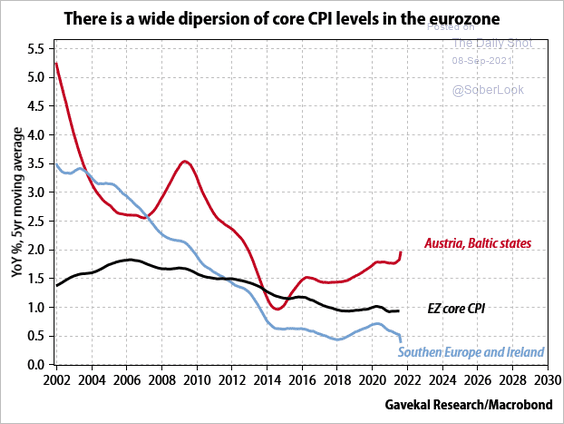 Source: Gavekal Research
• Energy CPI should begin moderating. Of course, the massive spike in natural gas prices isn’t helping the situation (#2 here).
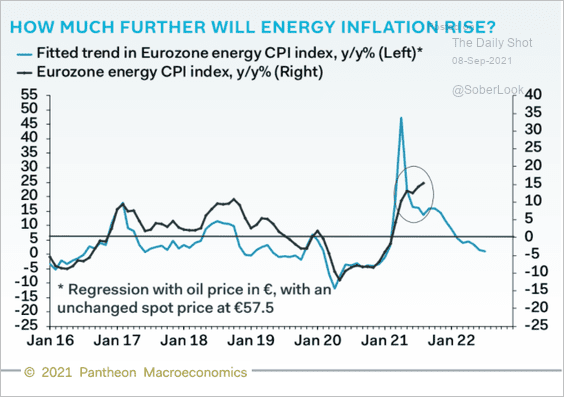 Source: Pantheon Macroeconomics
——————–
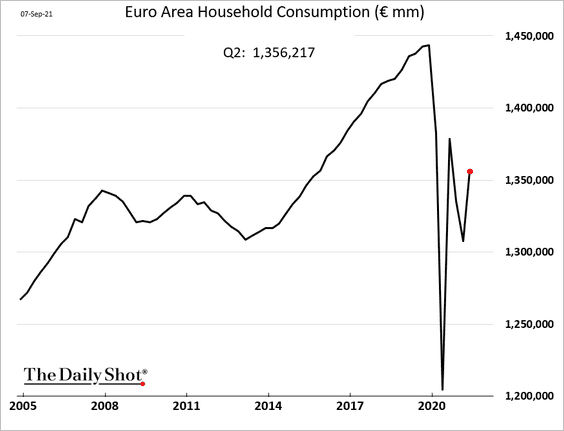
4. Consumer spending boosted the second-quarter growth.
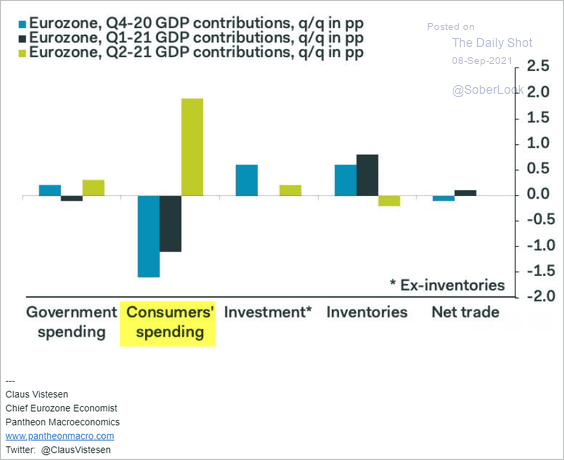 Source: Pantheon Macroeconomics
——————–
5. How will potential outcomes from this week’s ECB meeting impact the euro?
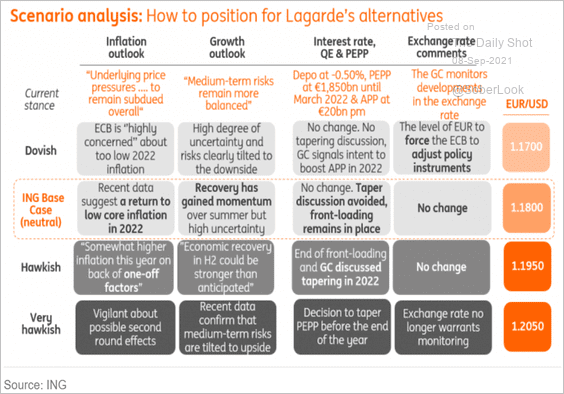 Source: ING
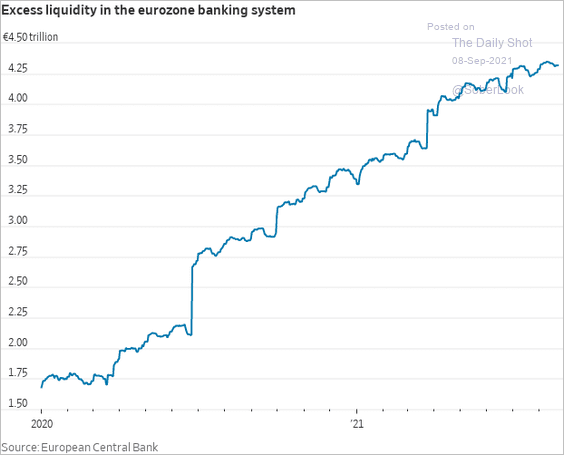
6. Excess reserves are approaching €4.5 trillion (due to QE).
 Source: @WSJ Read full article
7. Real interest differentials between the US and the euro area will keep the USD well bid vs. EUR.
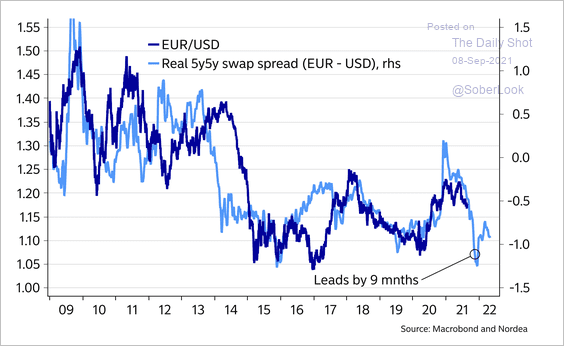 Source: Nordea Markets
Back to Index
Europe
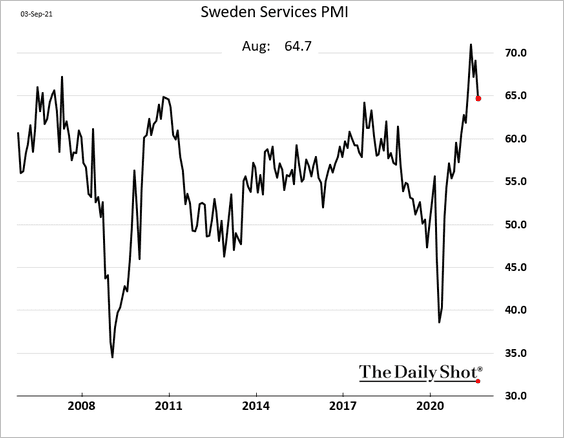
1. Sweden’s service-sector growth moderated in August but remains healthy.
• Sweden looks very similar to other regions – record-high household debt compared to disposable income but record low-interest burden. Households are very sensitive to interest rates.
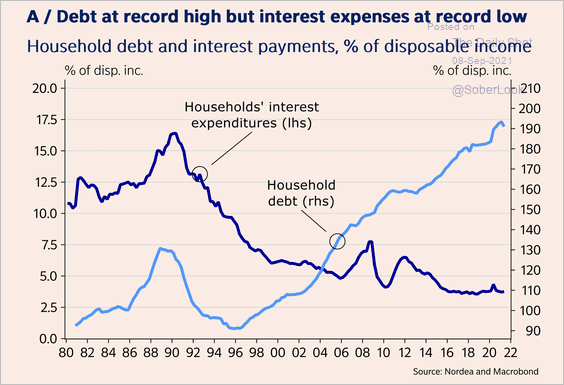 Source: Nordea Markets
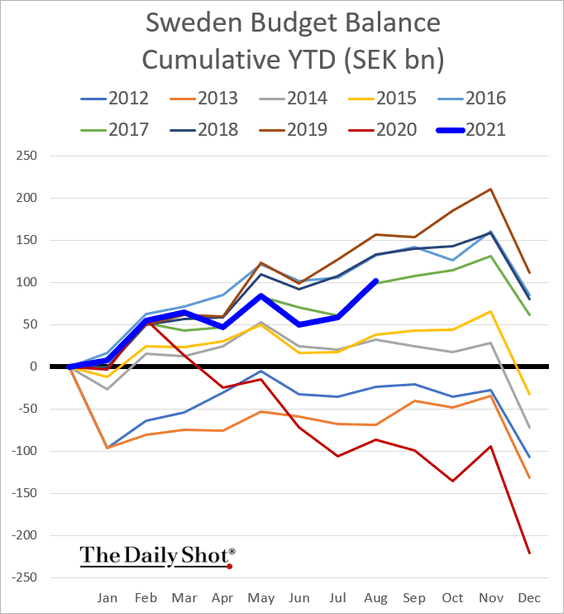
• Sweden’s government budget is in surplus this year.
——————–
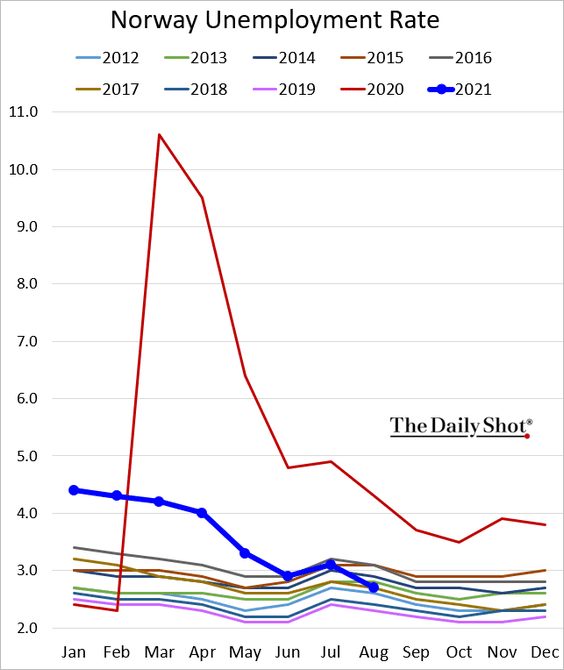
2. Norway’s unemployment rate continues to fall.
3. Next, we have some updates on Switzerland.
• Unlike other Europan economies, the Swiss GDP has almost recovered (2 charts).
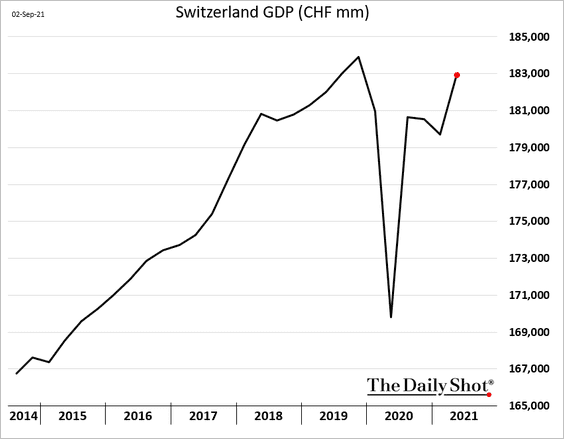
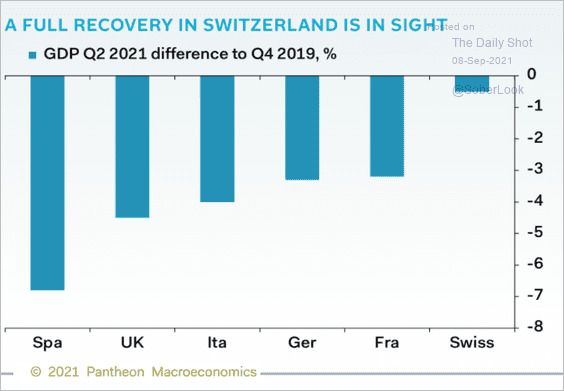 Source: Pantheon Macroeconomics
• High-frequency indicators suggest a return to pre-crisis growth this quarter.
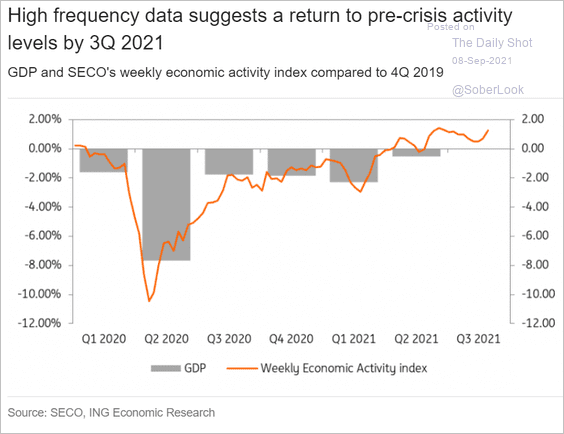 Source: ING
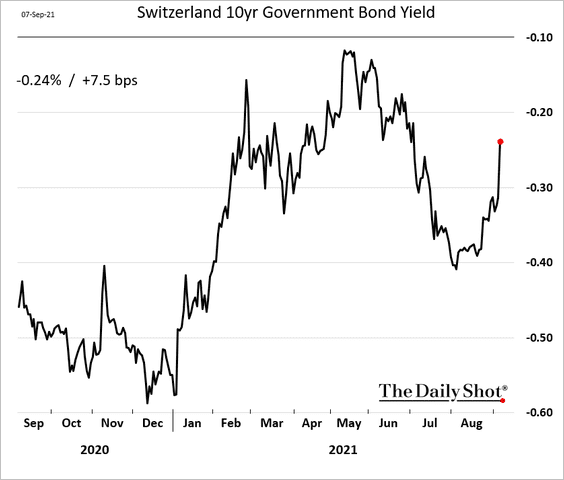
• Bond yields are rebounding.
——————–
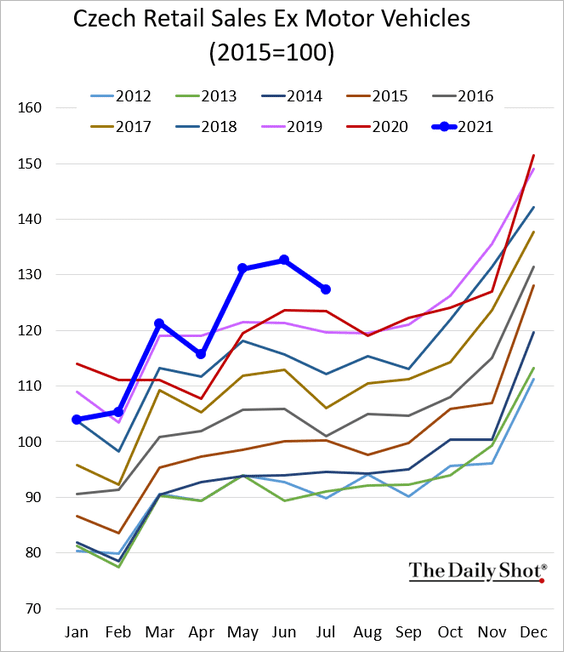
4. Czech retail sales remained strong in July.
5. This map shows vaccination rates across Europe.
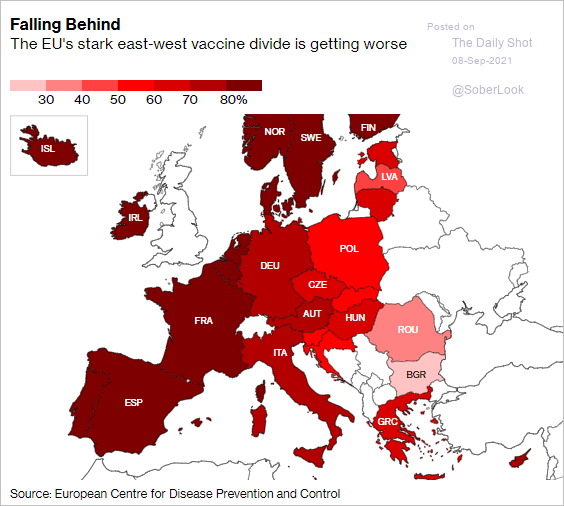 Source: @bpolitics Read full article
Back to Index
Asia – Pacific
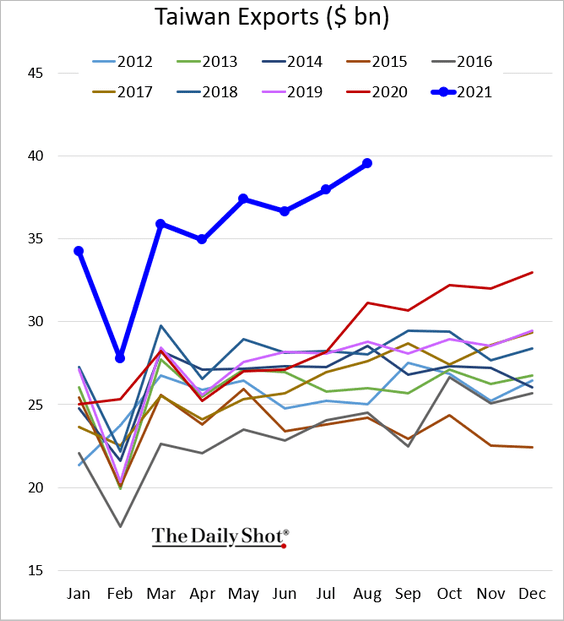
1. Taiwan’s exports continue to surge, hitting record highs.
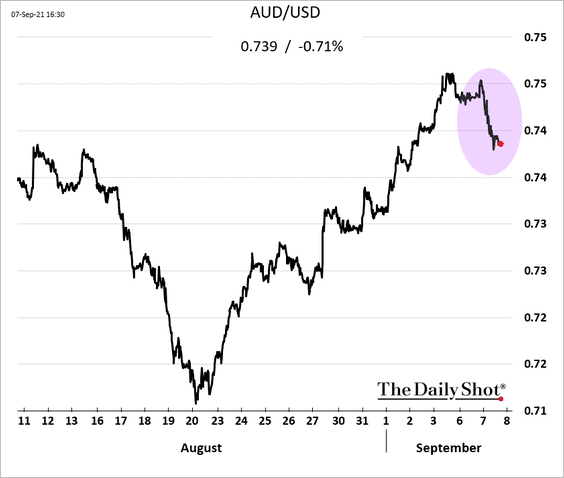
2. The Aussie dollar weakened after the RBA announced that it will maintain its bond purchases until at least mid-February, rather than potentially starting taper in November of this year.
Back to Index
China
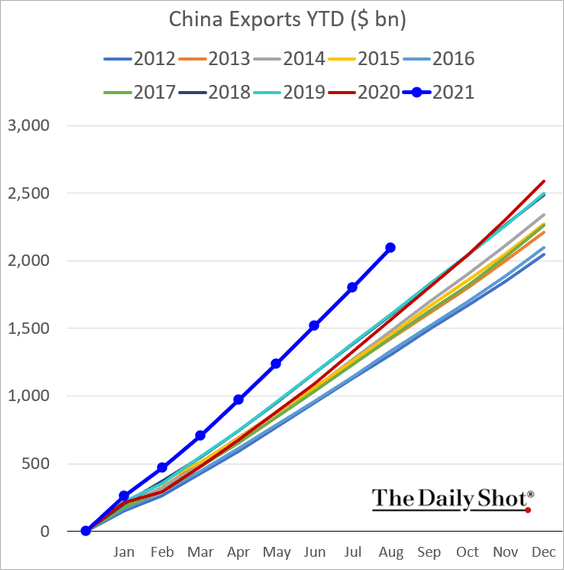
1. China’s trade surplus was stronger than expected last month.
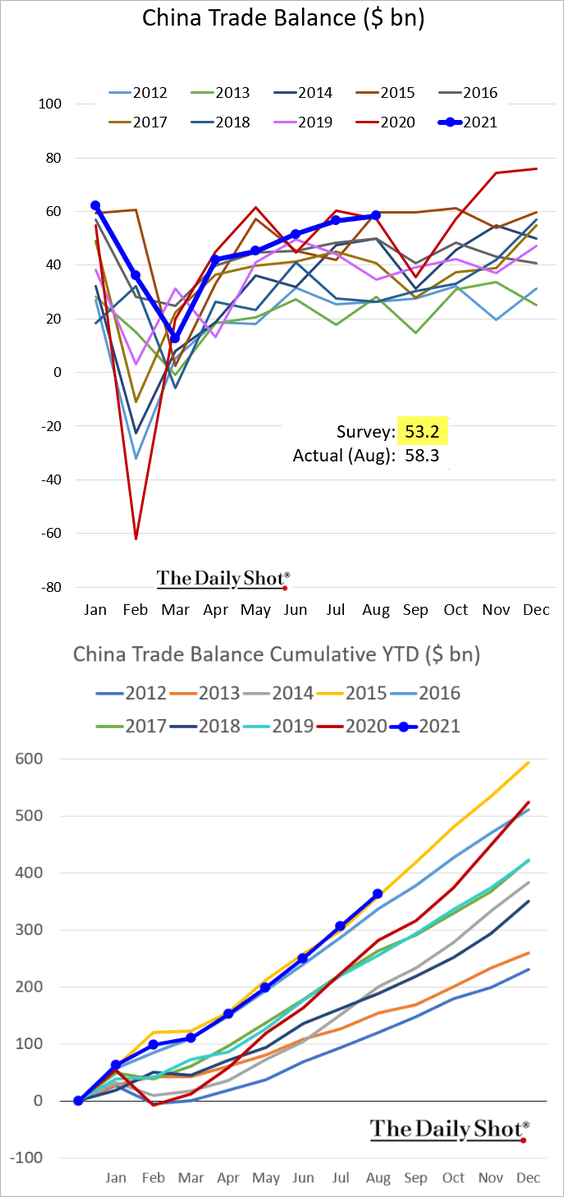
Export growth remains robust.
——————–
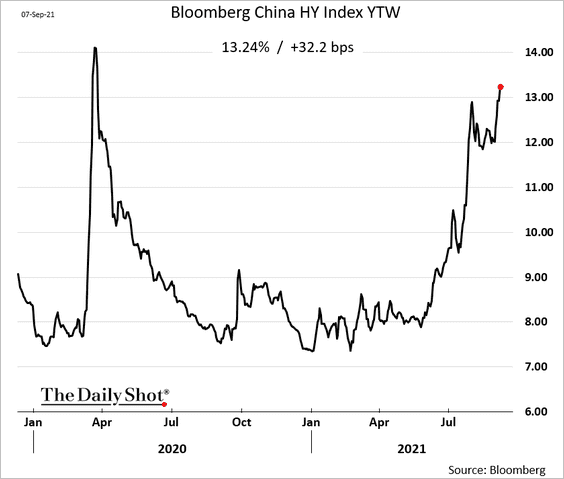
2. The high-yield index yield broke above 13%.
3. China’s corporate bond market has been growing rapidly, dominated by state-owned borrowers.
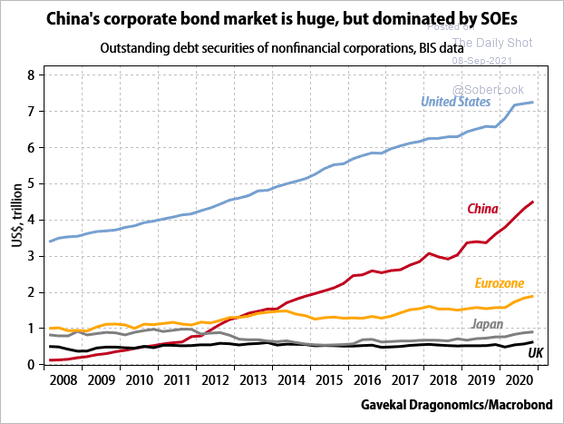 Source: Gavekal Research
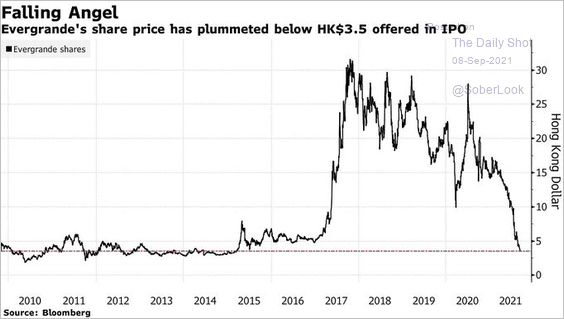
4. Evergrande’s share price is now below the IPO offering.
 Source: @markets Read full article
5. The Hang Seng TECH index is at resistance.
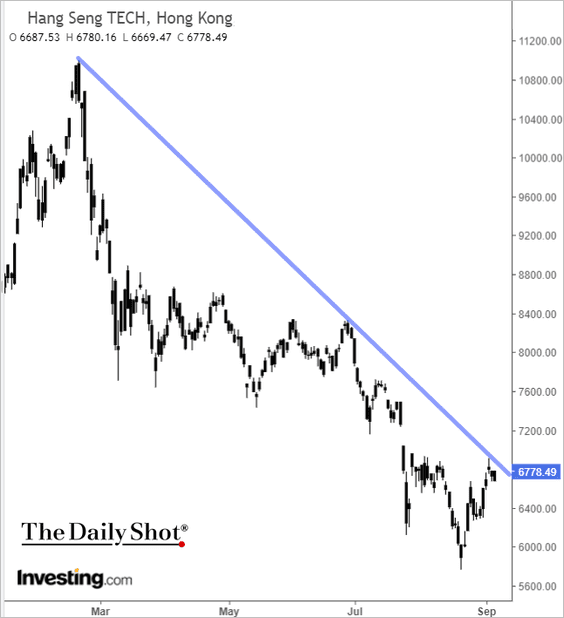 h/t @VishnoiSays Read full article
6. Equity flows are trending higher.
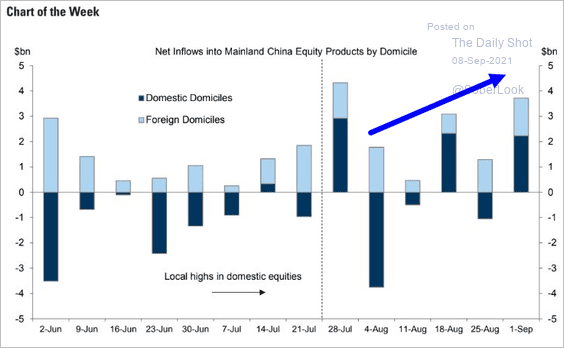 Source: Goldman Sachs
7. Coal prices continue to surge amid shortages.
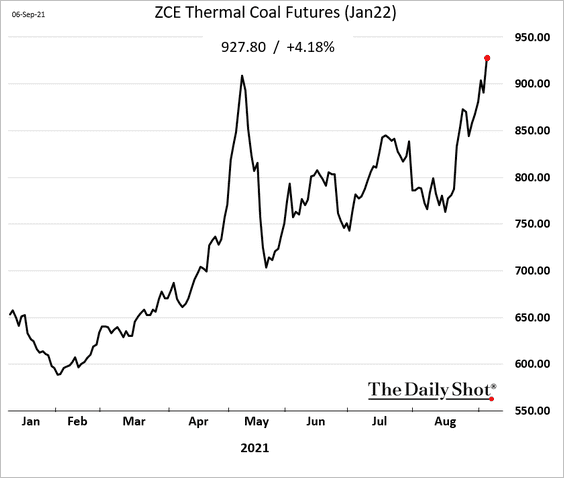
 Source: Reuters Read full article
The nation’s dependence on coal will remain high for decades.
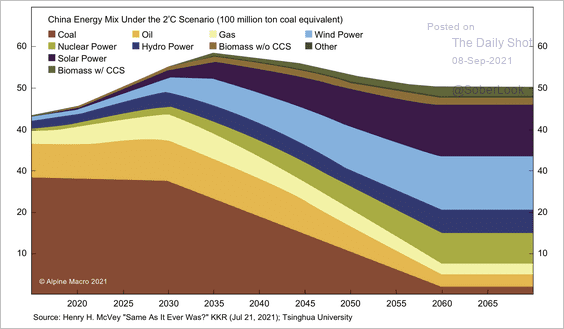 Source: Alpine Macro
——————–
8. China’s patent applications now surpass major developed economies.
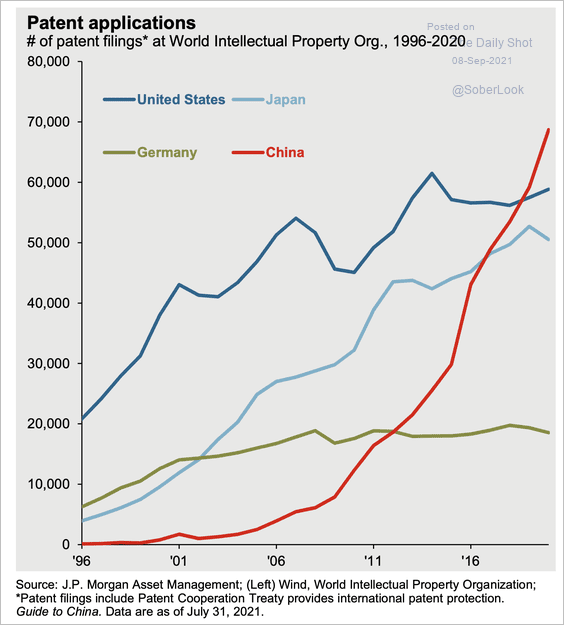 Source: J.P. Morgan Asset Management
Back to Index
Emerging Markets
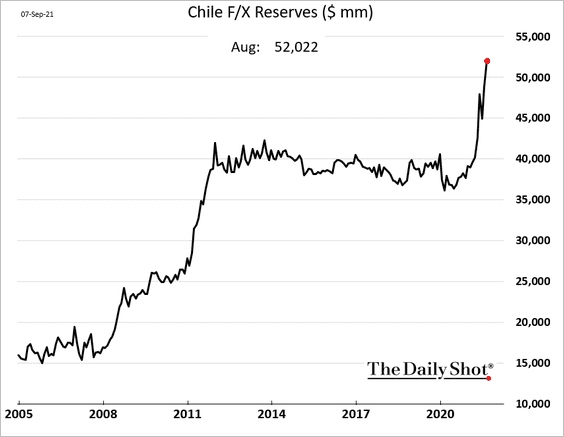
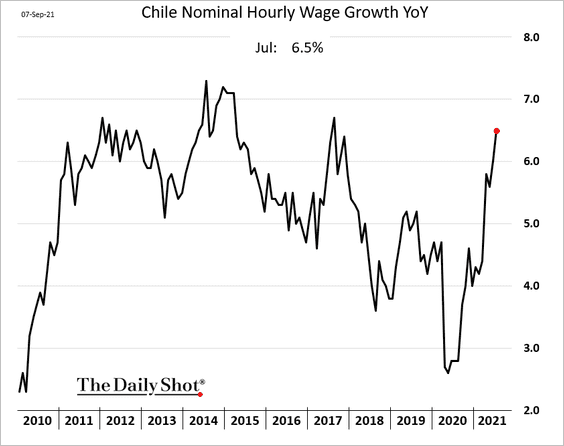
1. Let’s begin with Chile.
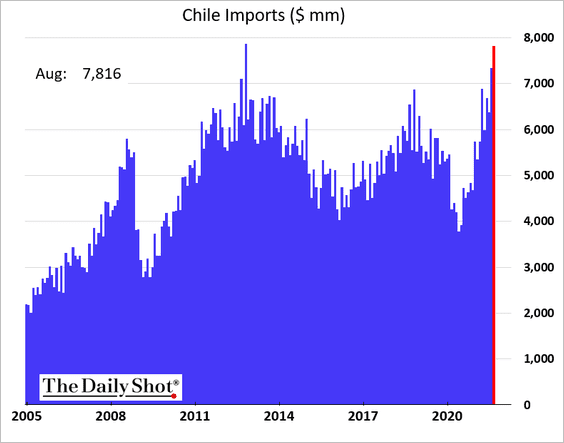
• The trade surplus deteriorated …
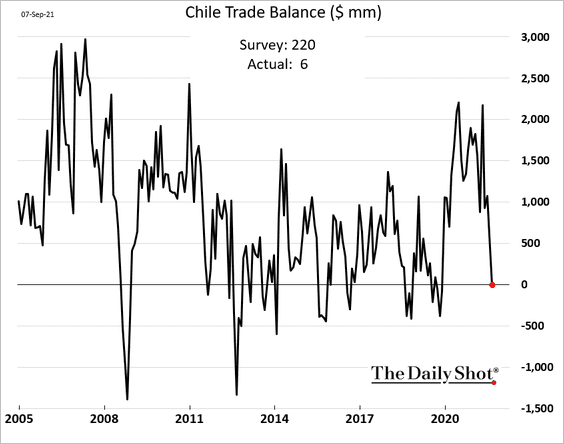
… amid robust imports.
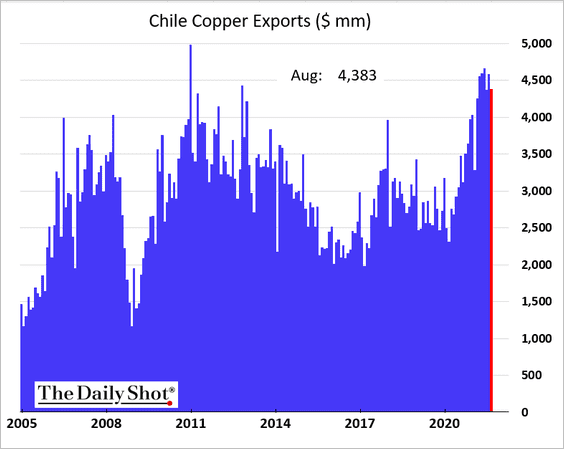
Copper exports appear to have peaked for now.
• F/X reserves are surging.
• Wage growth has accelerated.
• Capital outflows were massive in Q2.
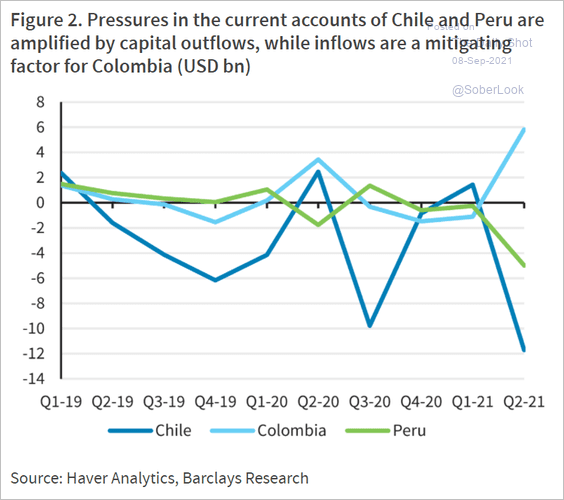 Source: Barclays Research
——————–
2. Brazil’s service-sector growth hit a multi-year high last month.
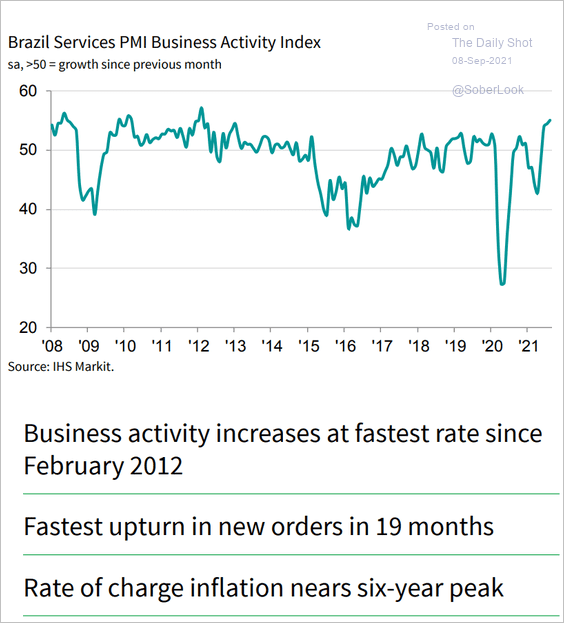 Source: IHS Markit
Driven up by energy and food costs, inflation in Brazil may be peaking.
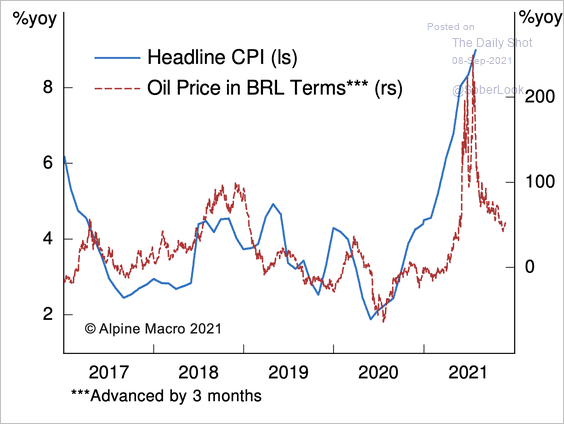 Source: Alpine Macro
——————–
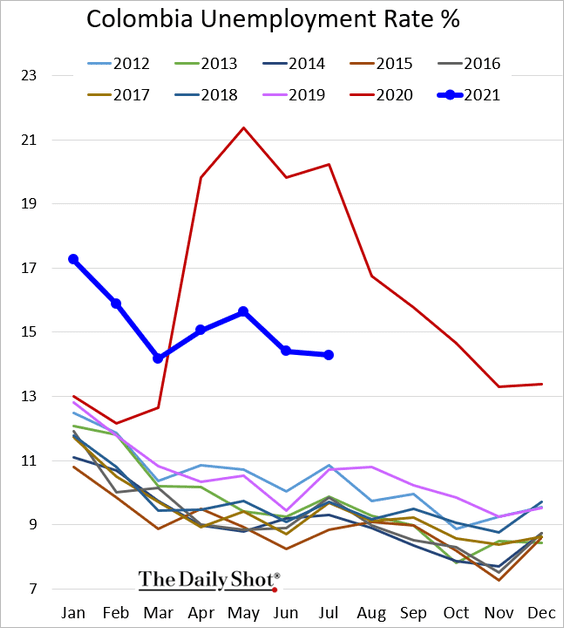
3. Colombia’s unemployment rate remains elevated.
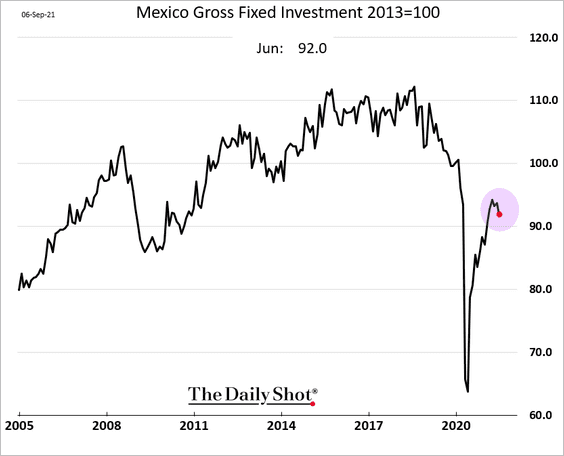
4. Mexico’s business investment slowed in June, holding well below pre-COVID levels.
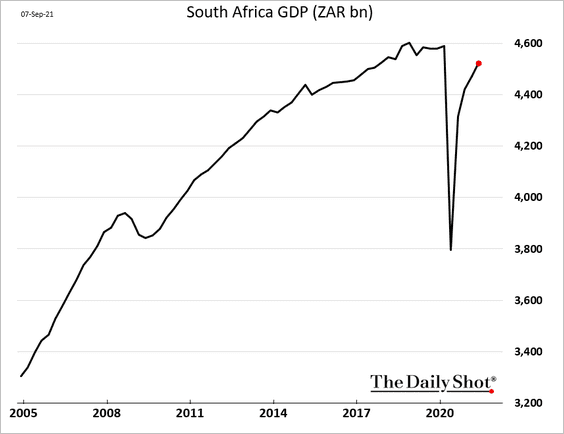
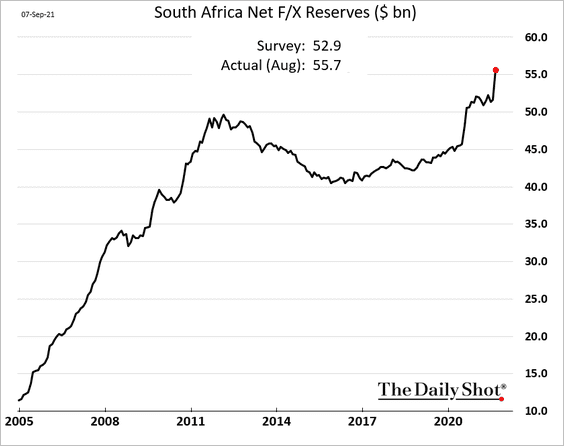
5. South Africa’s GDP is approaching a full recovery.
F/X reserves increased sharply last month.
——————–
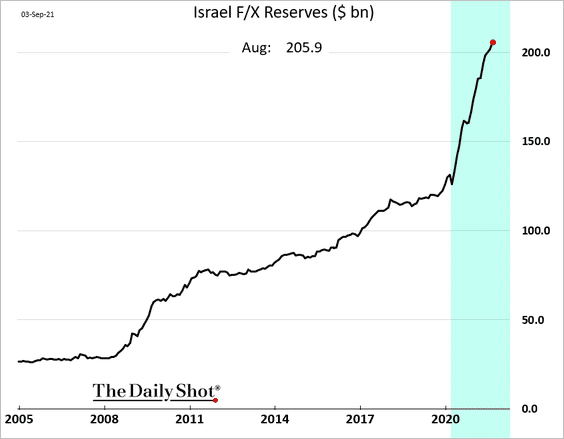
6. Israel’s F/X reserves are above $200 bn.
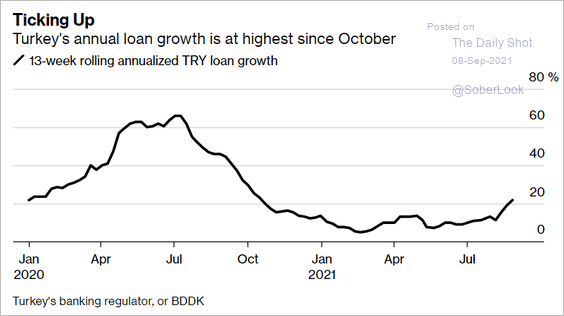
7. Turkey’s loan growth is rebounding.
 Source: @markets Read full article
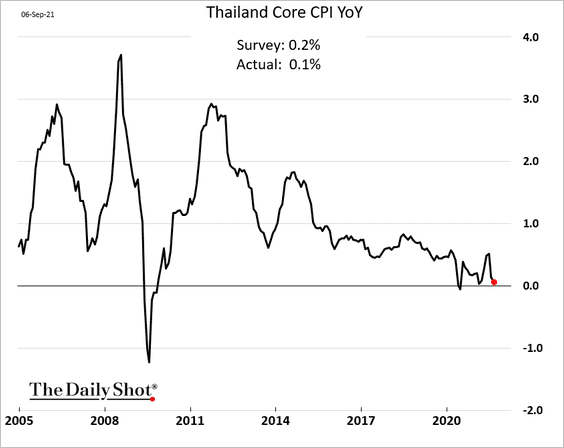
8. Thailand’s business sentiment tumbled in recent months.
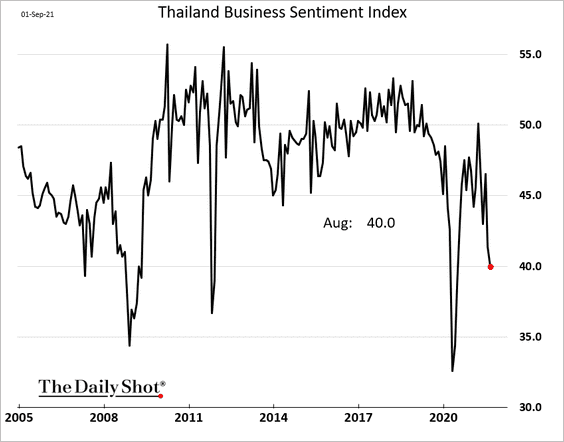
Inflation is back near zero.
——————–
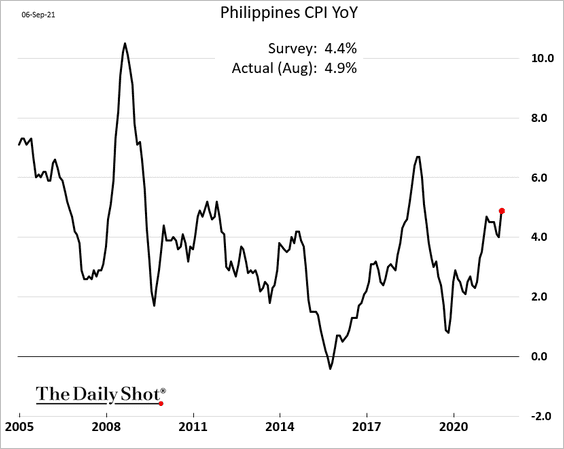
9. Inflation is approaching 5% in the Philippines.
10. South-East Aisa’s COVID death toll has been devastating this summer
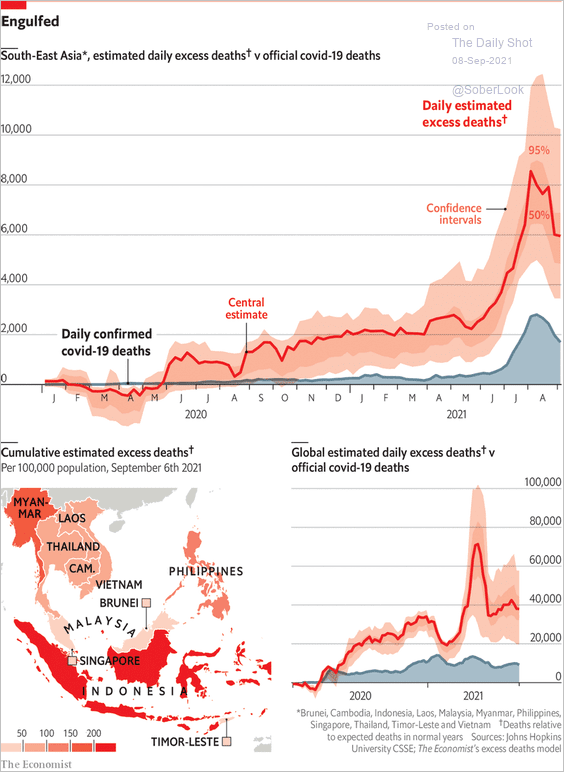 Source: The Economist Read full article
11. EM factory activity is in contraction mode, driven by Asian economies (2 charts).
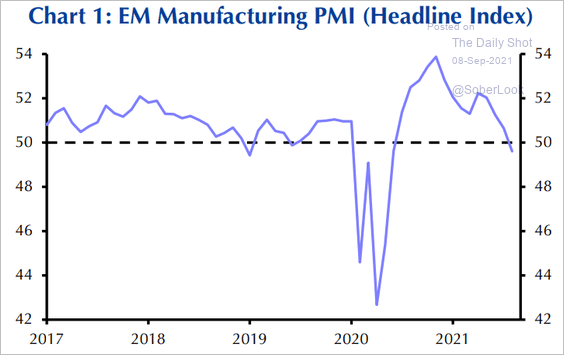 Source: Capital Economics
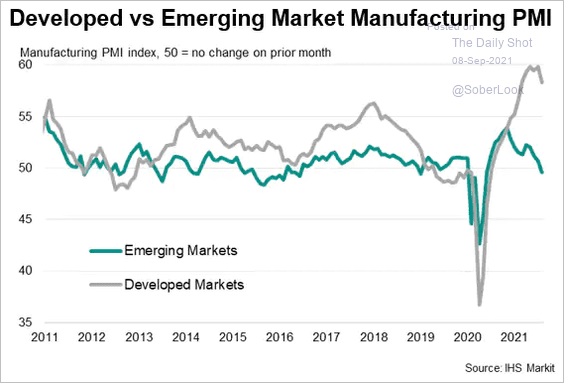 Source: IHS Markit
Back to Index
Cryptocurrency
1. Bitcoin experienced a flash crash on Tuesday, finding support at $44k, as El Salvador accepted the cryptocurrency as legal tender.
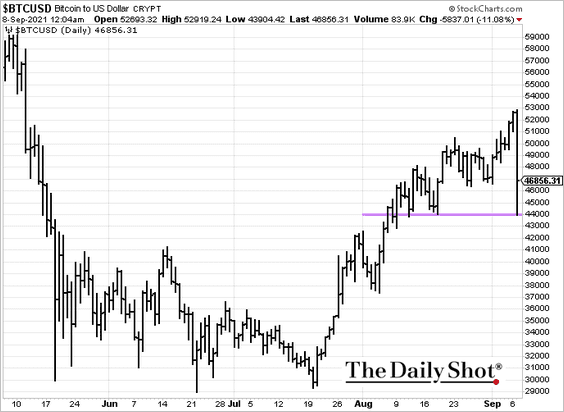
 Source: CoinDesk Read full article
• Long positions were quickly liquidated as traders faced margin calls.
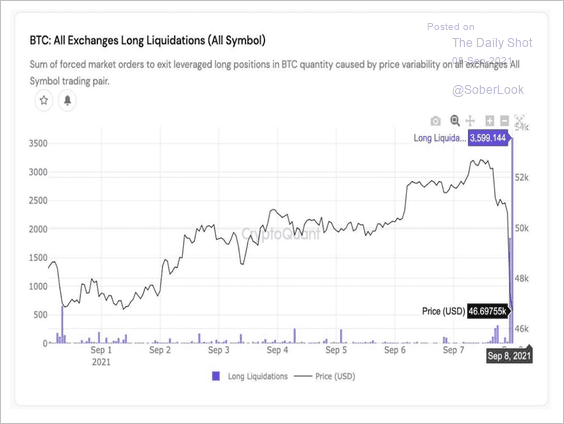 Source: CryptoQuant
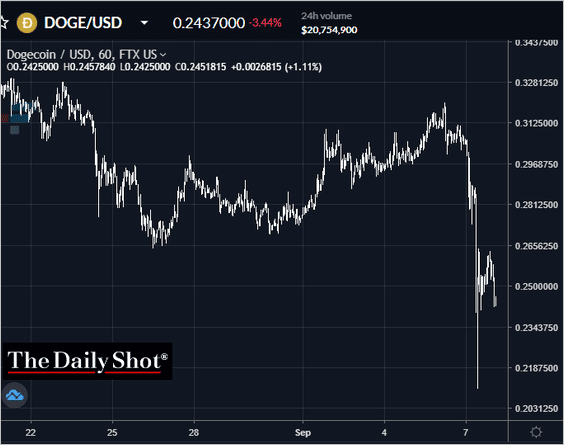
• Other cryptos followed.
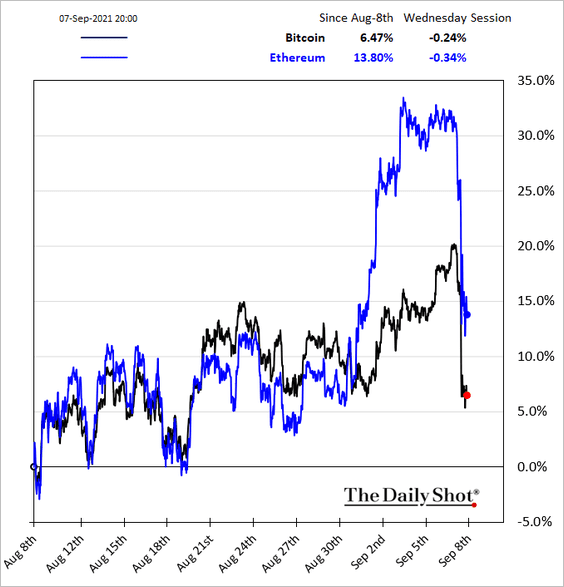
 Source: MarketWatch Read full article
Dogecoin is trading below 25c.
• Exchanges ran into technical difficulties again.
 Source: Fox Business Read full article
——————–
2. El Salvador’s President Nayib Bukele appeared to be unphased.
 Source: @nayibbukele
3. Digital asset investment funds saw inflows for the third consecutive week as of September 3.
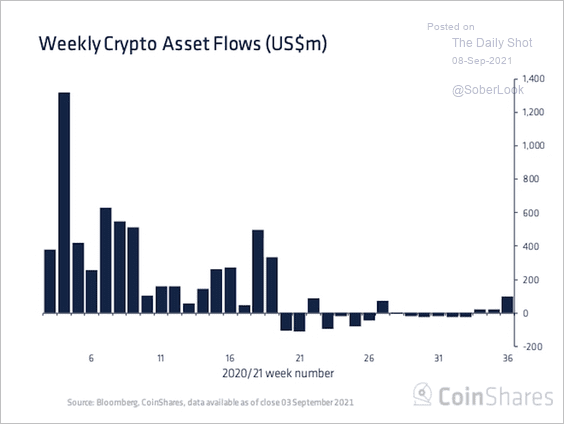 Source: CoinShares
4. The total market value of decentralized finance (DeFi) reached an all-time high near $140 billion shortly before the crypto sell-off.
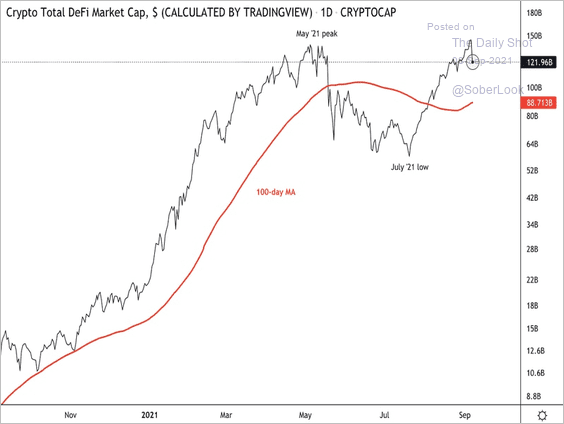 Source: Dantes Outlook
Back to Index
Commodities
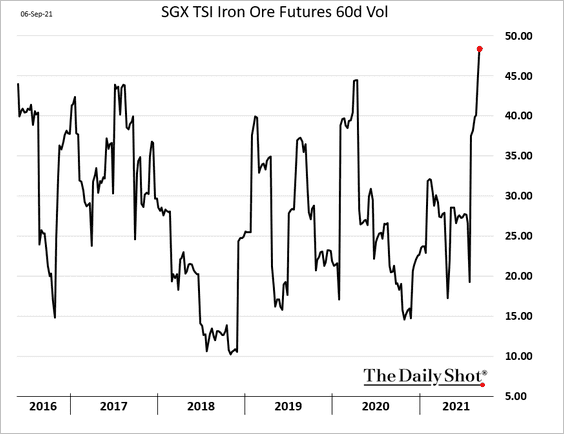
1. Iron ore remains under pressure, …
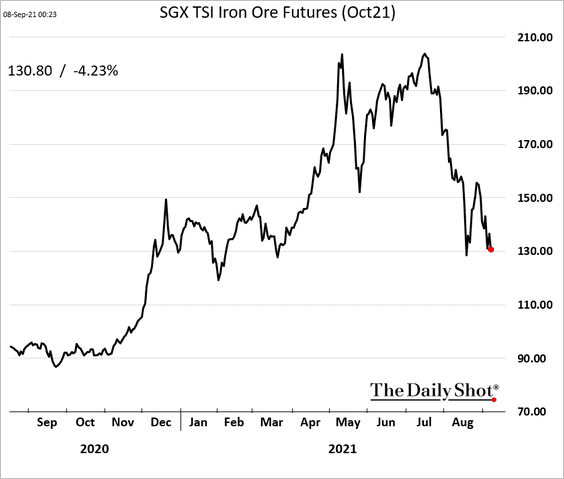
… as volatility spikes.
 h/t @krystalchia
——————–
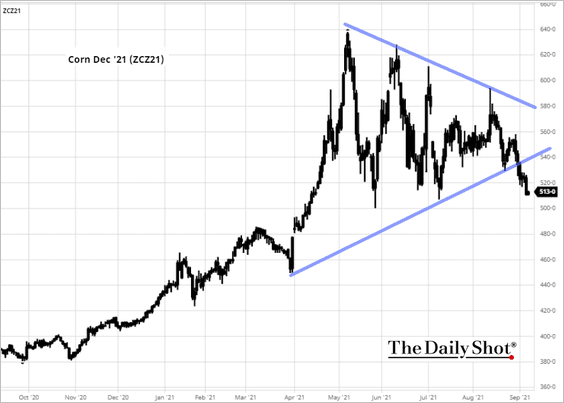
2. The December US corn contract broke below support as crop outlook improves.
 Source: barchart.com
3. Investors continued to pull money out of commodity ETFs, mostly from gold funds, according to State Street.
 Source: SPDR Americas Research, @mattbartolini
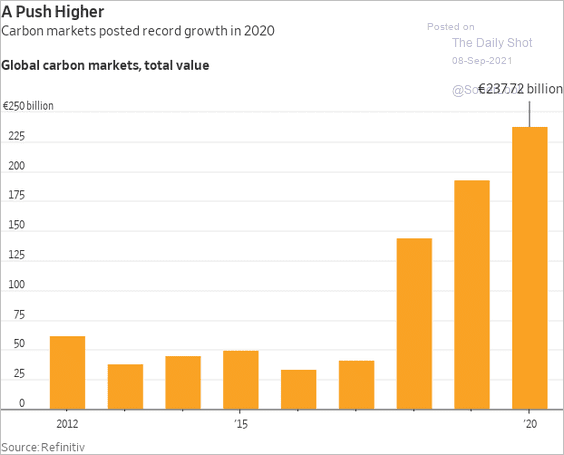
4. Carbon markets’ growth has been impressive.
 Source: @WSJ Read full article
Back to Index
Energy
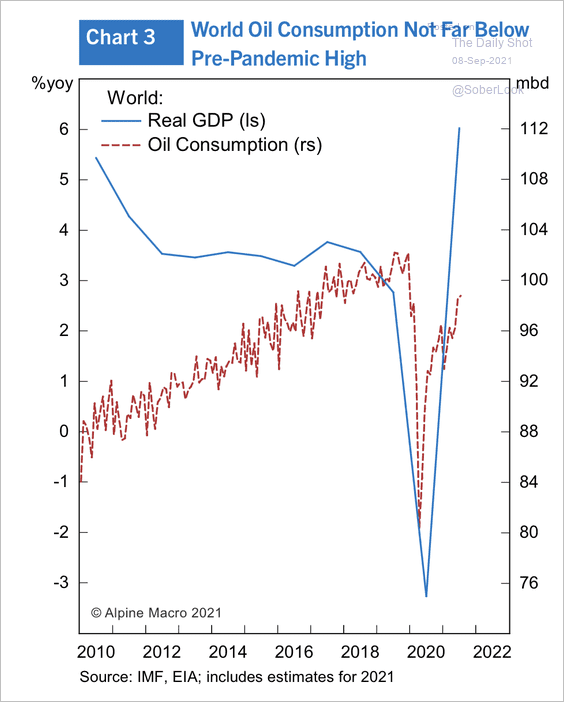
1. Global oil consumption is approaching pre-pandemic levels.
 Source: Alpine Macro
2. Hedge funds’ energy-sector (equities) exposure is the lowest in ten years.
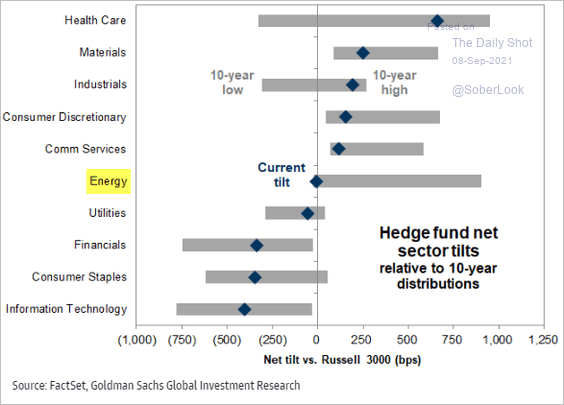 Source: Goldman Sachs
Back to Index
Equities
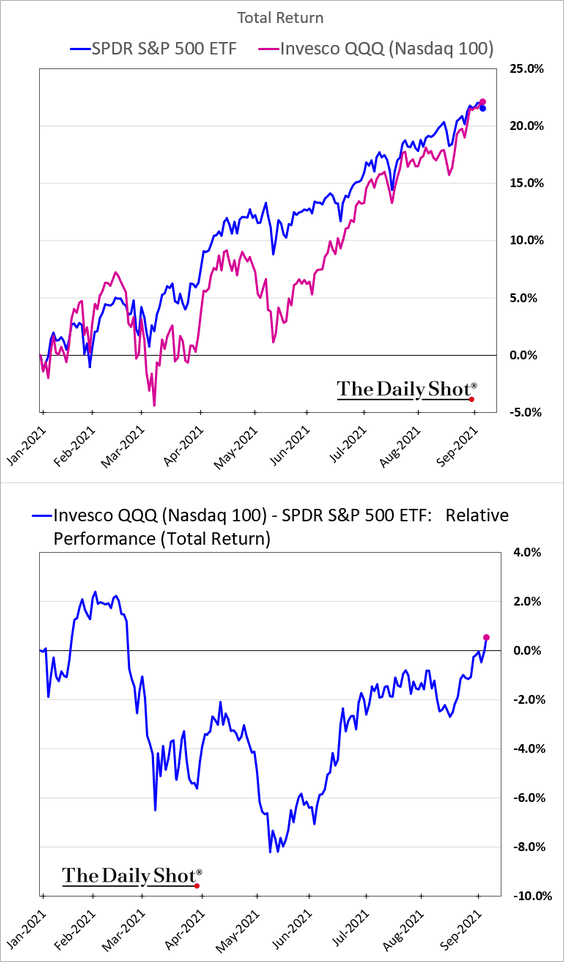
1. Year-to-date, the Nasdaq 100 is now outperforming the S&P 500 (on a total-return basis).
2. All sectors except energy appear to be overbought relative to their 50-day moving averages.
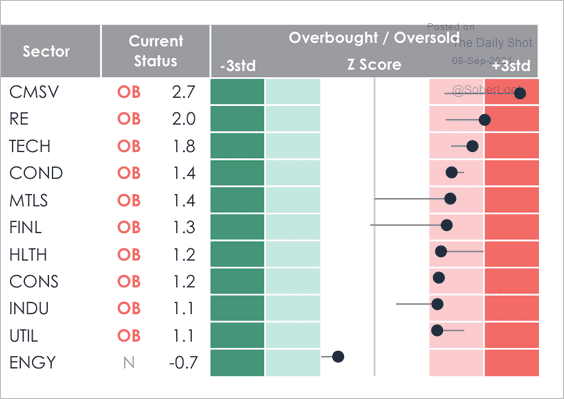 Source: MarketDesk Research
3. It has been a record-breaking rally off the lows, with historic patterns calling for flattening from here.
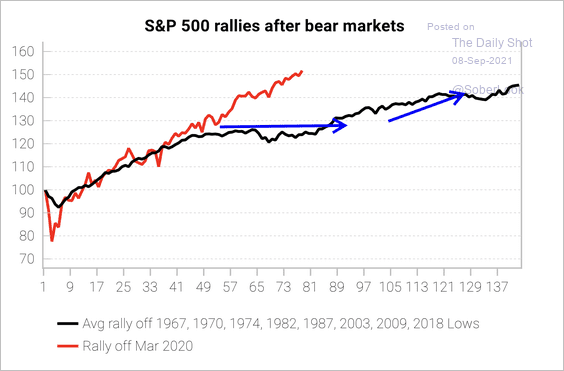 Source: Variant Perception
4. Flows remain well above historical averages.
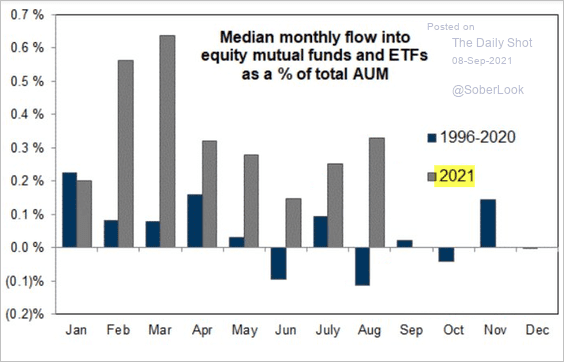 Source: Goldman Sachs
• But equity ETF flows have declined relative to fixed income lately (chart shows rolling 3-month flows equities-bonds in billions).
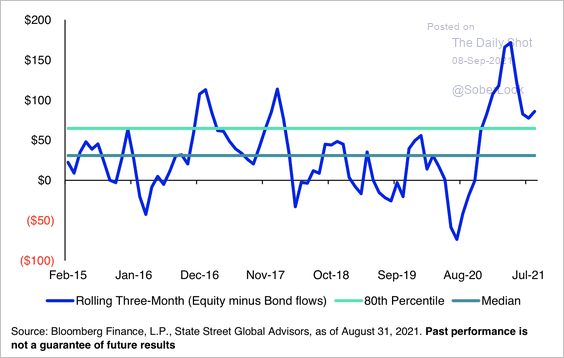 Source: SPDR Americas Research, @mattbartolini
• Developed markets’ ex-US equity ETFs registered inflows in August for the 14th month in a row.
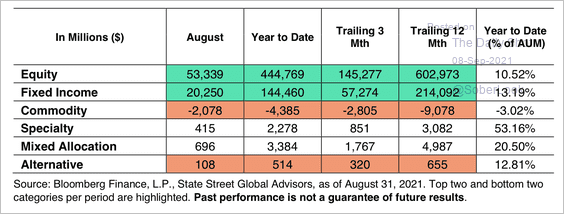 Source: SPDR Americas Research, @mattbartolini
——————–
5. Historically, given the current valuations, returns over the next 12 months are expected to be poor.
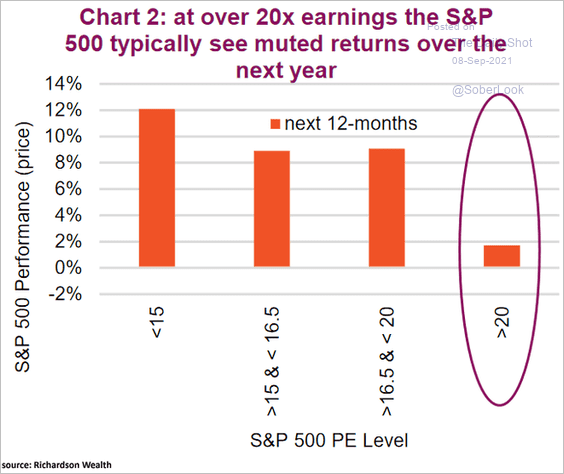 Source: Market Ethos, Richardson GMP
6. The relative performance of “reopening” vs. “lockdown” stocks tracks the 30yr Treasury yield.
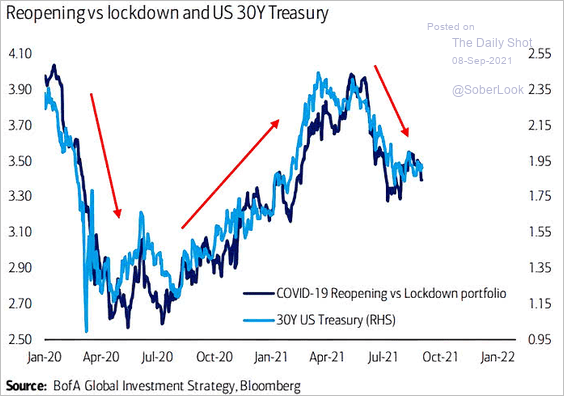 Source: @ISABELNET_SA, @BofAML
7. The 50 largest stocks represent 20% of the S&P Total Market Index.
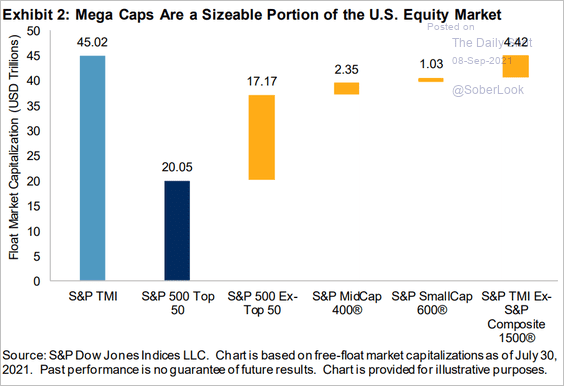 Source: S&P Global Market Intelligence
Here are the concentrations by sector.
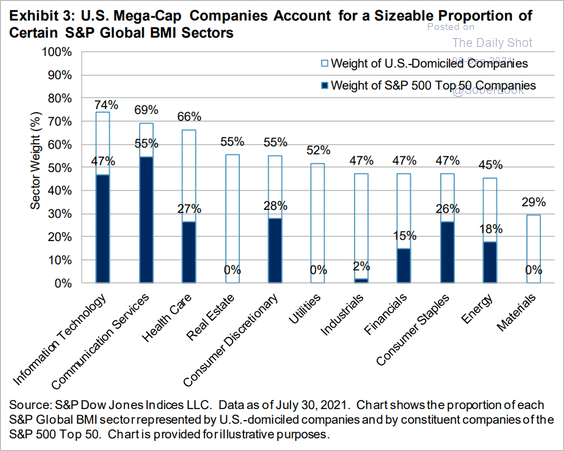 Source: S&P Global Market Intelligence
Back to Index
Alternatives
1. Nobody wants to invest in senior homes.
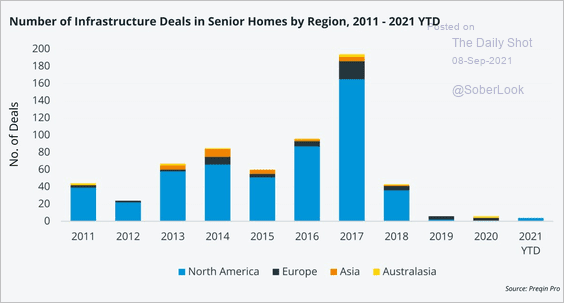 Source: @Preqin Read full article
2. Yale’s endowment is betting heavily on private markets.
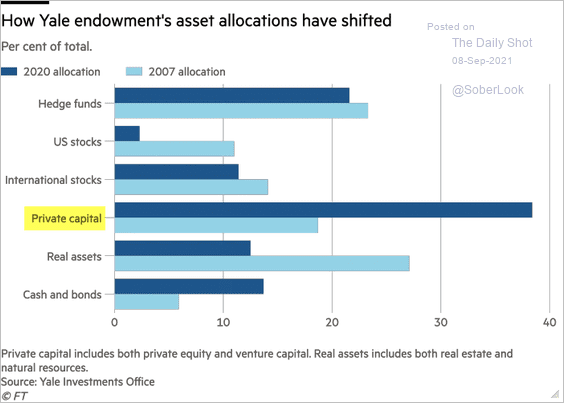 Source: @financialtimes Read full article
Back to Index
Credit
1. The US corporate debt burden is at multi-decade lows (amid depressed corporate bond yields).
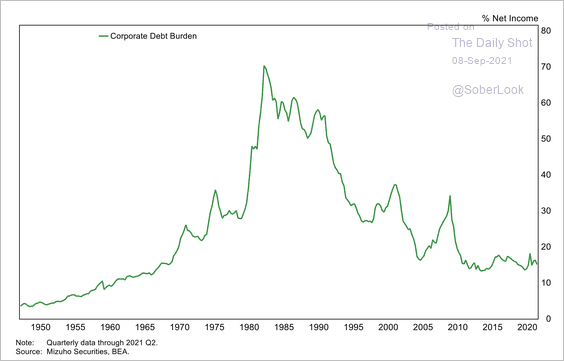 Source: Mizuho Securities USA
2. Corporate lending is increasingly dominated by “shadow banks” (funds, CLOs, etc.).
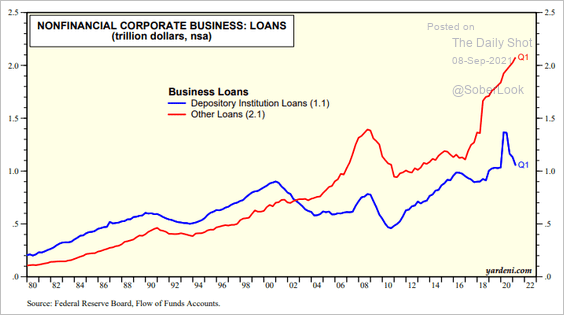 Source: Yardeni Research
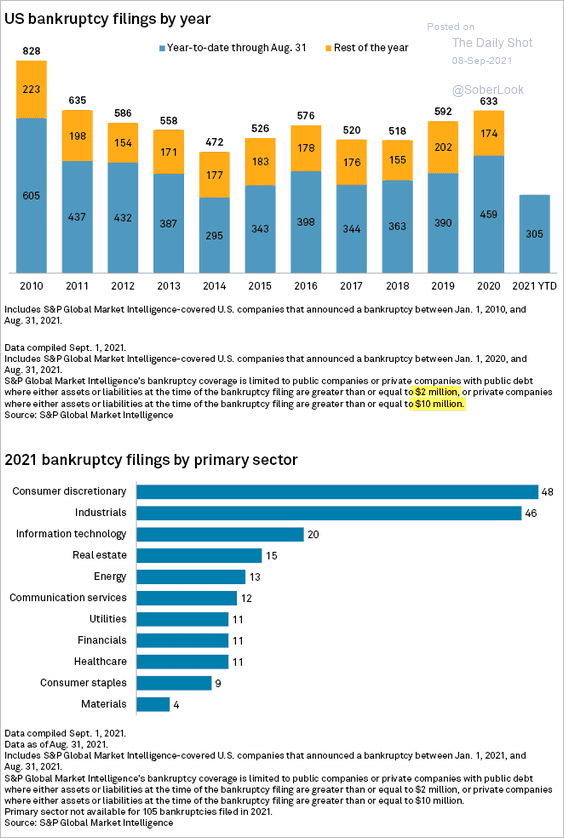
3. Next, we have some data on US bankruptcy filings from S&P Global.
 Source: SPDR Americas Research, @mattbartolini
4. Growth in multifamily lending has offset bank concentrations in non-residential and construction lending.
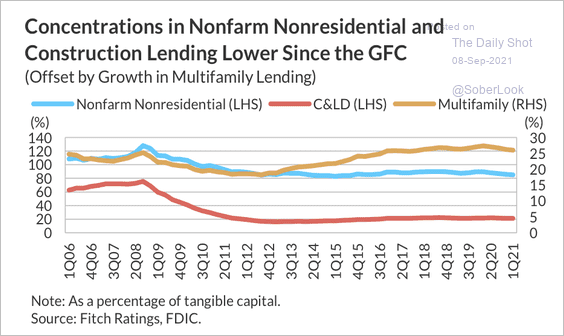 Source: Fitch Ratings
5. Hotel and retail property commercial mortgage-backed securities (CMBS) delinquencies remain elevated.
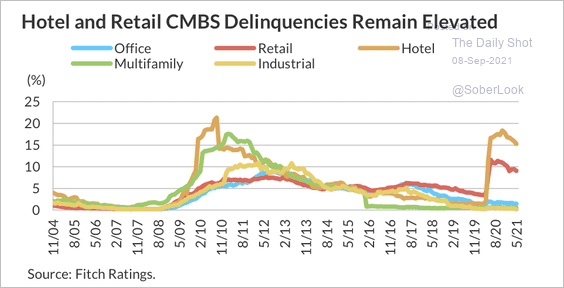 Source: Fitch Ratings
Back to Index
Global Developments
1. Incredibly, despite all-time highs in stock markets, Soc Gen’s Multi-Asset Risk indicator is flashing caution equivalent to March 2020.
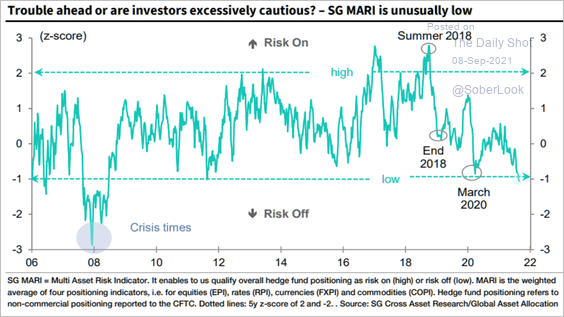 Source: Soc Gen, The Market Ear, Snippet.Finance
2. The share of global debt with negative yields remains elevated.
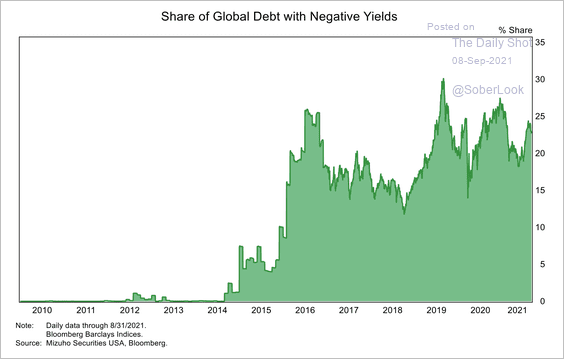 Source: Mizuho Securities USA
3. The Swiss franc and Japanese yen have outperformed the dollar and risk-on “growth” currencies lately.
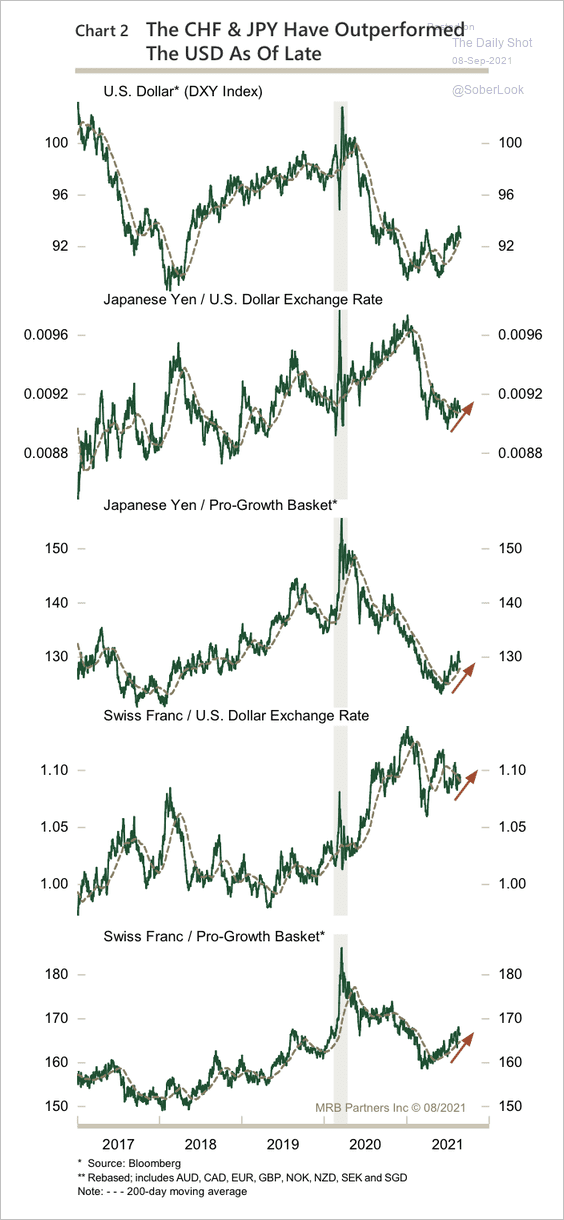 Source: MRB Partners
4. Developed markets’ ETFs have seen consistently higher net flows than emerging markets, where flows have been rolling over (2 charts).
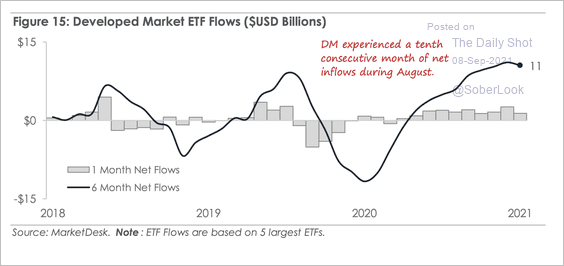 Source: MarketDesk Research
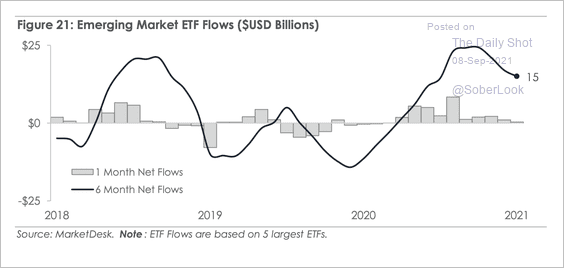 Source: MarketDesk Research
——————–
5. Next, we have a forecast for central banks’ balance sheets from Cornerstone Macro.
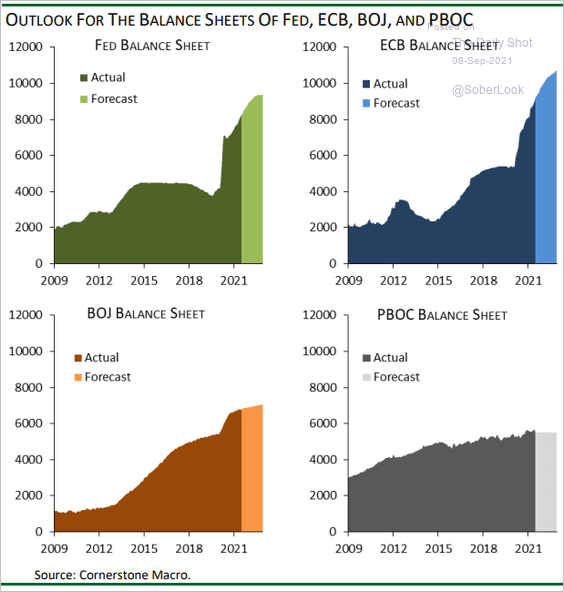 Source: Cornerstone Macro
6. The global stimulus impulse has been negative.
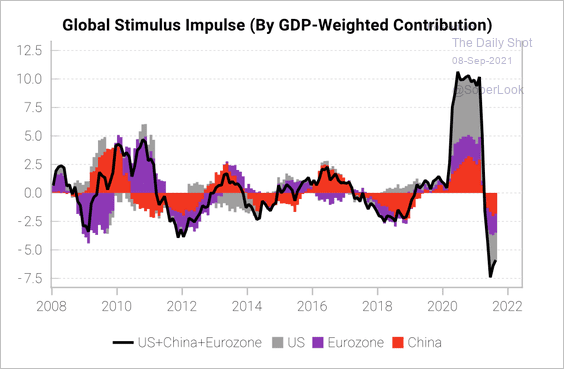 Source: Variant Perception
——————–
Food for Thought
1. 61% of US households paid no income tax last year.
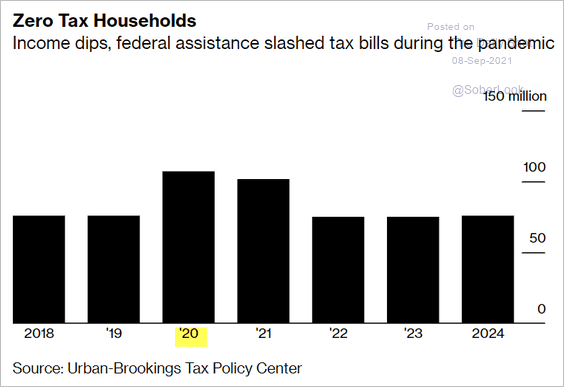 Source: Bloomberg Read full article
2. S&P 500 effective corporate tax rates by sector:
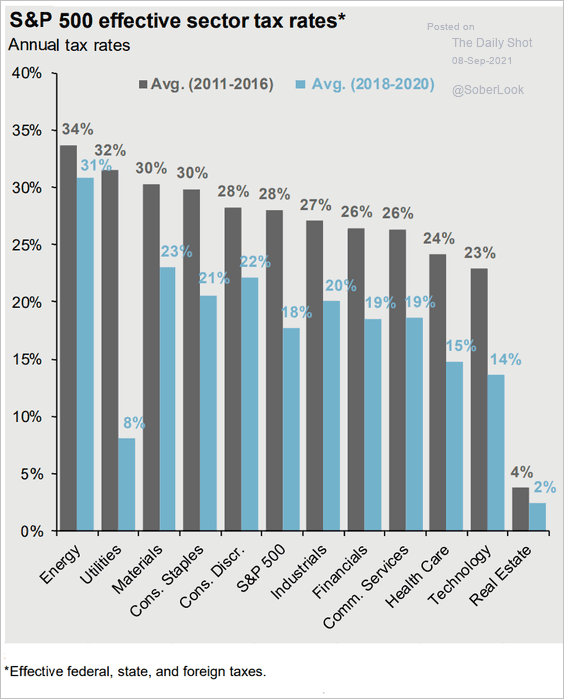 Source: J.P. Morgan Asset Management
3. US auto workers employed by foreign firms:
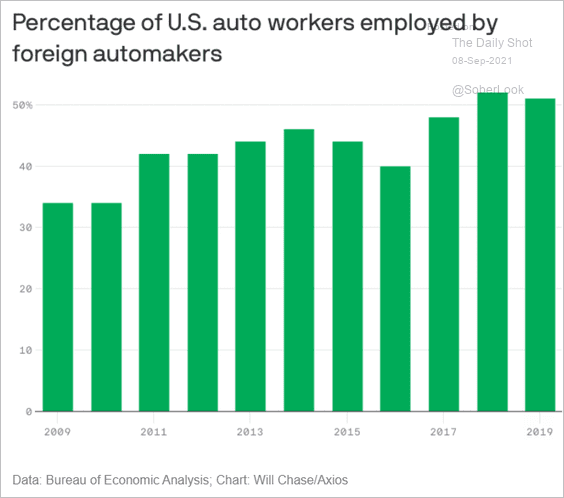 Source: @axios Read full article
4. Using virtual try-on technology:
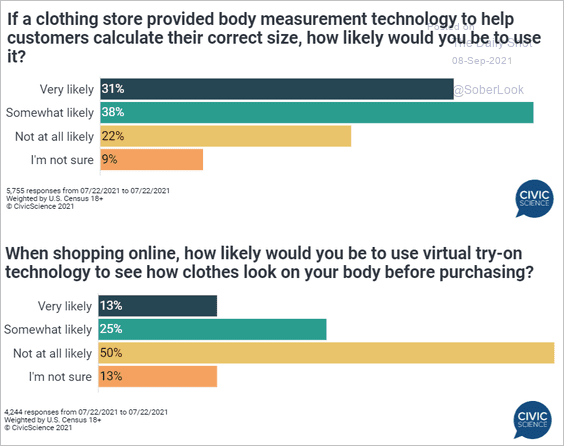 Source: @CivicScience Read full article
5. The US e-commerce market:
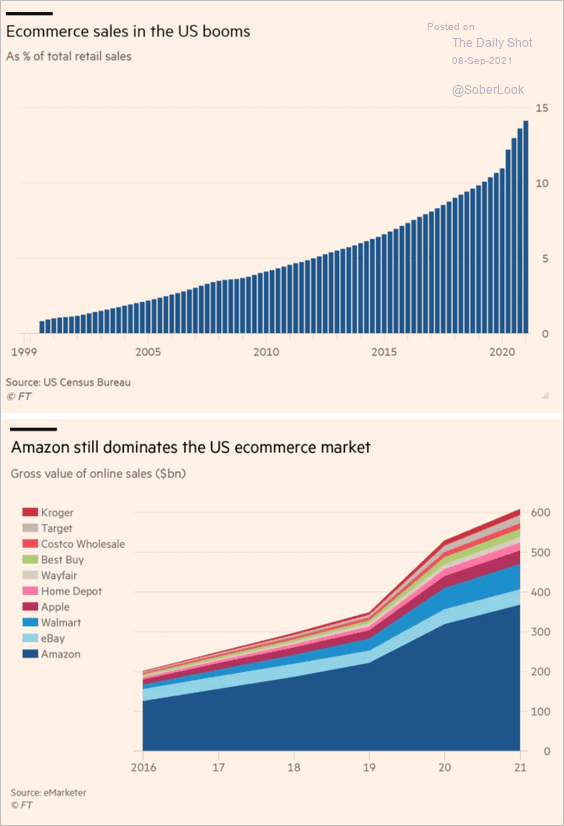 Source: @financialtimes Read full article
6. Proposed US federal government outlays as a percent of GDP:
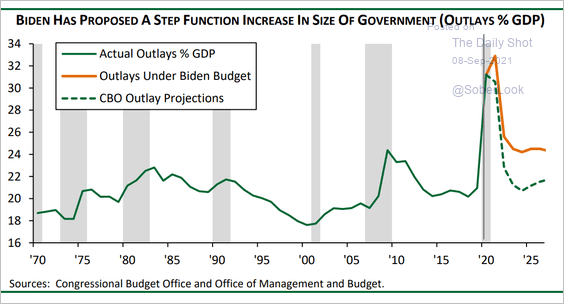 Source: Cornerstone Macro
7. Extreme weather patterns:
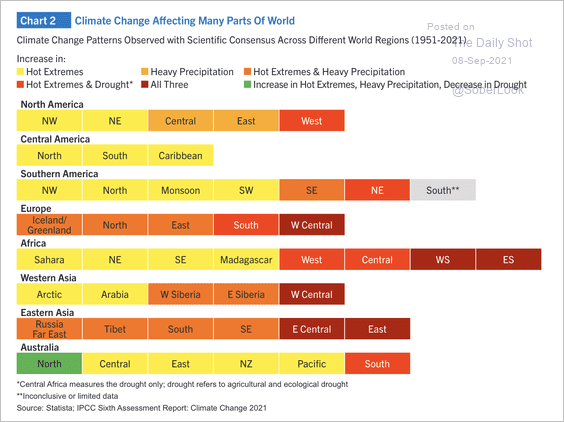 Source: Alpine Macro
8. Warmer ocean water powering stronger hurricanes:
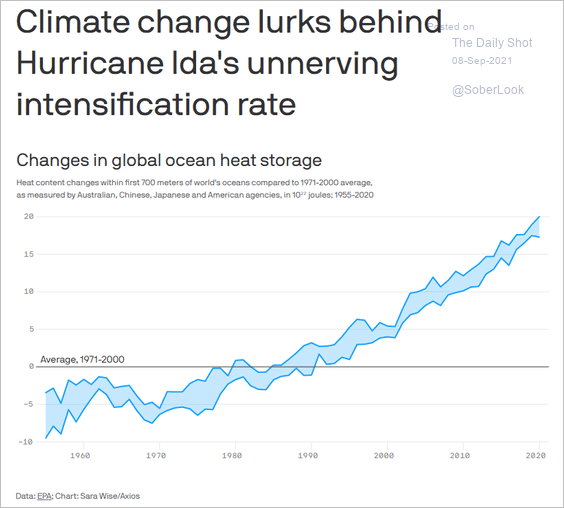 Source: @axios Read full article
9. Refugees resettled in the US:
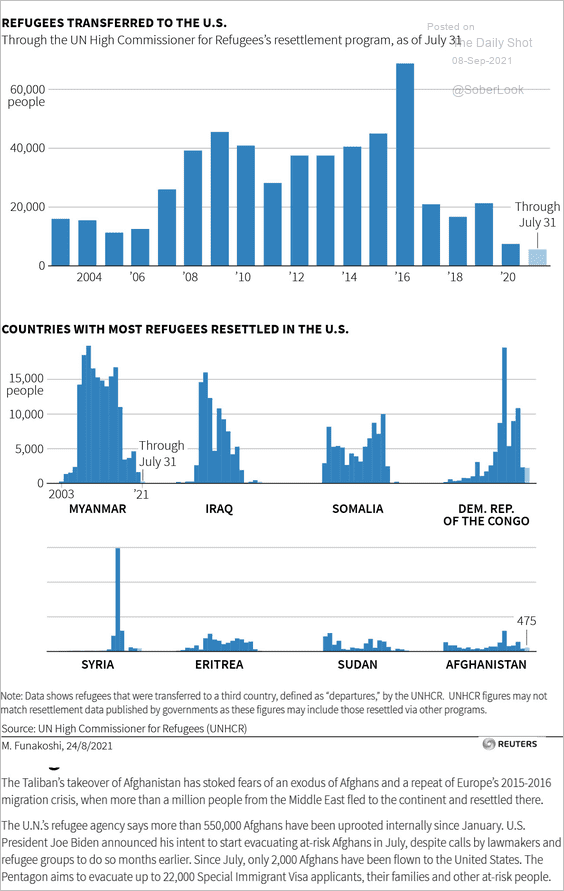 Source: @ReutersGraphics Read full article
10. Foreign investment in Afghanistan:
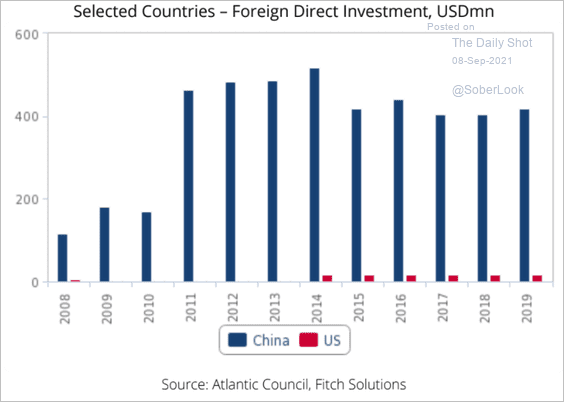 Source: Fitch Solutions Macro Research
11. Archaeological sites of the Pre-Pottery Neolithic period (7500 BCE):
 Source: Wikipedia Read full article
——————–
Back to Index