
The Daily Shot: 07-Sep-21
• The United States
• Canada
• The United Kingdom
• The Eurozone
• Japan
• Asia – Pacific
• China
• Emerging Markets
• Cryptocurrency
• Commodities
• Energy
• Equities:
• Credit
• Rates
• Global Developments
• Food for Thought
The United States
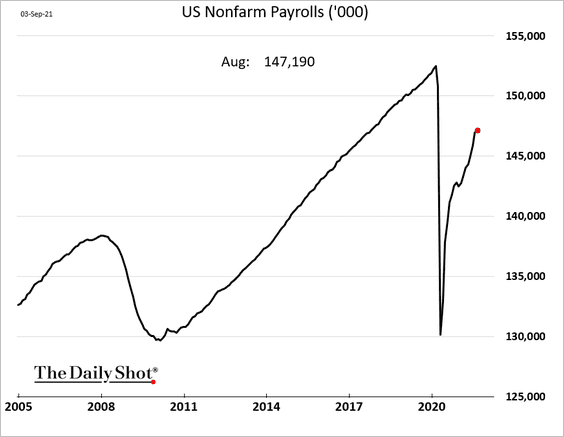
1. The August payrolls report was disappointing, with the number of jobs created coming in well below forecasts.
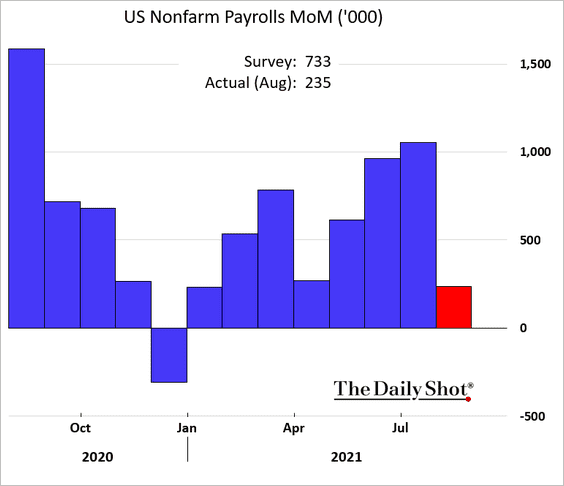
• Many analysts blame the negative surprise on the Delta variant spike.
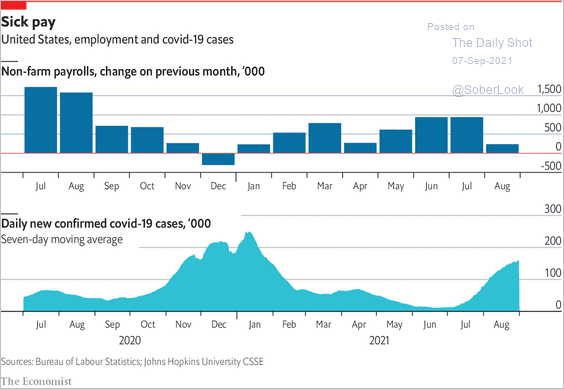 Source: The Economist Read full article
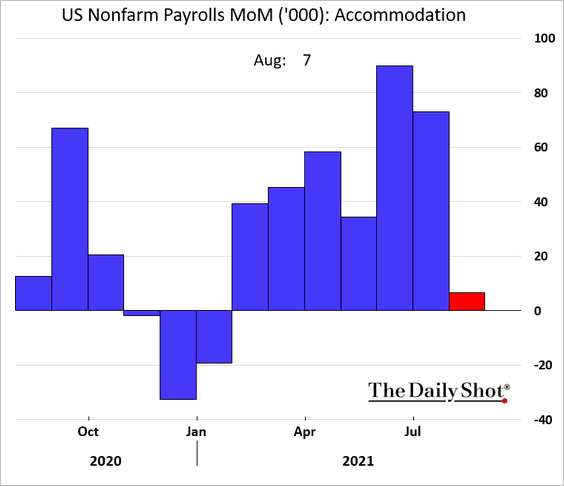
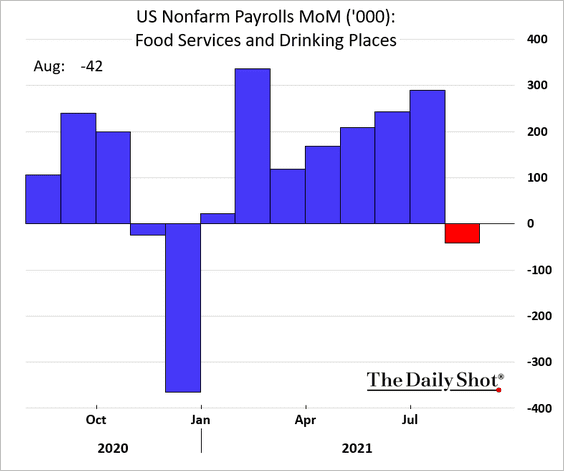
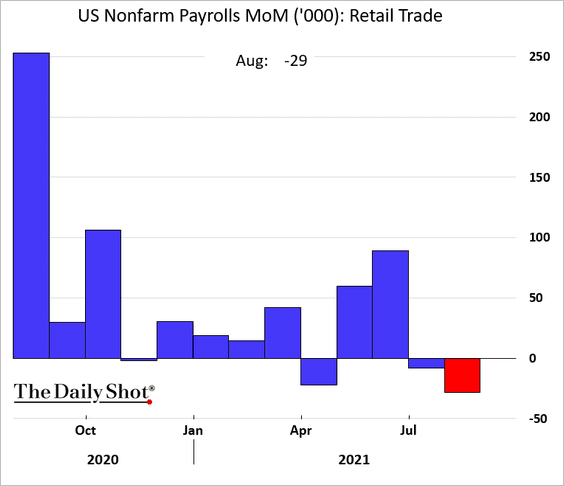
Indeed, some of the vulnerable sectors experienced weak job gains.
– Hotels:
– Restaurants and bars:
– Retail:
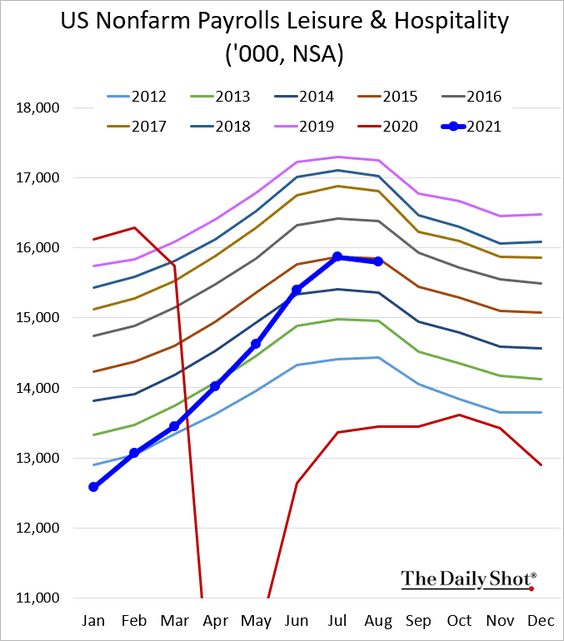
This chart shows the total Leisure & Hospitality payrolls leveling off.
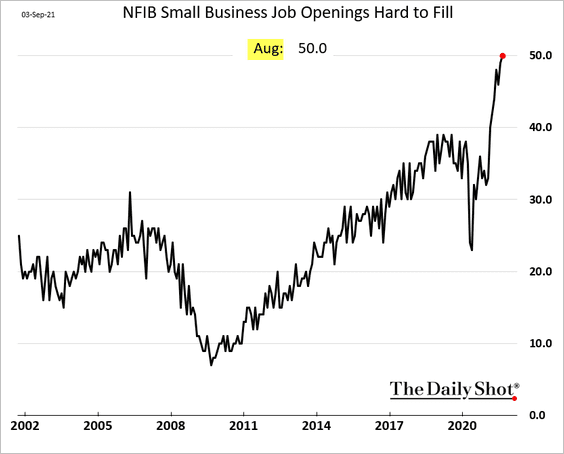
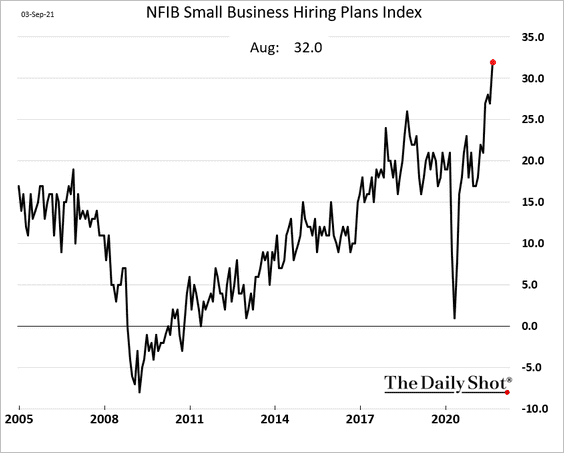
• But there is more to this story. Labor shortages also contributed to lower hiring last month as the job market continues to tighten.
– Small firms have not had this much difficulty hiring workers in recent history (a record high for this index).
– Small firms’ hiring plans index also hit a record high in August.
The hiring plans index points to a much lower unemployment rate ahead.
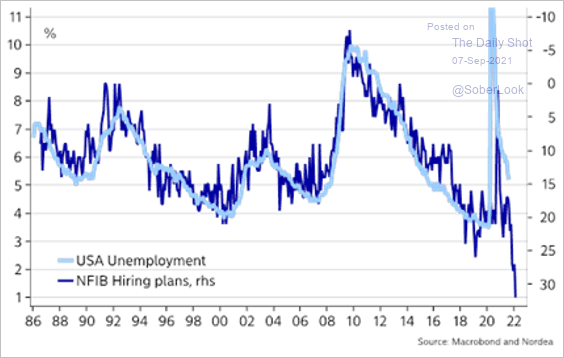 Source: @AndreasSteno
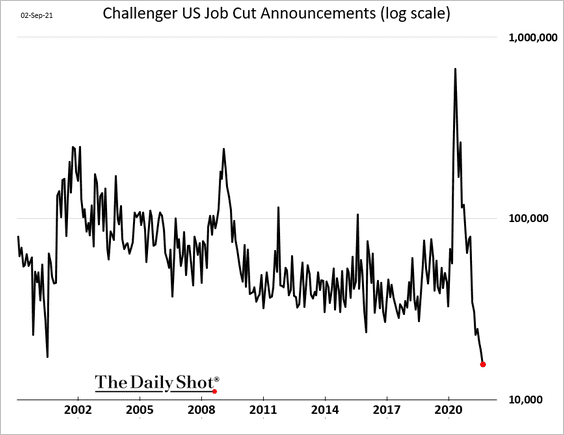
– The Challenger layoffs index hit a record low.
– Online search activity for Leisure & Hospitality jobs has deteriorated, pointing to labor supply challenges rather than demand weakness.
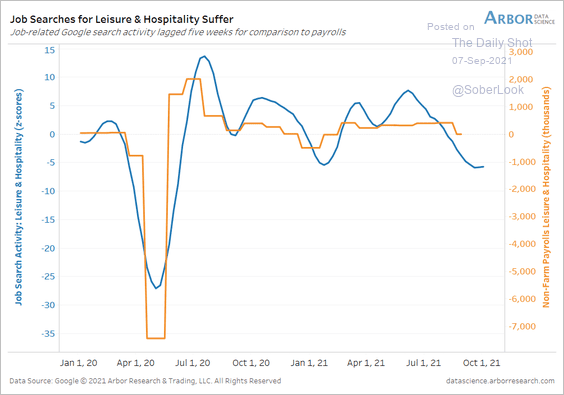 Source: Arbor Research & Trading
– Will the expiration of emergency benefits reduce labor shortages?
 Source: @axios Read full article
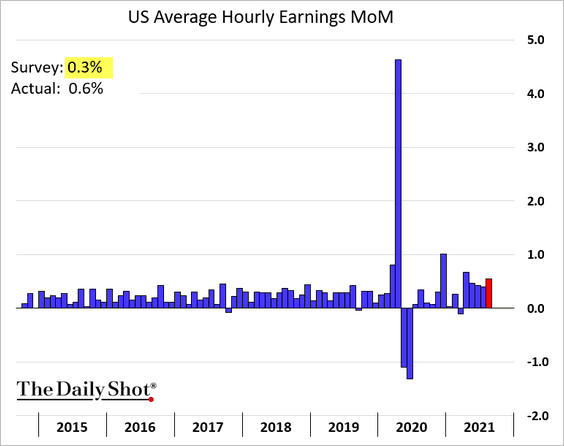
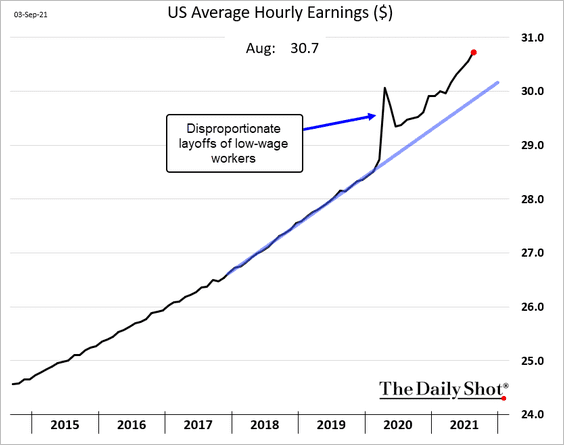
• Another indication of tightness in the labor markets is robust wage growth.
– Total wage gains (well above trend):
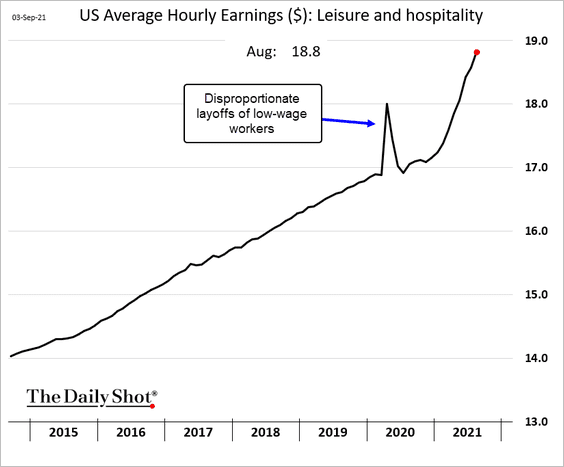
– Wage growth in Leisure & Hospitality:
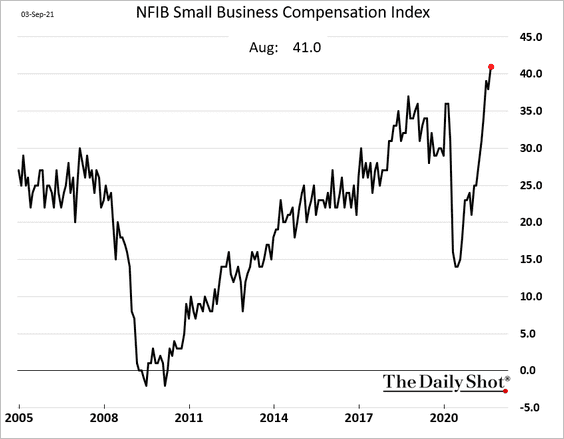
– The NFIB’s compensation index:
– Wage growth forecast from Nordea:
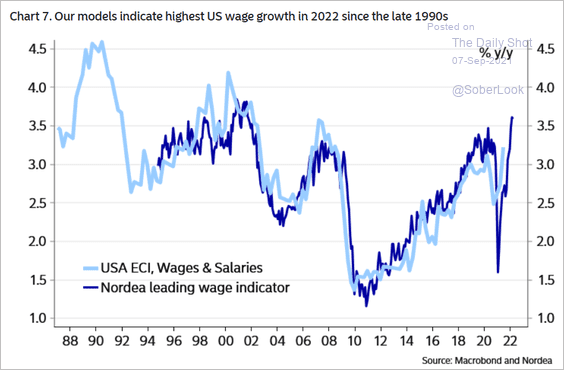 Source: Nordea Markets
– Walmart’s wage hike:
 Source: Reuters Read full article
– Labor movement putting upward pressure on wages:
 Source: @axios Read full article
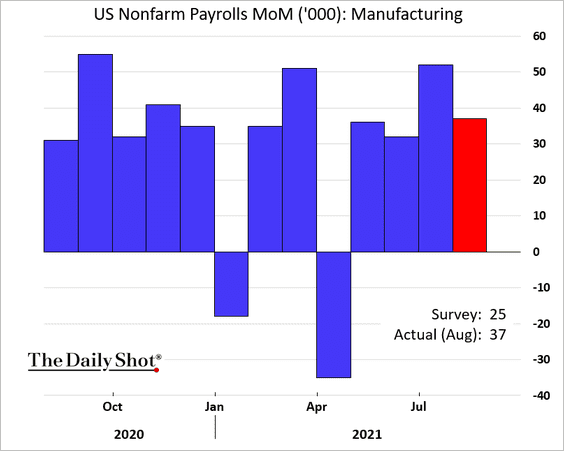
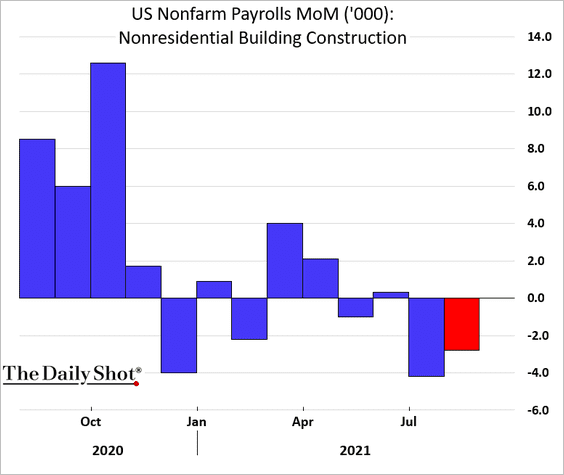
• Here are some additional updates on the labor market.
– Manufacturing payrolls:
– Nonresidential construction:
– Leaders and laggards:
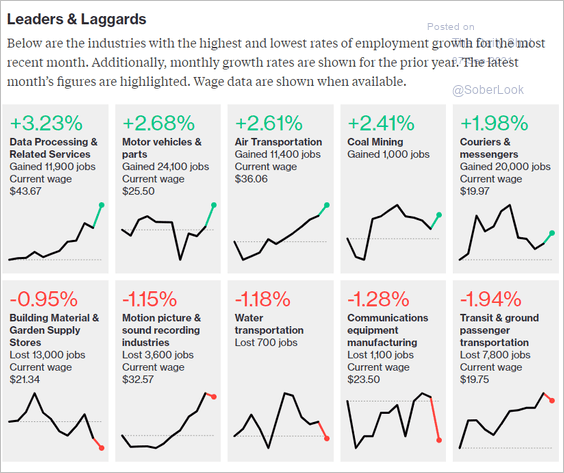 Source: @bbgvisualdata Read full article
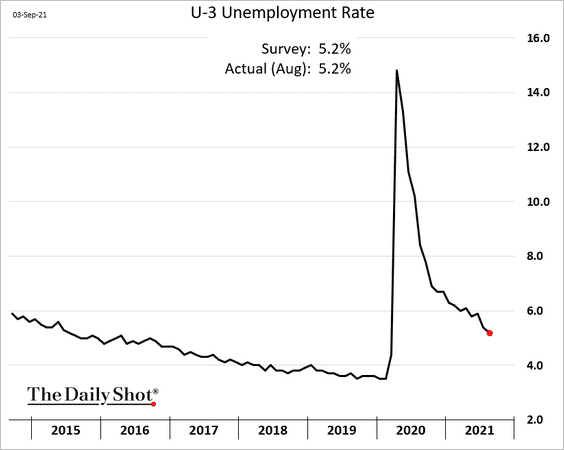
– The unemployment rate:
– Labor force participation (prime-age and total):
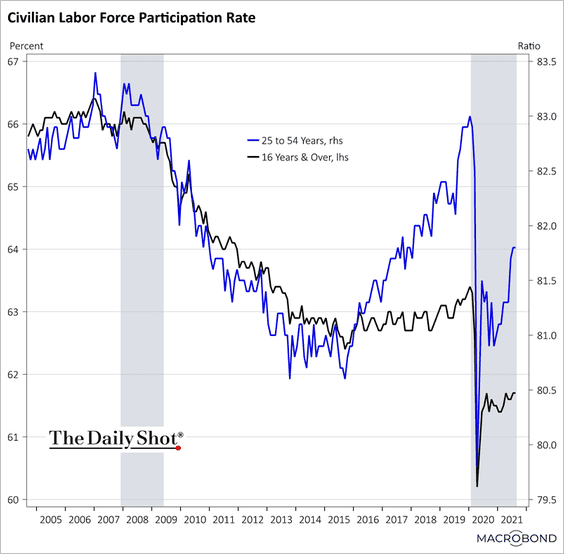 Source: Chart and data provided by Macrobond
– Workers re-entering the labor force:
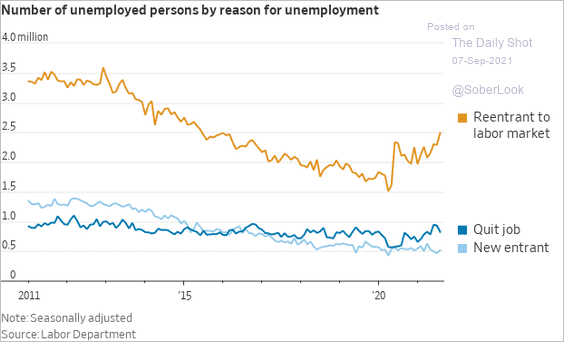 Source: @WSJ Read full article
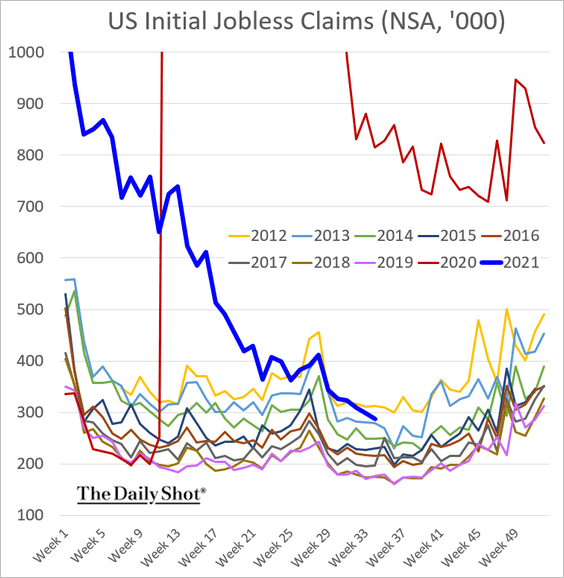
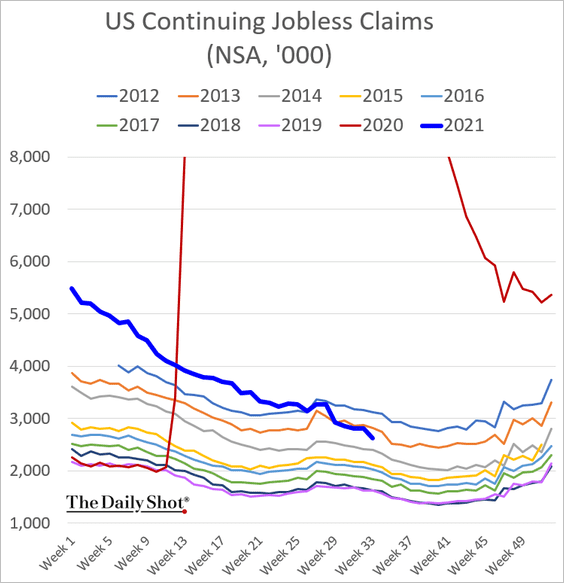
– Unemployment claims (from a different report):
——————–
2. The Atlanta Fed’s GDPNow model forecast for the Q3 GDP growth tumbled after the jobs report.
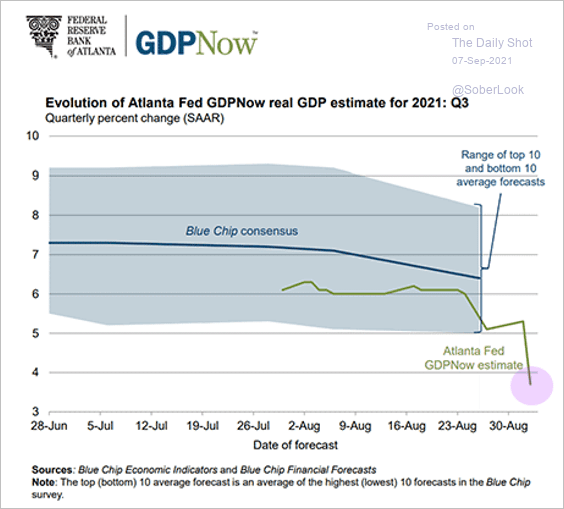 Source: @AtlantaFed Read full article
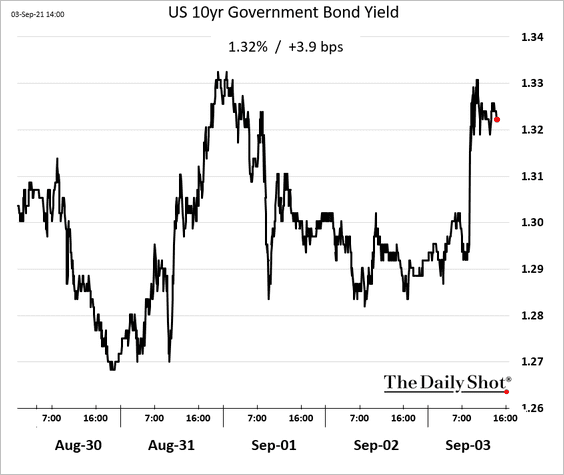
• Bond yields jumped, with the market expecting the Fed to let inflation run hotter in response to softer job gains.
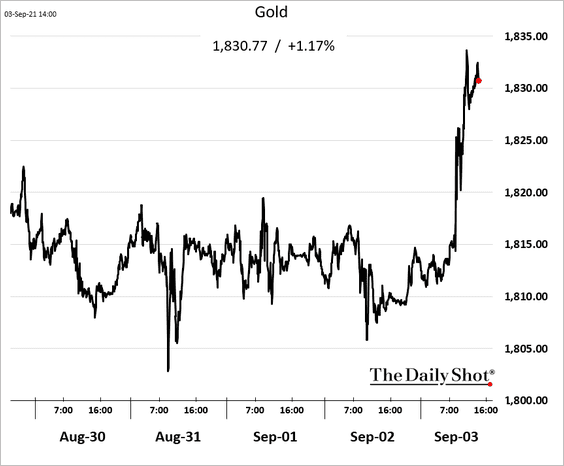
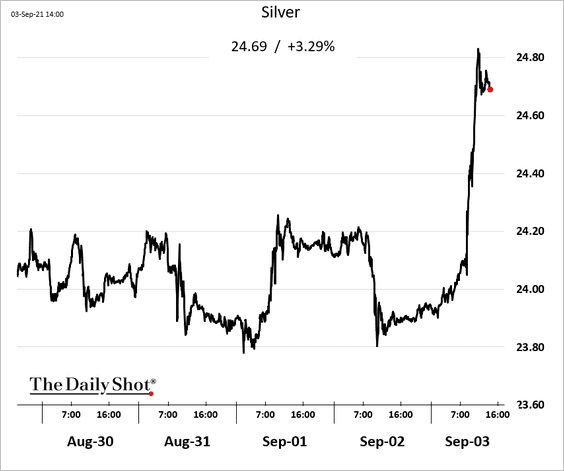
• Precious metals advanced.
——————–
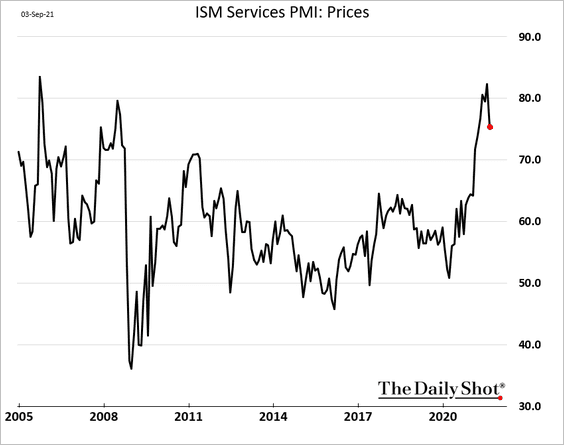
3. Service-sector activity held up well last month, according to the ISM report.
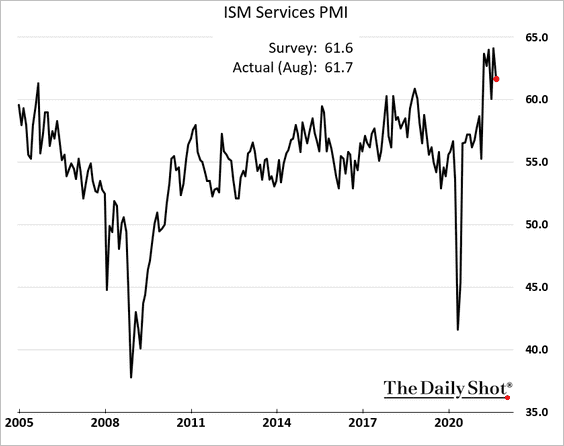
Supplier bottlenecks remain a problem, but there are signs that the situation is beginning to ease.
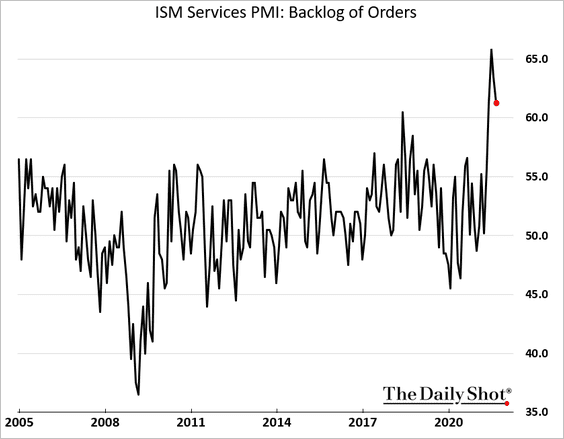
• Order backlog (peaking?):
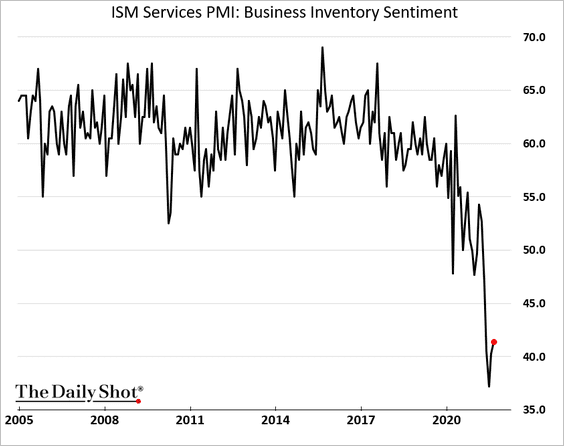
• Inventory sentiment:
• Prices:
A similar index from IHS Markit showed a more severe growth slowdown in services, with hiring stalling last month.
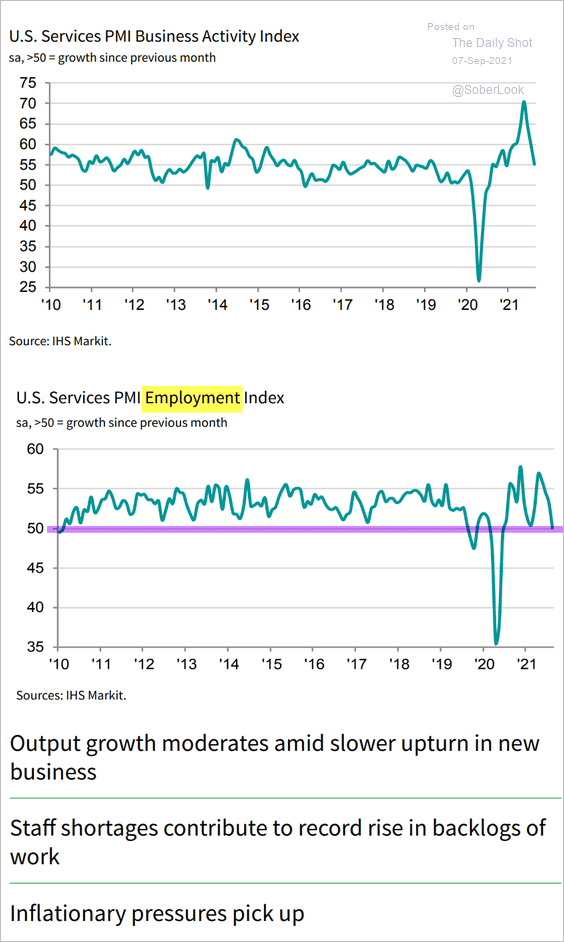 Source: IHS Markit
——————–
4. Finally, the US trade deficit is not as extreme when measured as a percentage of the GDP.
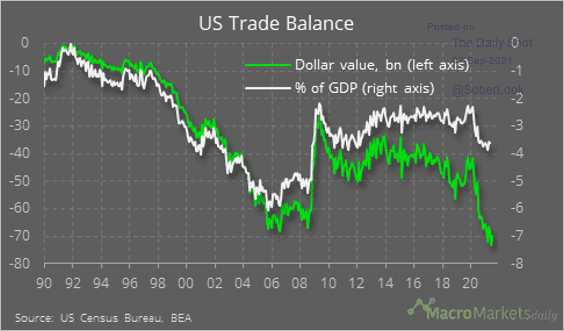 Source: @macro_daily
Back to Index
Canada
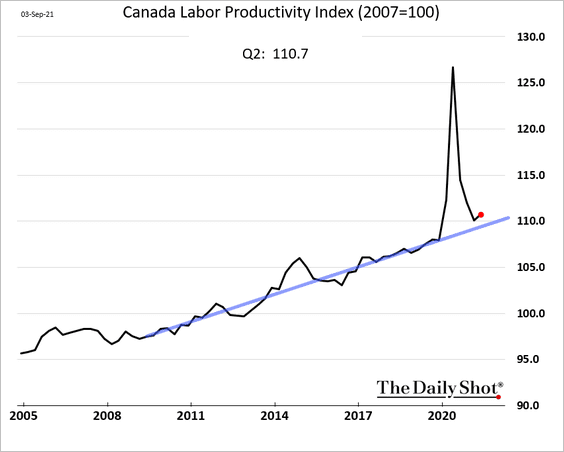
1. Canadian labor productivity has been growing at just over 1% per year since the financial crisis.
2. Here is a summary of the labor market recovery.
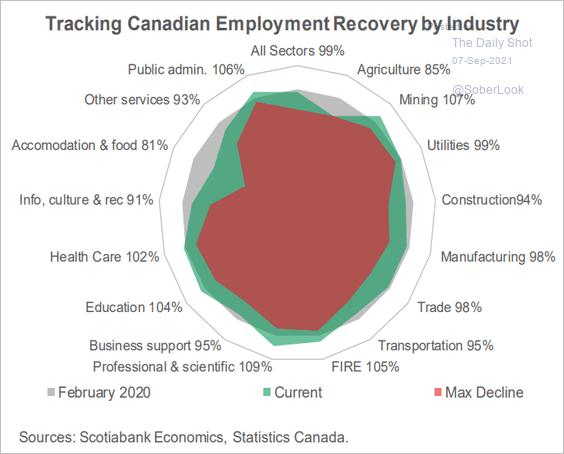 Source: Scotiabank Economics
3. Next, we have the latest political polls …
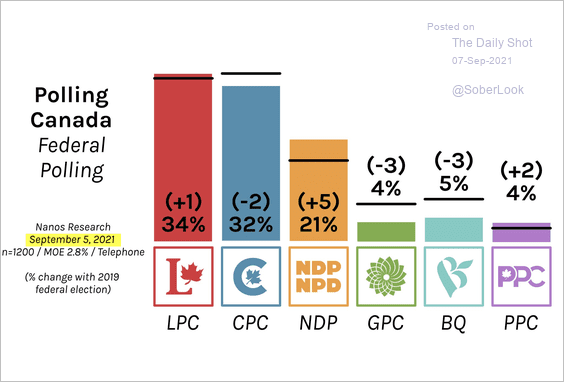 Source: @CanadianPolling, @338Canada
… and the betting markets’ odds.
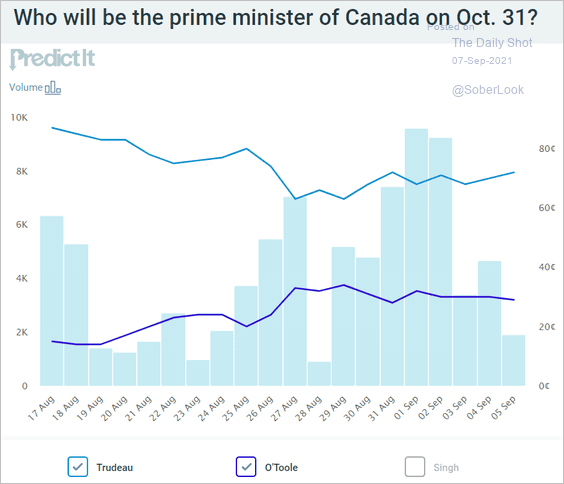 Source: @PredictIt
Back to Index
The United Kingdom
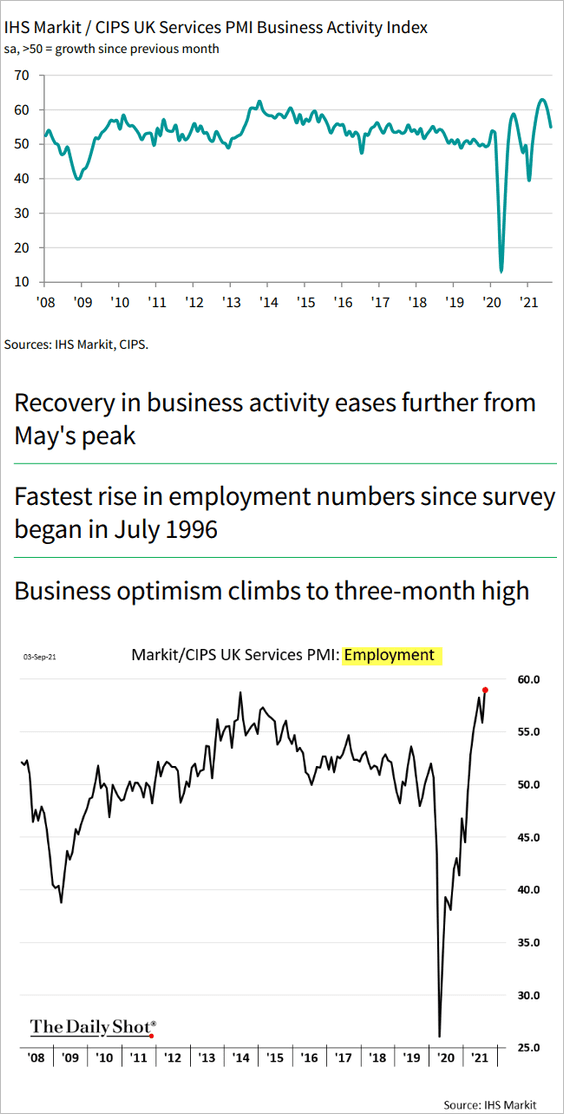
1. Service-sector activity expansion moderated last month, but hiring has been surging (2nd chart).
2. Construction growth has been slowing, …
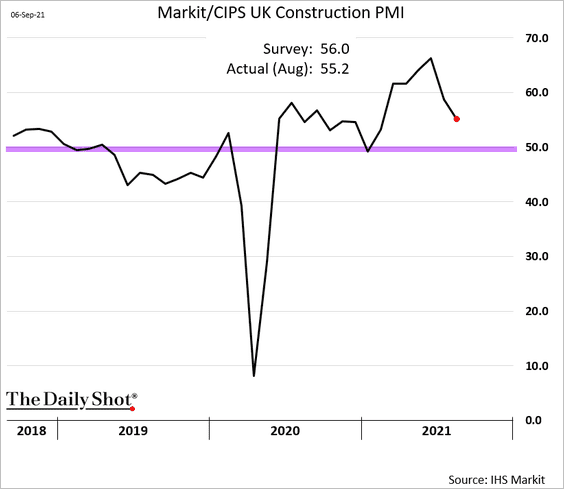
… constrained by supply bottlenecks and lack of workers.
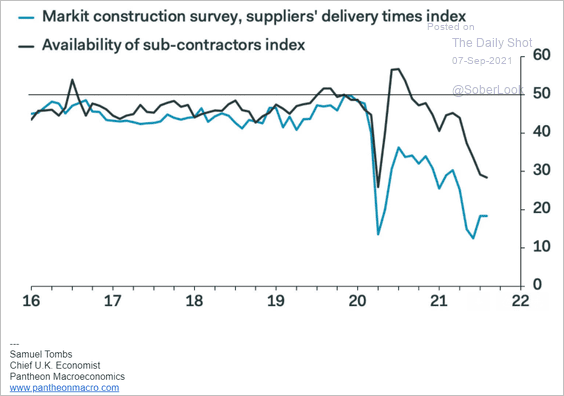 Source: Pantheon Macroeconomics
——————–
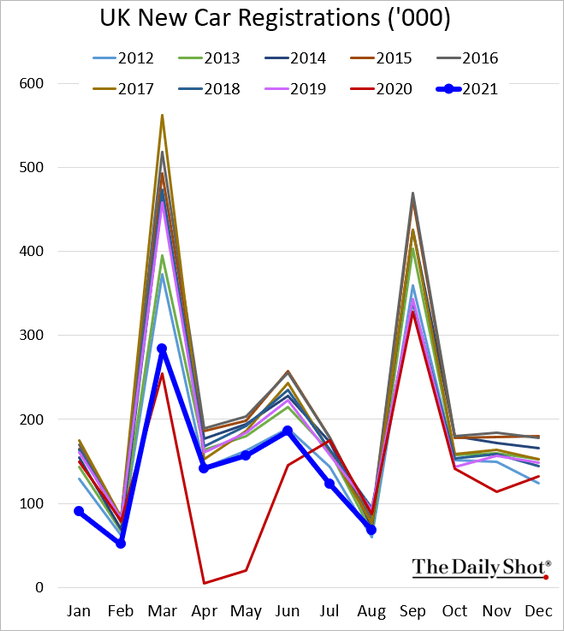
3. New car registrations were at multi-year lows for August.
4. M&A activity into the UK has spiked to 12% of market cap, nearly double the global average.
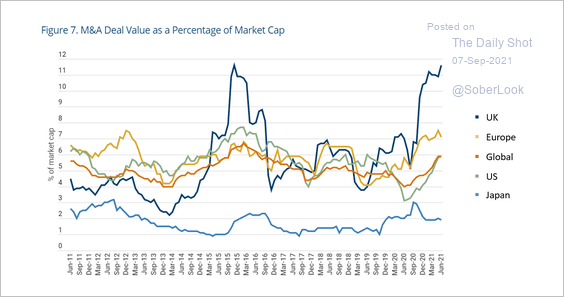 Source: Man Group Further reading
5. CapEx should rebound next quarter.
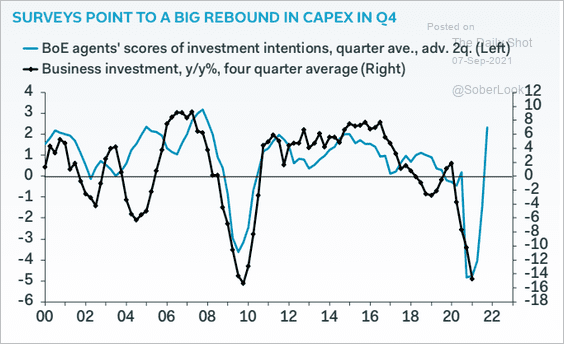 Source: Pantheon Macroeconomics
Back to Index
The Eurozone
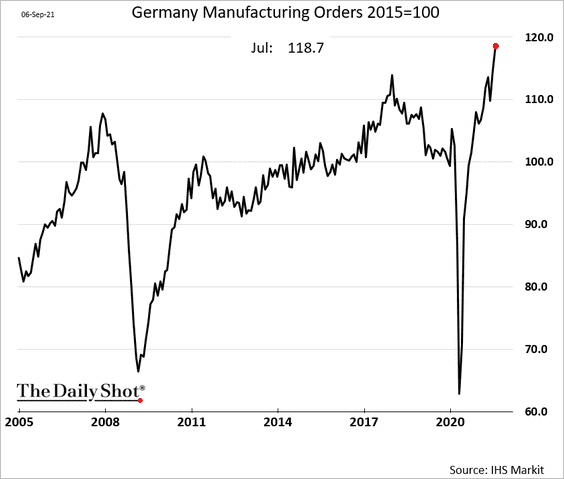
1. Let’s begin with Germany.
• Factory orders continued to surge in July.
Industrial production improved but remained on a downward trend, …
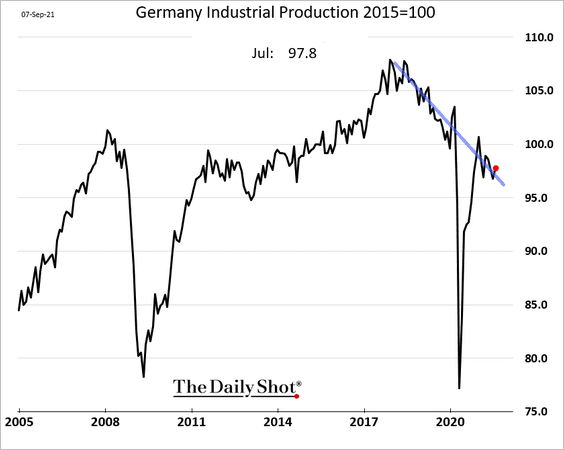
… dragged lower by softer car production.
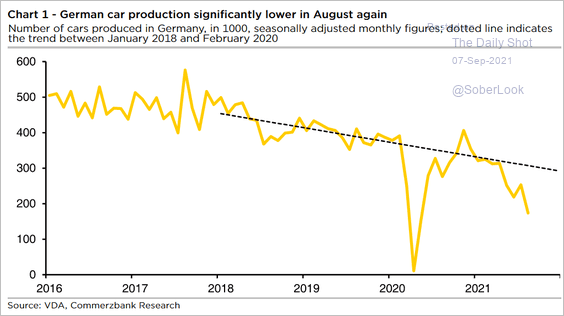 Source: Commerzbank Research
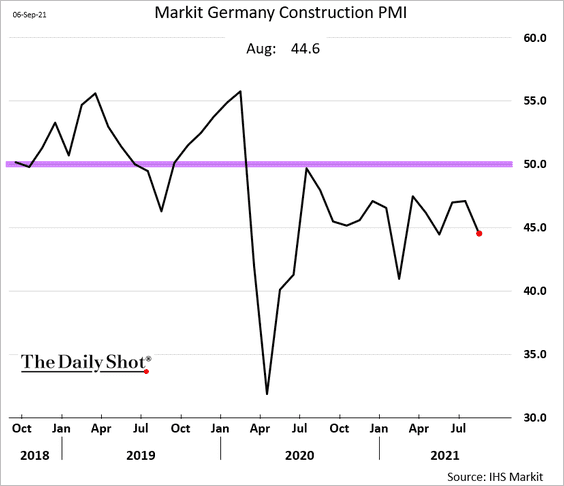
• Construction activity is still shrinking (PMI < 50).
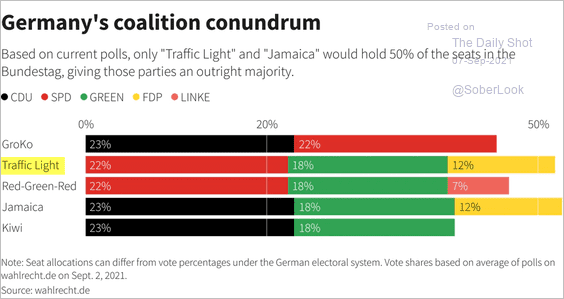
• The “Traffic Light” political coalition looks increasingly likely.
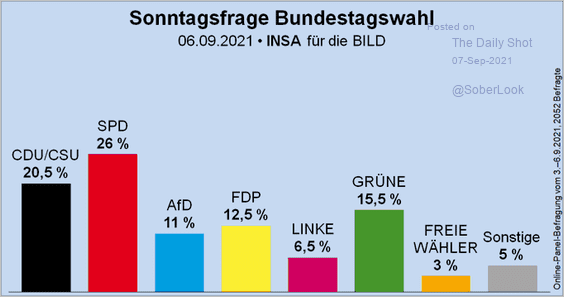 Source: @Wahlrecht_de Read full article
 Source: Reuters Read full article
——————–
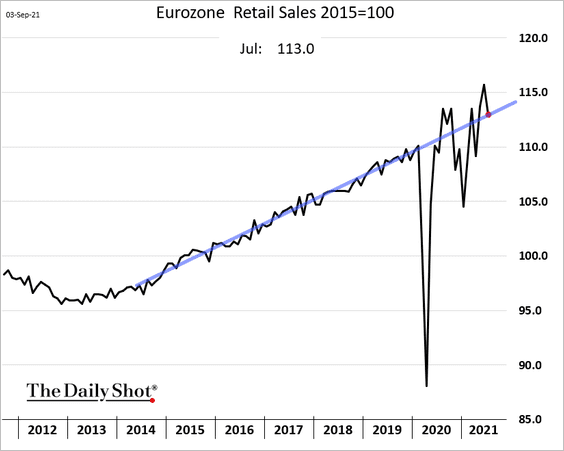
2. Euro-area retail sales dropped back to their multi-year trend in July.
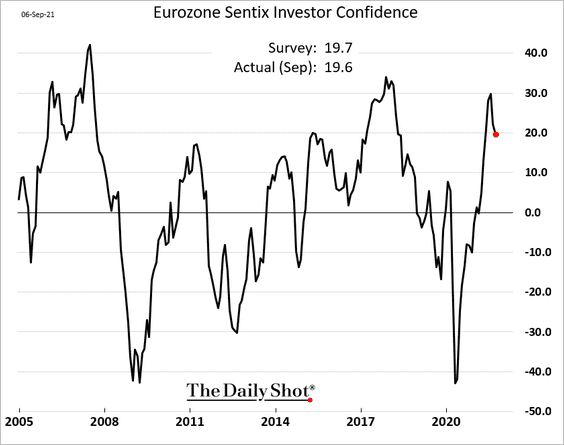
3. The Sentix investor confidence indicator is off the highs but remains healthy.
4. Labor shortages are expected to boost wage growth.
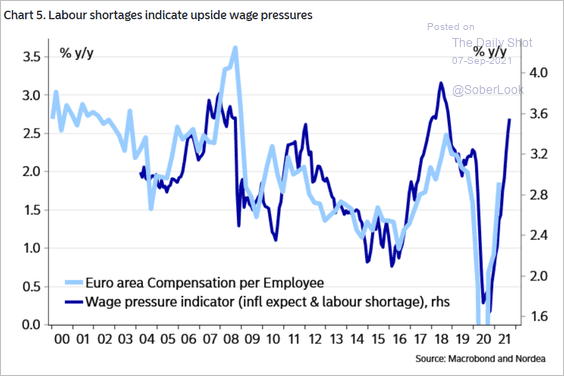 Source: Nordea Markets
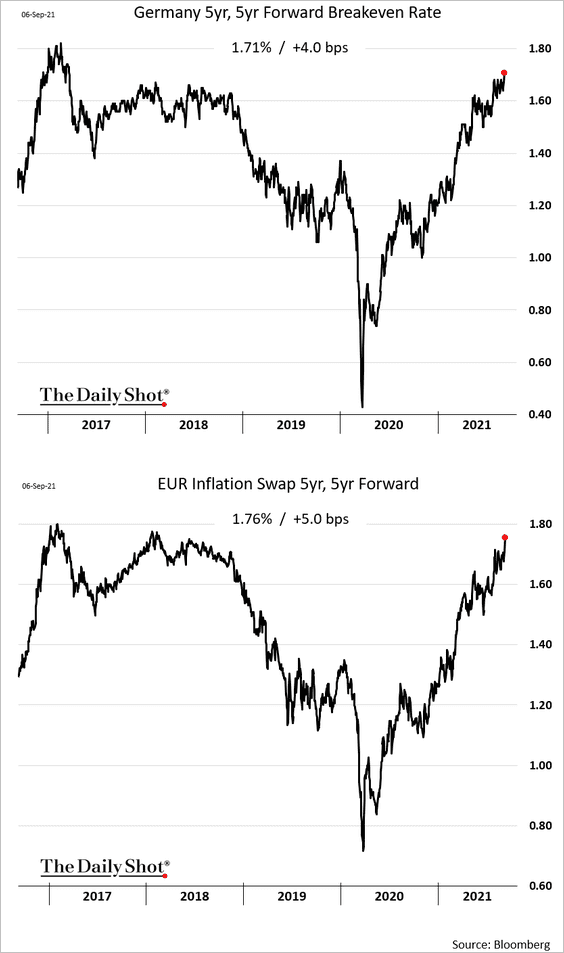
5. Market-based long-term inflation expectations are hitting multi-year highs.
6. Inflation-adjusted yields on sub-investment-grade bonds are now negative.
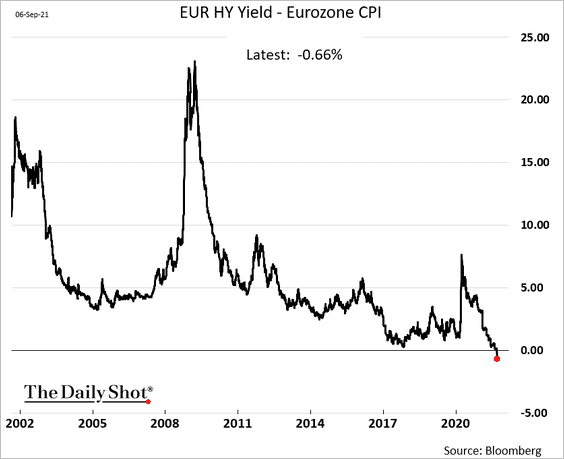 h/t @tatianadariee Read full article
Back to Index
Japan
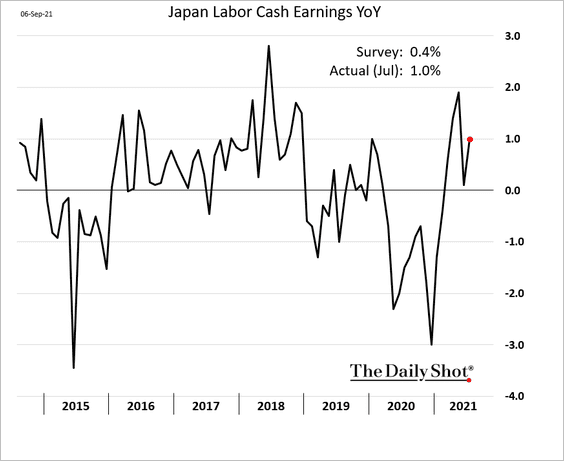
1. Wage growth was stronger than expected in July.
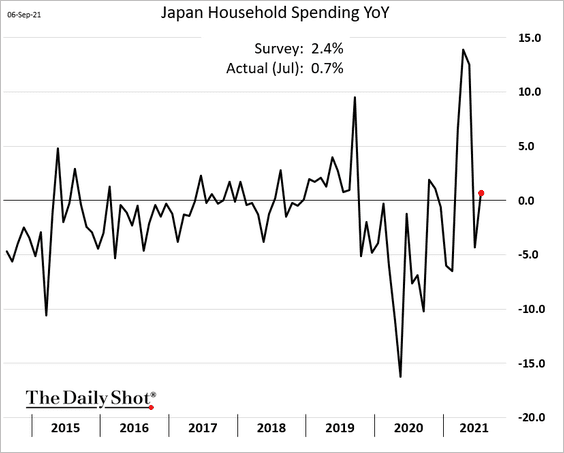
2. But household spending was disappointing.
3. Japanese COVID infections lag the mobility index by five weeks, suggesting new cases are about to peak.
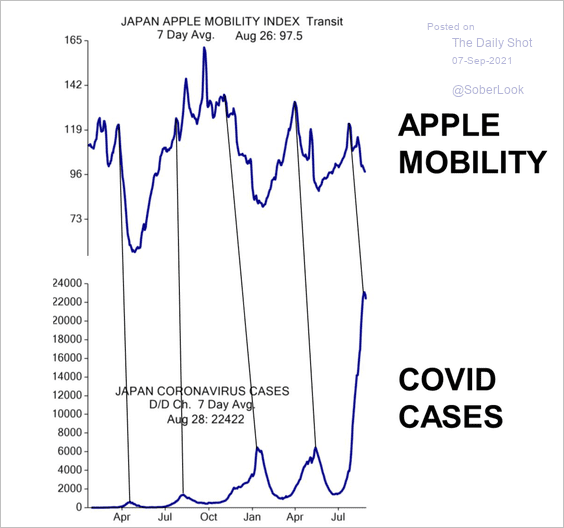 Source: Evercore ISI
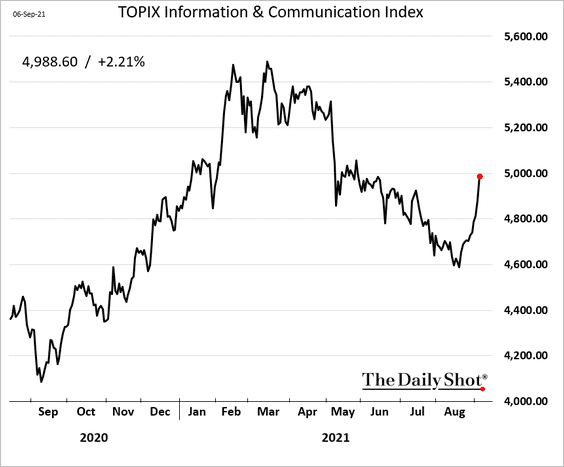
4. The Nikkei 225 broke above resistance.
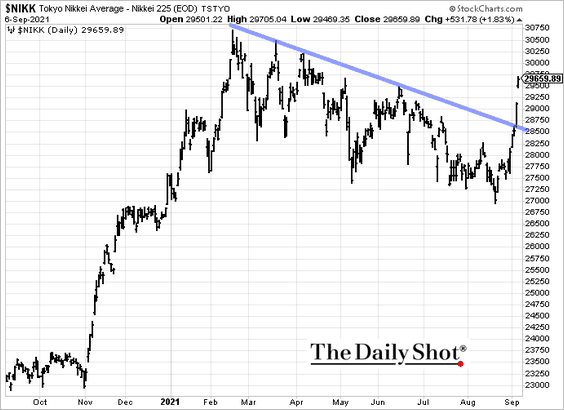
Telecoms surged after Suga announced his exit.
 Source: The Japan Times Read full article
Back to Index
Asia – Pacific
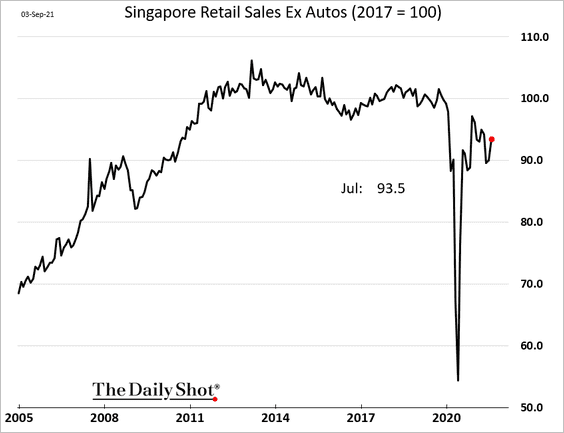
1. Singapore’s retail sales bounced in July but remained well below pre-COVID levels.
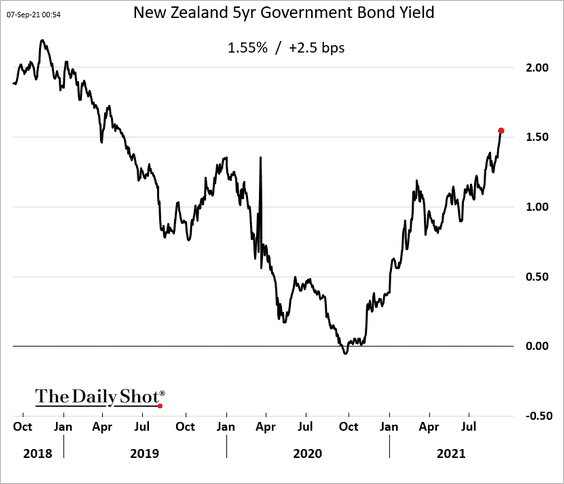
2. New Zealand’s bond yields keep climbing.
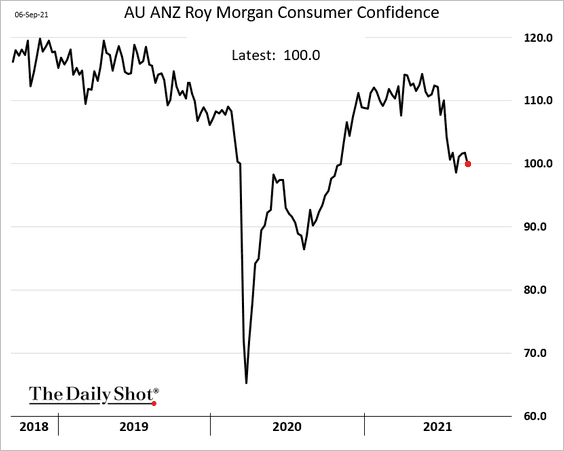
3. Next, we have some updates on Australia.
• COVID cases have been surging, …
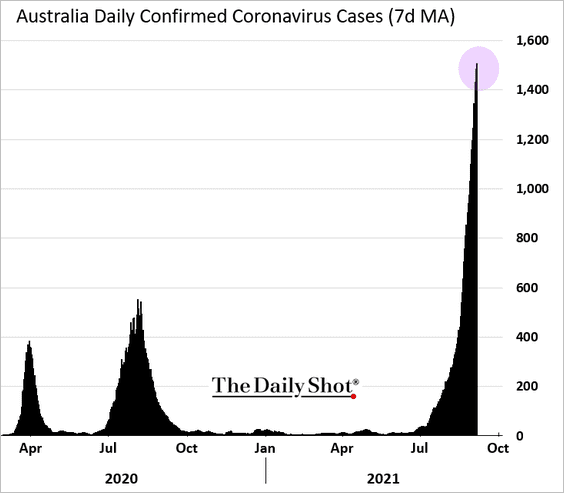
… pressuring consumer confidence.
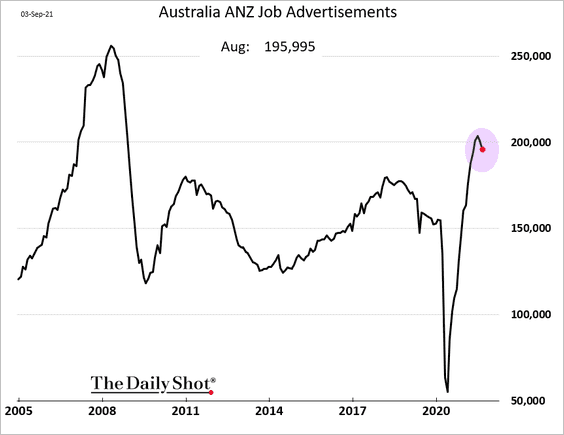
• Job ads remain resilient.
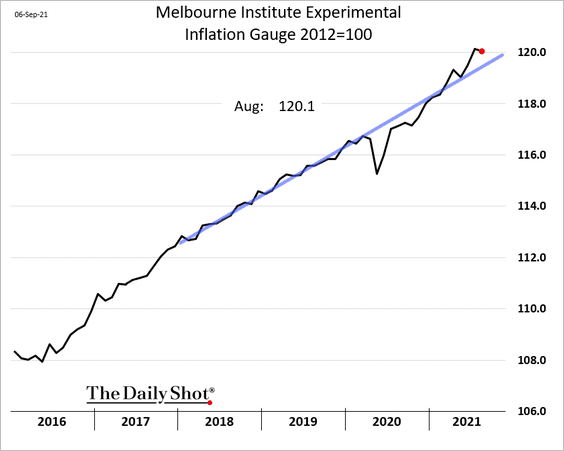
• Inflation eased last month, with prices remaining slightly above the pre-COVID trend.
Back to Index
China
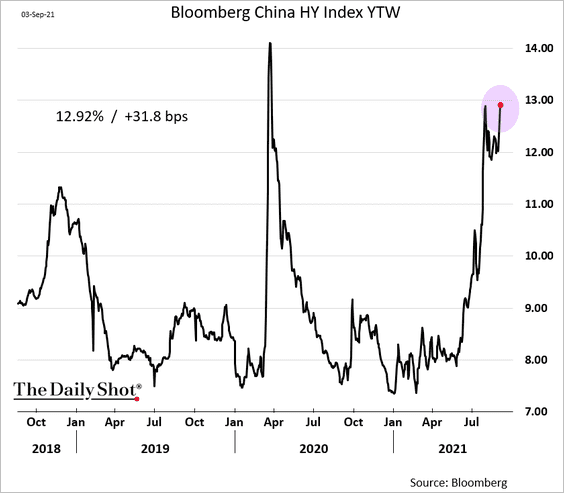
1. Evergrande’s bonds continue to sink, …
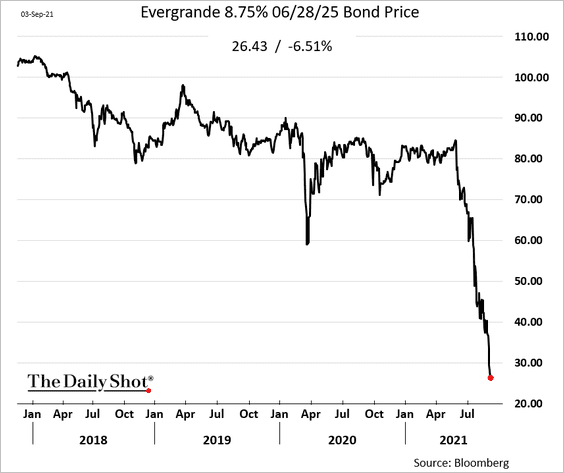
… with credit contagion hitting other names. Bloomberg’s HY index yield is pushing toward 13% again.
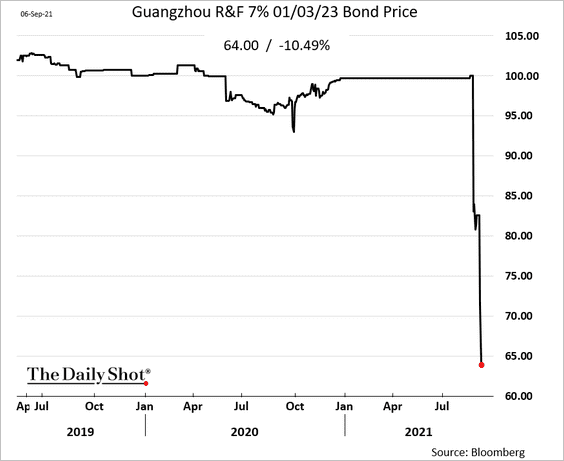
• Guangzhou R&F’s bonds tumbled.
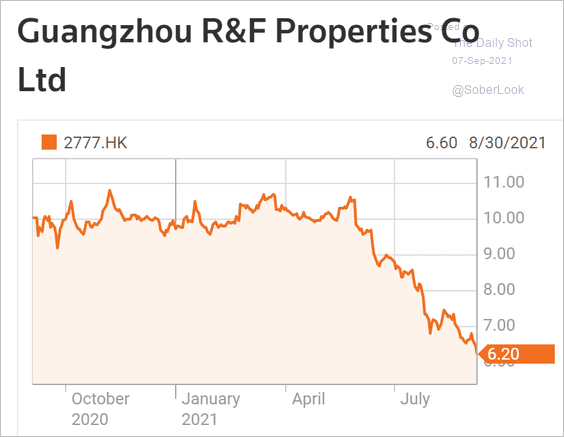
• The stock price has been falling for some time.
 Source: Reuters
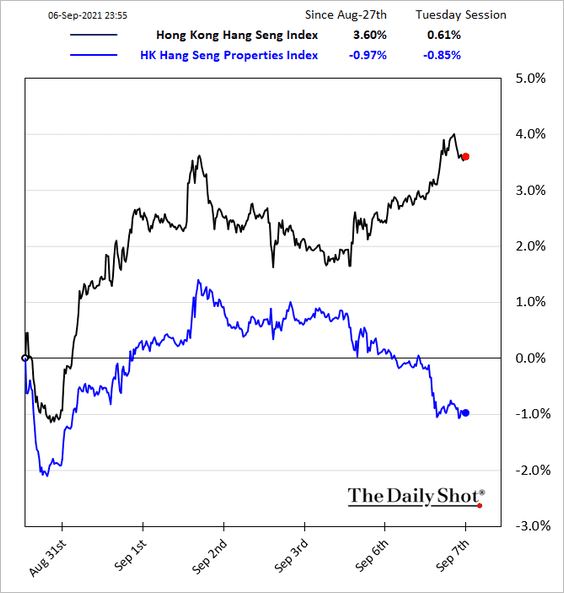
• Property names are underperforming in Hong Kong.
——————–
2. USD/CNH (offshore yuan) is at support.
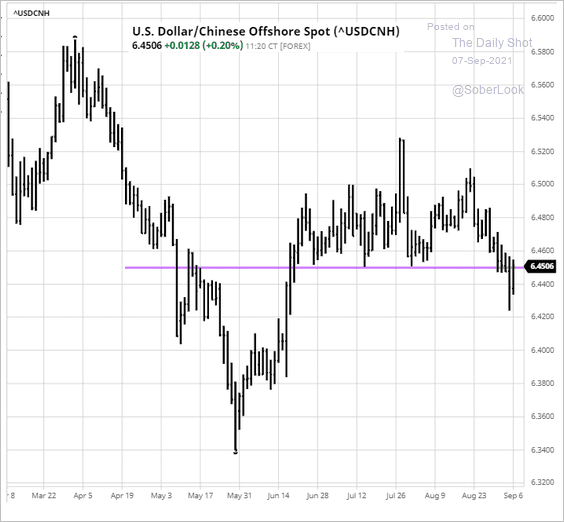 Source: barchart.com
3. The Shanghai Composite has been rebounding.
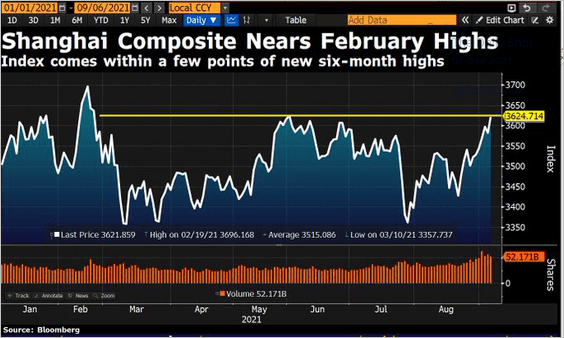 Source: @DavidInglesTV
4. Majority of companies polled are not interested in moving production out of China.
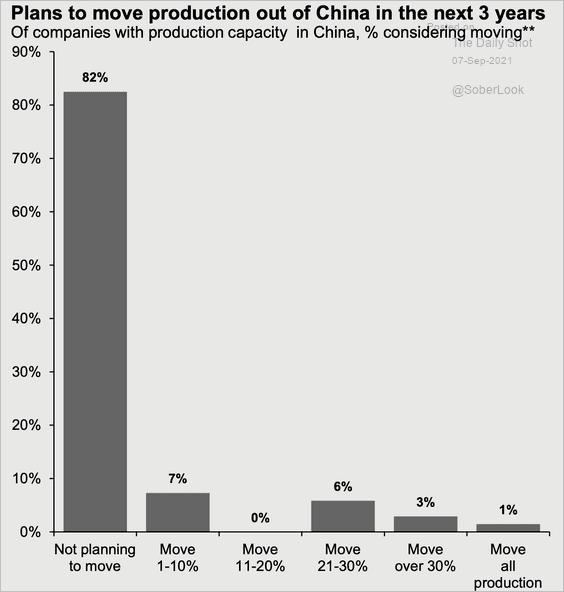 Source: J.P. Morgan Asset Management
Back to Index
Emerging Markets
1. Russia’s service-sector activity shifted into contraction territory last month (PMI < 50).
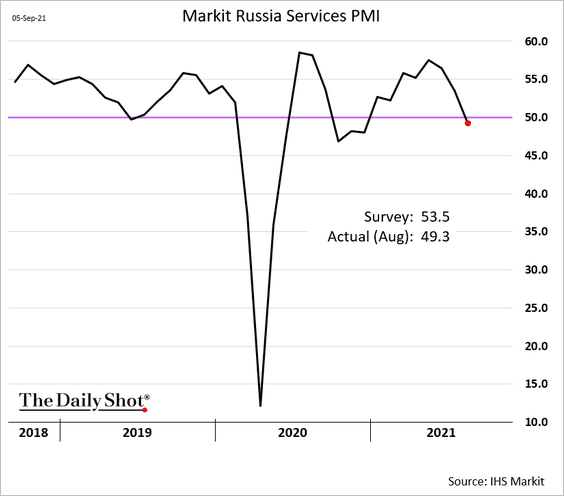
• Here is the composite PMI.
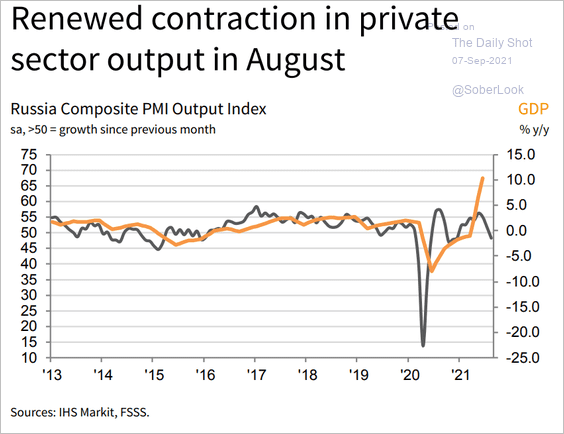 Source: IHS Markit
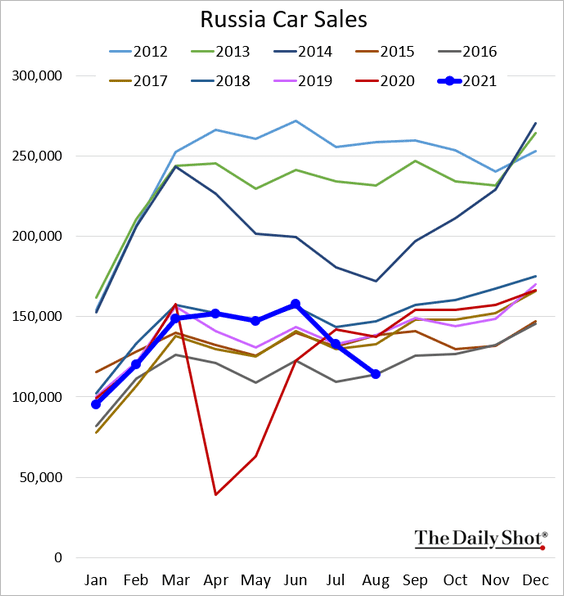
• Car sales declined further in August.
——————–
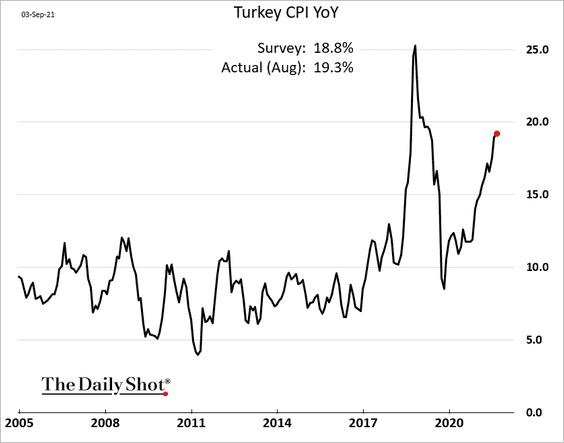
2. Turkey’s inflation remains elevated.
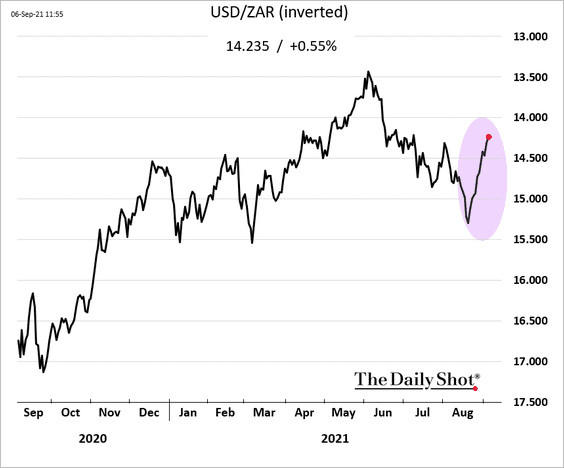
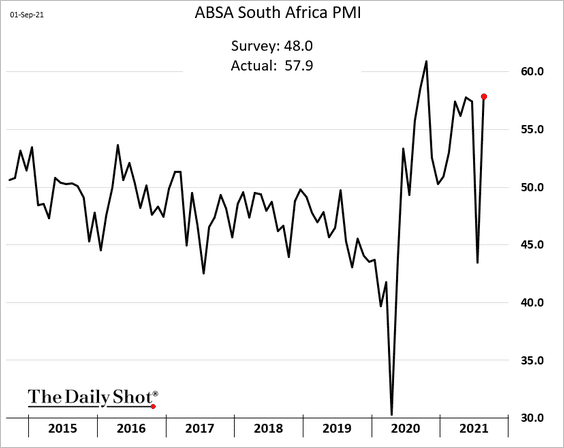
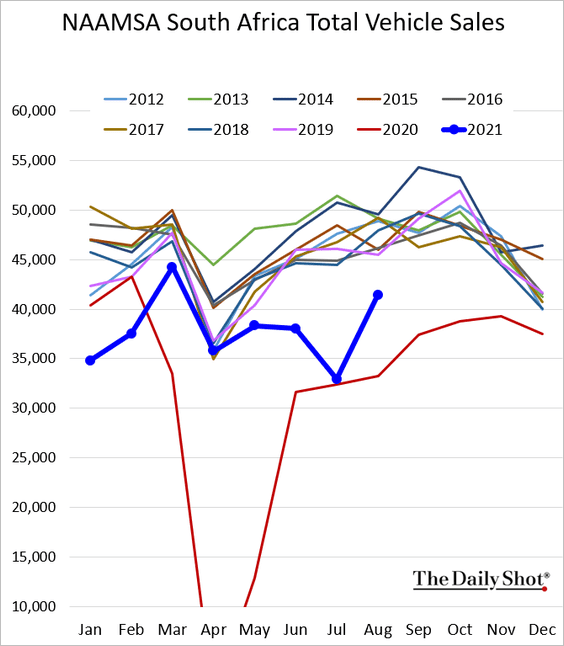
3. The South African rand rebounded in recent weeks.
• The nation’s factory activity returned to growth mode.
• Car sales rebounded.
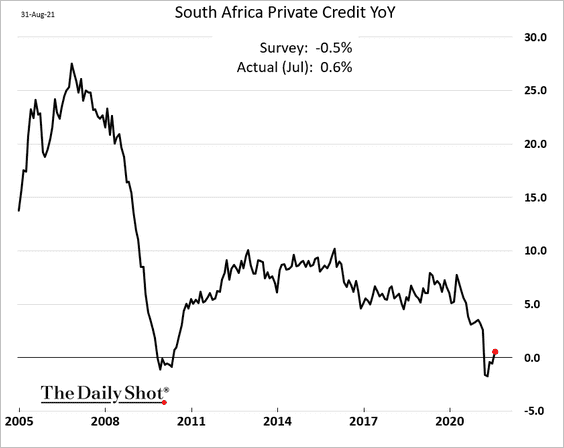
• South Africa’s credit growth has bottomed.
——————–
4. India’s service sector is back in growth territory.
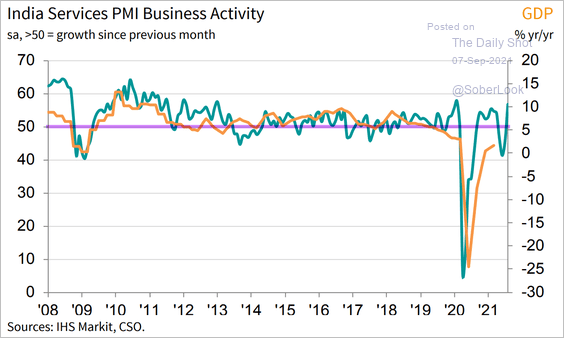 Source: IHS Markit
5. A rise in yields could put downward pressure on EM equity valuations.
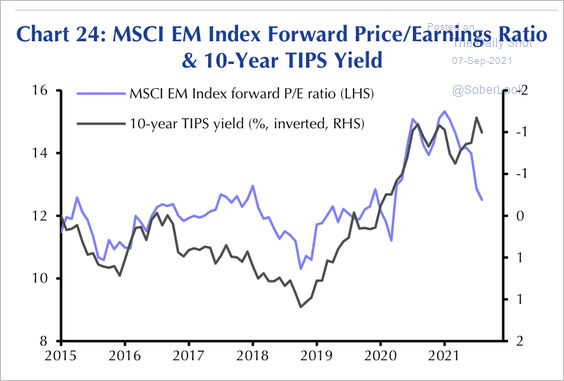 Source: Capital Economics
Back to Index
Cryptocurrency
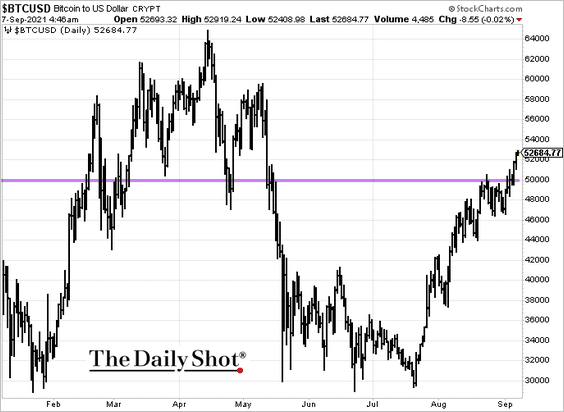
1. Bitcoin broke above resistance at $50k.
2. El Salvador purchased 200 BTC as it prepares to make the cryptocurrency legal tender.
 Source: CoinDesk Read full article
3. Implied volatility on ether options is rising.
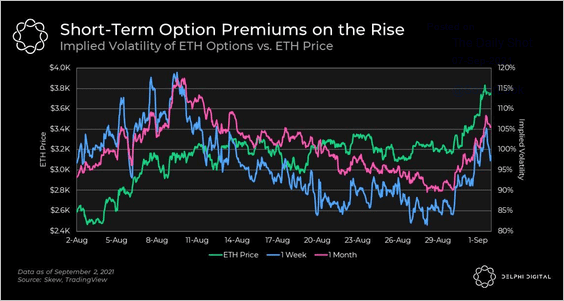 Source: @Delphi_Digital
4. Layer-1 tokens (Ethereum blockchain competitors) have significantly outperformed over the past month.
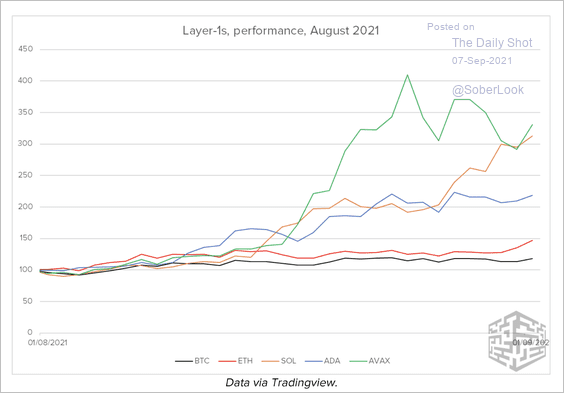 Source: Enigma Securities
5. Half of the world’s crypto users are in Asia.
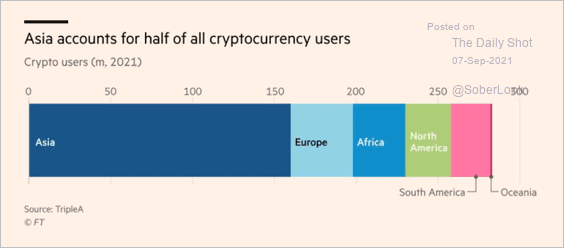 Source: @adam_tooze, @Jonthn_Wheatley, @AdrienneKlasa Read full article
6. This chart shows volatility-adjusted returns vs. trading volumes.
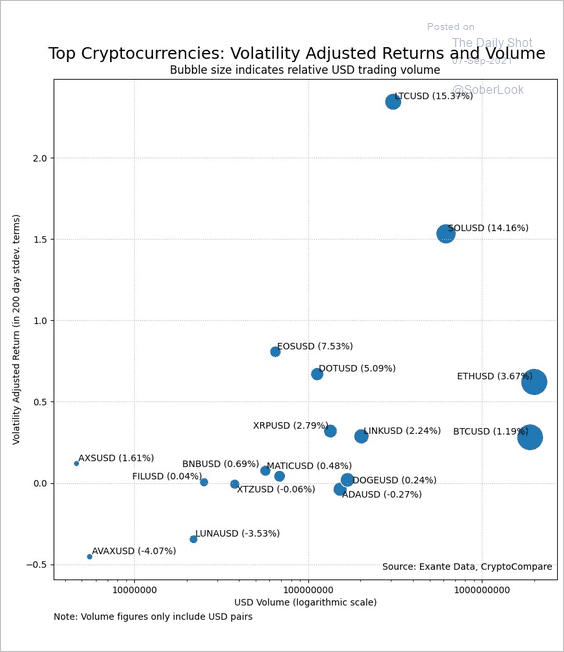 Source: @jnordvig, @ExanteData
Back to Index
Commodities
1. Aluminum hit a decade high …
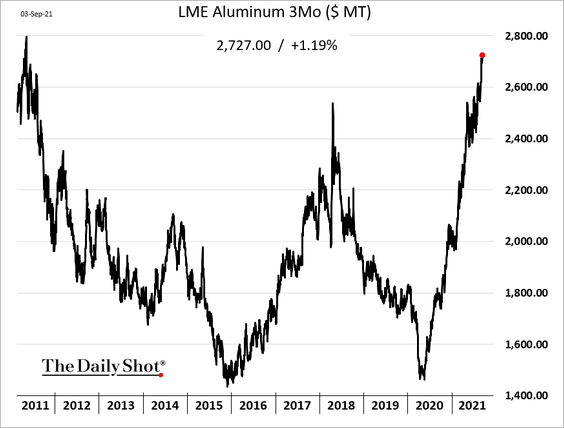
… after the news of a coup in Guinea.
 Source: @WSJ Read full article
——————–
2. Sugar futures have been surging.
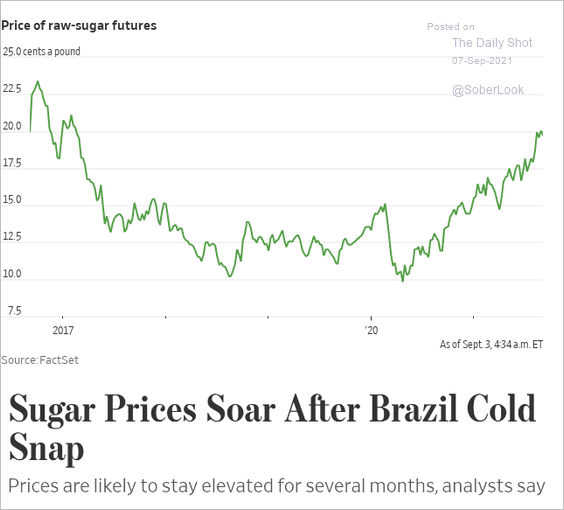 Source: @WSJ Read full article
Back to Index
Energy
1. NYMEX crude oil held resistance …
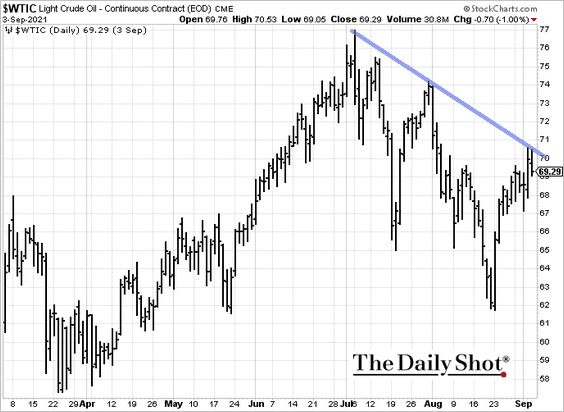
… as the Saudis cut export prices.
 Source: Reuters Read full article
——————–
2. European natural gas prices continue to surge, …
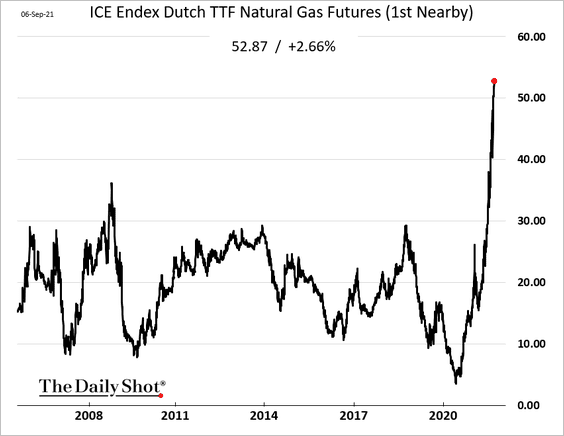
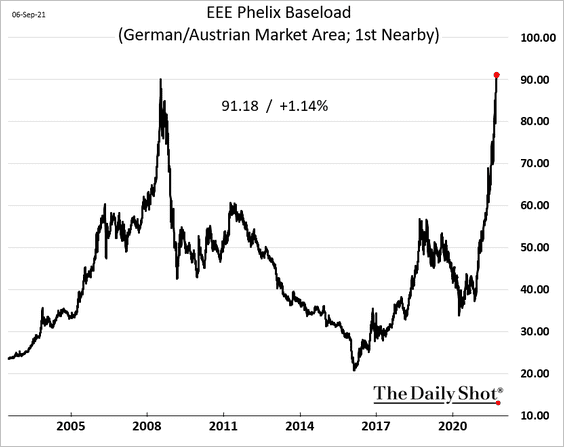
… sending electricity prices sharply higher.
• UK:
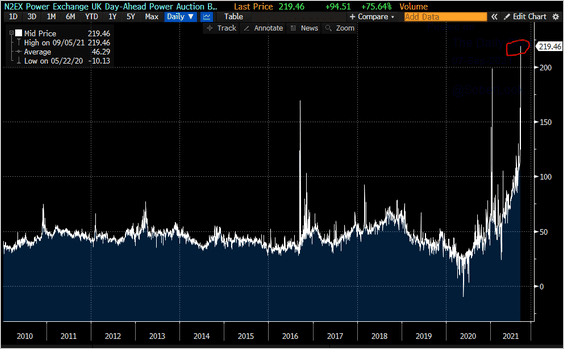 Source: @JavierBlas
• Germany/Austria:
——————–
3. Uranium prices have been surging amid talk of a fund making meaningful purchases recently.
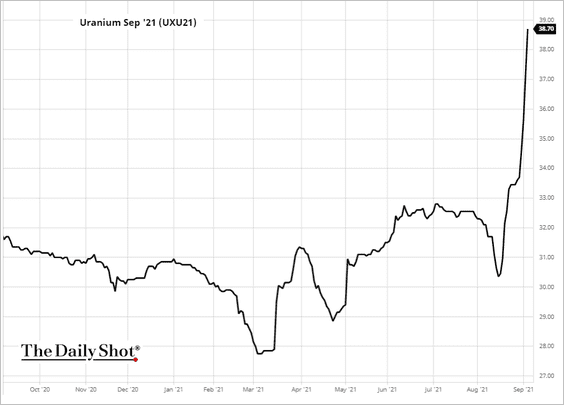 Source: barchart.com, h/t Walter
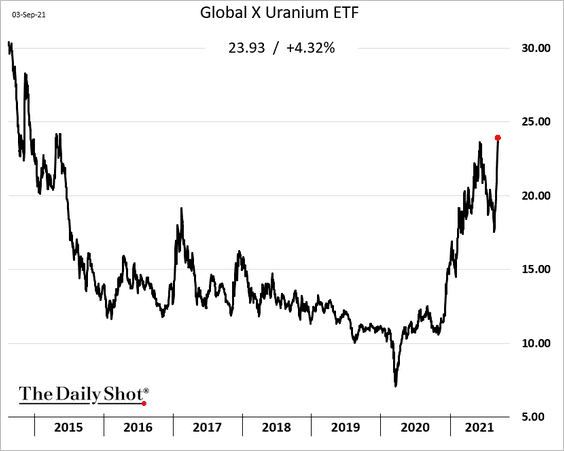
Uranium miners’ stocks jumped.
Back to Index
Equities:
1. This chart shows three distinct market phases since the 1990s based on whether growth (US stocks) dominates the old economy (non-US stocks). Will the third phase continue?
 Source: BCA Research
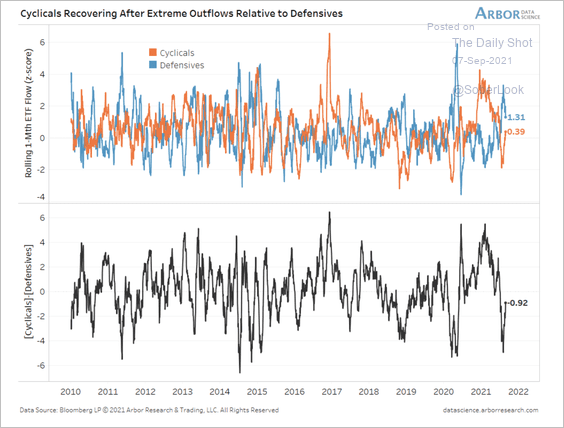
2. Cyclical and small-cap stocks are seeing inflows return after a long hiatus, extending the risk-on rally (2 charts).
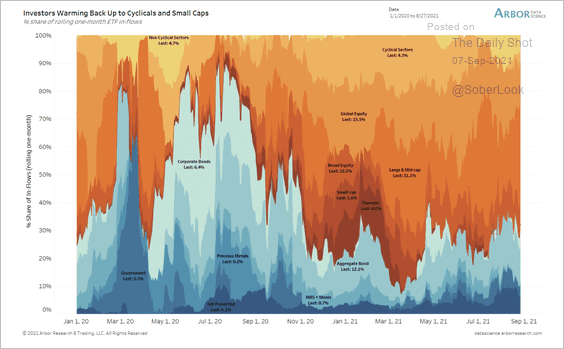 Source: Arbor Research & Trading
 Source: Arbor Research & Trading
——————–
3. The S&P 500 Equal Weight Index is breaking out of a sideways trading range since May.
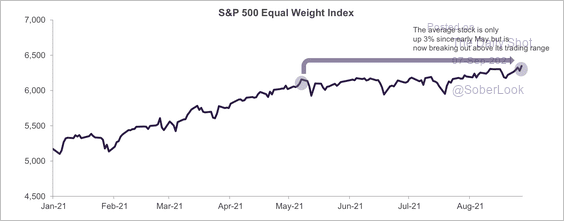 Source: Truist Advisory Services
4. The US equity market cap has been outpacing corporate profits as a share of the GDP recently. Will profits catch up?
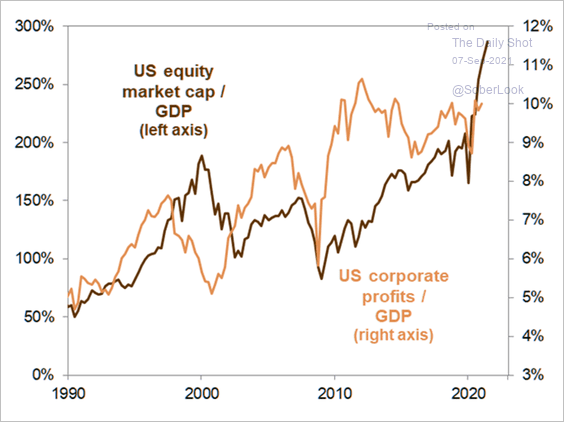 Source: Goldman Sachs; @themarketear Further reading
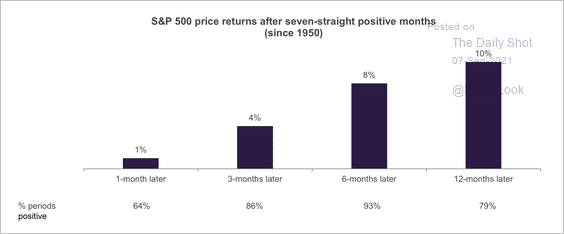
5. The S&P 500 is less likely to close at record highs in September.
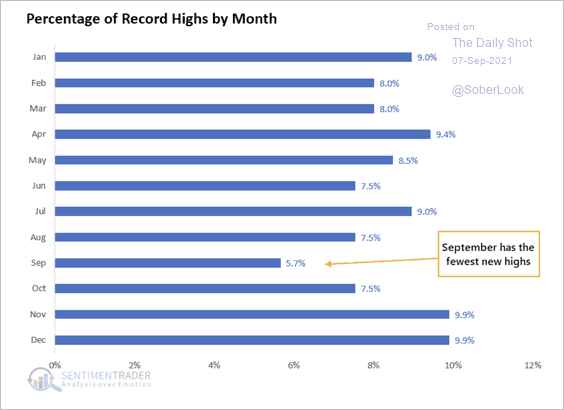 Source: SentimenTrader
6. Stocks tend to add to gains by year-end when posting strong returns through August, albeit with minor pullbacks along the way (2 charts).
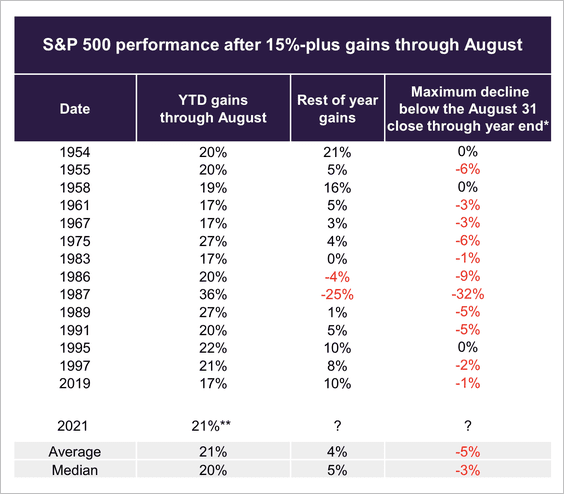 Source: Truist Advisory Services
 Source: Truist Advisory Services
——————–
7. Next, we have some sector updates.
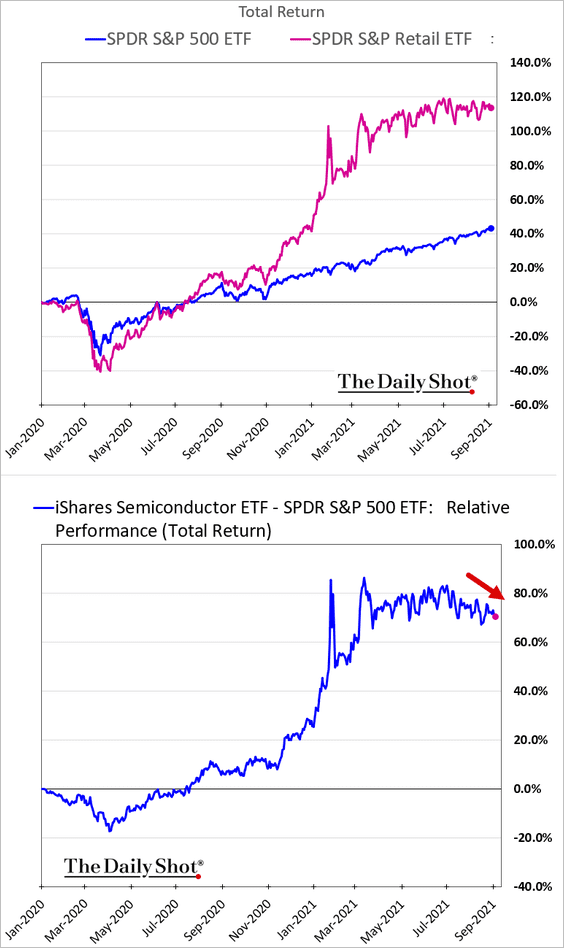
• Retail stocks have been giving up some of their outperformance recently. Will back-to-school sales help?
 Source: Reuters Read full article
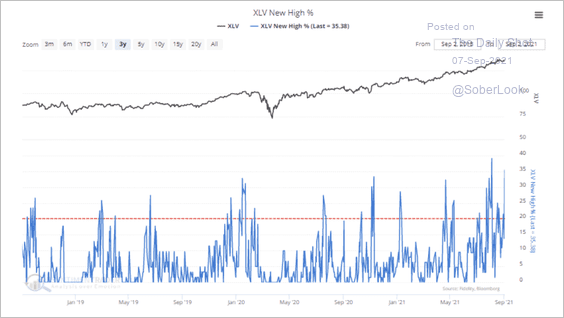
• More than a third of health care stocks have soared to 52-week highs.
 Source: SentimenTrader
• US airlines may become attractive when R0 (COVID transmission) is at 1, according to Alpine Macro
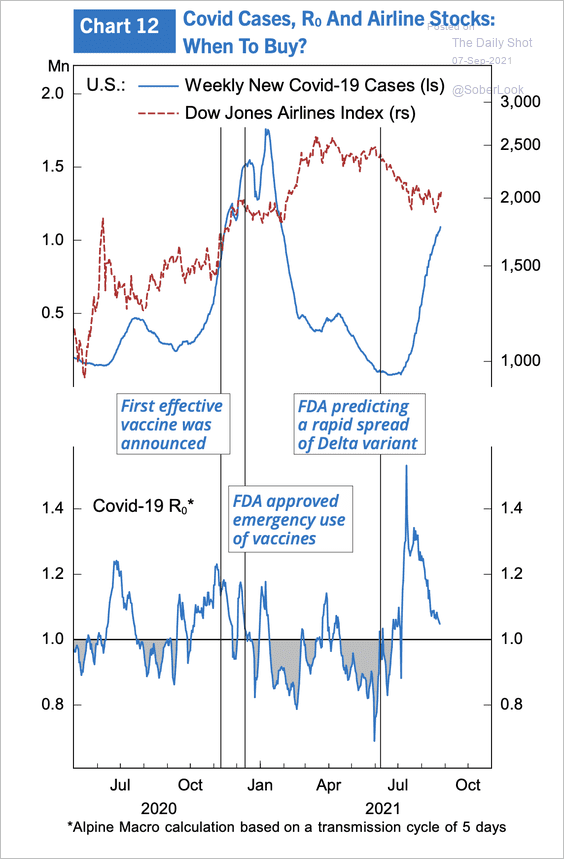 Source: Alpine Macro
• Pharmaceutical stocks look attractive relative to the broader US market, according to MRB Partners
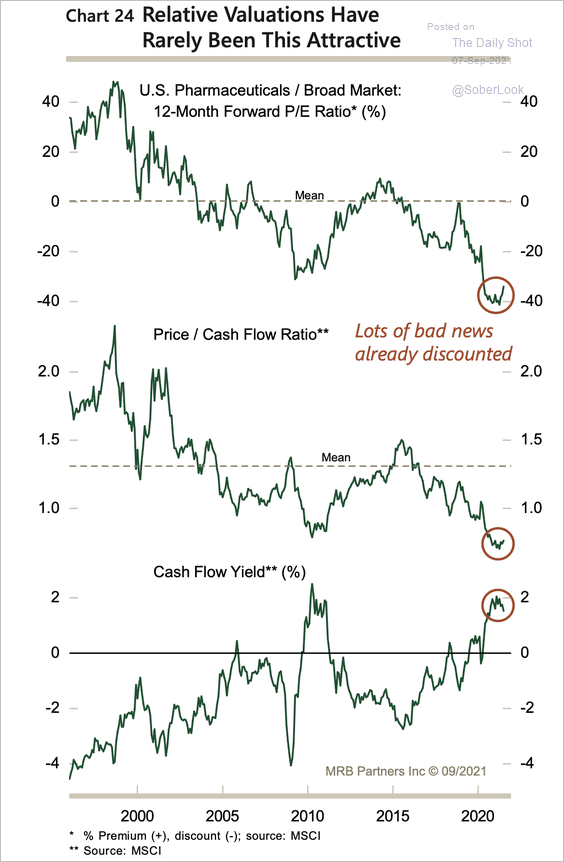 Source: MRB Partners
——————–
8. Shorting stocks is still a dangerous game, as the Reddit crowd remains ready to pounce. This trend is challenging long-short funds’ business models.
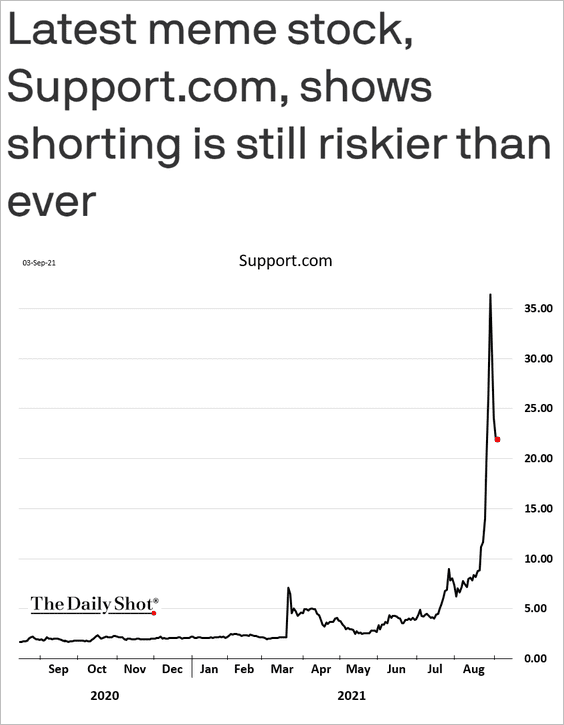 Source: @axios Read full article
Back to Index
Credit
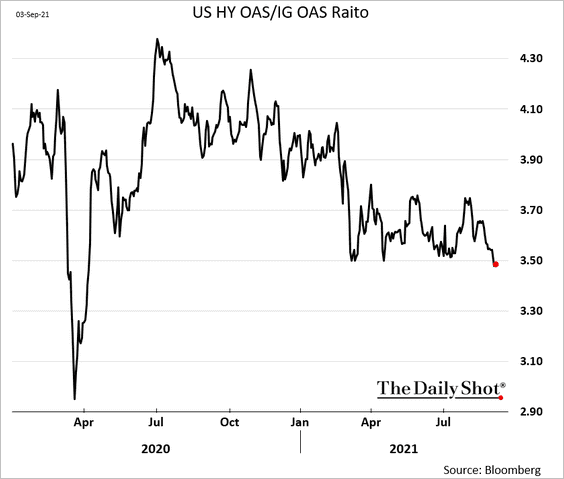
1. The ratio of US high-yield to investment-grade spreads continues to drift lower (HY outperforming).
2. September tends to be the heaviest month of the year for spread product issuance.
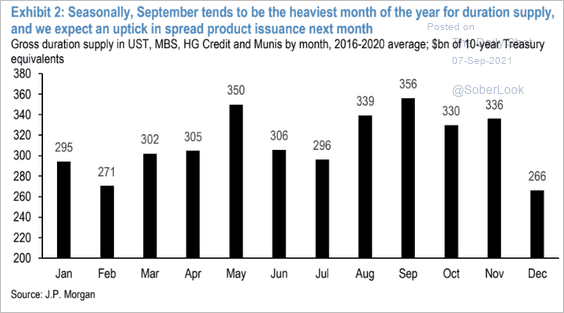 Source: JP Morgan Global Research
3. CLO sales continue to surge.
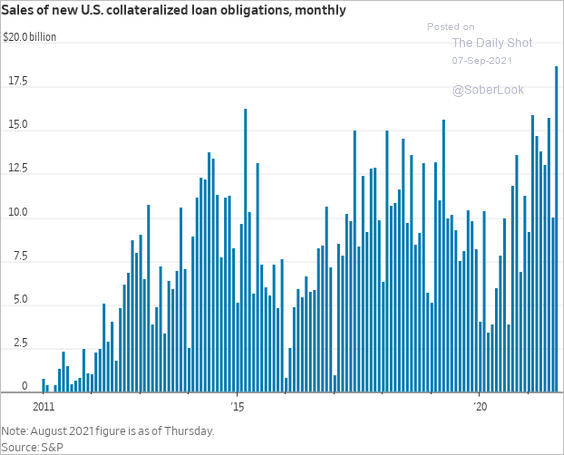 Source: @WSJ Read full article
4. Green bond sales could hit $1 trillion in 2023.
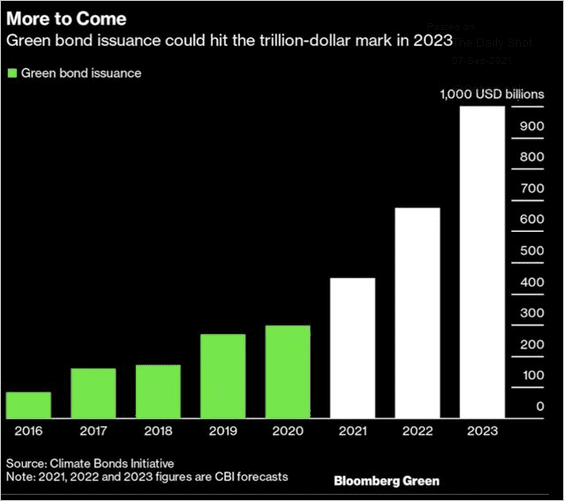 Source: @acemaxx, @markets Read full article
Back to Index
Rates
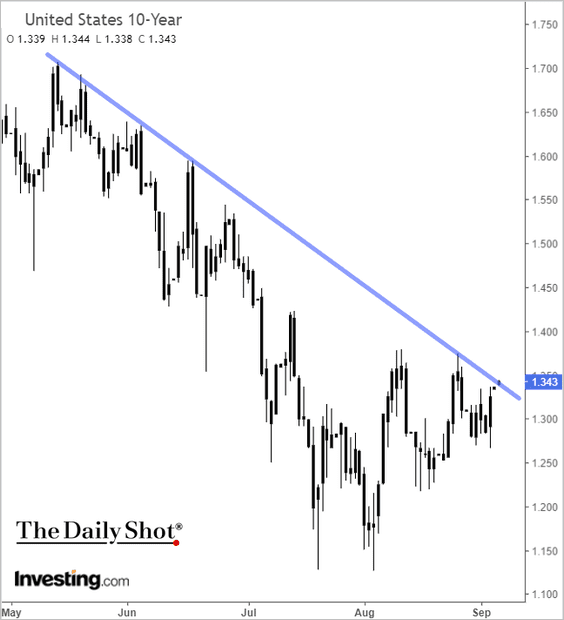
1. The 10yr Treasury yield is at resistance.
2. Given strong institutional mutual fund flows, should Treasury yields be even lower?
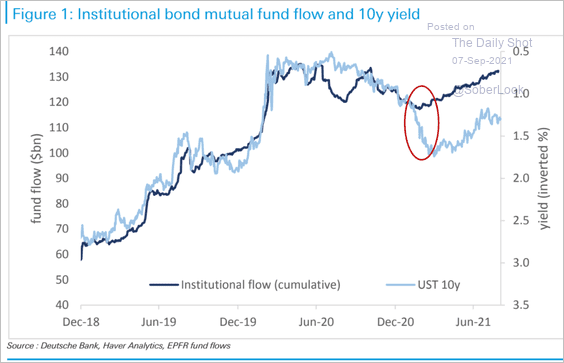 Source: Deutsche Bank Research
3. Traders have soured on Treasuries.
• The iShares 7-10yr Treasury ETF (IEF) flows:
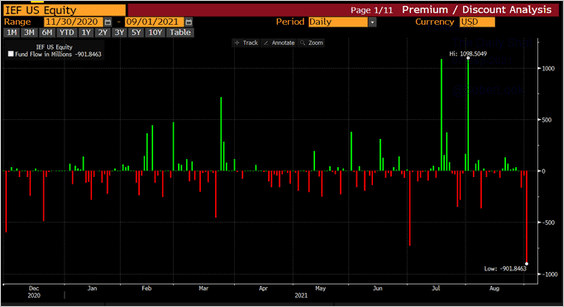 Source: @lisaabramowicz1
• Futures positioning changes:
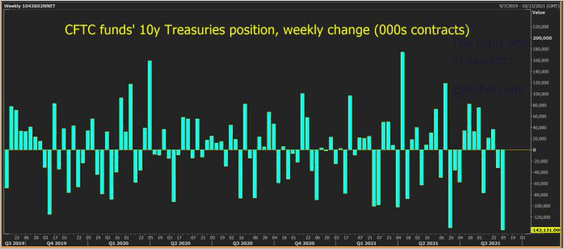 Source: @ReutersJamie Read full article
Back to Index
Global Developments
1. Hedge funds are now net-long the US dollar, despite the recent weakness.
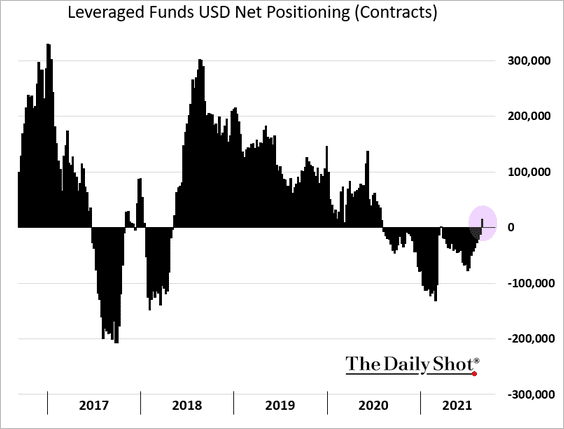
• September is a seasonally tough month for the dollar, ahead of a strong October and November.
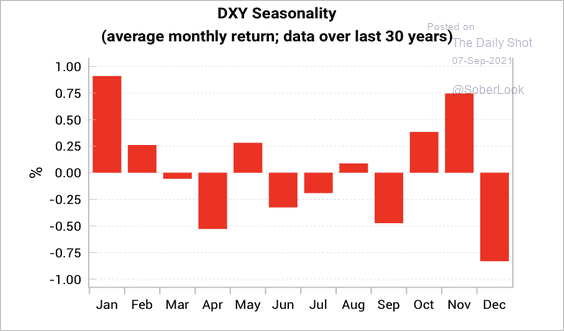 Source: Variant Perception
• The dollar remains in a long-term downtrend.
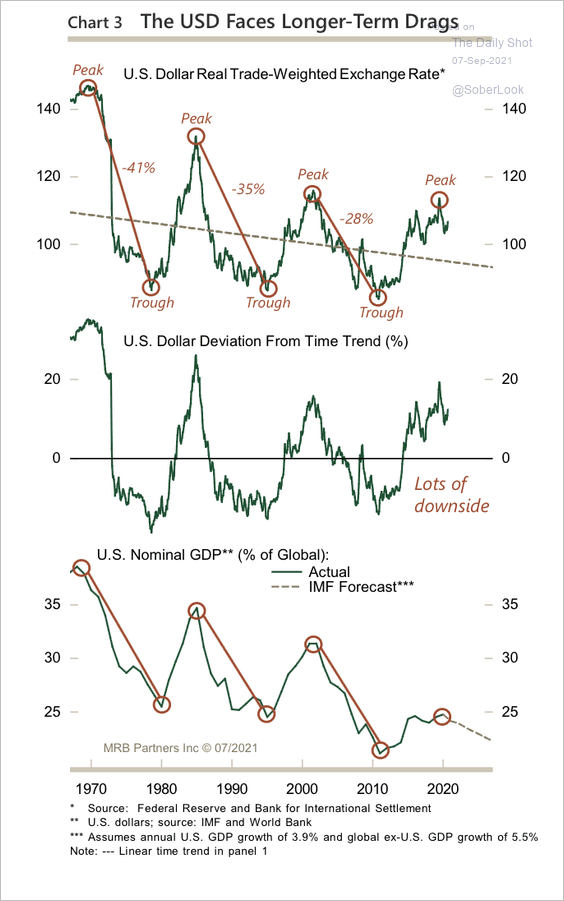 Source: MRB Partners
——————–
2. This chart shows the correlation between equity indices and the 10yr Treasury yield.
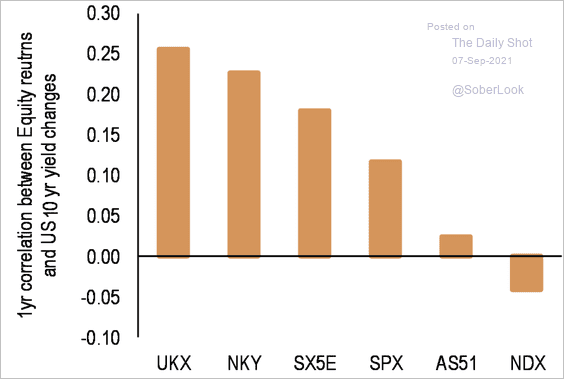 Source: JP Morgan; @themarketear
3. Real yields on US treasuries, corporate bonds, and equities are all negative and pushing new lows.
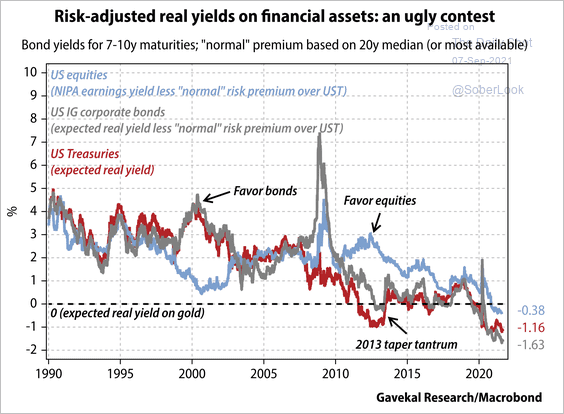 Source: Gavekal Research
4. This chart shows the year-to-date performance across different assets.
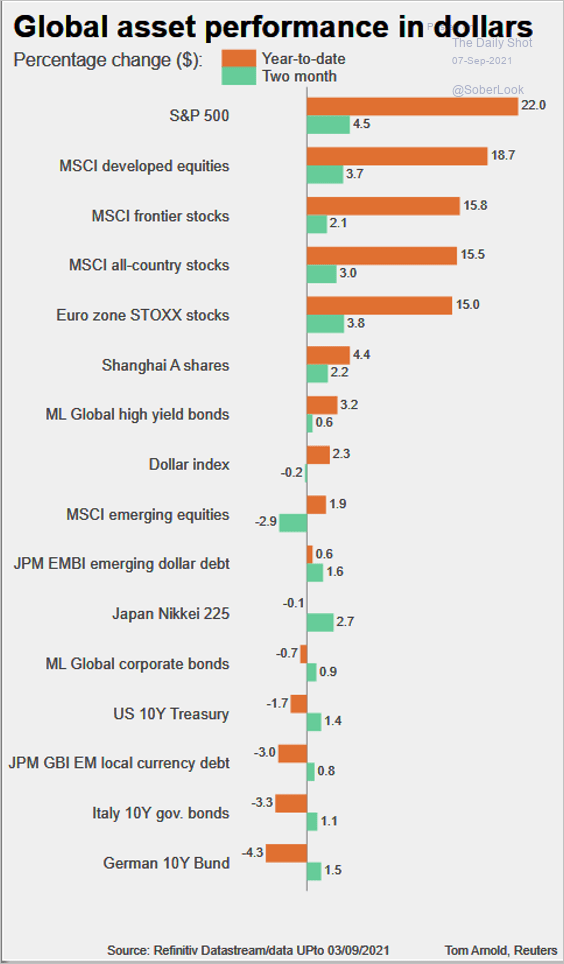 Source: @acemaxx, @ReutersBiz Read full article
——————–
Food for Thought
1. Changes in market capitalization during CEOs’ tenure:
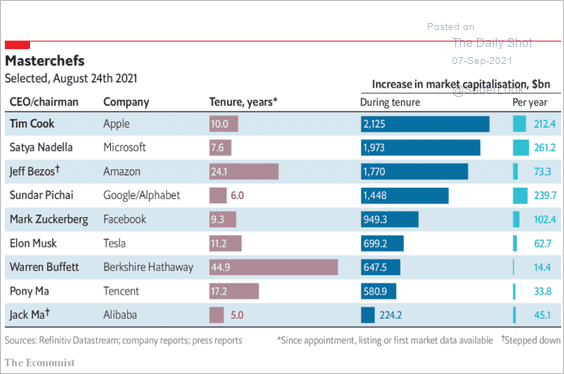 Source: The Economist Read full article
2. Highest-paid bank CEOs:
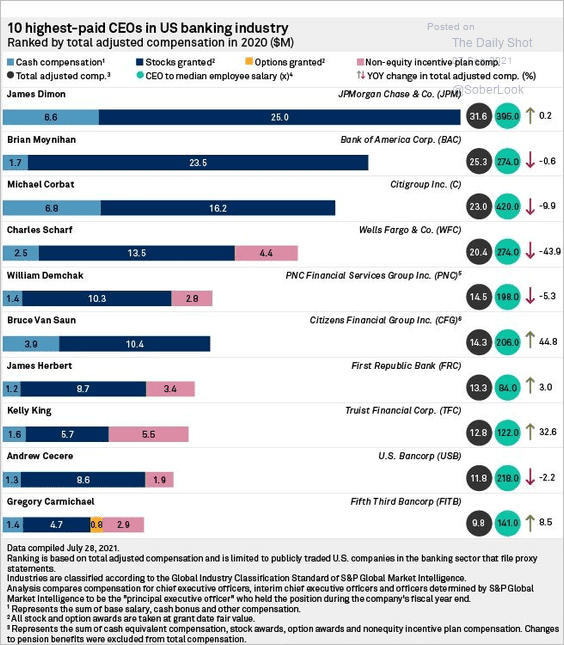 Source: @lcdnews, @SPGMarketIntel Read full article
3. Investments in alternative-protein companies:
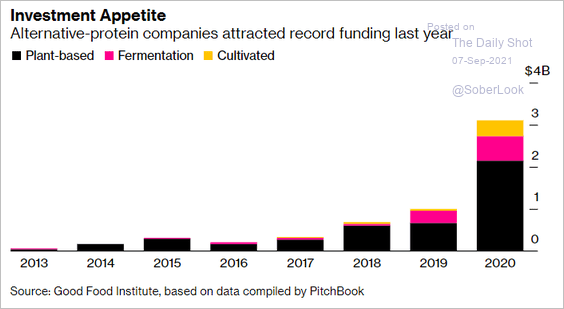 Source: @business Read full article
4. Older US Millennials who are behind on their rent:
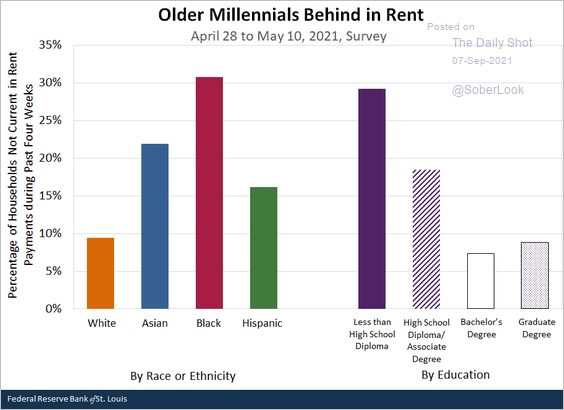 Source: @stlouisfed Read full article
5. Vaccinated population by state:
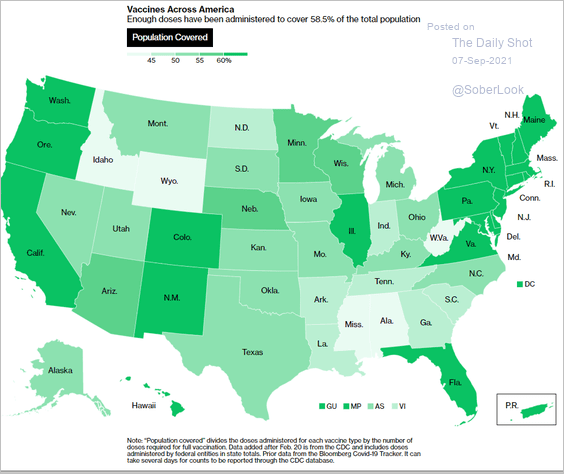 Source: @bbgvisualdata Read full article
6. Vaccine credentials apps (status):
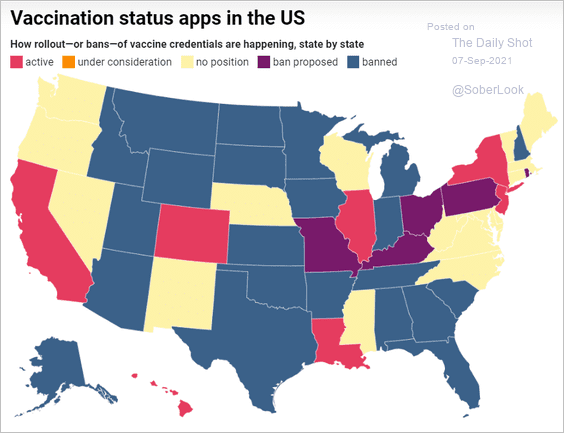 Source: MIT Technology Review Read full article
7. Vaccinating children in the US:
 Source: @axios Read full article
8. Percentage of New Orleans restaurants taking reservations:
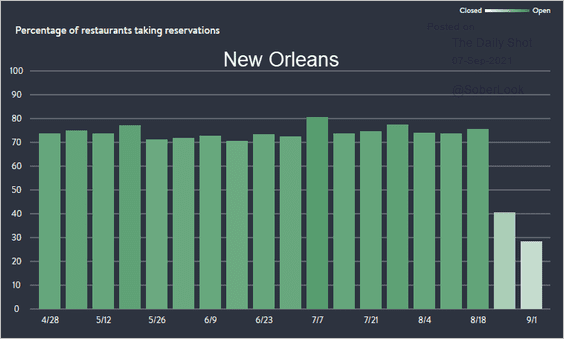 Source: OpenTable
9. Rain in Central Park:
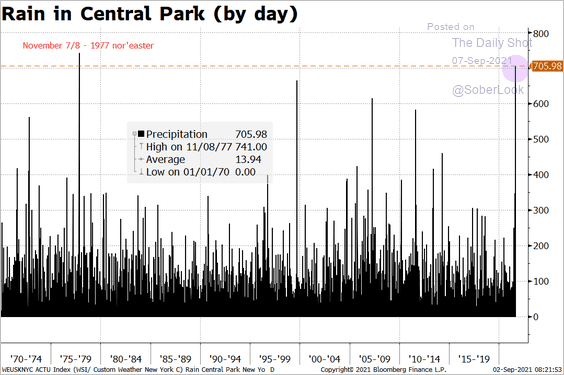 Source: @M_McDonough
10. Hair exports from India:
 Source: Statista
——————–
Back to Index