
The Daily Shot: 23-Sep-21
• The United States
• Canada
• The United Kingdom
• The Eurozone
• Europe
• Asia – Pacific
• China
• Emerging Markets
• Cryptocurrency
• Energy
• Equities
• Credit
• Rates
• Global Developments
• Food for Thought
The United States
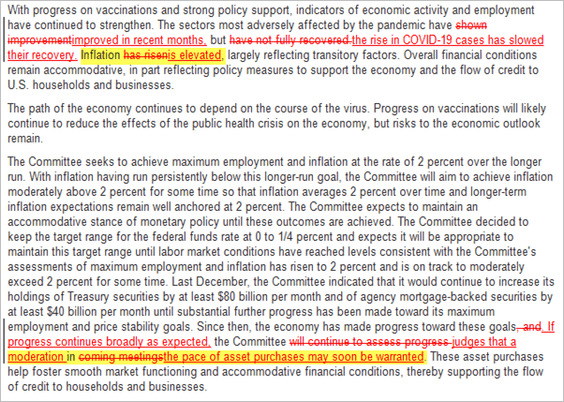
1. The FOMC acknowledged the recent pandemic-induced economic slowdown but signaled the beginning of taper (probably in November). Moreover, Jerome Powell expects to complete tapering by mid-2022 (some analysts expected the Fed to reduce its purchases more gradually). Here is the September FOMC statement compared to the previous one.
 Source: @johnjhardy
• With more Committee members seeing upside risks to inflation, …
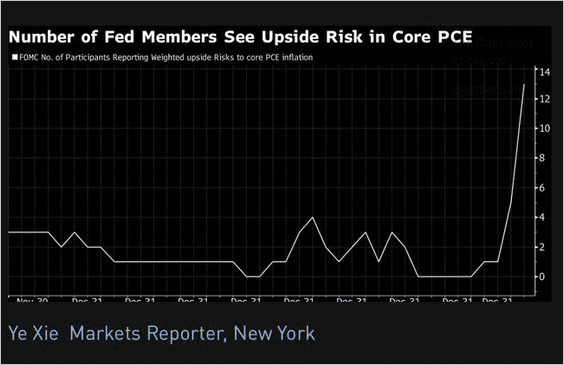 Source: @DiMartinoBooth, @xieyebloomberg, @business
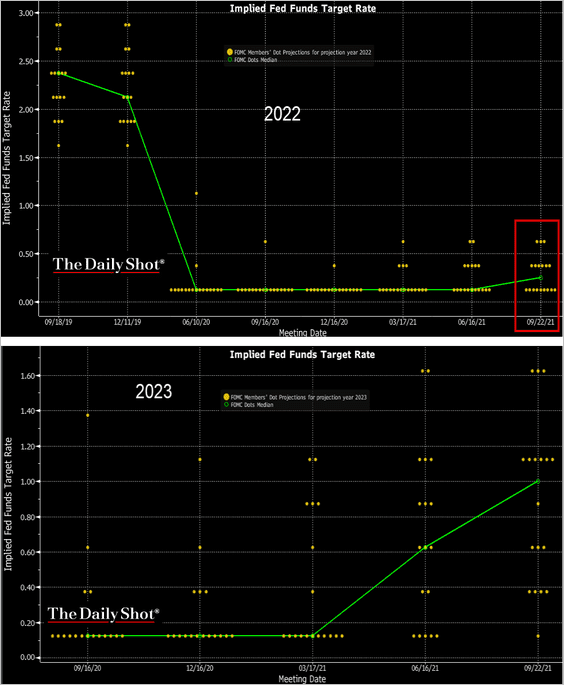
… the dot-plot was more hawkish. Two more FOMC members now expect rate hikes next year.
 Source: @TheTerminal, Bloomberg Finance L.P. Further reading
Here are the median rate projections by year.
 Source: Mizuho Securities USA
• The FOMC’s rate trajectory is now above market expectations.
 Source: Oxford Economics
• There was a modest increase in inflation forecasts beyond this year, but the Fed is mostly sticking to the “transitory” narrative in the FOMC projections.

——————–
2. Short-term Treasury yields climbed.
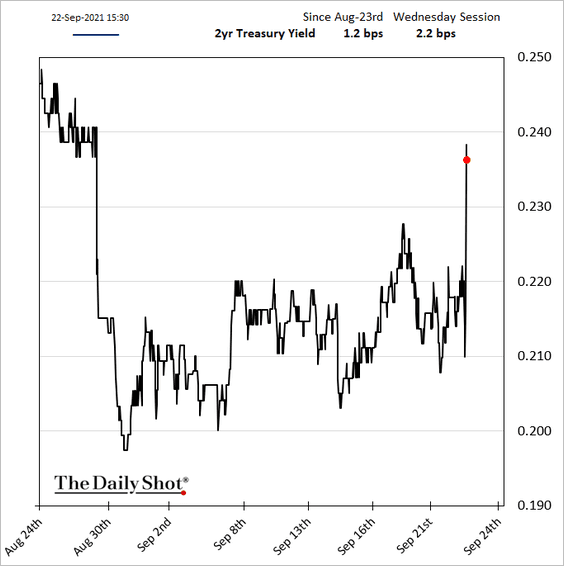
The market is pricing in a 90% probability of a hike next year. The full 25 bps is now sitting in January of 2023.

• The Treasury curve flattened.


• Long-term inflation expectations declined.

——————–
3. Existing home sales were above 2020 levels last month amid robust demand.

• Inventories remain exceptionally tight for this time of the year.


• Mortgage applications are now firmly above 2019 levels.

——————–
4. Labor shortages remain acute and are increasingly becoming a drag on the economy.
 Source: Fox Business Read full article

• Middle-market companies are more concerned about worker availability.
 Source: Marcum LLP/Hofstra University CEO Survey
• When will worker shortages end?
 Source: Evercore ISI
• Will the expiration of emergency benefits help the situation?
 Source: Evercore ISI
• Cutting unemployment benefits early didn’t seem to help.
 Source: @GregDaco Read full article
——————–
5. The World Economics SMI report showed further moderation in business growth this month.
 Source: World Economics
Back to Index
Canada
1. The loonie’s implied volatility increased over the past month, more so than the euro and yen.
 Source: Fitch Solutions Macro Research
2. The auto sector’s rebound has been hampered by chip shortages.
 Source: Economics and Strategy Group, National Bank of Canada
Back to Index
The United Kingdom
1. Lower-income households are very exposed to higher energy prices.
 Source: @JKempEnergy
2. This chart shows the UK banking sector’s international exposure and Q2 changes.
 Source: BoE Read full article
3. Early data suggests that for the first time in decades, net migration from the EU into the UK will go negative.
 Source: Bain & Company
Negative net migration from the EU will, if the trend persists, be most detrimental to sectors that rely heavily on the EU for workers – hospitality, transport and storage, and manufacturing.
 Source: Bain & Company
Back to Index
The Eurozone
1. Consumer confidence is holding up well.

2. Germany is highly exposed to China’s slowdown.
 Source: @financialtimes Read full article
3. Spain’s housing activity hit a multi-year high over the summer.
![]()
Separately, this chart shows Spain’s government debt-to-GDP ratio.
 Source: BCA Research
——————–
4. Italy’s industrial sales continued to surge in July.

5. Mortgage lending and disposable income remains weak in Greece.
 Source: DBRS Morningstar
The Greek property market has staged a very robust recovery from the crisis lows, weathering 2020 well thanks to foreign investment flows.
 Source: DBRS Morningstar
Back to Index
Europe
1. Data seems to suggest that Sweden has achieved herd immunity.
 Source: Gavekal Research
2. Poland’s consumer confidence is recovering.

Bond yields are grinding higher (amid elevated inflation).

——————–
3. Next, we have some data on commercial flights in the EU.
 Source: Eurostat Read full article
4. This chart shows asylum applicants in Europe over time.
 Source: @financialtimes Read full article
Back to Index
Asia – Pacific
1. South Korea’s exports surged in September.

2. Exports from Taiwan are well above trend, boosted by semiconductor supply shortages.
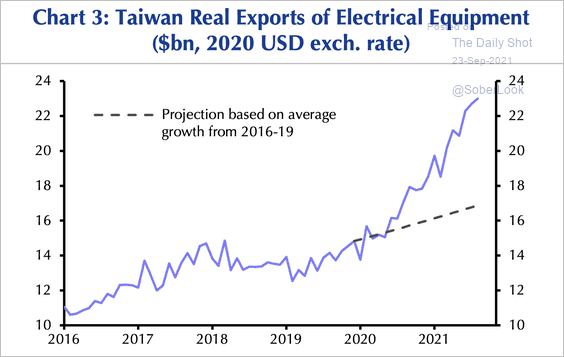 Source: Capital Economics
Taiwan’s unemployment rate continues to ease.

——————–
2. Next, we have some updates on Australia.
• Factory activity rebounded in September, but services remain firmly in contraction territory.

Hiring improved modestly.
 Source: IHS Markit
——————–
• The ANZ activity index shows that the recovery from recent lockdowns will take some time.
 Source: ANZ Research
• Deteriorating terms of trade could weigh on the Aussie dollar.
 Source: Capital Economics
Back to Index
China
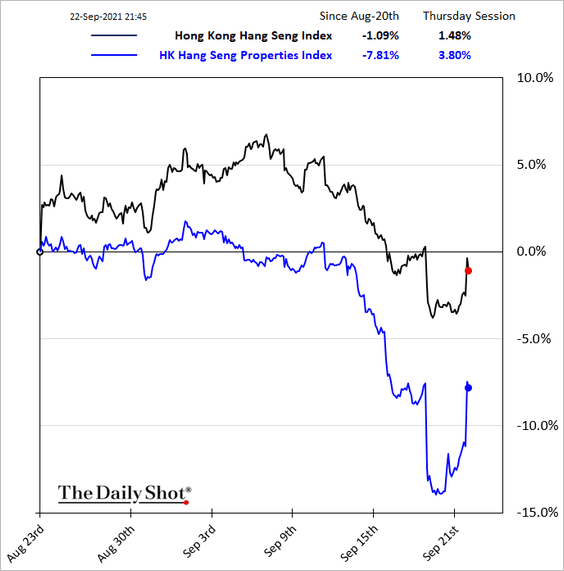
1. Stocks rebounded in Hong Kong, including property shares.
2. The spillover from the property sector battering has been limited.
• Real estate vs. other sectors:
 Source: BCA Research
• The onshore bond markets:
 Source: Evercore ISI
• High-yield vs. investment-grade (spreads):
 h/t Deutsche Bank Research
——————–
3. A sloppy restructuring process for Evergrande and other leveraged developers could derail offshore fundraising for other firms.
 Source: @WSJ Read full article
4. The improvement in air quality in Beijing under Xi Jinping’s government has been remarkable.
 Source: Alpine Macro
Back to Index
Emerging Markets
1. India’s equity market is benefitting from international investors’ rotation out of China (2 charts).


——————–
2. Russia’s producer prices are surging.

3. South Africa’s inflation ticked higher but remains relatively subdued.

4. Brazil’s central bank hiked rates again, removing most of the accommodation that started in 2019.

5. Argentina’s exports are surging, boosted by high commodity prices.

6. Market participants are optimistic about the Chilean peso and Peruvian sol, and pessimistic about the Argentine peso and Turkish lira, according to forecasts collected by Bloomberg. The chart shows forecasted spot returns for the rest of the year vs. year-to-date spot returns.
 Source: Fitch Solutions Macro Research
Back to Index
Cryptocurrency
1. Calls outweigh puts ahead of bitcoin’s options expiry on Friday.
 Source: Skew Read full article
2. Bitcoin’s implied volatility has been rising from low levels last seen in May.
 Source: Skew Read full article
3. The chart below shows the percentage of CryptoPunks supply (one of the first sets of NFTs on the Ethereum blockchain) transferred during a given time. There appears to be a growing presence of long-term NFT holders.
 Source: Coin Metrics

Back to Index
Energy
1. As of last week, US crude oil production has not fully recovered from Ida.

Refinery activity also continues to recover.

——————–
2. US oil inventories keep tightening (2 charts).
 Source: Princeton Energy Advisors
 Source: @HFI_Research
Distillates inventories are also low.

——————–
3. Here is an updated chart of top Permian producers.
 Source: CNBC Read full article
 Source: @WSJ Read full article
Back to Index
Equities
1. Let’s start with the S&P 500 returns around government shutdowns.
 Source: Goldman Sachs; @carlquintanilla
2. US equities continue to outperform other major assets this year (except broad commodities), mainly driven by large and mega-cap stocks.
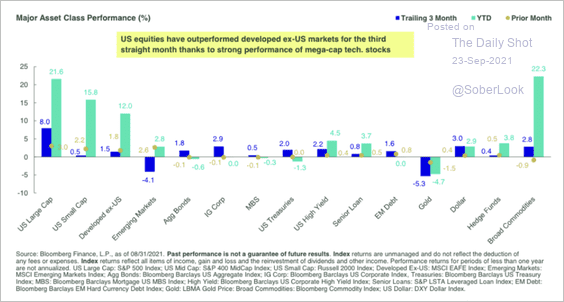 Source: SPDR Americas Research, @mattbartolini
3. The recent S&P 500 operating earnings increase has been faster than after previous recessions.
 Source: BCA Research
4. Share buyback activity is surging again.
 Source: @ISABELNET_SA, @BofAML
5. This chart shows hedge funds’ sector allocations vs. historical averages.
 Source: Evercore ISI
6. Investors are nervous about speculative tech stocks going into the year-end (ARKK = Ark Innovation ETF).
 Source: Chris Murphy, Susquehanna International Group
7. What is the percentage of US underperforming active funds?
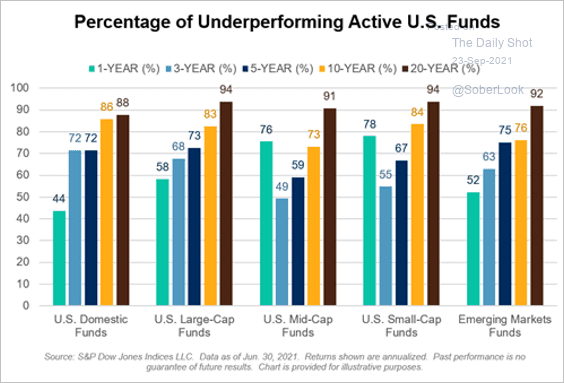 Source: S&P Global Market Intelligence
Back to Index
Credit
1. Single-B corporate bonds have been underperforming BB-rated debt on a total-return basis.
 h/t @CalMutua
2. The average debt/equity ratio of S&P 500 non-financial sectors has been declining.
 Source: Mizuho Securities USA
3. Here is a look at relative value across US investment-grade sectors (spreads vs. durations).
 Source: Mizuho Securities USA
4. “Sustainable” high-yield debt has become much more common in Europe than the US in recent years.
 Source: III Capital Management
Back to Index
Rates
1. The longer end of the Treasury curve continues to flatten.

2. OIS pricing implies about a 50 basis point upside in 10-year Treasury yields over the course of next year.
 Source: Deutsche Bank Research
3. The US Treasury default risk (the debt ceiling not lifted) is priced into the T-bill market.
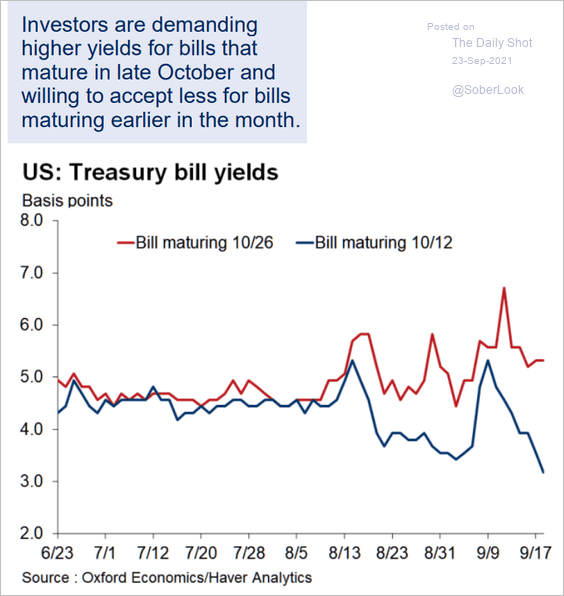 Source: Oxford Economics
Back to Index
Global Developments
1. Dry bulk shipping costs are hitting multi-year highs.

2. Global risk appetite has declined sharply, which could be a bullish sign for risk assets.
 Source: Morgan Stanley Research; @WallStJesus
3. Are supply shortages around the world stabilizing?
 Source: Capital Economics
——————–
Food for Thought
1. Walmart’s retail margins:
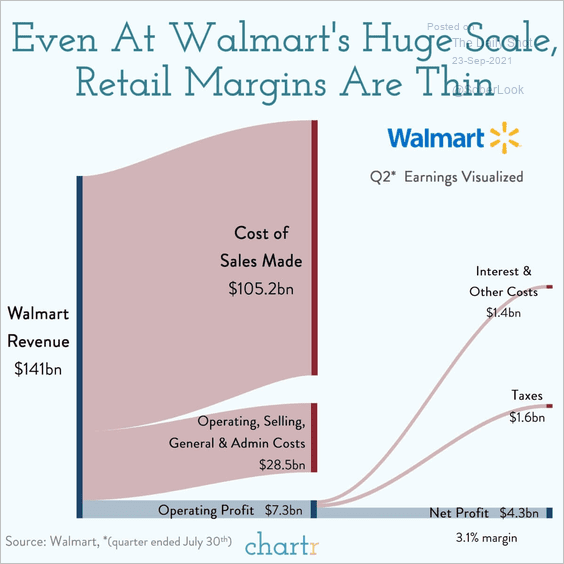 Source: @chartrdaily
2. US vehicle imports:
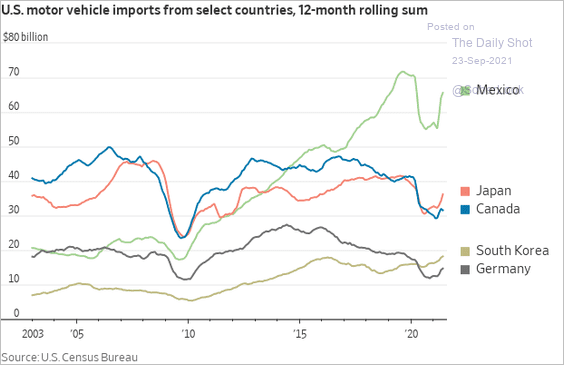 Source: @WSJ Read full article
3. The fastest-growing brands in 2021:
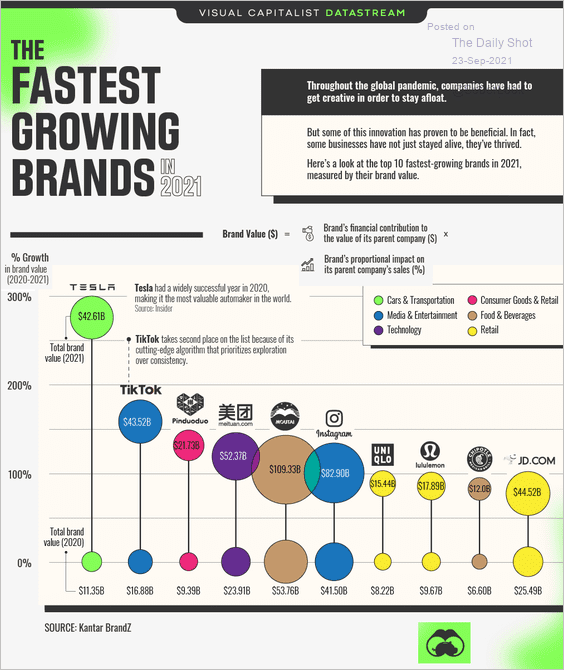 Source: Visual Capitalist Read full article
4. What types of assistance would be helpful for small businesses?
 Source: PayPal Small Business Index by Morning Consult Read full article
5. Where wealth managers found new clients in 2020:
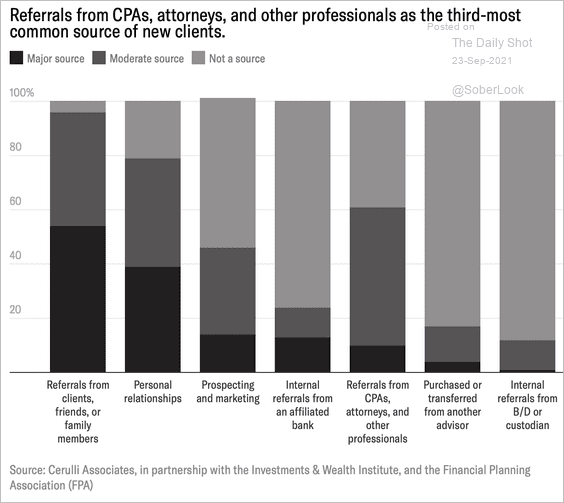 Source: @RitholtzWealth, @abnormalreturns Read full article
6. US box office rebound:
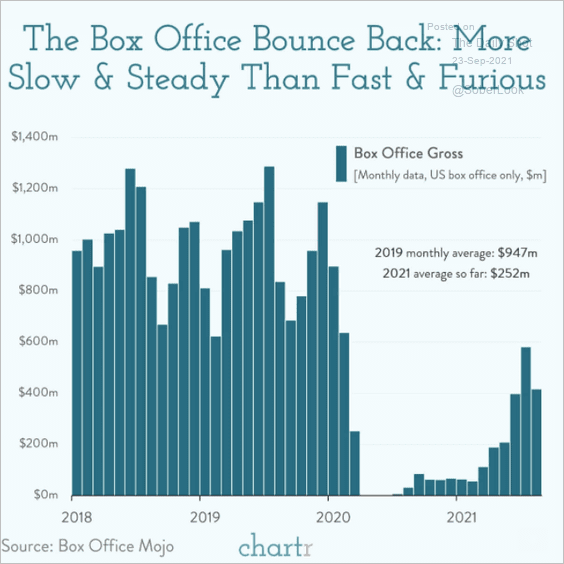 Source: @chartrdaily
7. The Paralympics:
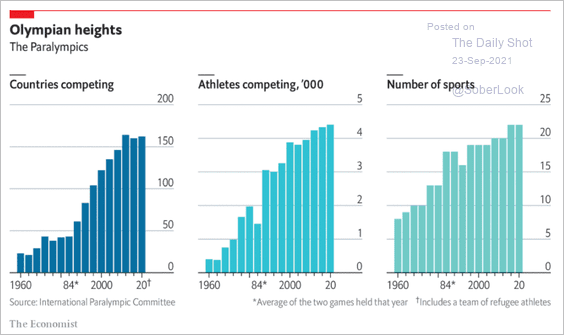 Source: The Economist Read full article
8. Changes in global surface temperature:
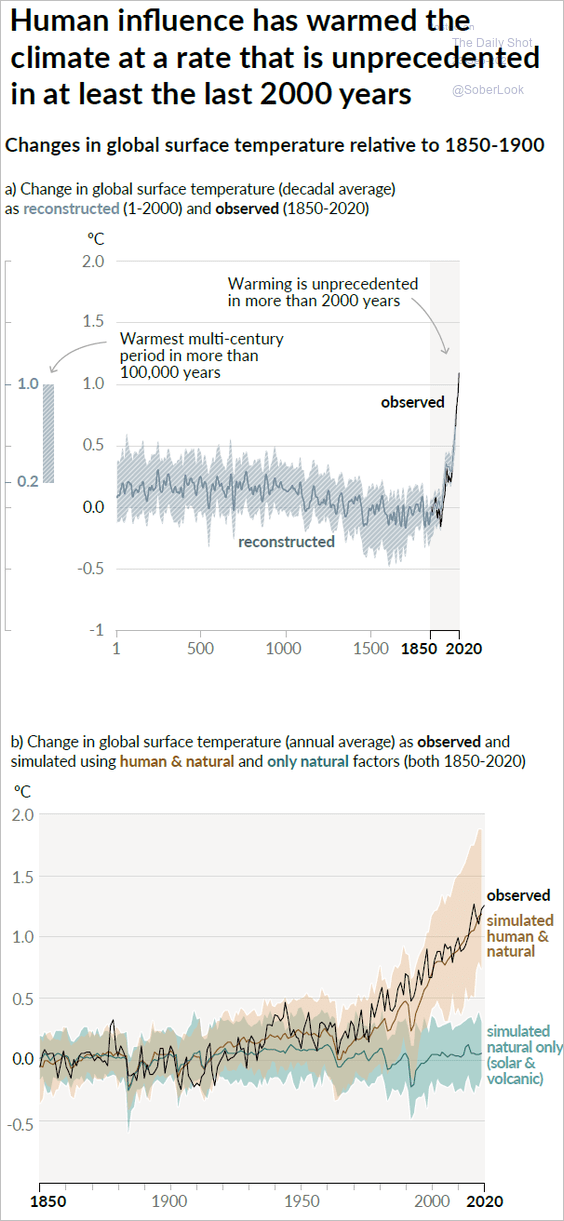 Source: Intergovernmental Panel on Climate Change (IPCC) Read full article Further reading
9. Unemployment rates by state:
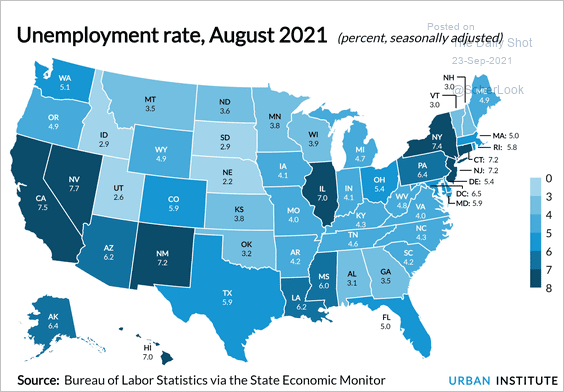 Source: @richardcauxier, @urbaninstitute Read full article
10. The true relative size of different countries:
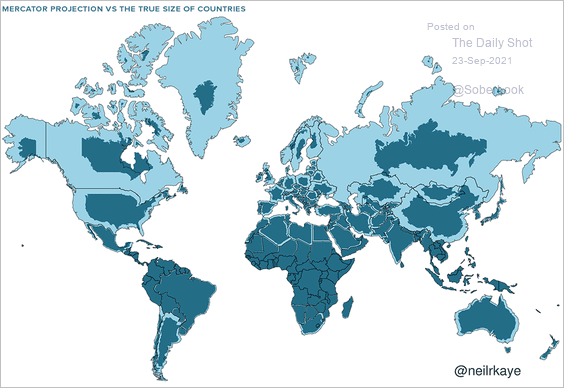 Source: Visual Capitalist Read full article
——————–
Back to Index