
The Daily Shot: 05-Oct-21
• The United States
• The Eurozone
• Europe
• Asia – Pacific
• China
• Emerging Markets
• Cryptocurrency
• Commodities
• Energy
• Equities
• Credit
• Rates
• Global Developments
• Food for Thought
The United States
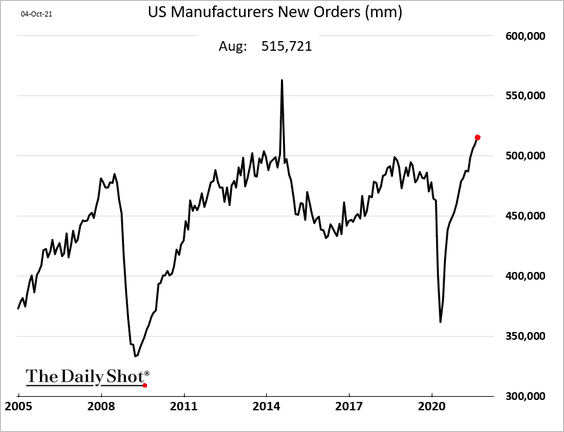
1. Let’s begin with some updates on manufacturing.
• Factory orders continued to climb in August.
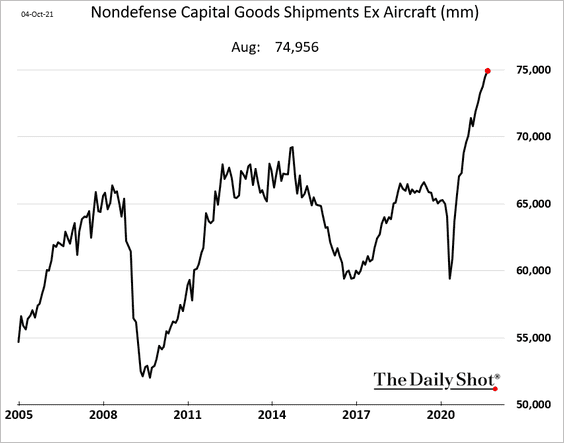
Capital goods orders and shipments were adjusted higher, pointing to robust business investment.
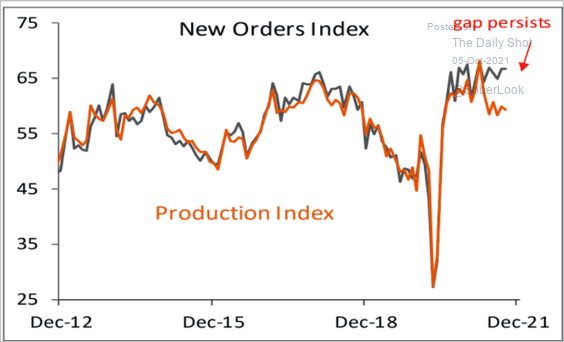
• The ISM manufacturing PMI continues to show a gap between the new orders and production indices. Supply bottlenecks are increasingly holding back factory output.
 Source: Piper Sandler
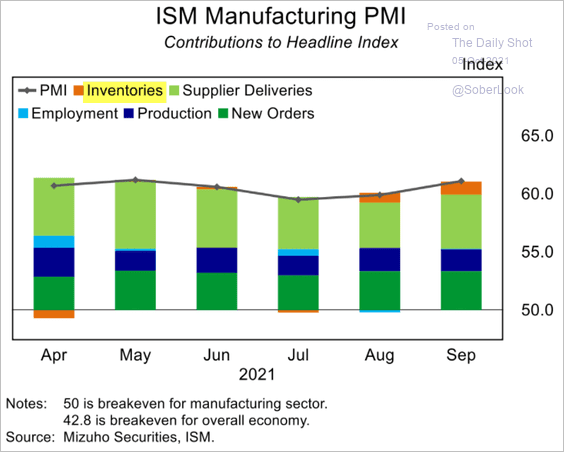
• Manufacturers are building larger-than-normal inventories to deal with shortages. The just-in-time (JIT) inventory management method has gone out the window.
 Source: Mizuho Securities USA
• China’s factory activity tends to lead the US, pointing to moderation in American manufacturing growth ahead.
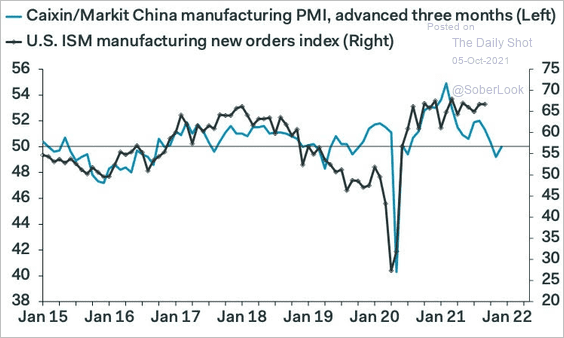 Source: Pantheon Macroeconomics
——————–
2. Retailers are struggling to maintain sufficient inventories.
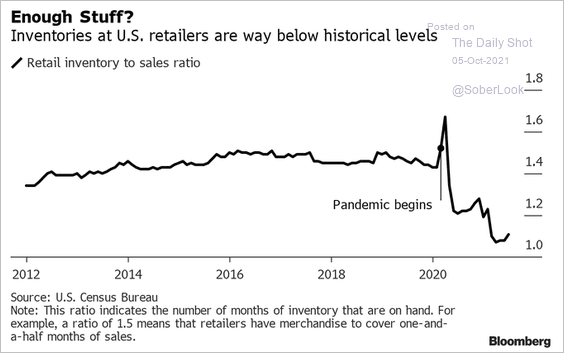 Source: @lisaabramowicz1 Read full article
American consumers are not used to this.
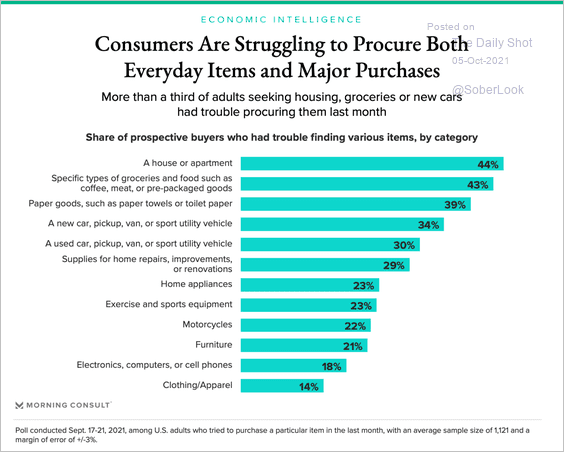 Source: Morning Consult Read full article
——————–
3. Residential and non-residential construction spending trends continue to diverge.
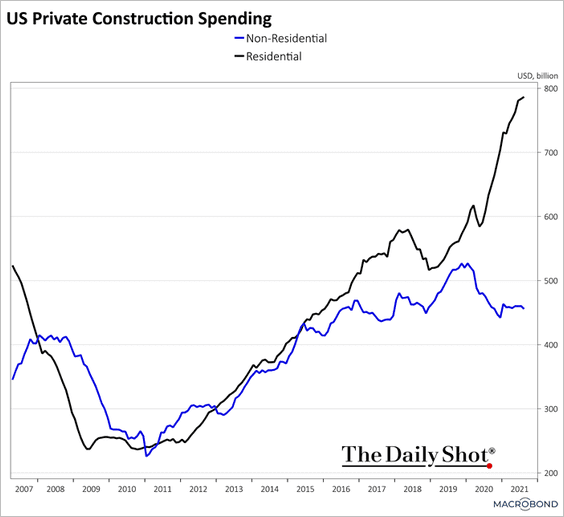 Source: Chart and data provided by Macrobond
By the way, US construction productivity hasn’t grown since WW-II.
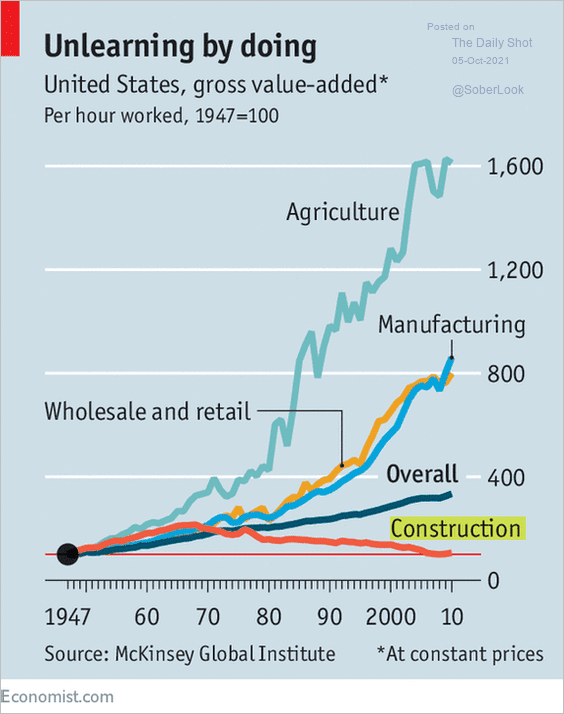 Source: The Economist Read full article
——————–
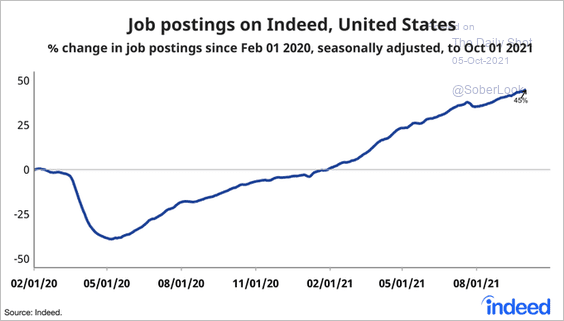
4. Next, we have some updates on the labor market.
• Job openings on Indeed:
 Source: @AE_Konkel, @indeed
• Online job search activity:
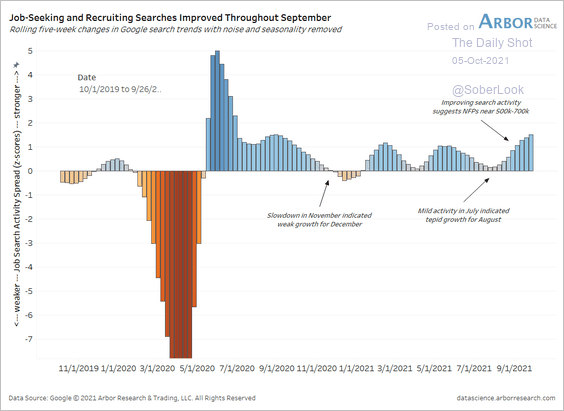 Source: Arbor Research & Trading
• Quit rate (pointing to further upside in wage growth):
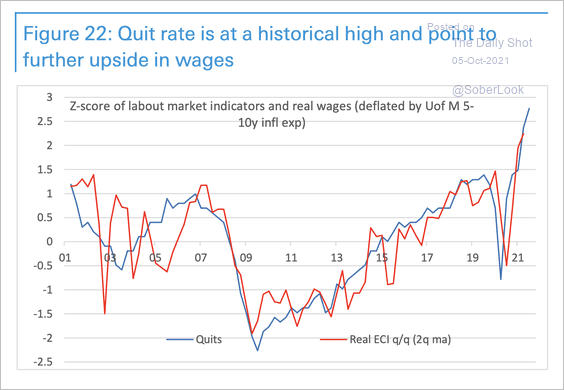 Source: Deutsche Bank Research
——————–
5. Kayak searches for flights are rebounding as the pandemic eases.
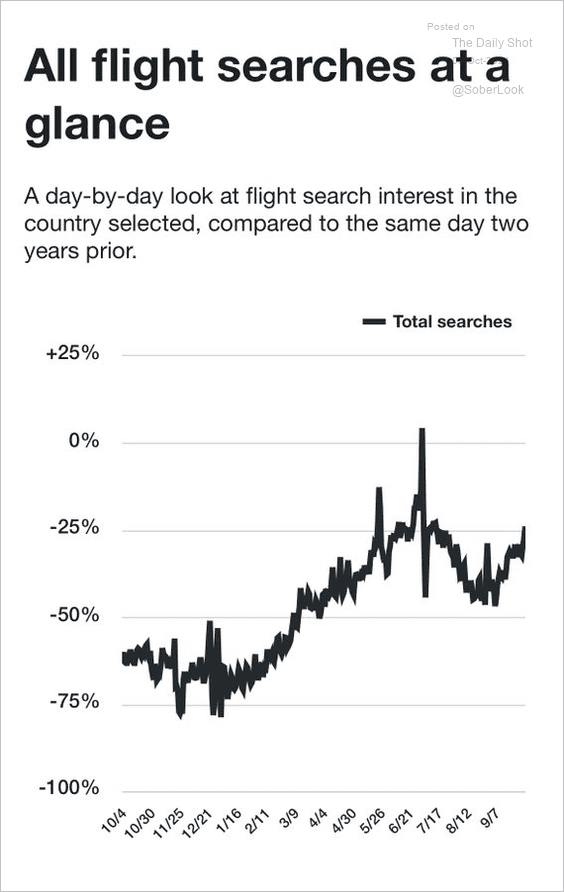 Source: @RenMacLLC
6. Mortgage applications have been resilient despite higher housing prices. But housing activity will see a pullback if Treasury yields rise further.
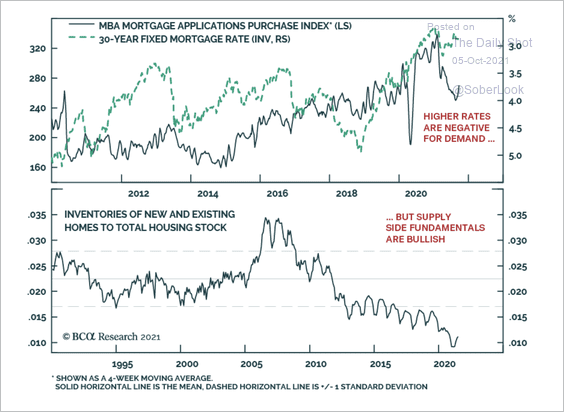 Source: BCA Research
7. Households that received unemployment benefits reduced spending more than those that did not.
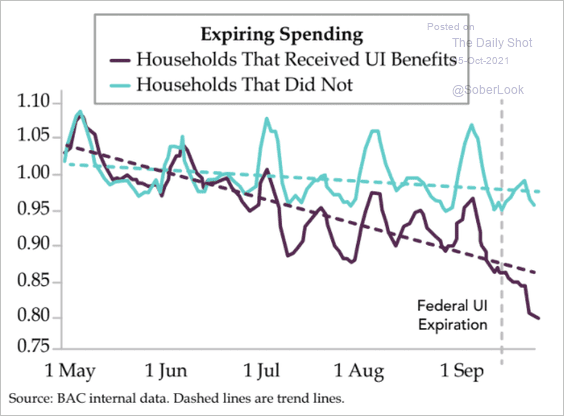 Source: The Daily Feather
8. The Atlanta Fed’s GDPNow model forecast for the third-quarter GDP growth continues to sink.
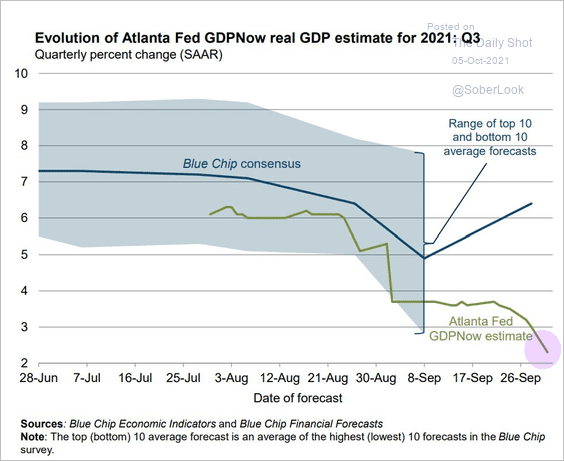 Source: @AtlantaFed Read full article
9. How will a 5% gain in the US dollar (trade-weighted) impact the GDP?
 Source: @TheTerminal, Bloomberg Finance L.P.
Back to Index
The Eurozone
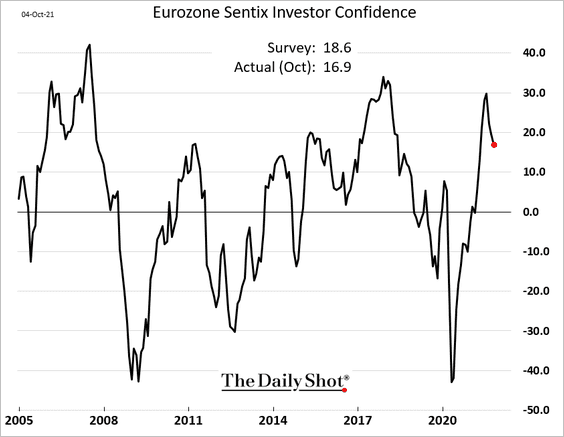
1. Investor sentiment declined again.
2. German electricity prices are moving lower.
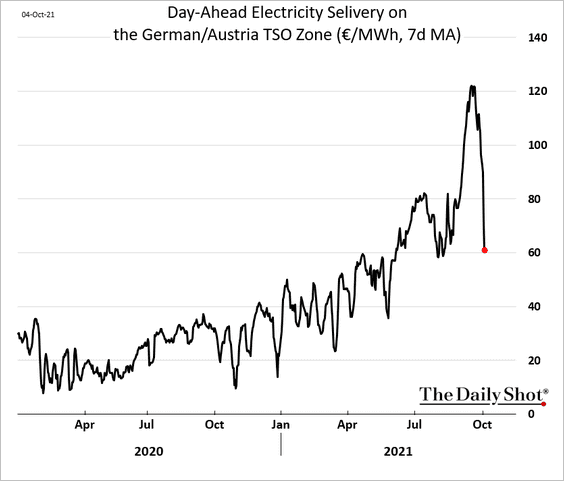
But power prices remain elevated across Europe.
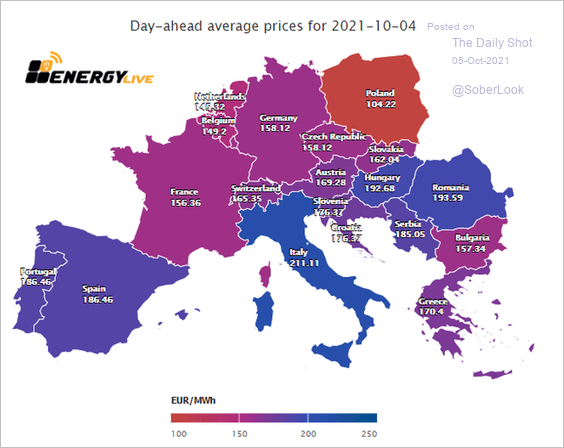 Source: @MikeZaccardi, @enelyst_
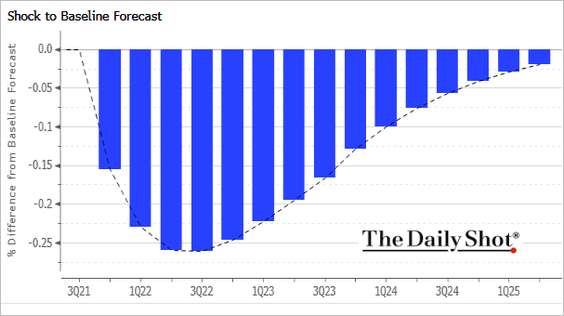
Increased energy costs will squeeze disposable incomes.
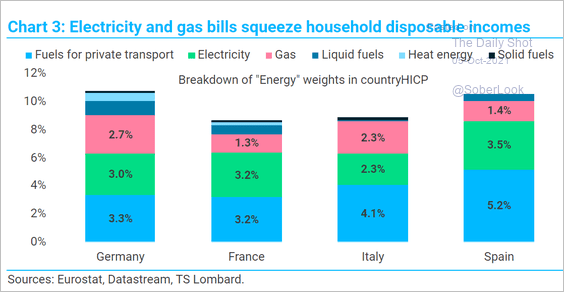 Source: TS Lombard
——————–
3. Will euro-area PMI catch up to the US ISM, …
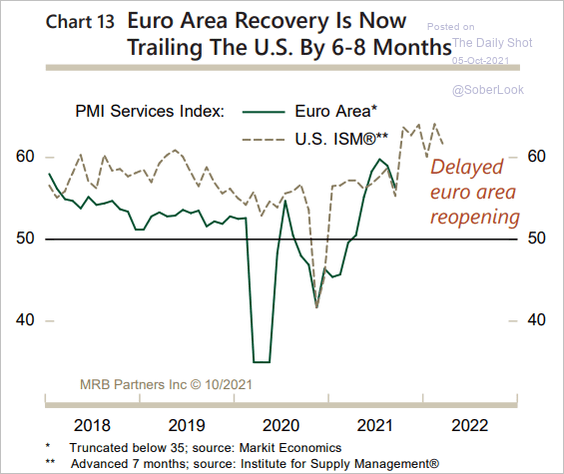 Source: MRB Partners
… or will China derail Eurozone’s manufacturing expansion?
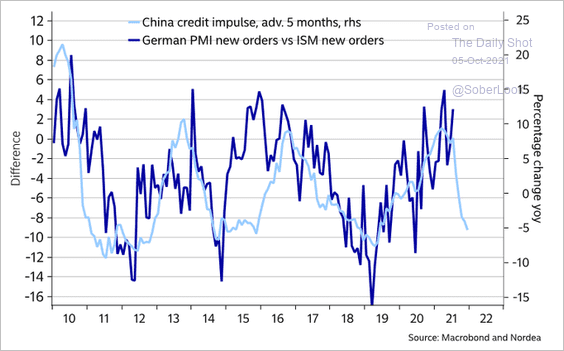 Source: @AndreasSteno
——————–
4. Here are the drivers of euro-area inflation (2 charts).
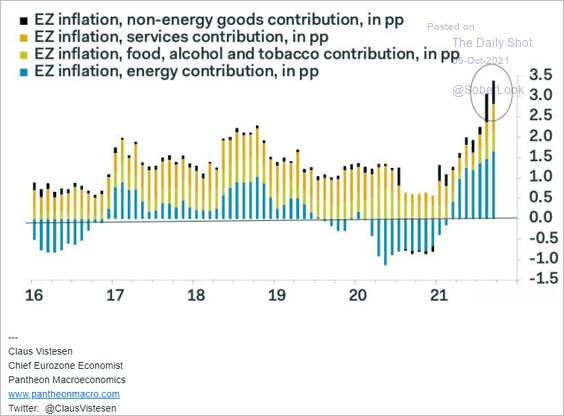 Source: Pantheon Macroeconomics
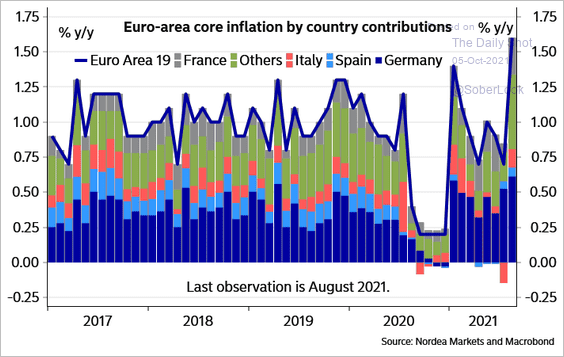 Source: Nordea Markets
Back to Index
Europe
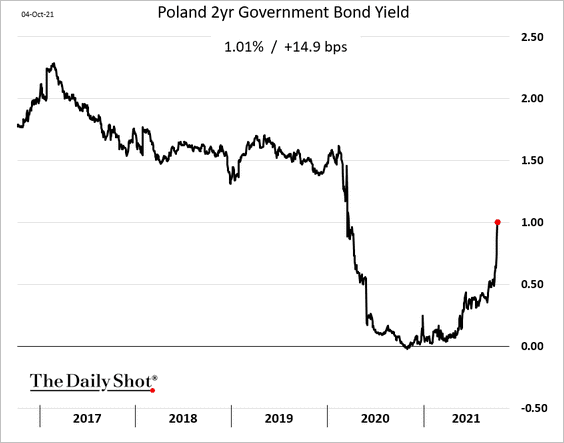
1. Poland’s bond yields are surging on expectations of rate hikes.
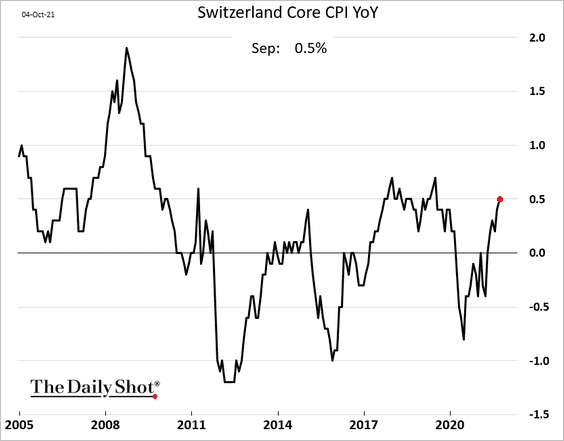
2. Swiss inflation is in positive territory. Will it stay there?
3. EU building permits have recovered.
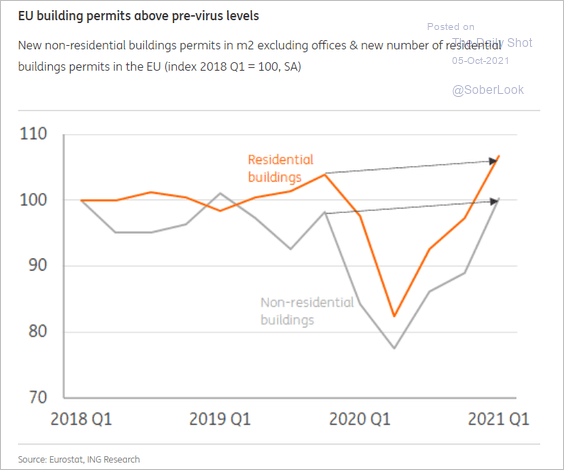 Source: ING
4. Nordic water shortages are putting downward pressure on hydroelectric power output.
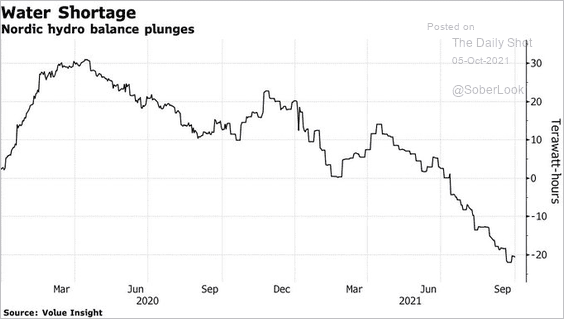 Source: @C_Barraud Read full article
Back to Index
Asia – Pacific
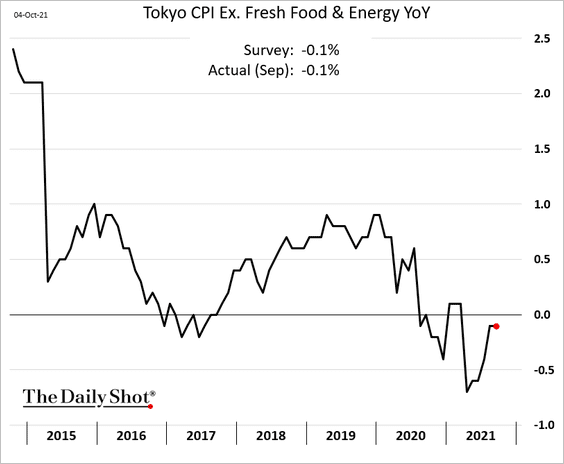
1. Tokyo’s core CPI has stalled below zero, which suggests that inflation remained subdued at the national level in September.
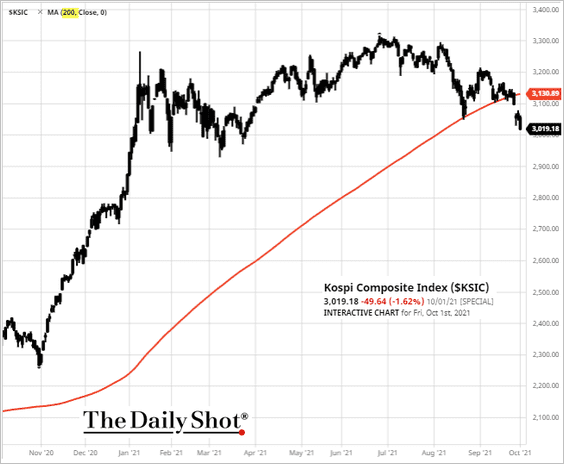
2. South Korea’s stock market is rolling over.
 Source: barchart.com
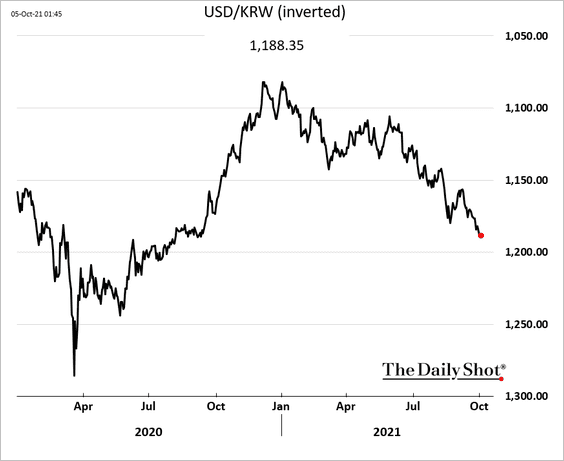
And the won has been trending down amid capital outflows.
——————–
3. New Zealand has been experiencing robust job growth despite lockdowns. Rate hikes are coming.
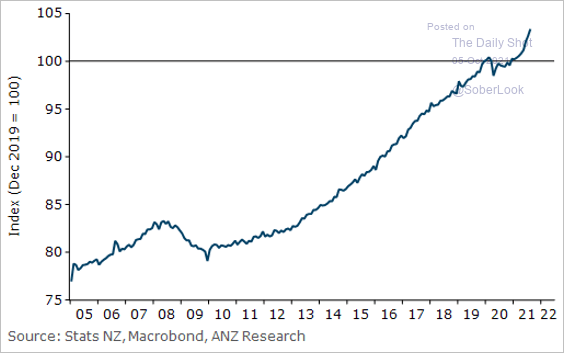 Source: ANZ Research
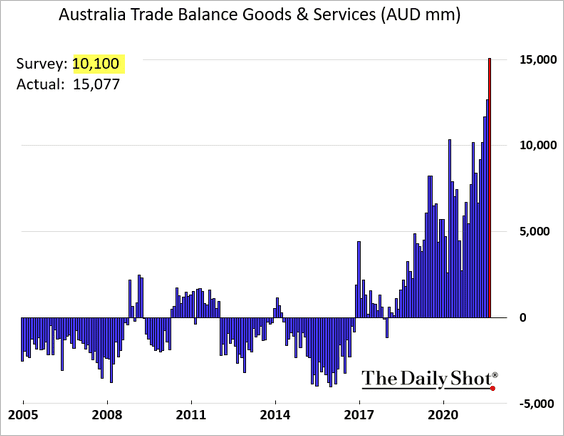
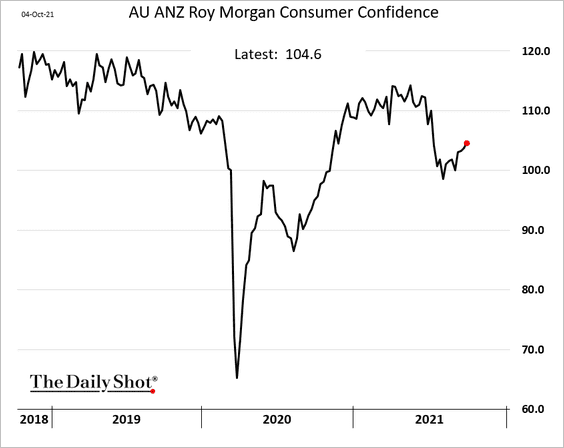
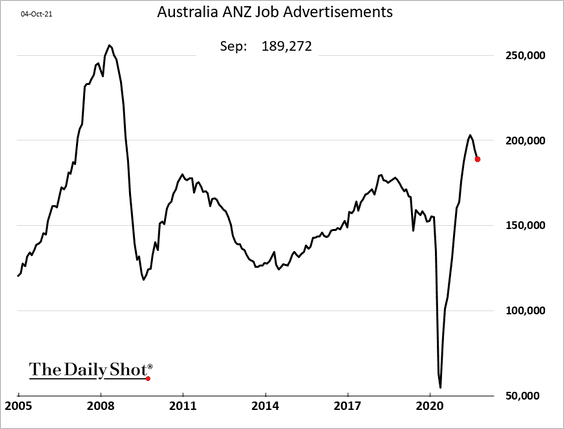
4. Next, we have some updates on Australia.
• The trade surplus surged to new highs.
• Consumer confidence is rebounding.
• Job ads are off the highs.
Back to Index
China
1. Leveraged developers’ debt spreads have blown out.
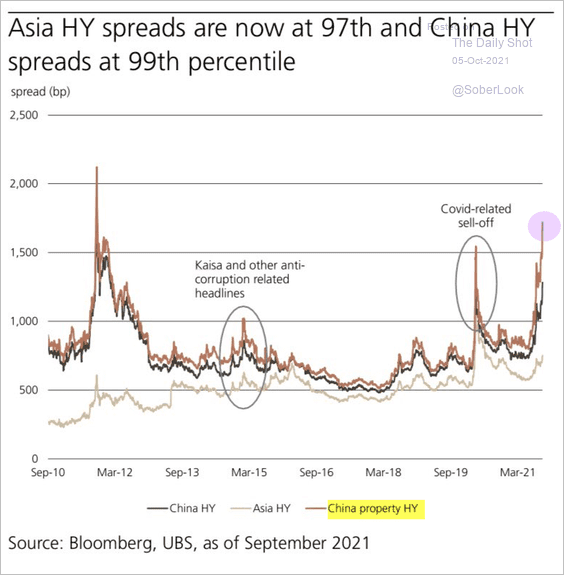 Source: UBS; @AlessioUrban
• China’s housing market was already slowing before the Evergrande fallout hit the newswires.
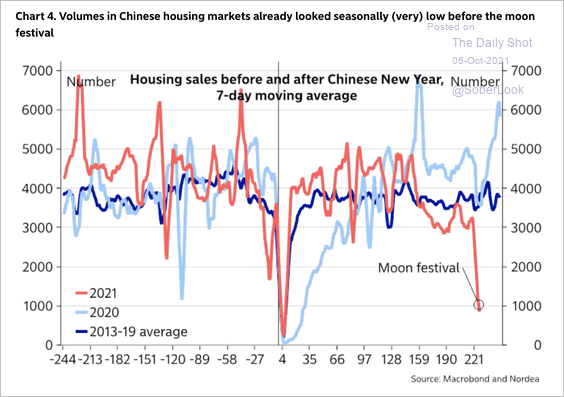 Source: Nordea Markets
• House price-to-income ratios dominate the list of the world’s most expensive cities (2 charts).
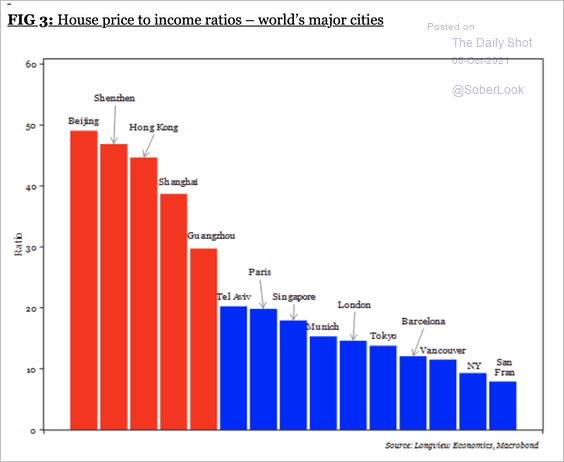 Source: Longview Economics
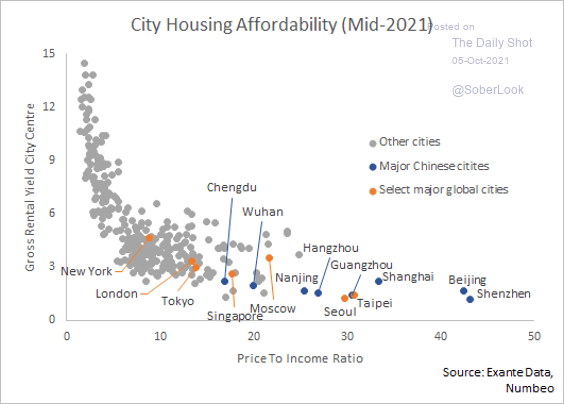 Source: @ExanteData
• Residential investment has been surging.
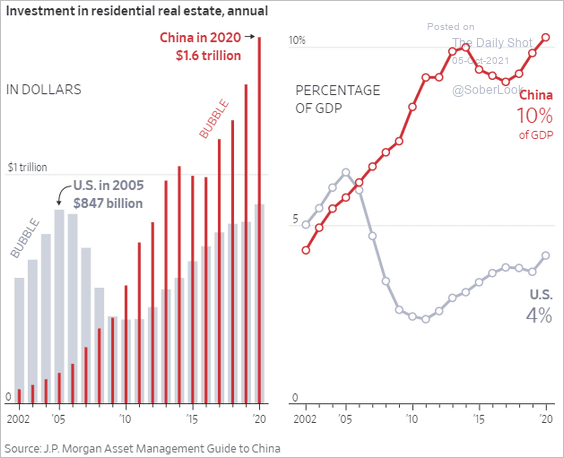 Source: @WSJ Read full article
——————–
2. Coal inventories tumbled this year.
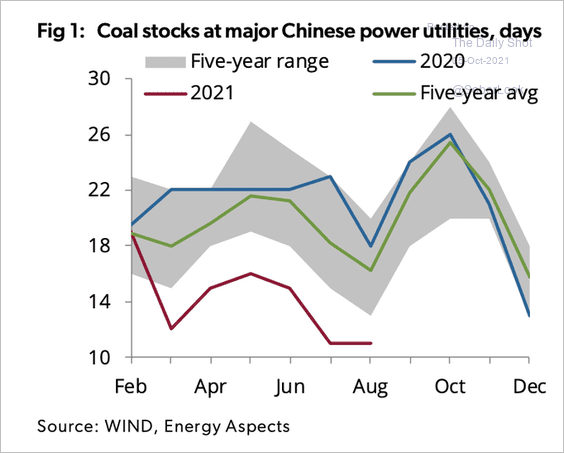 Source: @HFI_Research
The spat with Australia didn’t help.
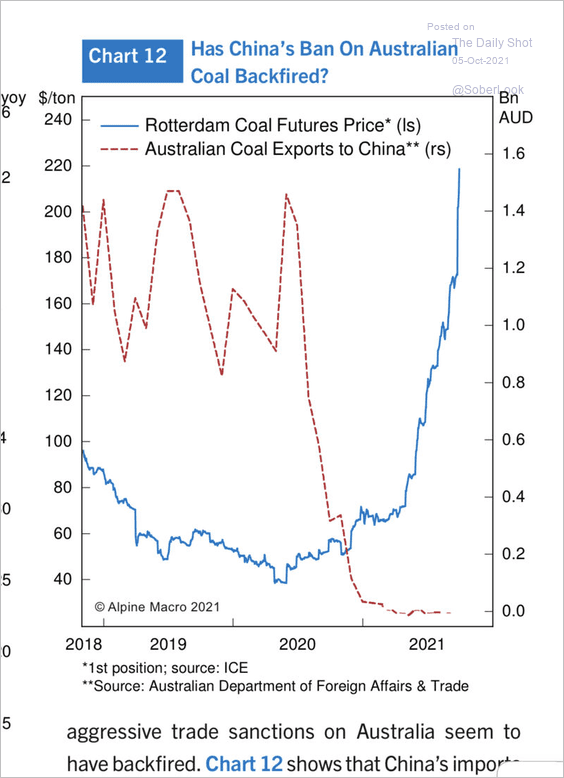 Source: Chen Zhao, Alpine Macro
Here is China’s energy mix.
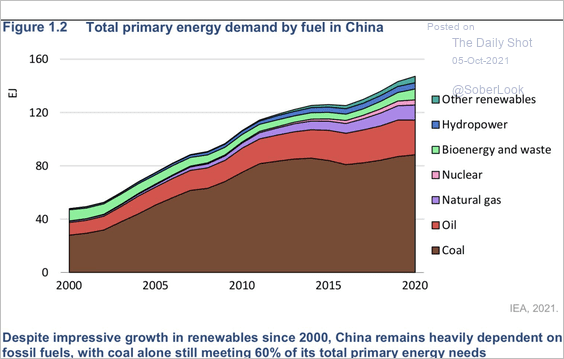 Source: IEA; @andrewtwone
——————–
3. China’s refined fuel exports have tumbled.
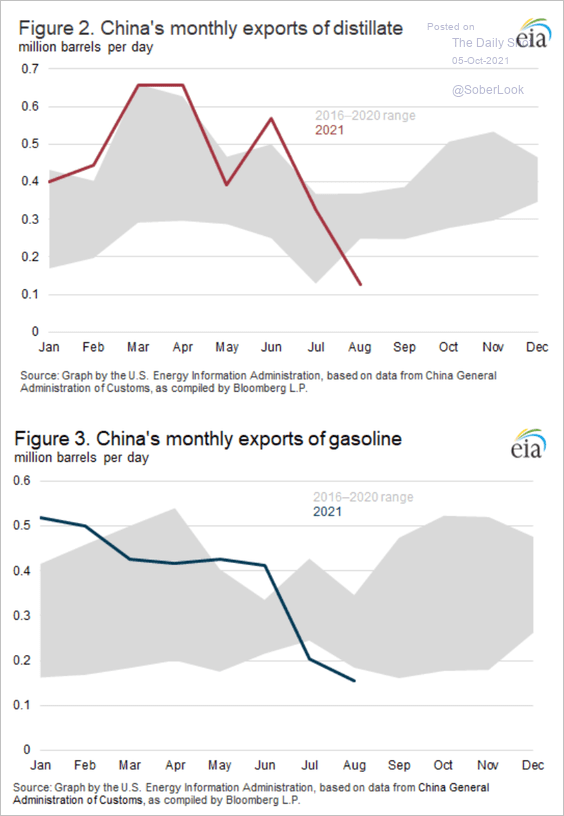 Source: EIA
See this story (from August) explaining the situation.
 Source: Reuters Read full article
——————–
4. Semiconductor stocks have seen strong relative earnings growth.
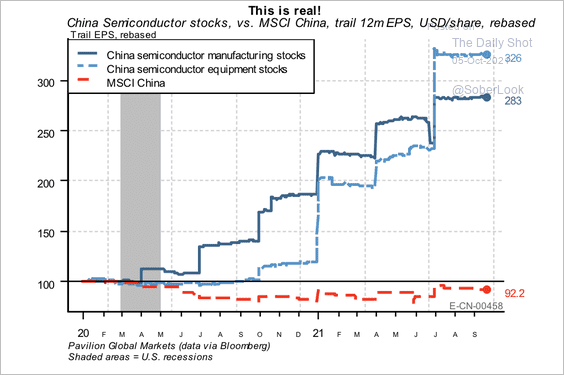 Source: Pavilion Global Markets
• Integrated circuits output has been rising.
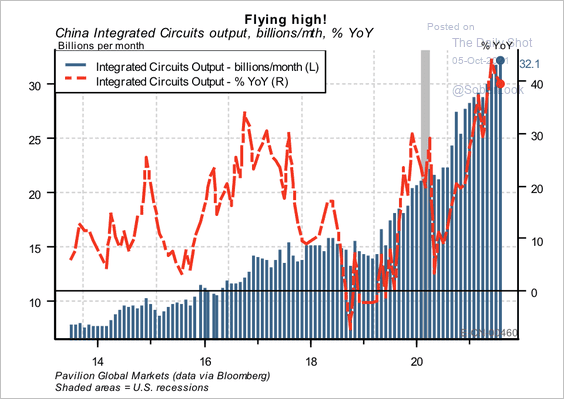 Source: Pavilion Global Markets
• China is now ahead of Taiwan as the largest buyer of chip equipment.
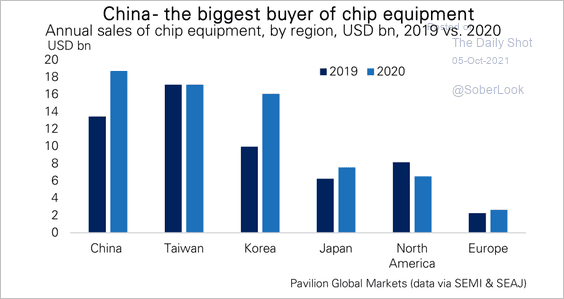 Source: Pavilion Global Markets
Back to Index
Emerging Markets
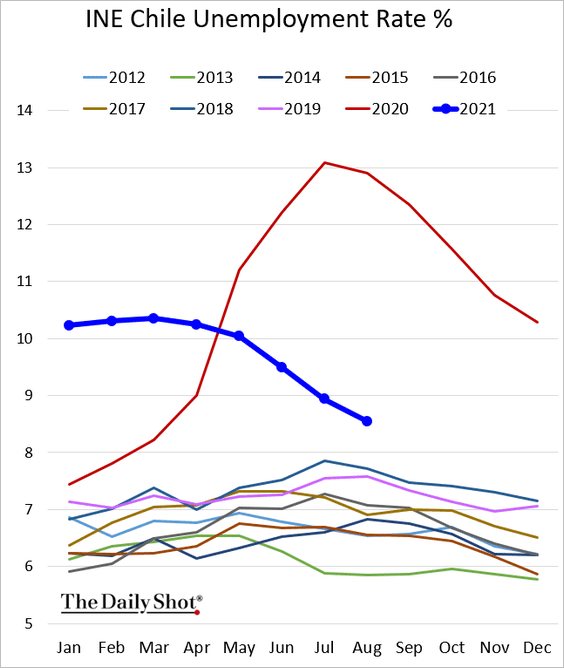
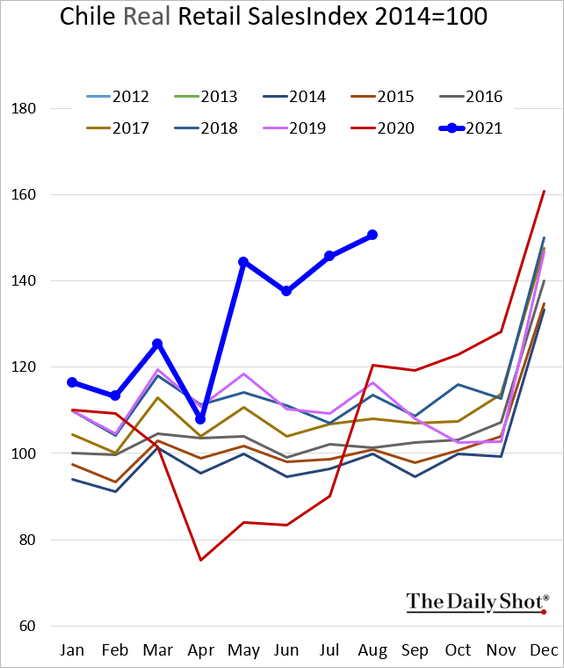
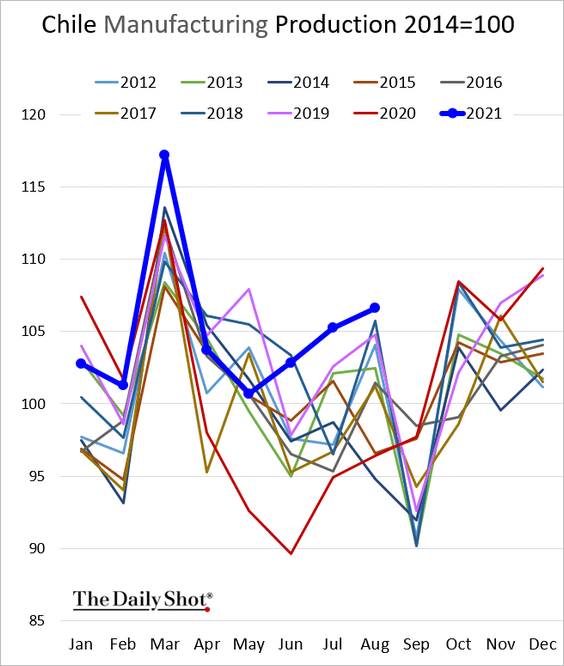
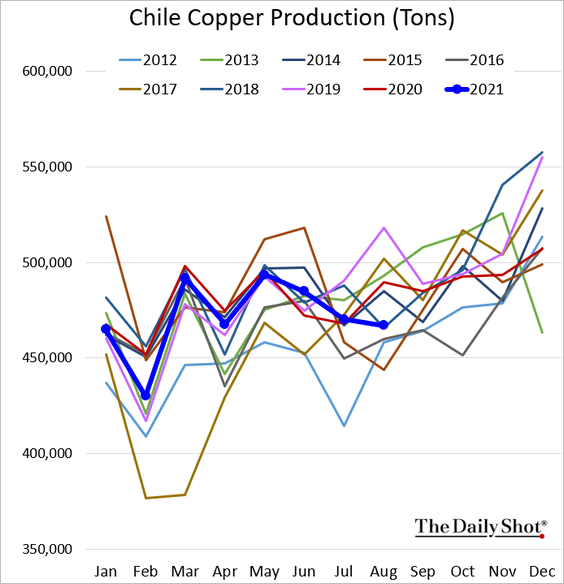
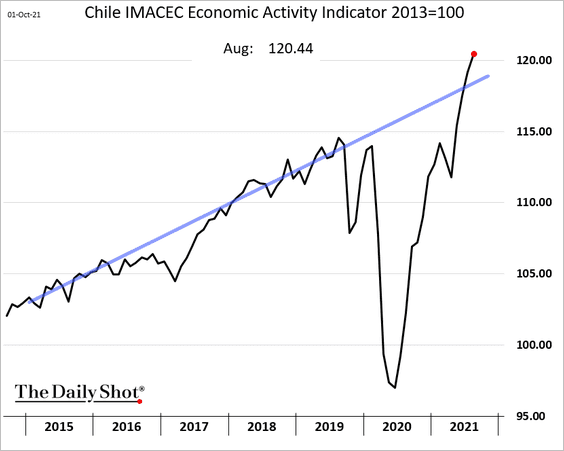
1. Let’s begin with some updates on Chile, where economic growth remains robust.
• Unemployment:
• Retail sales:
• Manufacturing production:
• Copper output:
• Economic activity:
——————–
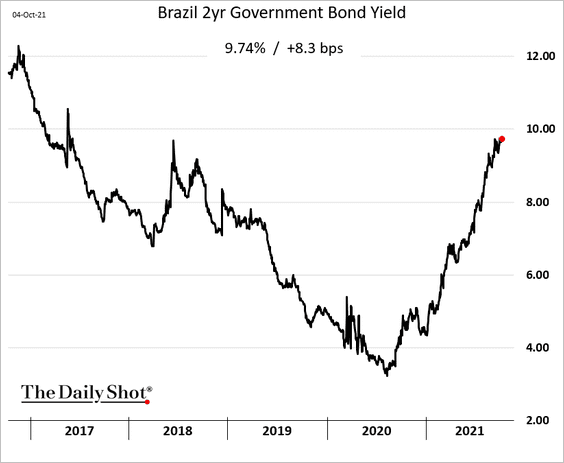
2. Brazil’s 2yr bond yield is approaching 10%.
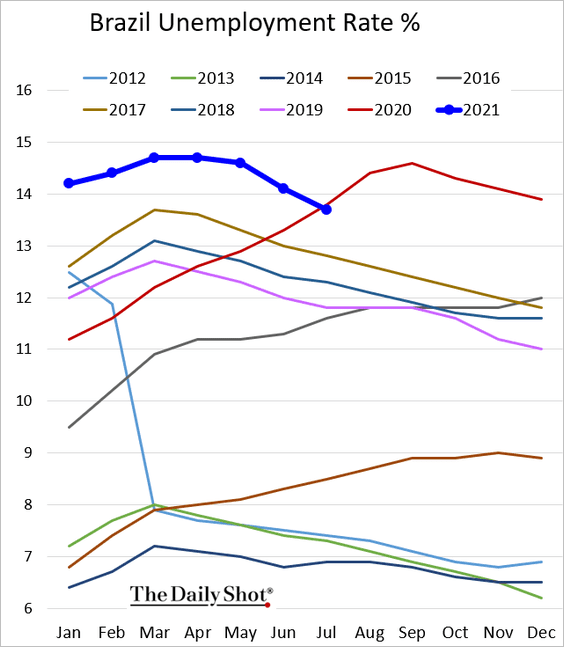
• The unemployment rate is finally below 2020 levels.
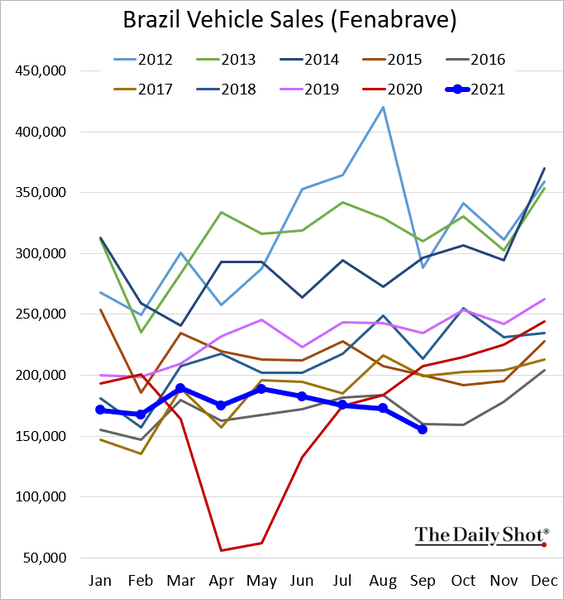
• Vehicle sales remain soft (a global trend).
——————–
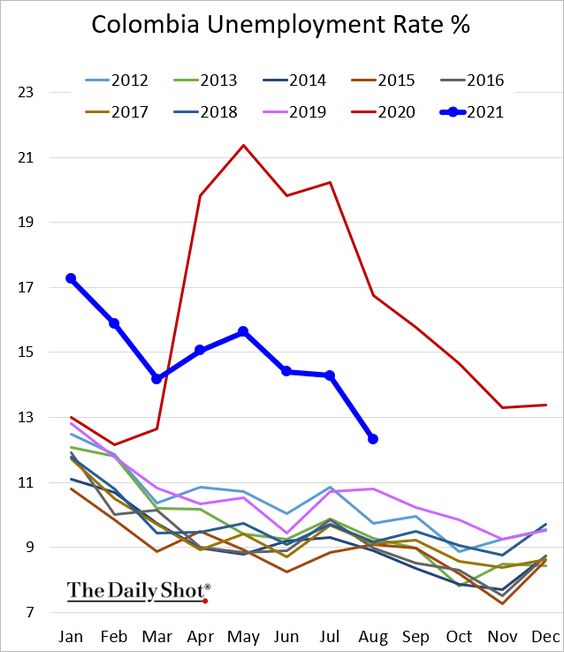
3. Colombia’s central bank hiked rates for the first time since 2016.
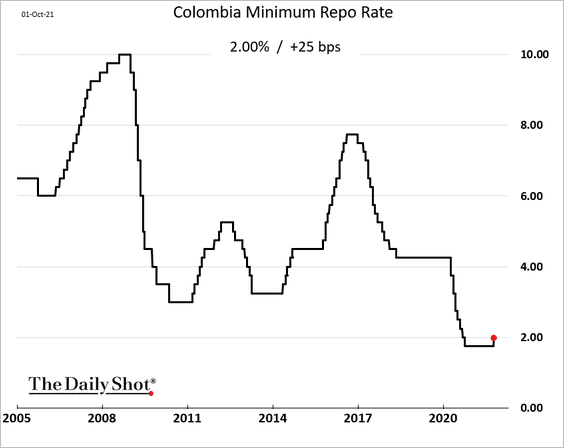
The labor market is recovering.
——————–
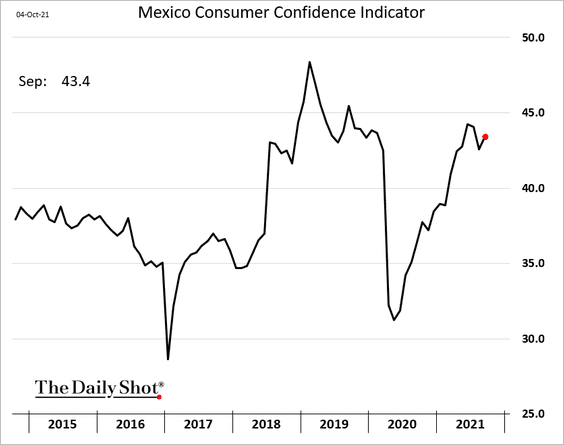
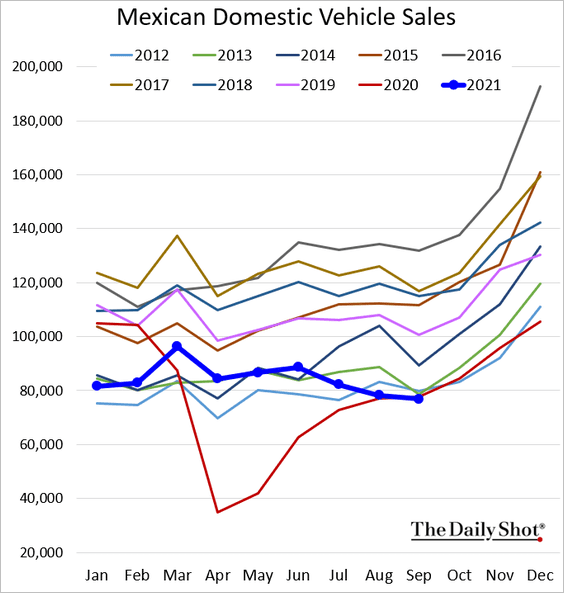
4. Next, we have some updates on Mexico.
• Consumer confidence:
• Vehicle sales;
• More rate hikes ahead:
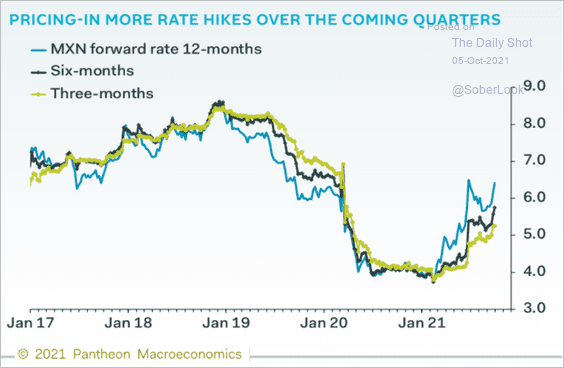 Source: Pantheon Macroeconomics
——————–
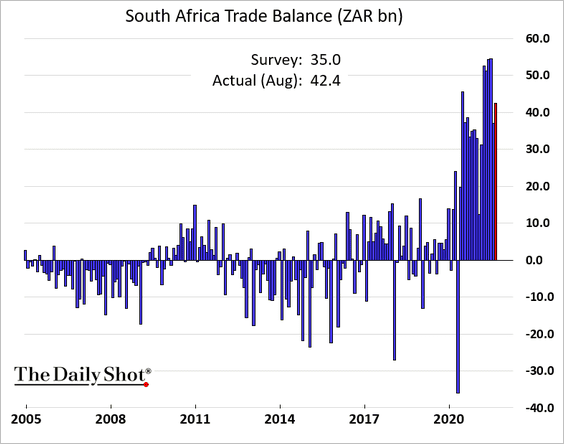
5. South Africa’s trade surplus surprised to the upside again.
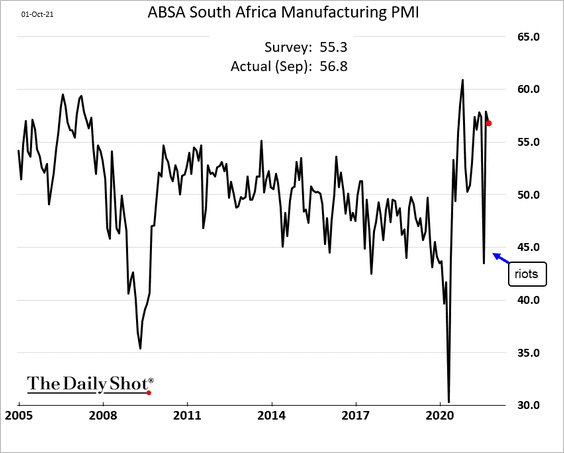
Factory growth remains robust.
——————–
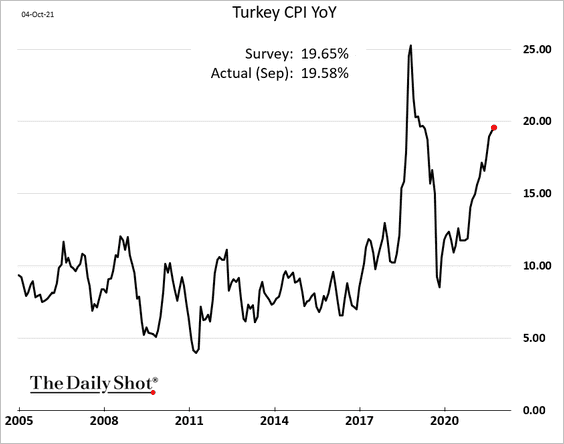
6. Turkey’s inflation continues to climb.
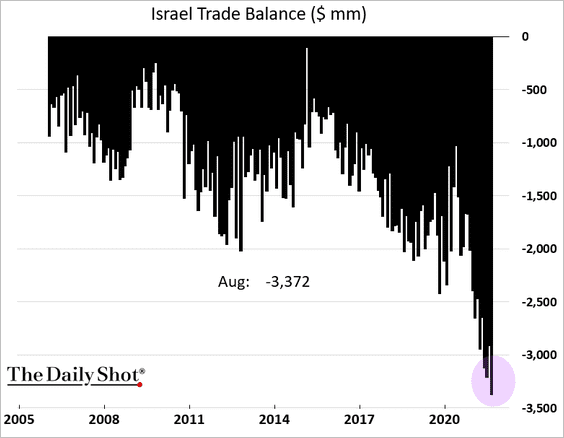
7. Israel’s trade deficit hit another record.
8. India’s coal inventories have collapsed.
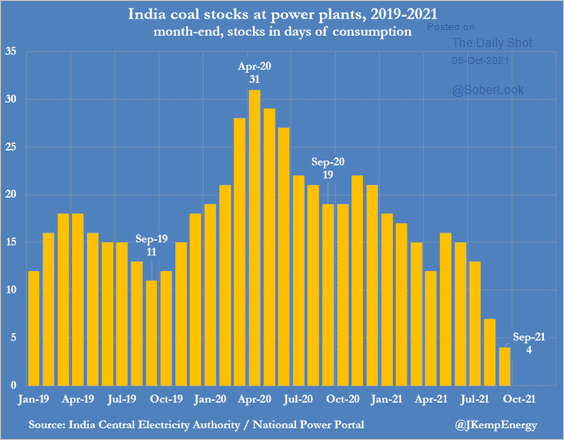 Source: @JKempEnergy
• Indian trade deficit surged due to a spike in oil imports.
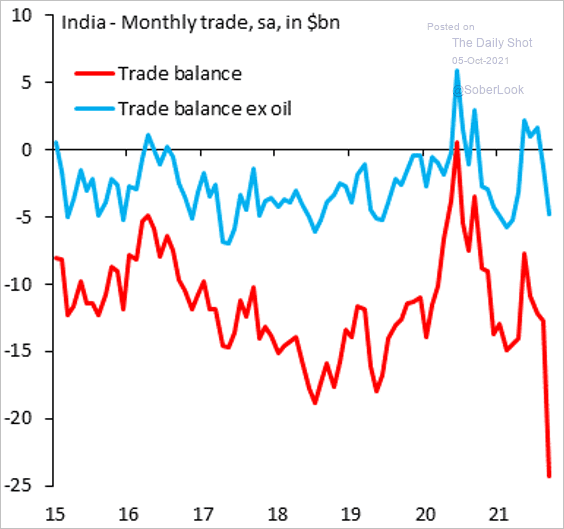 Source: @SergiLanauIIF
• India’s PMI reports continue to show moderate growth (2 charts).
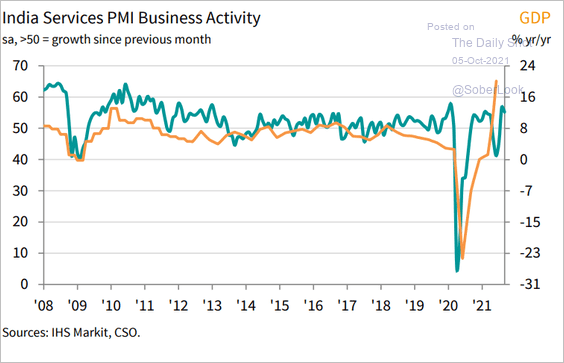 Source: IHS Markit
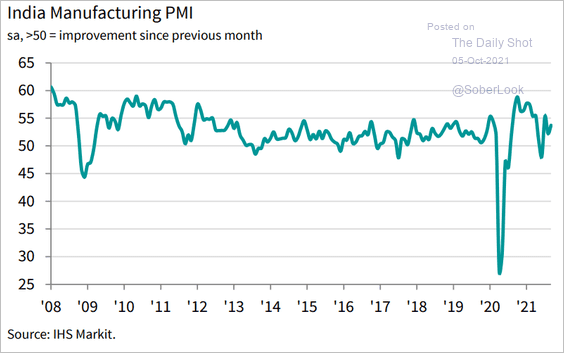 Source: IHS Markit
——————–
9. COVID-19 cases have peaked in developed and emerging economies, …
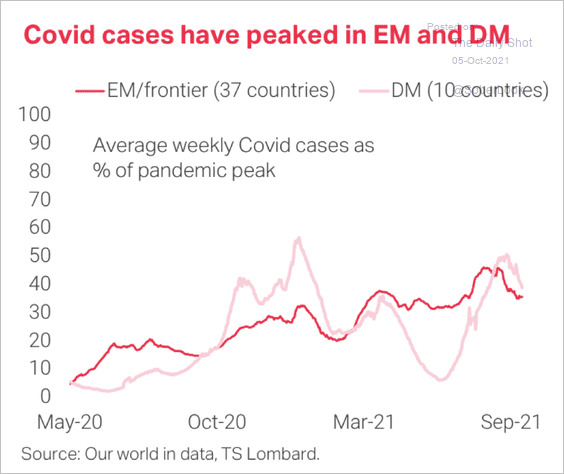 Source: TS Lombard
… especially in Southeast Asia, which recently experienced a surge in Delta variant cases.
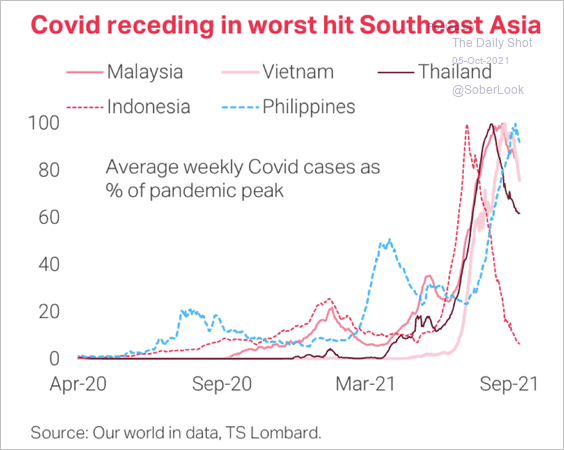 Source: TS Lombard
Back to Index
Cryptocurrency
1. The correlation between bitcoin and ether increased during the recent crypto sell-off.
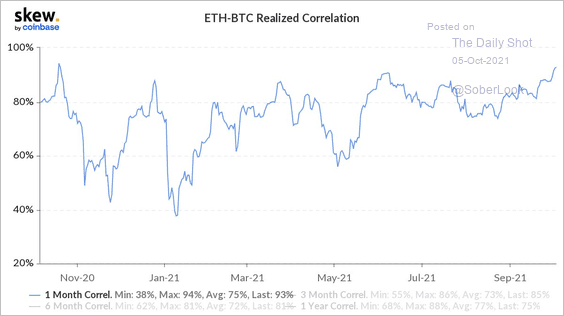 Source: @CoinbaseInsto
2. Bitcoin trading volume has been subdued relative to the levels we saw earlier this year.
![]() Source: @WSJ Read full article
Source: @WSJ Read full article
3. Ethereum transactions settled surged this year.
![]() Source: @RyanWatkins_
Source: @RyanWatkins_
4. Crypto funds saw $90 million of inflows last week, marking the seventh consecutive week of inflows.
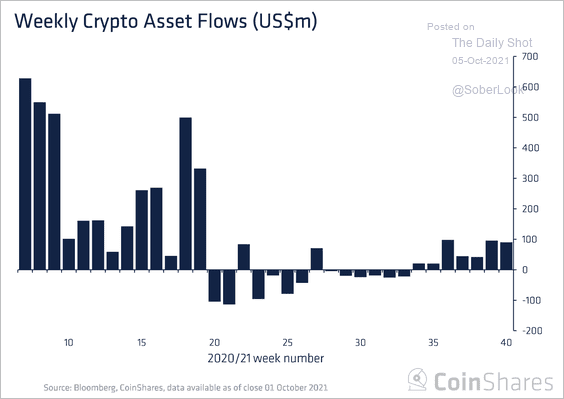 Source: CoinShares Read full article
5. Circle Financial, a key supporter of the USDC stablecoin, is under investigation by the SEC.
 Source: CoinDesk Read full article
Back to Index
Commodities
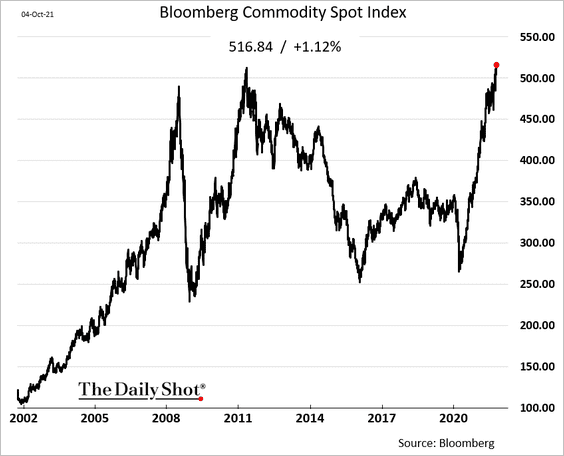
1. Bloomberg’s broad commodity index hit a record high as oil prices surged.
2. Tin prices have been soaring.
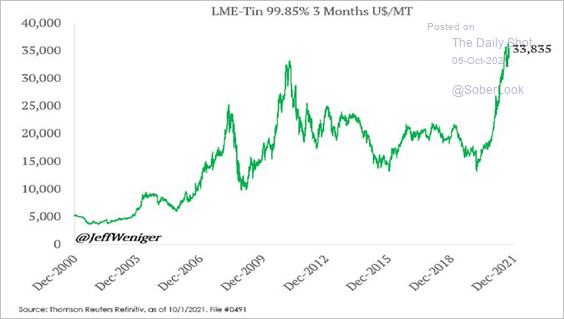 Source: @JeffWeniger
3. China’s deteriorating credit impulse poses a risk for commodities.
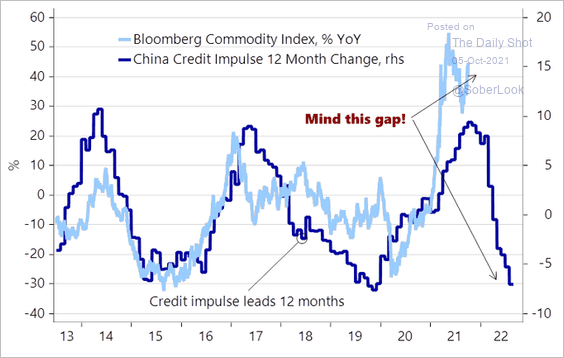 Source: @AndreasSteno
Back to Index
Energy
1. Brent climbed above $81/bbl after bullish news from OPEC+.
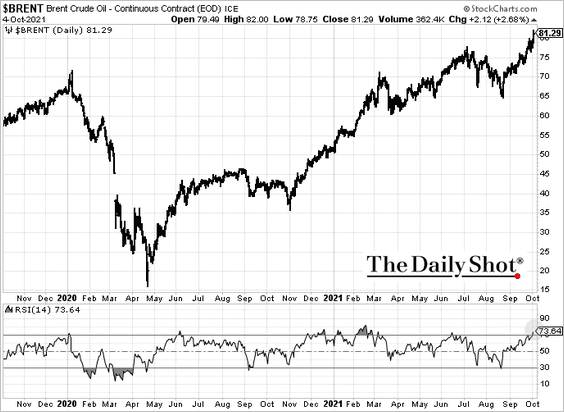
 Source: @WSJ Read full article
——————–
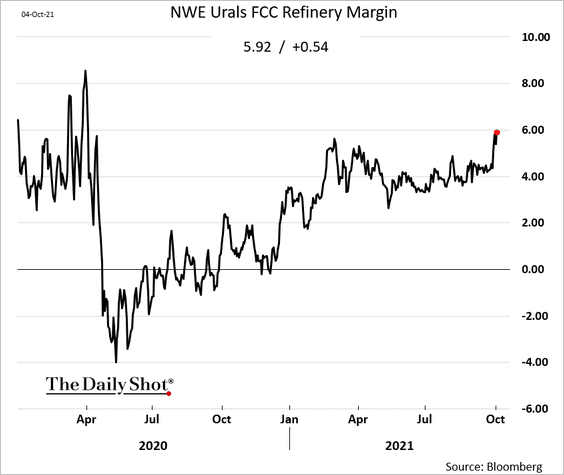
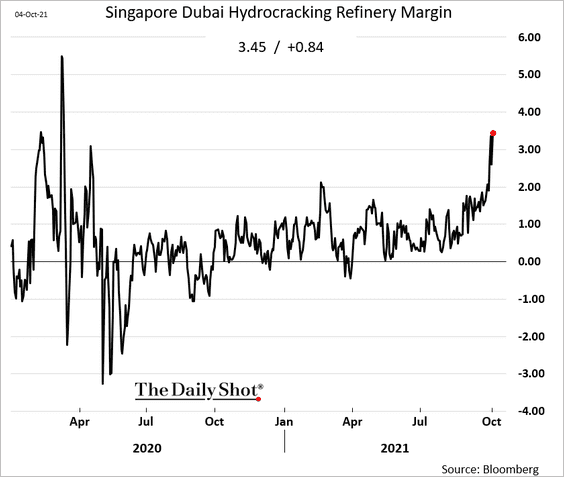
2. Refinery margins are surging.
• Europe:
• Asia:
• US (3-2-1 crack spread):
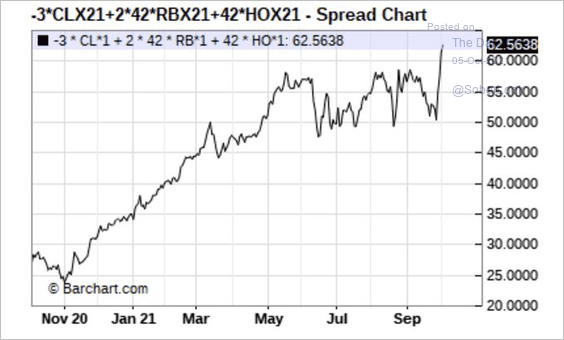 Source: @HFI_Research
——————–
3. US crude and refined products inventories are well below the 5-year average.
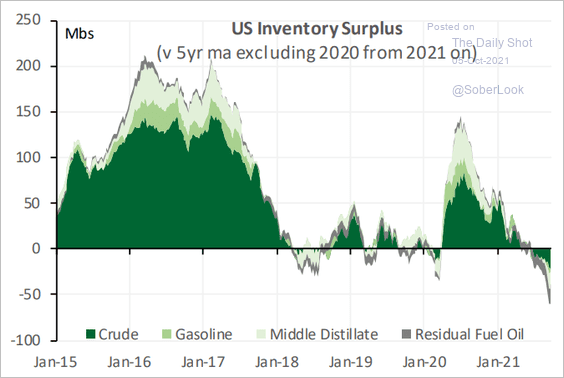 Source: Cornerstone Macro
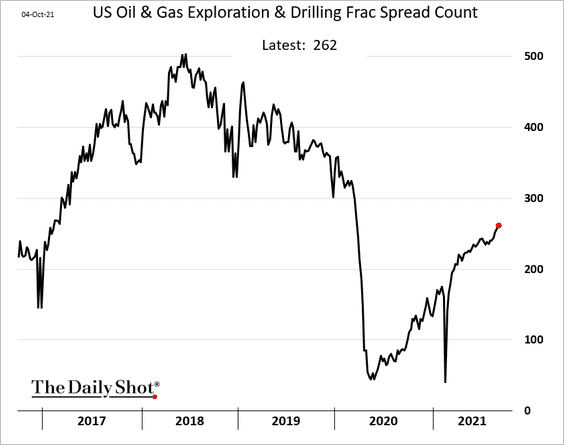
4. US fracking activity continues to recover.
Back to Index
Equities
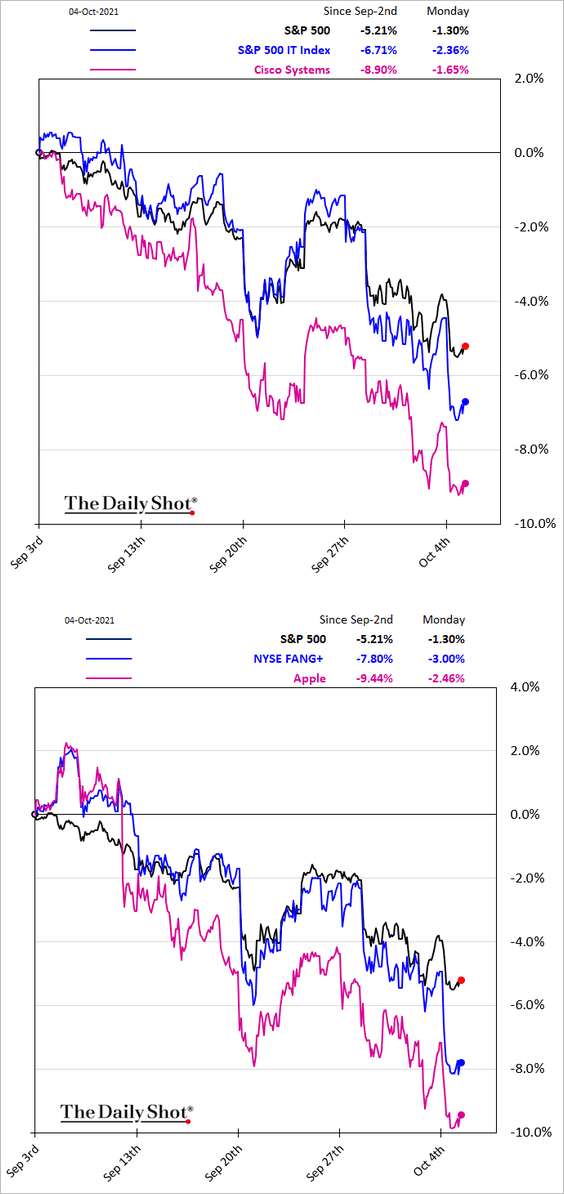
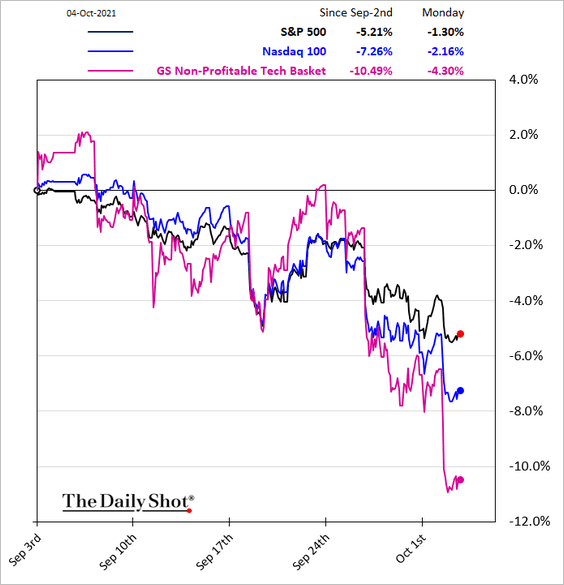
1. Growth stocks remain under pressure amid jitters about bond yields.
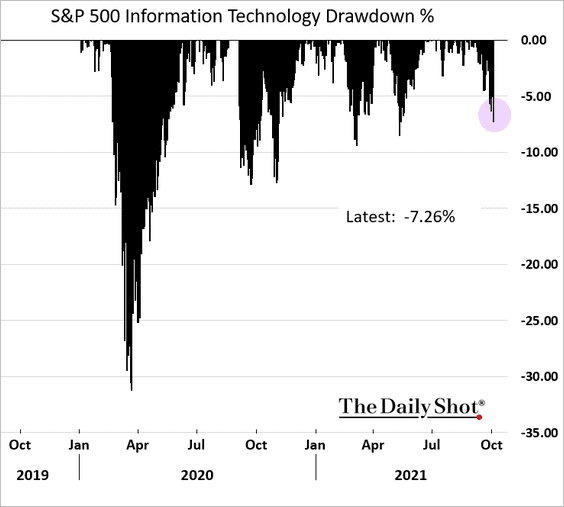
• The tech sector’s drawdown is still relatively modest.
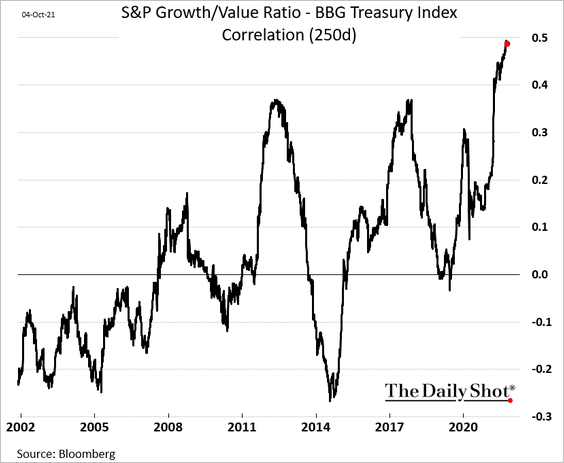
• Growth shares’ relative performance is highly correlated to Treasury prices.
• The valuation gap between growth and value stocks remains near extremes.
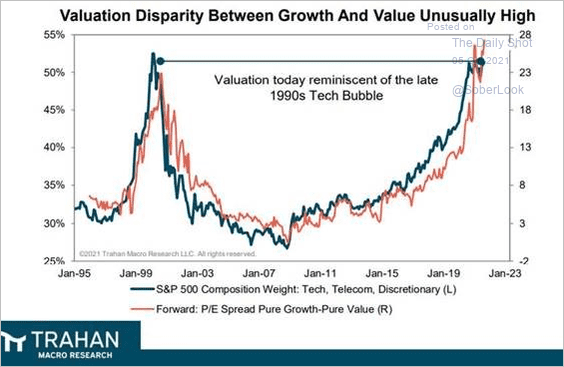 Source: Trahan Macro; @RBAdvisors
• The tech mega-caps are testing support at the 200-day moving average.
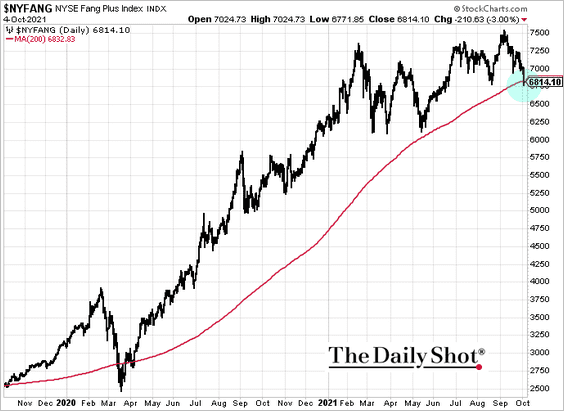
By the way, these companies remain a substantial component of the S&P 500.
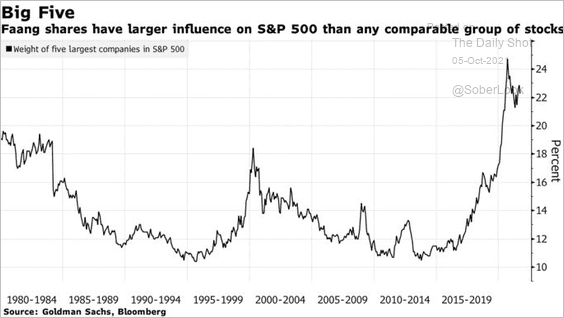 Source: Bloomberg Read full article
• Here are the largest contributors to the S&P 500 decline from the peak (and stocks offsetting the drop).
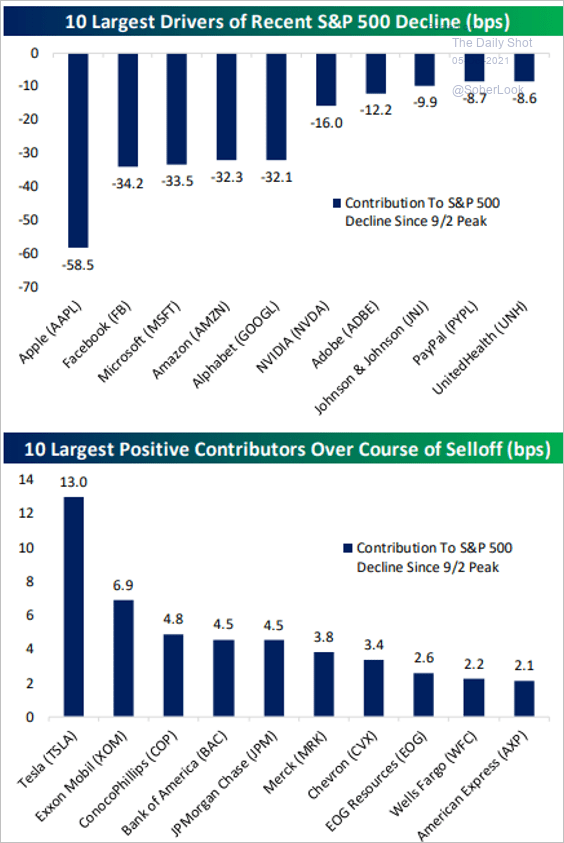 Source: @bespokeinvest Read full article
——————–
2. Speculative tech stocks are finally underperforming as the Reddit crowd retreats.
• Where is the Reddit crowd going? Into crypto, of course.
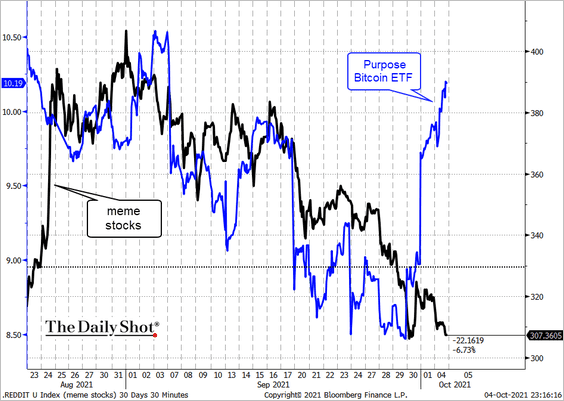 Source: @TheTerminal, Bloomberg Finance L.P.
• By the way, here is the ARK Innovation ETF overlaid on top of the dot-com bubble.
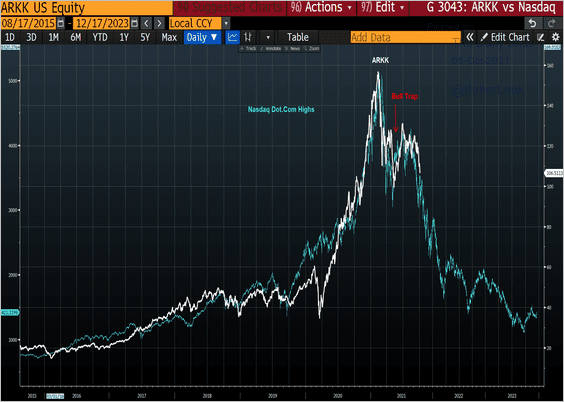 Source: @JulianMI2
• It’s been a good year for OTC share trading.
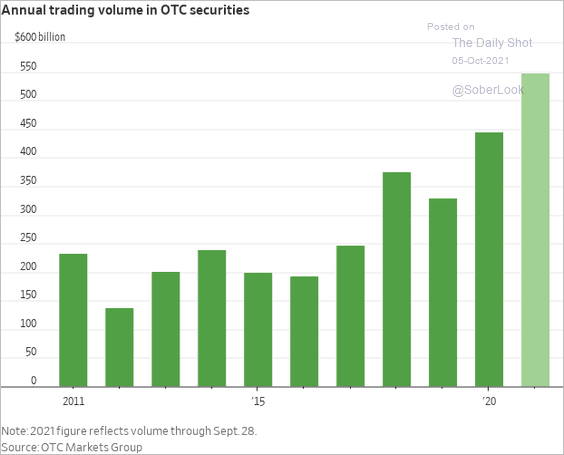 Source: @WSJ Read full article
——————–
3. The fourth quarter historically has the best performance.
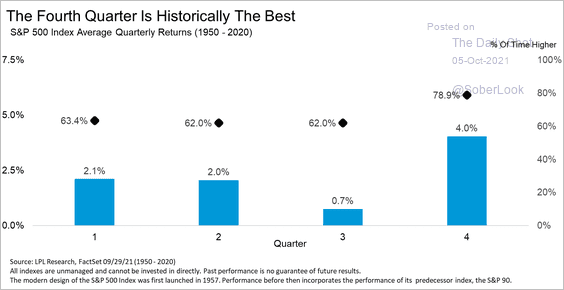 Source: LPL Research
4. Sentiment has deteriorated.
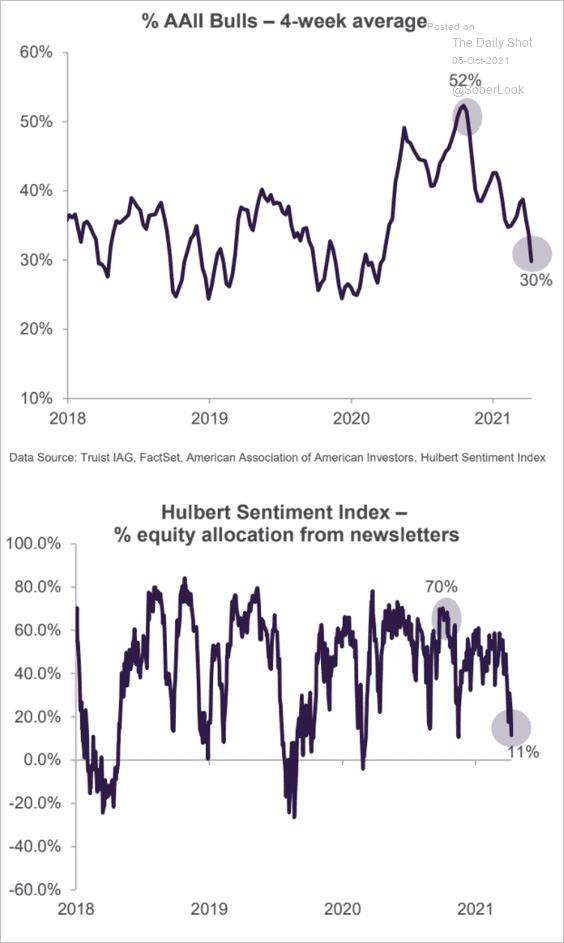 Source: Truist Advisory Services
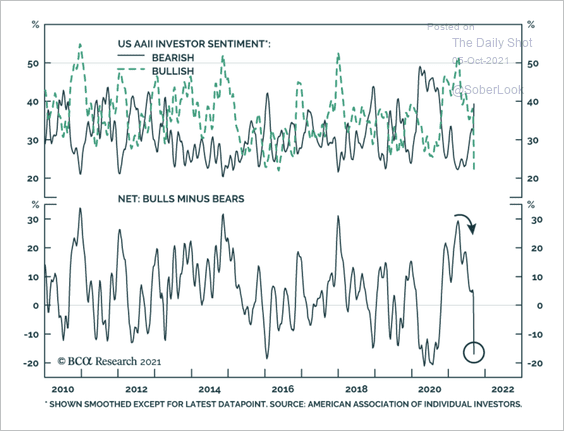 Source: BCA Research
——————–
5. Small-caps’ relative performance has been correlated with Treasury yields.
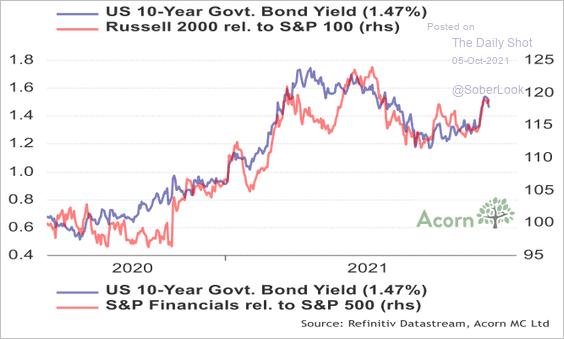 Source: Acorn Macro Consulting Ltd.
6. Liquidity is a leading driver of equity returns, and the latest prints suggest worse returns ahead.
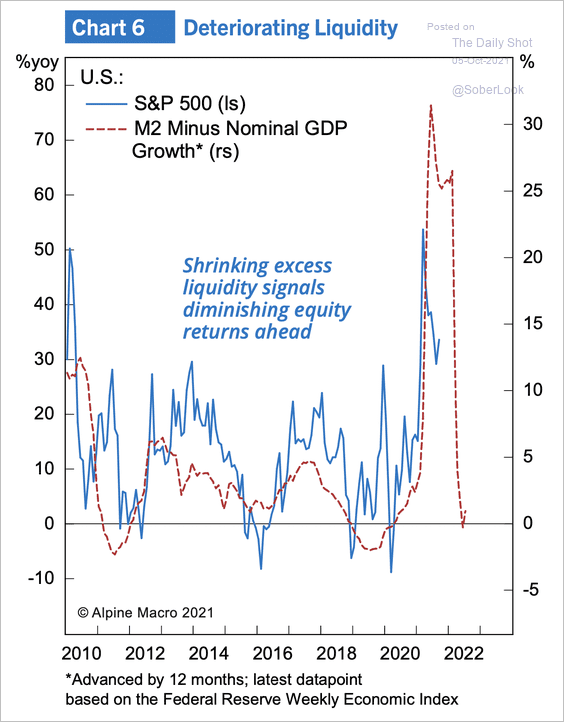 Source: Alpine Macro
7. This chart shows how stocks performed around the world last month.
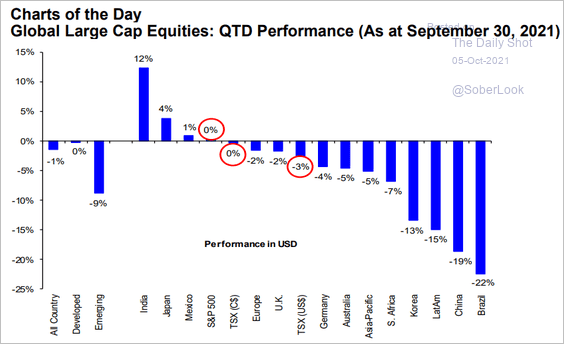 Source: Hugo Ste-Marie, Portfolio & Quantitative Strategy Global Equity Research, Scotia Capital
Back to Index
Credit
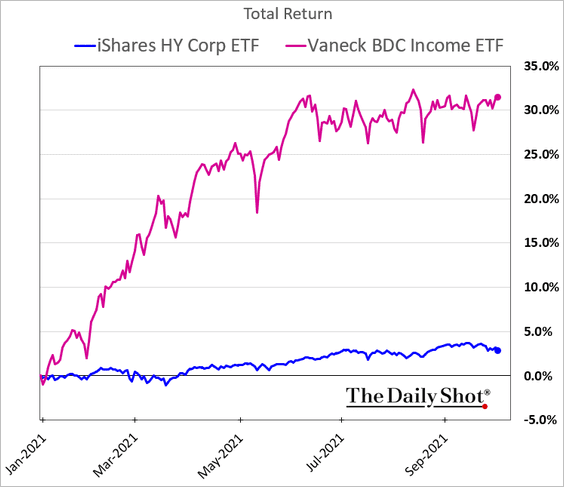
1. BDCs remain resilient despite softer stock and high-yield bond prices.
2. US corporate bond issuance hit an all-time high last year, primarily driven by investment-grade credit.
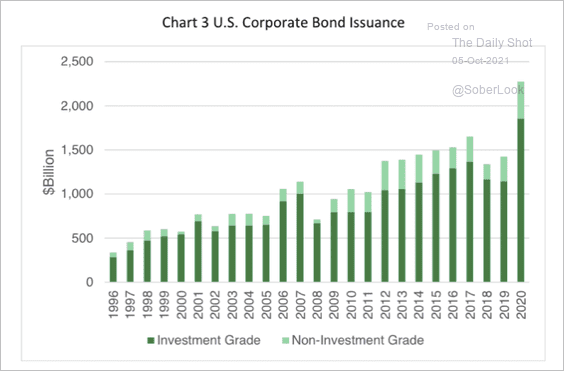 Source: NY Fed
• US corporate debt growth is starting to slow as a percentage of GDP, while total debt continues to grow.
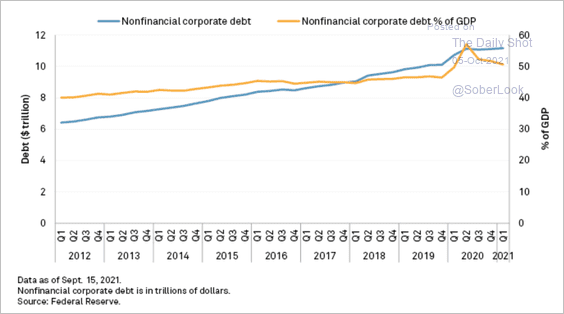 Source: S&P Global Market Intelligence
• A large amount of US corporate debt is due to mature over the next few years. S&P warned that a rise in borrowing rates related to inflation could make it harder for companies to make repayments.
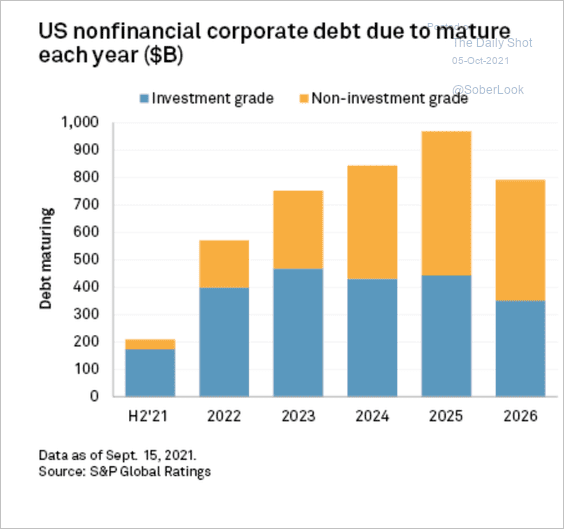 Source: S&P Global Market Intelligence
• Here are some trends in corporate debt globally.
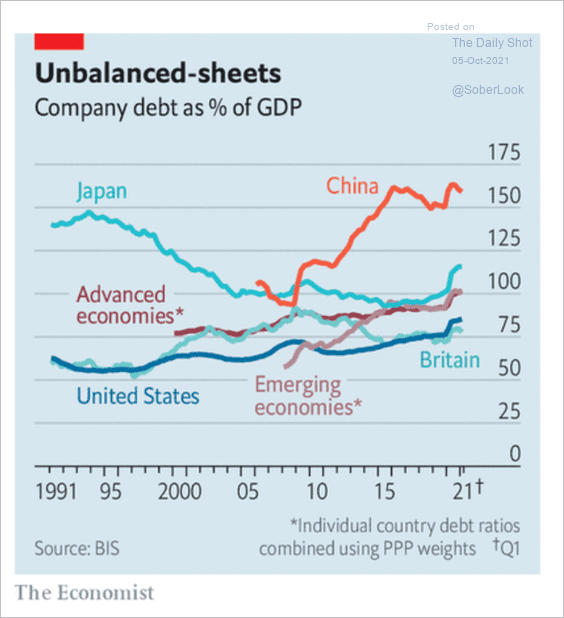 Source: @adam_tooze; The Economist Read full article
Back to Index
Rates
1. Speculative accounts boosted their bets on the 10yr Treasury.
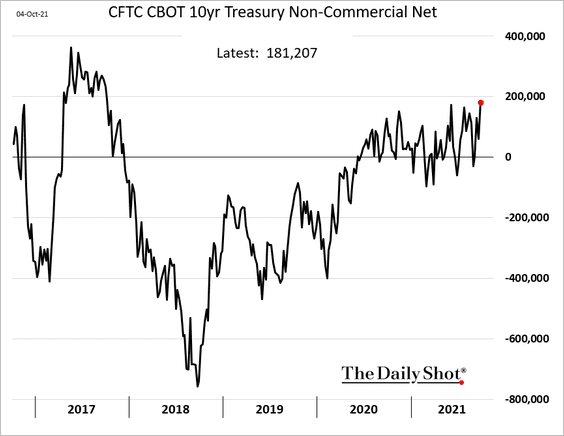
But asset managers are short.
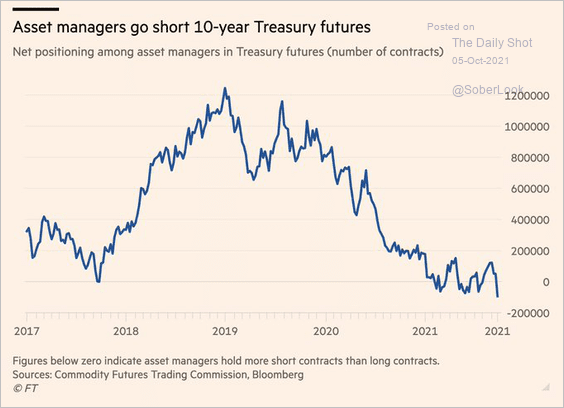 Source: @EricGPlatt, @FT Read full article
——————–
2. The 10-year Treasury futures trading volume spiked over the past month.
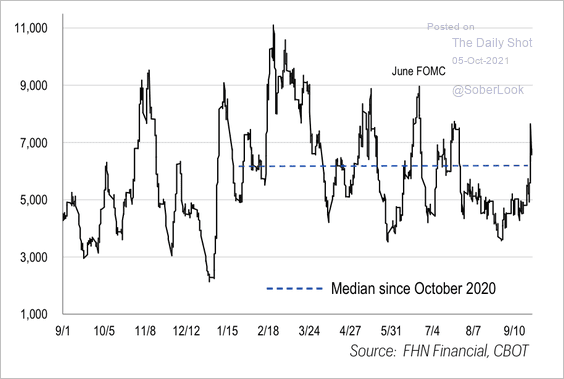 Source: FHN Financial
3. Slowing global economic growth could weigh on yields.
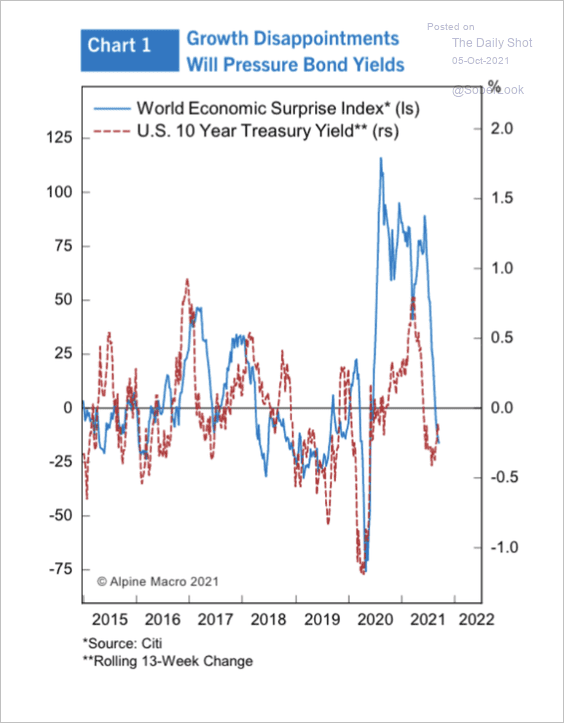 Source: Alpine Macro
Back to Index
Global Developments
1. Let’s start with last month’s performance across asset classes (z-scores).
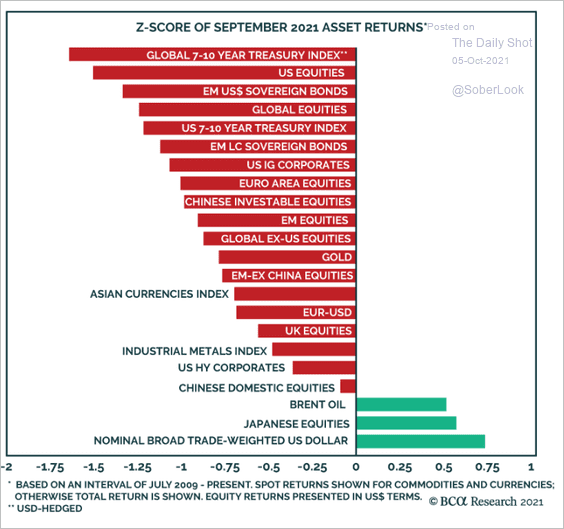 Source: BCA Research
2. The number of central banks hiking rates jumped in September.
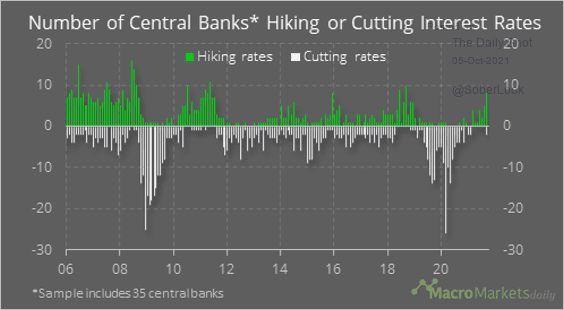 Source: @macro_daily
3. Speculators remain long euro and CAD and short the Aussie and Japanese yen.
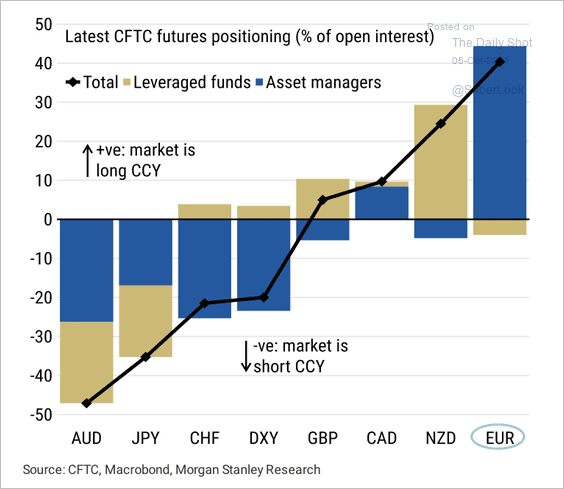 Source: Morgan Stanley Research
——————–
Food for Thought
1. The number of close friendships that Americans have (2021 vs. 1990):
 Source: @axios Read full article
2. US fastest-growing cities:
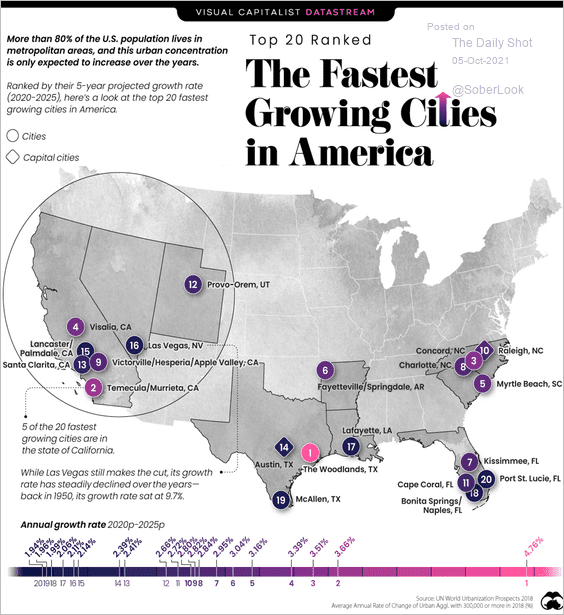 Source: Visual Capitalist Read full article
3. Household income growth by race and ethnicity:
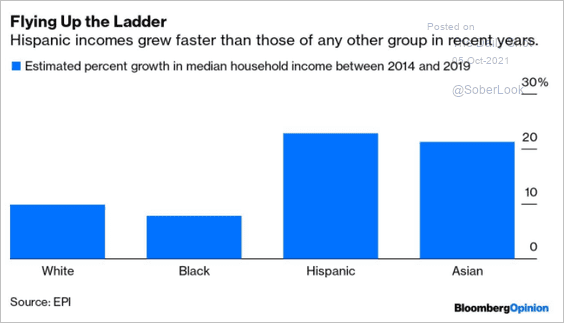 Source: Bloomberg Read full article
4. US number of births per death:
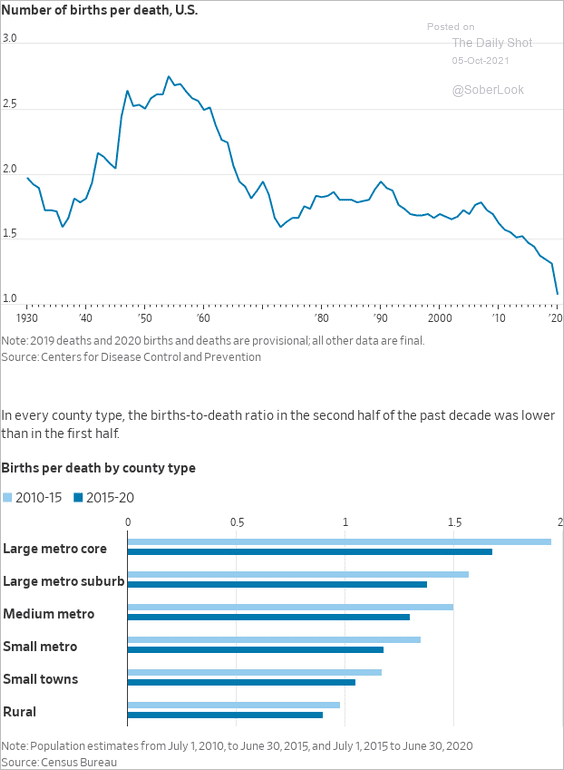 Source: @WSJ Read full article
5. Sporting goods store visits vs. 2019:
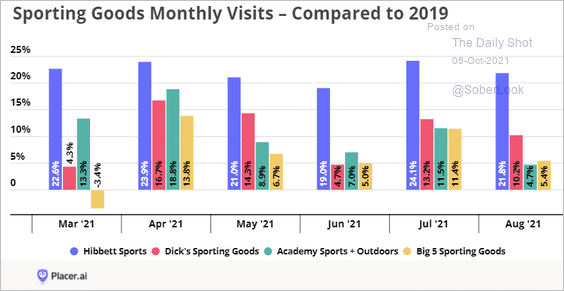 Source: Placer.ai
6. US mortgage originations by age:
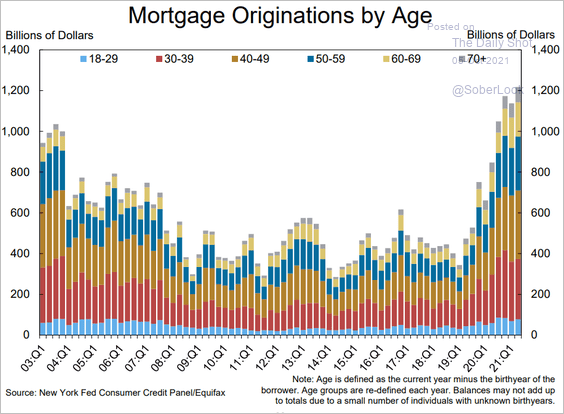 Source: Federal Reserve Bank of New York
7. Enrollment in US veterinary schools by gender:
 Source: AAVMC- American Association of Veterinary Medical Colleges
8. Most common plastic surgeries:
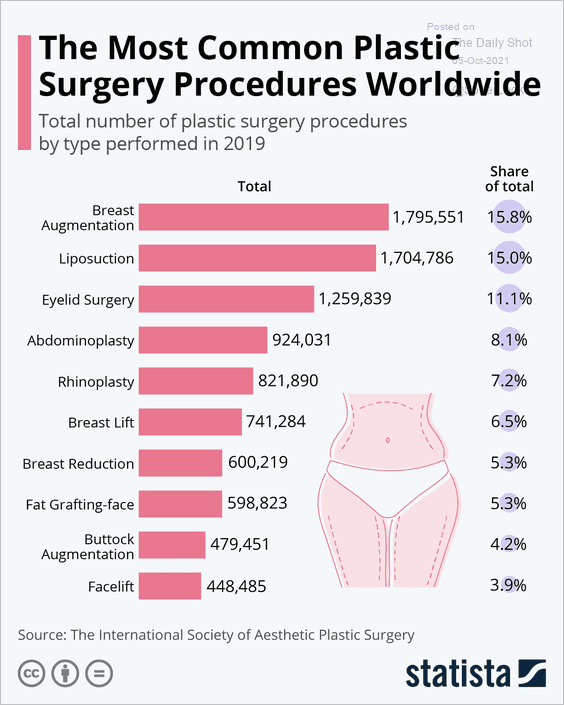 Source: Statista
——————–
Back to Index