
The Daily Shot: 09-Jan-23
• Administrative Update
• The United States
• Canada
• The Eurozone
• Europe
• Asia – Pacific
• China
• Emerging Markets
• Cryptocurrency
• Commodities
• Equities
• Credit
• Rates
• Global Developments
• Food for Thought
Administrative Update
The Daily Shot will not be published on Monday, January 16th.
Back to Index
The United States
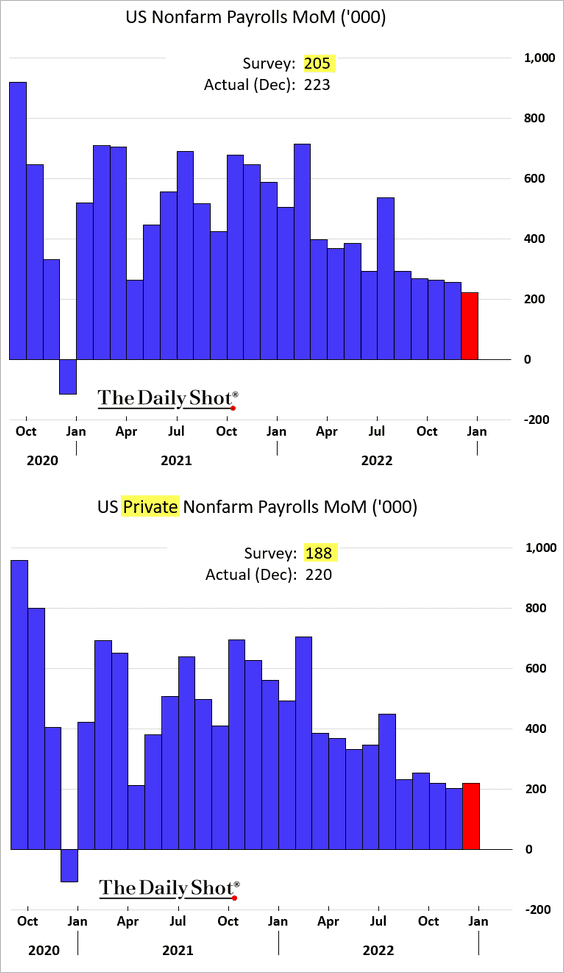
1. The December jobs report topped expectations, signaling persistent strength in the labor market. Gains in private payrolls exceeded the November figure (2nd panel), …
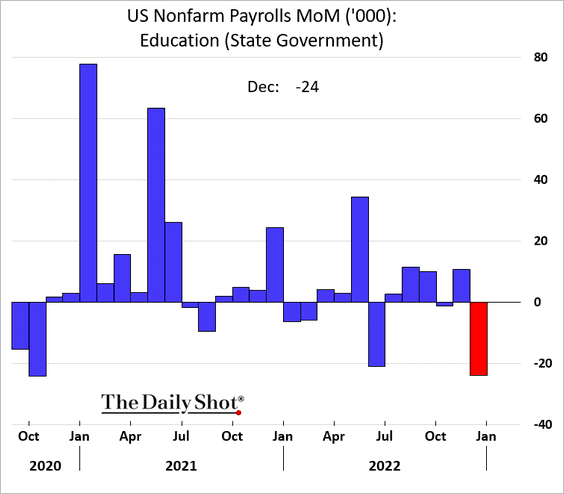
… with state government jobs (mostly teachers) dragging the headline payrolls figure lower.
Here are the contributions.
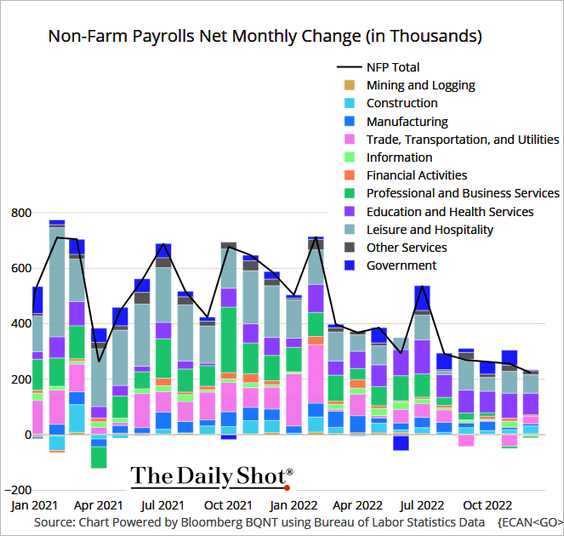 Source: @TheTerminal, Bloomberg Finance L.P.
• The jobs report kept surprising to the upside for much of 2022.
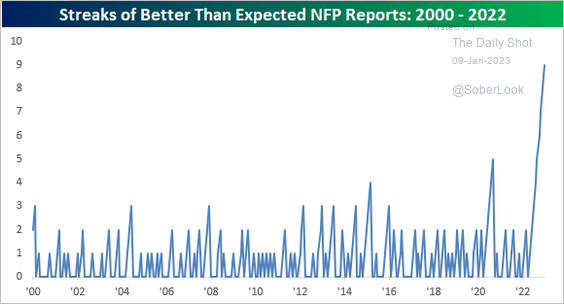 Source: @bespokeinvest Read full article
• Some 4.5 million jobs were created last year.
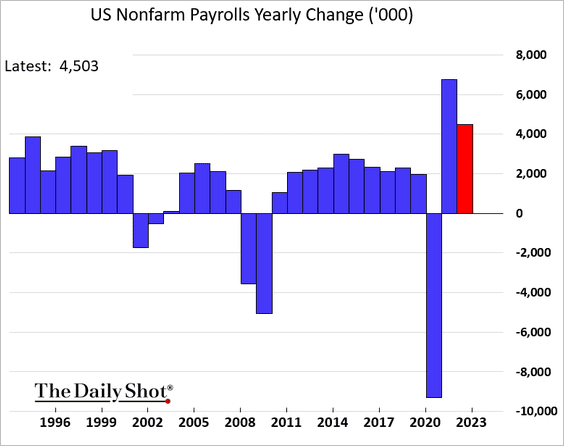
However, the three-year rolling average of payroll growth (covering the entire COVID-influenced period) is still relatively low (blue line below).
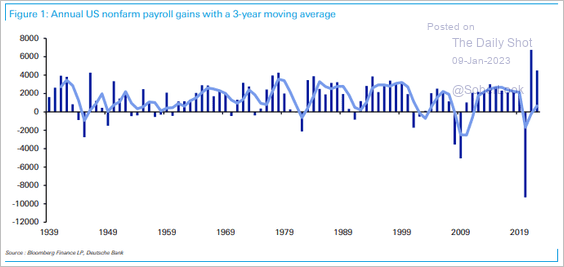 Source: Deutsche Bank Research
• Here are the payrolls changes by sector since February 2020.
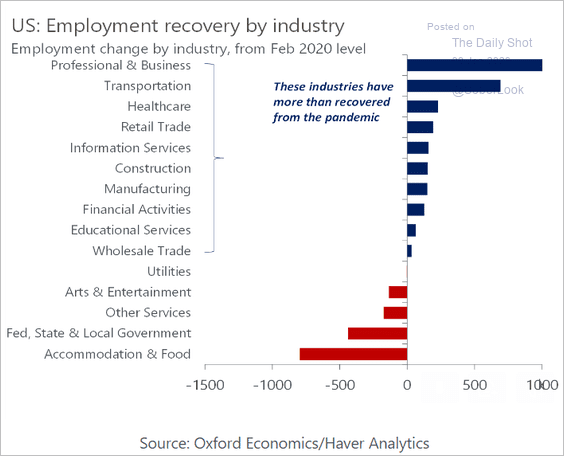 Source: Oxford Economics
The physically demanding industries are still missing a lot of workers.
 Source: BlackRock Investment Institute
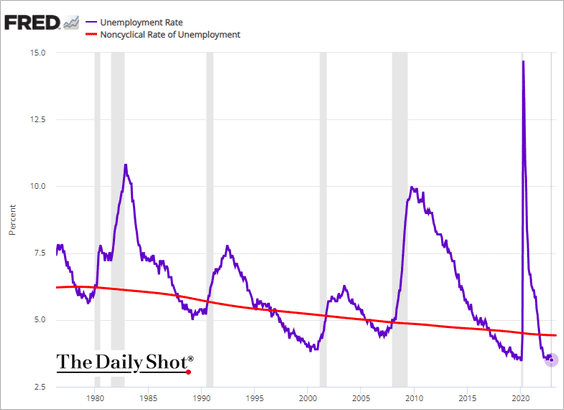
• The unemployment rate dropped to 3.5%, …
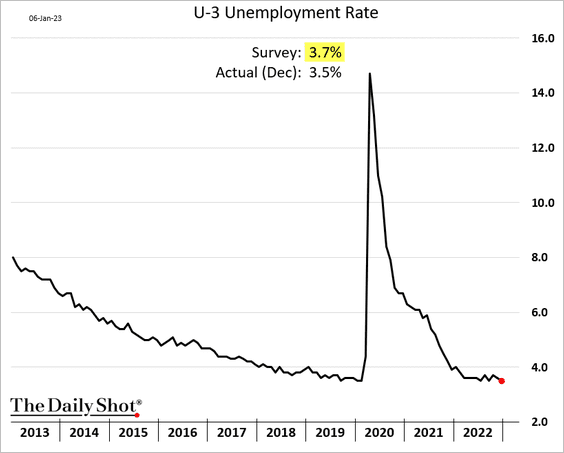
… running well below the natural rate of unemployment.
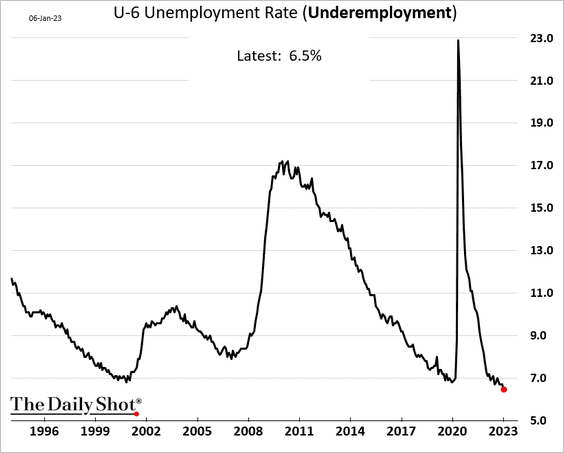
• Underemployment hit a multi-decade low.
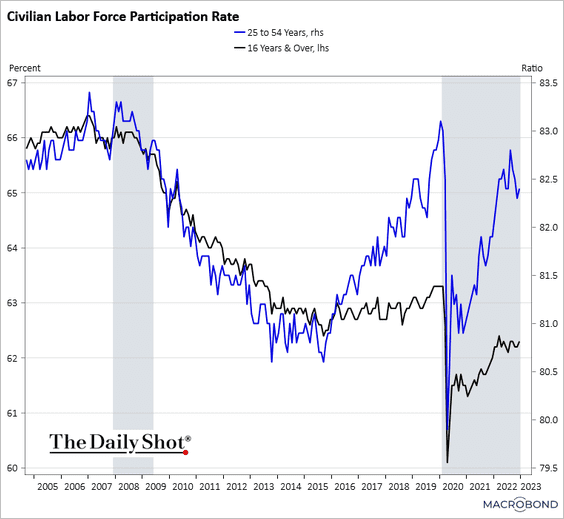
• Labor force participation edged higher but remains well below pre-COVID levels.
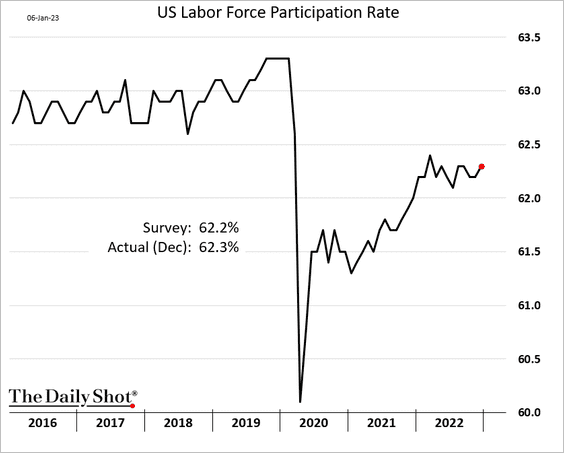
This chart shows the prime-age participation rate (blue).
 Source: Chart and data provided by Macrobond
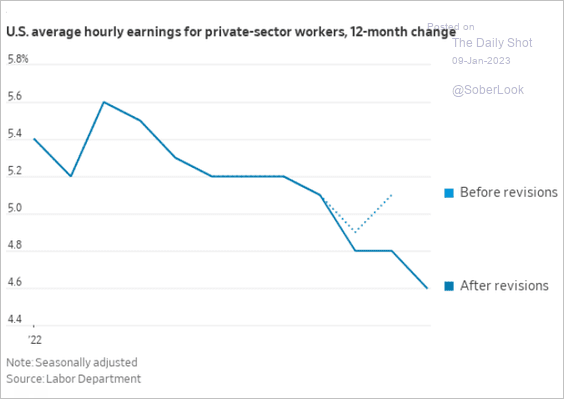
• Wage growth surprised to the downside, boosting hopes for slower inflation ahead.
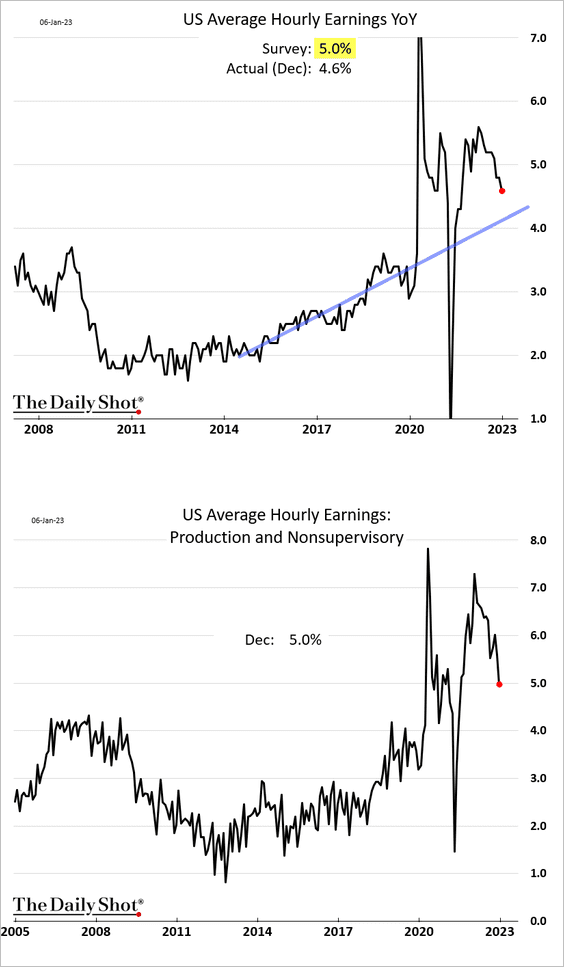
The November wage figures were revised lower.
 Source: @WSJ Read full article
• There were some red flags in the employment report.
– Workers’ weekly hours declined further.
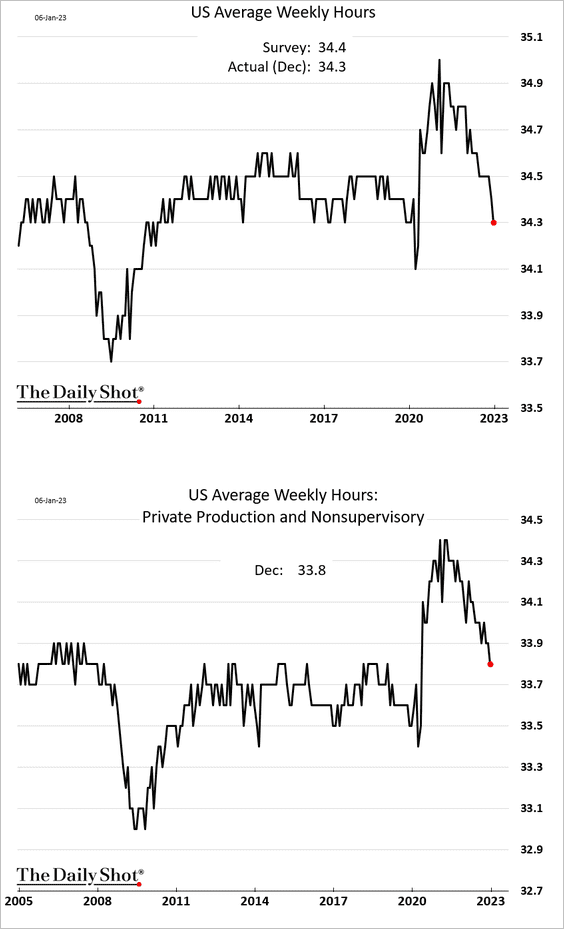
The second panel below shows overtime hours in manufacturing.
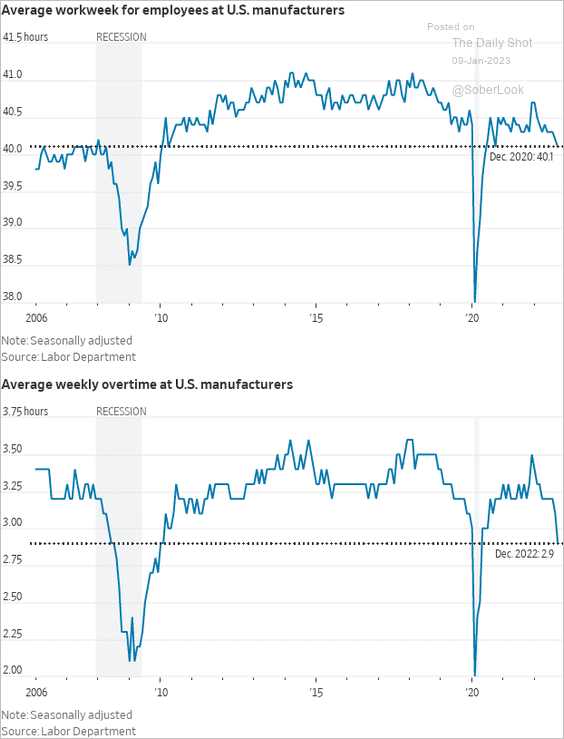 Source: @WSJ Read full article
– Temp help jobs declined again, …
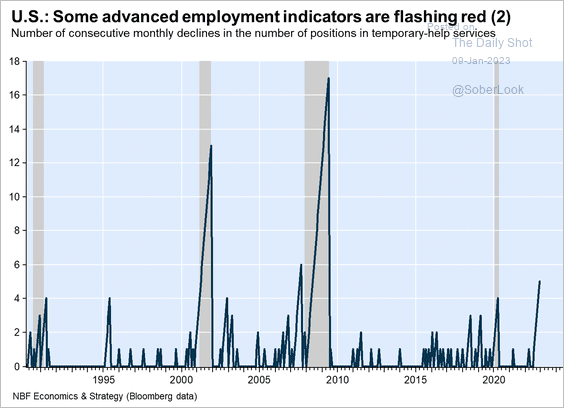 Source: Economics and Strategy Group, National Bank of Canada
… which signals softer total payroll gains ahead.
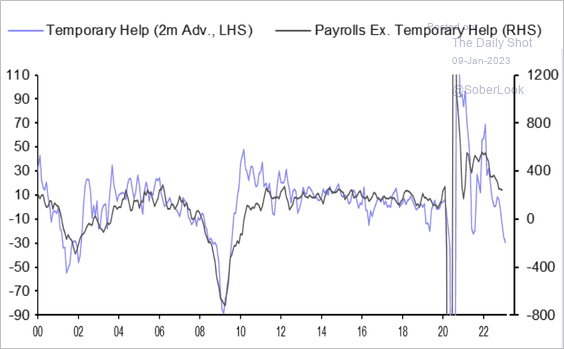 Source: Capital Economics
We will have more data on the labor market later this week.
——————–
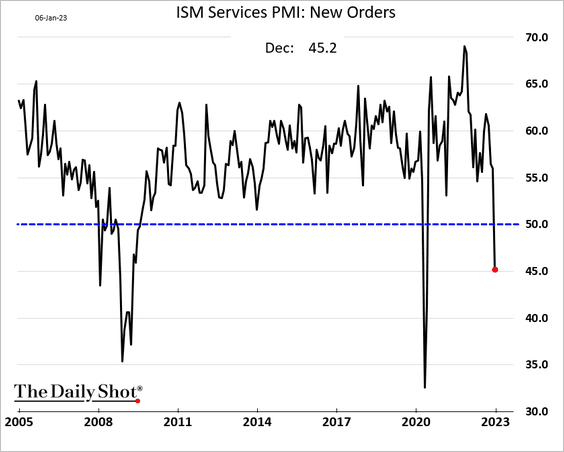
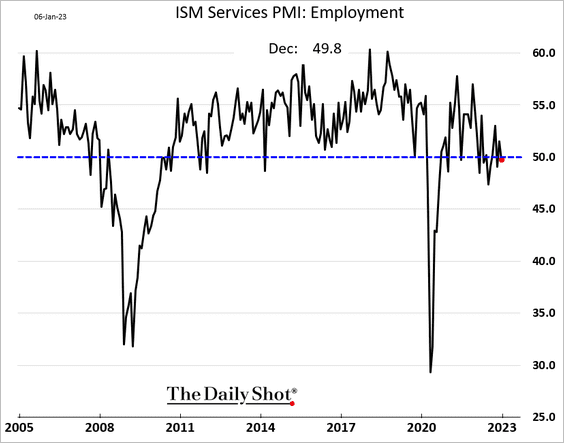
2. The ISM Services PMI declined sharply, unexpectedly registering a contraction in December (PMI < 50).
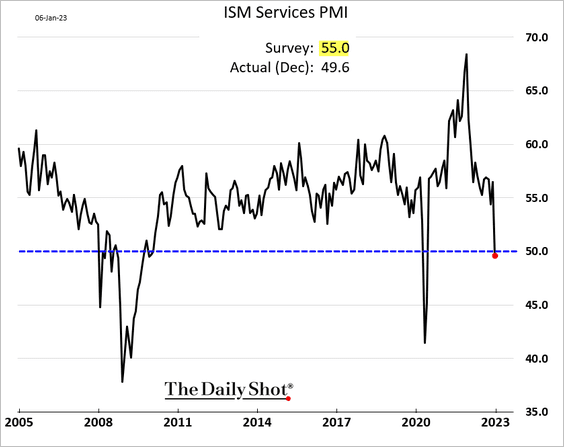
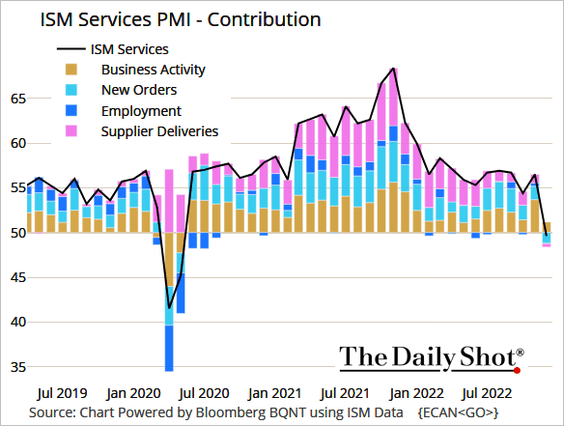 Source: @TheTerminal, Bloomberg Finance L.P.
The ISM PMI is now in line with the S&P Global US Services PMI.
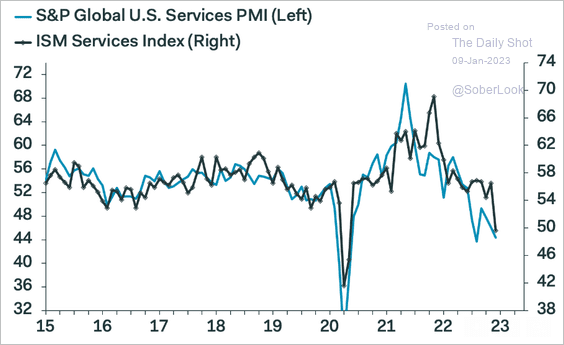 Source: Pantheon Macroeconomics
• Demand is crashing.
• The PMI report showed service-sector hiring stalling, but there is no indication of significant job losses.
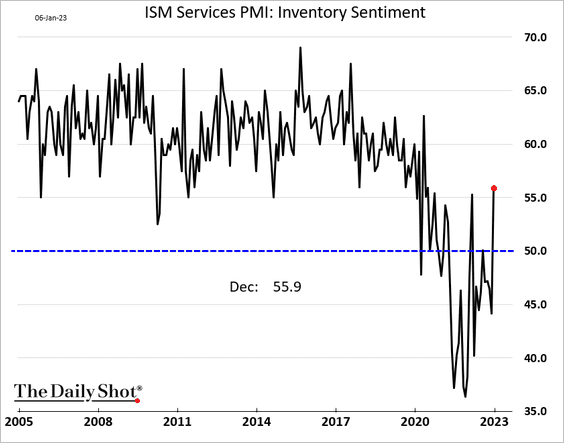
• Businesses now see inventories as being too high.
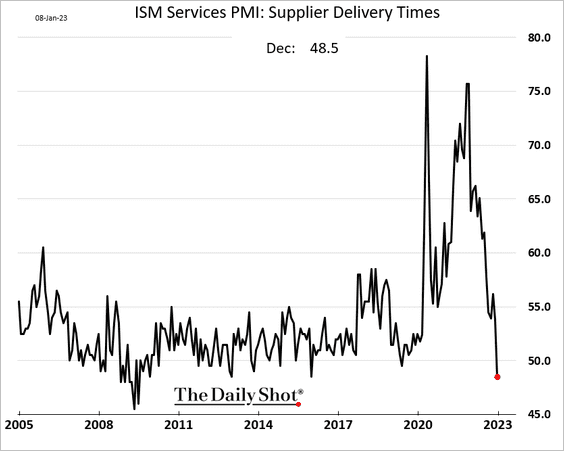
• Supplier delivery times are shrinking.
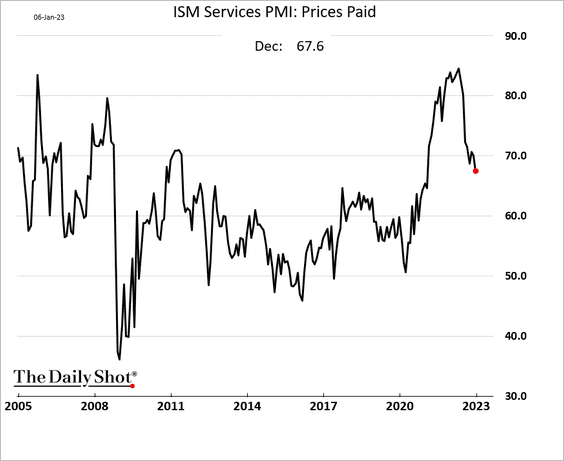
• Price pressures are moderating.
——————–
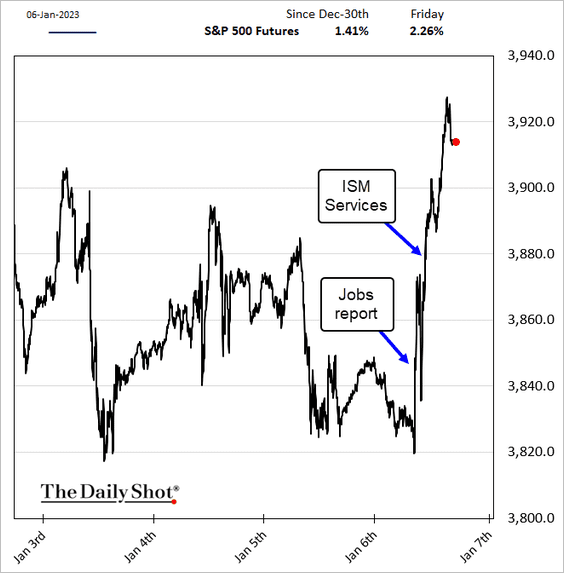
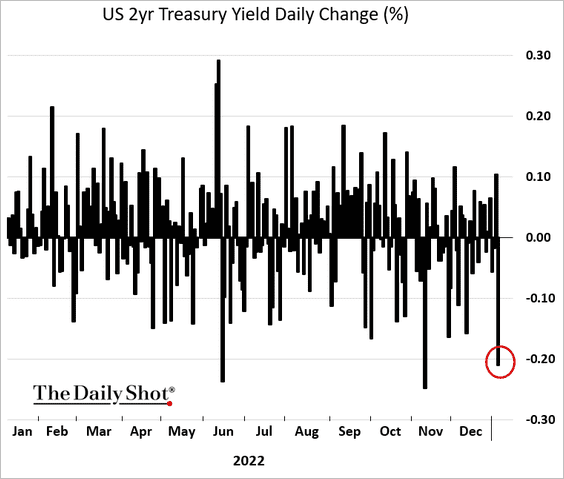
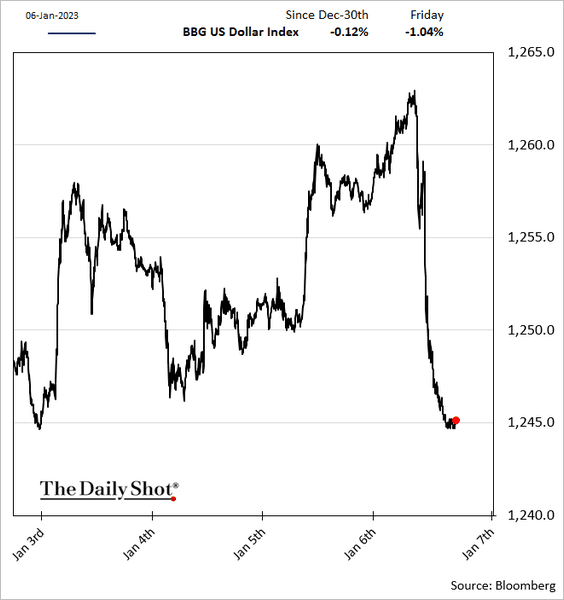
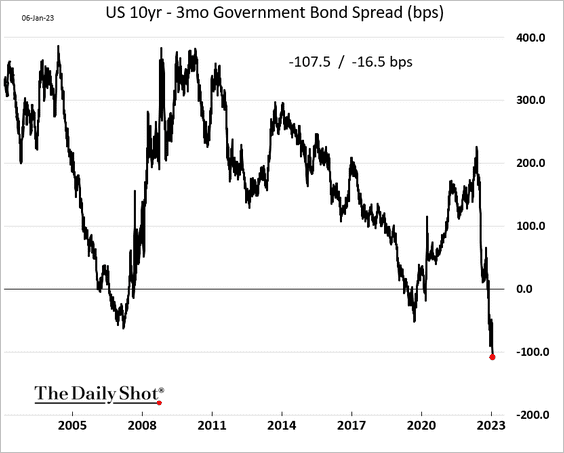
3. Stocks surged as the payrolls data and the ISM report showed signs of easing inflation.
• Treasury yields dropped sharply, …
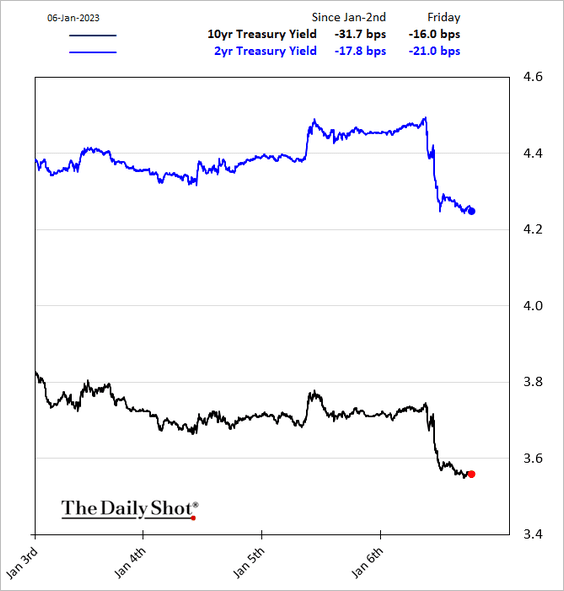
• … and so did the US dollar.
• The 10-year – 3-month Treasury curve inversion exceeded 100 bps.
• The market increasingly expects the February Fed rate hike to be 25 bps rather than 50 bps. Much will depend on the December CPI report.
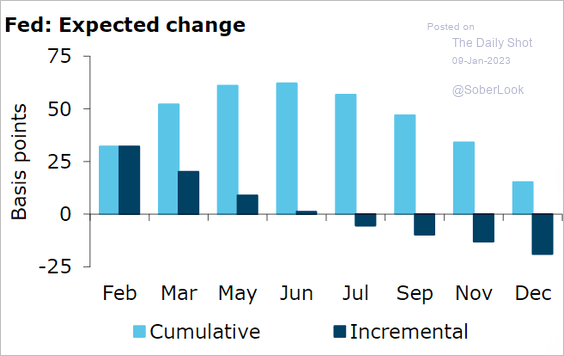 Source: @ANZ_Research
Back to Index
Canada
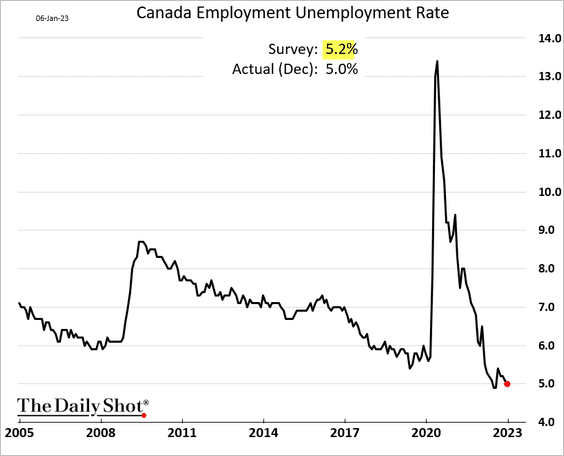
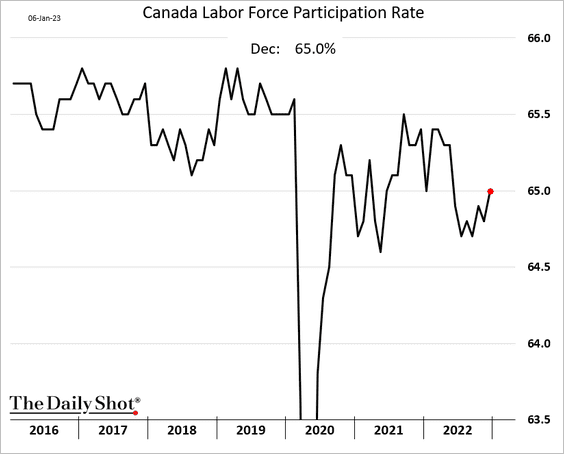
1. The jobs report was very strong, suggesting that more BoC rate hikes are coming.
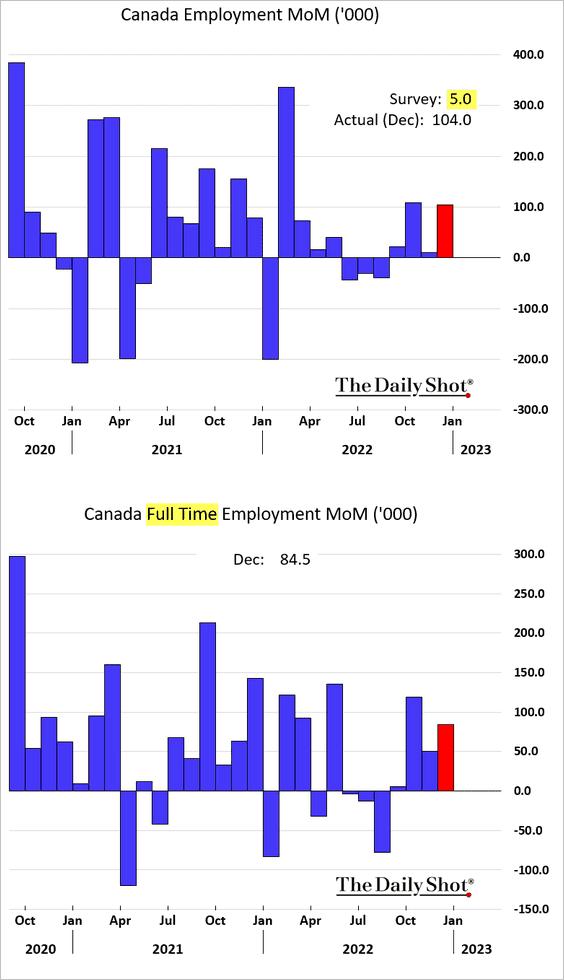
• The unemployment rate is back at 5%.
• Labor force participation improved.
By the way, here is a comparison with the US.
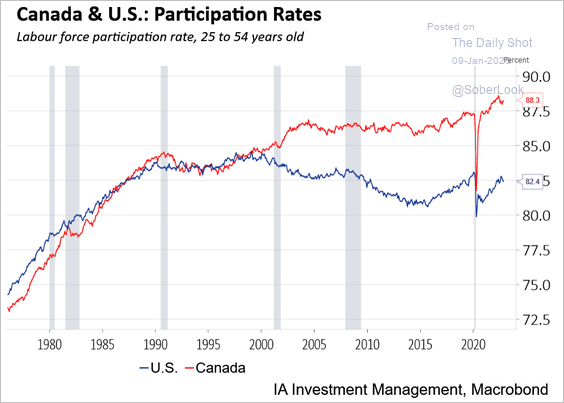 Source: Industrial Alliance Investment Management
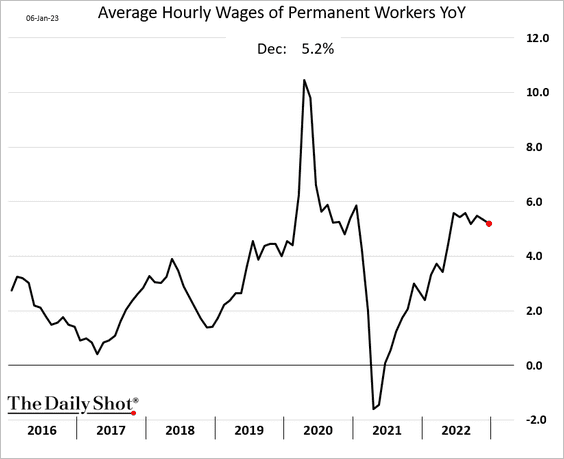
• Wage growth edged lower.
——————–
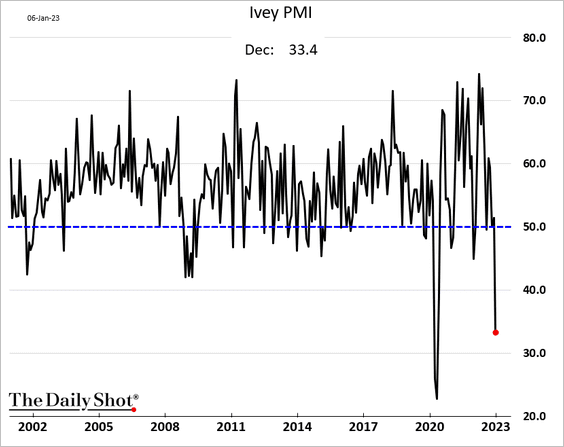
2. The Ivey PMI crashed in December, indicating softer economic activity.
3. Speculative accounts remain net short the Canadian dollar.
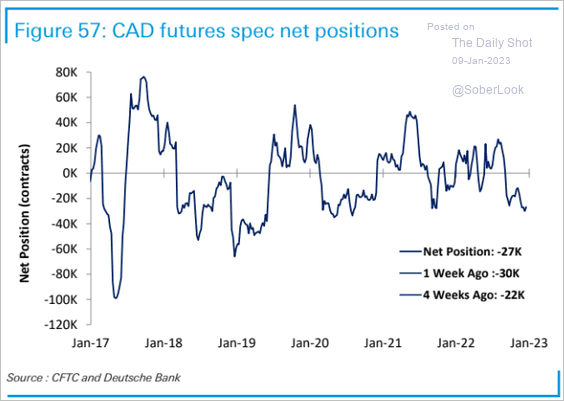 Source: Deutsche Bank Research
4. Next, let’s take a look at cumulative fund flows into Canadian equities.
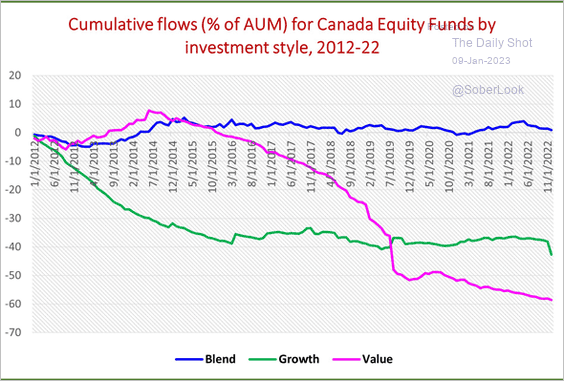 Source: EPFR
Back to Index
The Eurozone
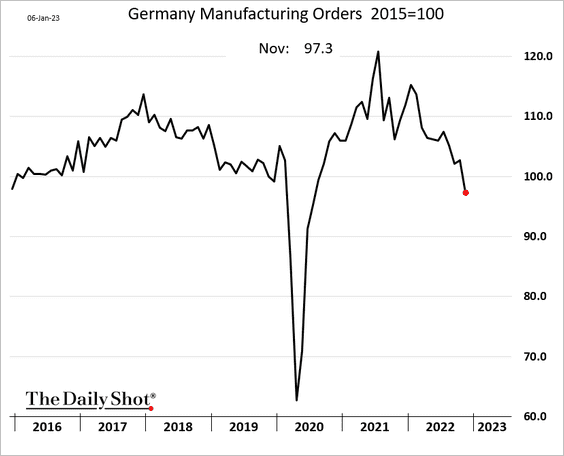
1. German factory orders continued to tank in November.
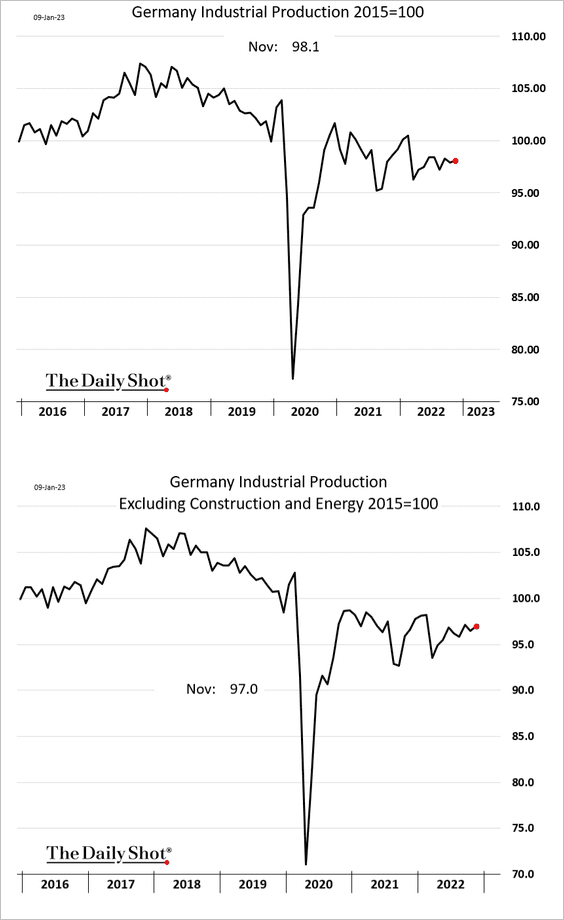
But industrial production is holding up well.
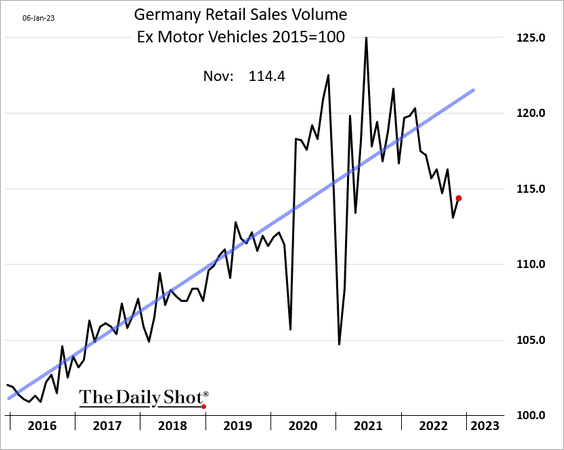
Retail sales improved in November.
——————–
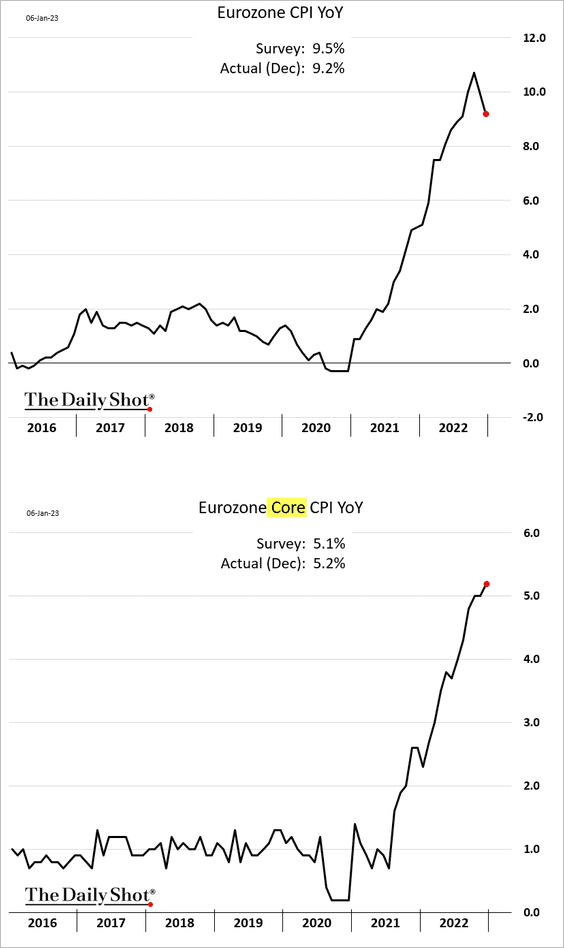
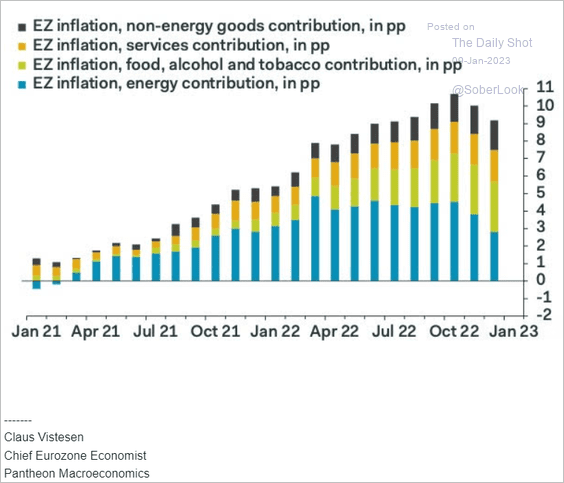
2. Euro-area inflation dropped more than expected last month. But the core CPI (2nd panel) continued to climb.
• Below are the contributions to the headline CPI.
 Source: Pantheon Macroeconomics
• And here are two CPI forecasts.
– Nordea:
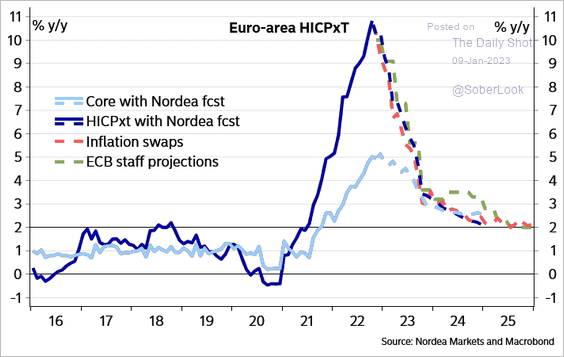 Source: Nordea Markets
– Capital Economics:
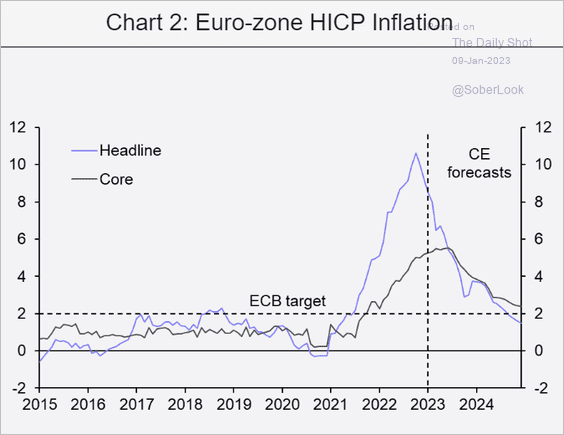 Source: Capital Economics
——————–
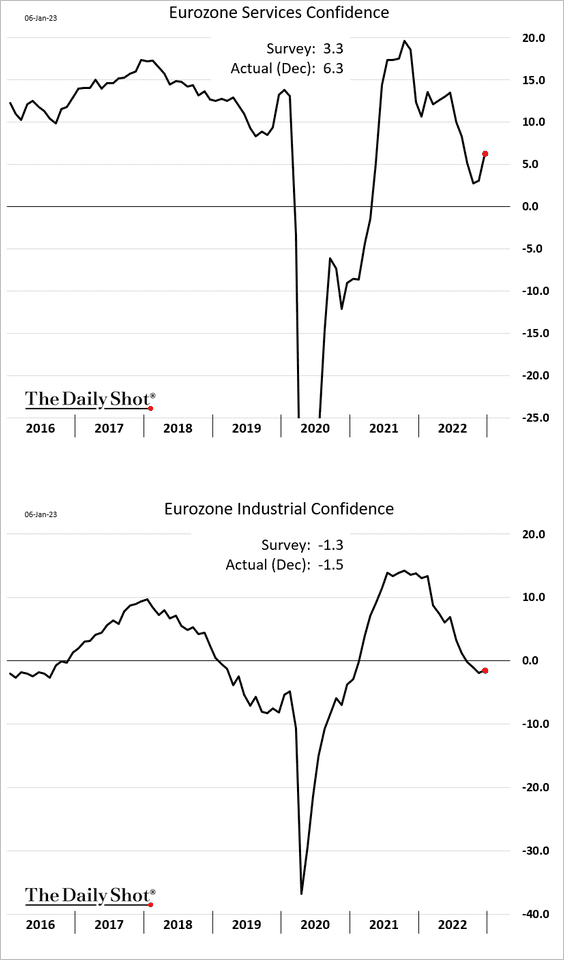
3. Business confidence edged higher in December, with industrial sentiment lagging behind services.
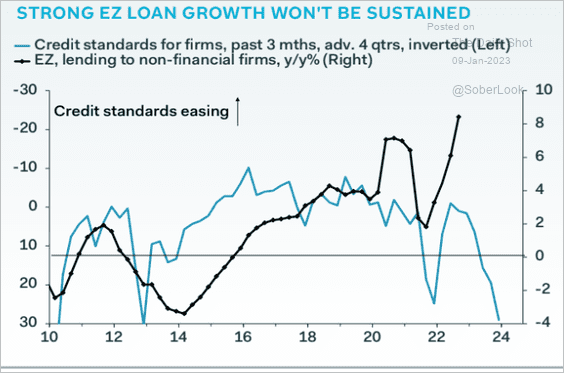
4. Loan growth is expected to slow, according to Pantheon Macroeconomics.
 Source: Pantheon Macroeconomics
Back to Index
Europe
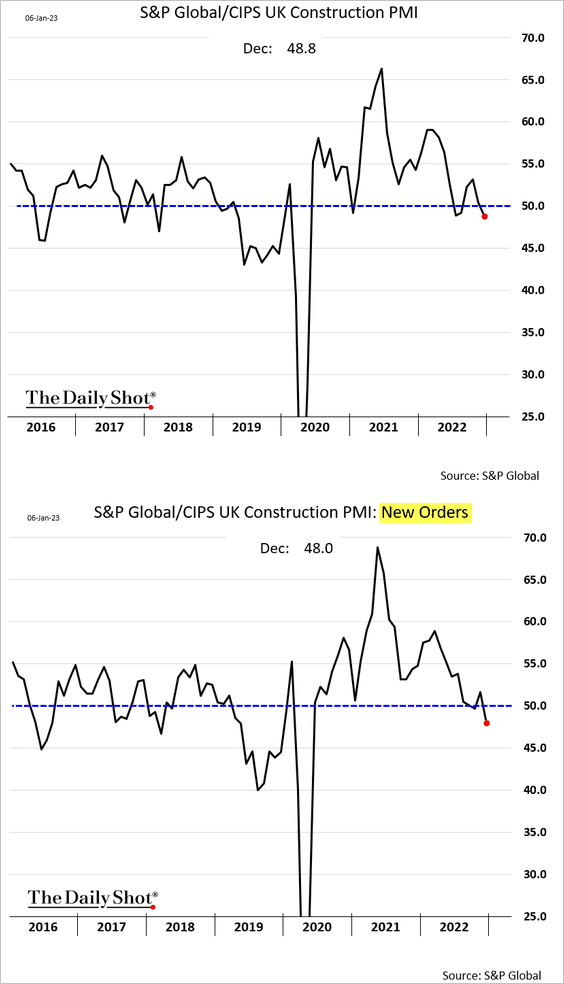
1. UK construction activity declined in December as demand softened.
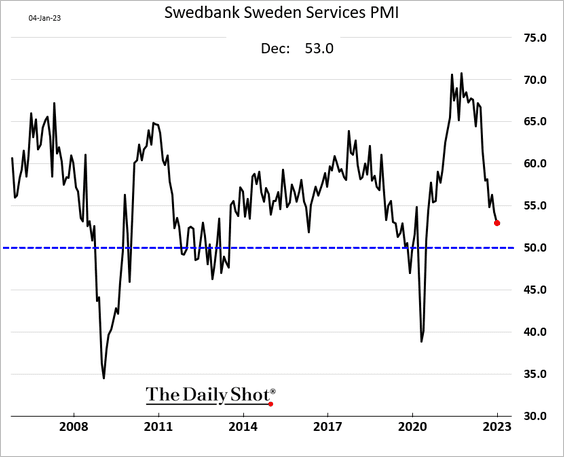
2. Sweden’s service companies are still reporting growth, but the pace has slowed.
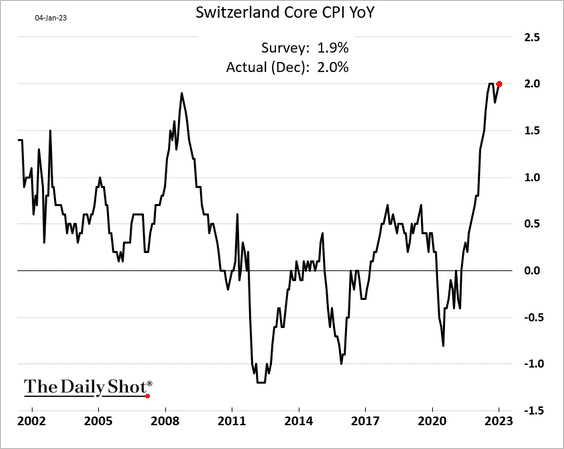
3. Switzerland’s core CPI is back at 2%.
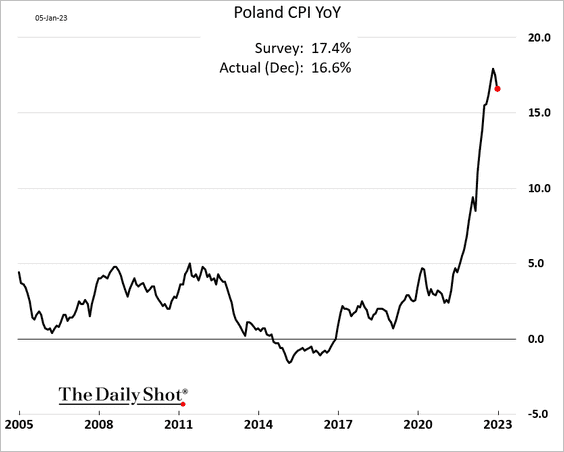
4. Poland’s inflation has finally peaked.
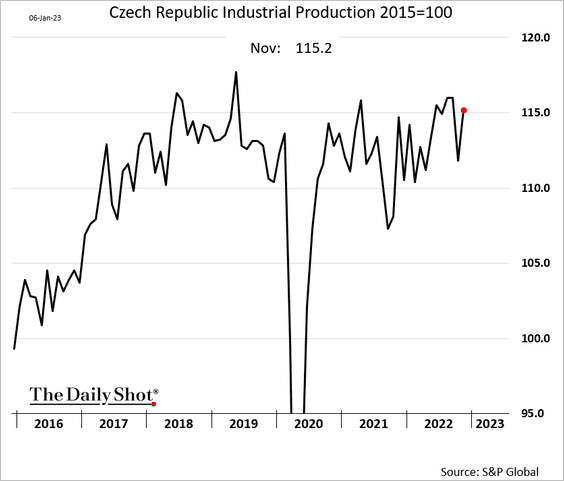
5. Czech industrial production is holding up well despite weak PMI data.
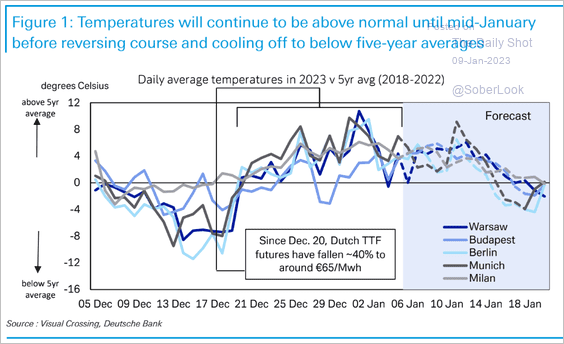
6. Temperatures are expected to dip below average next week, boosting demand for natural gas.
 Source: Deutsche Bank Research
7. European stocks have been outperforming the US.
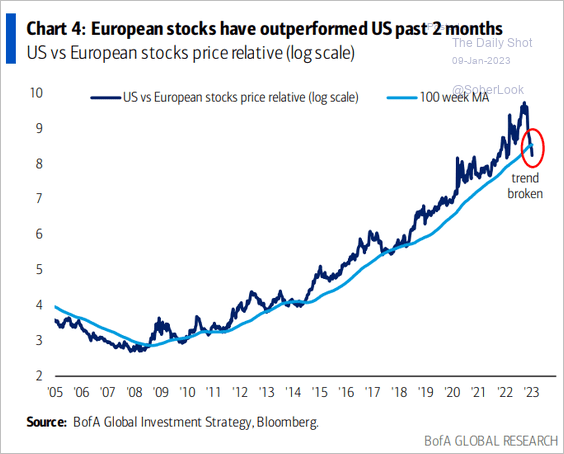 Source: BofA Global Research
Back to Index
Asia – Pacific
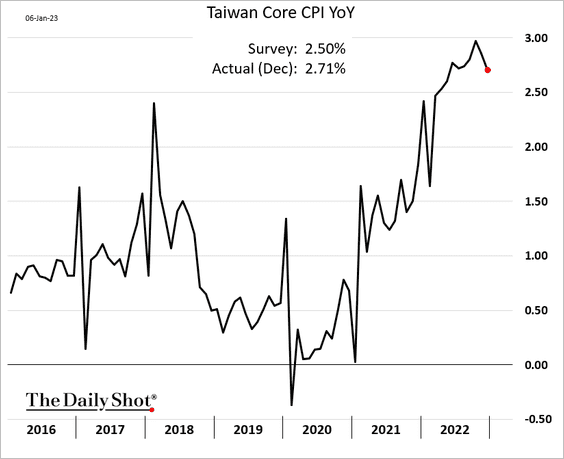
1. Taiwan’s core CPI topped expectations.
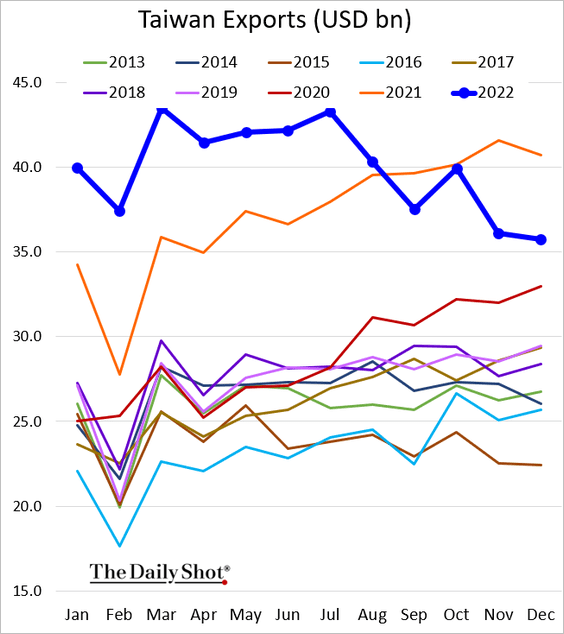
• Taiwan’s exports have been slowing but remain well above pre-COVID levels.
• Taiwan is very exposed to a China recovery.
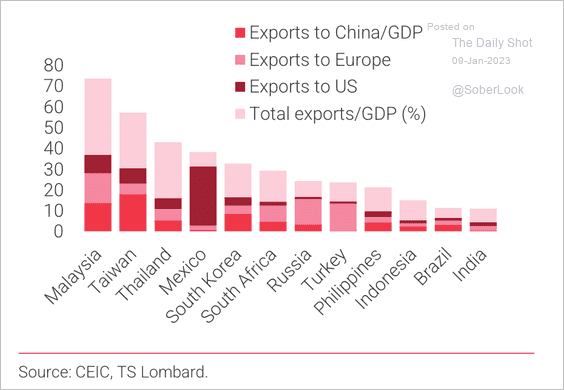 Source: TS Lombard
• Taiwan and South Korea equity outflows are bottoming out.
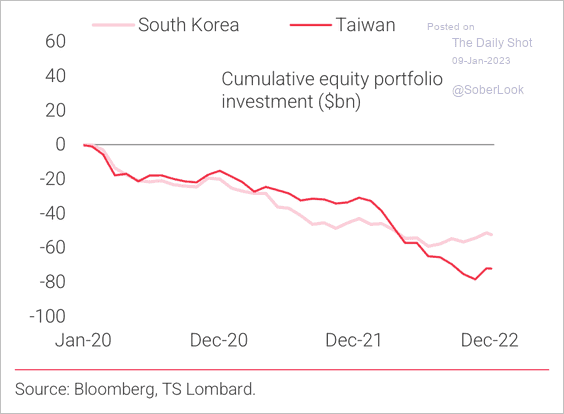 Source: TS Lombard
——————–
2. Australia’s residential building approvals hit a multi-year low (for this time of the year).
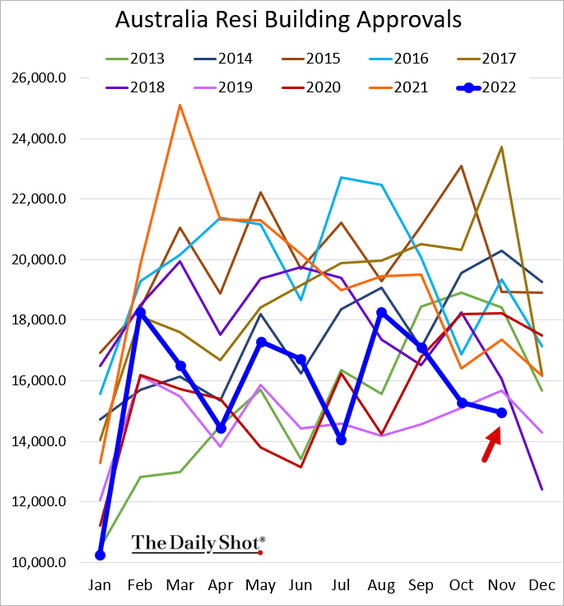
 Source: RTT News Read full article
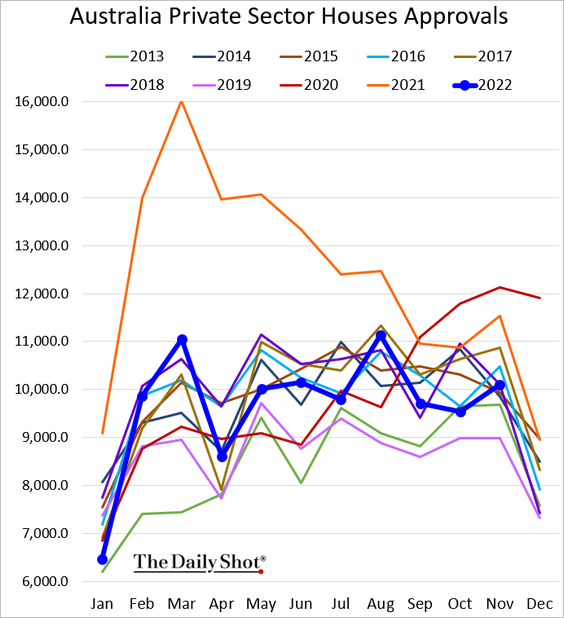
But approvals for private houses are holding up.
Back to Index
China
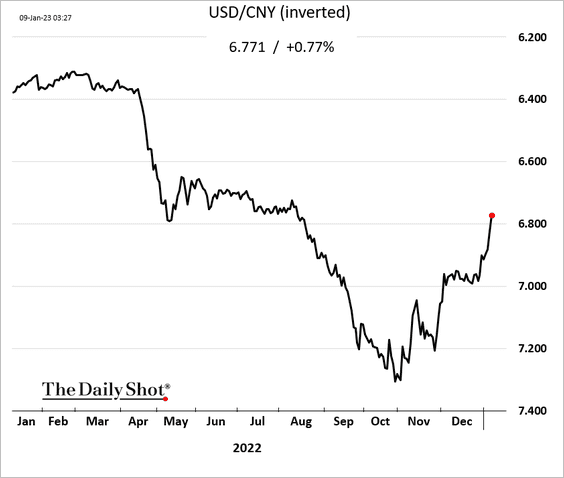
1. The renminbi continues to rally as reopening progresses.
Mobility indicators are showing improvement (2 charts).
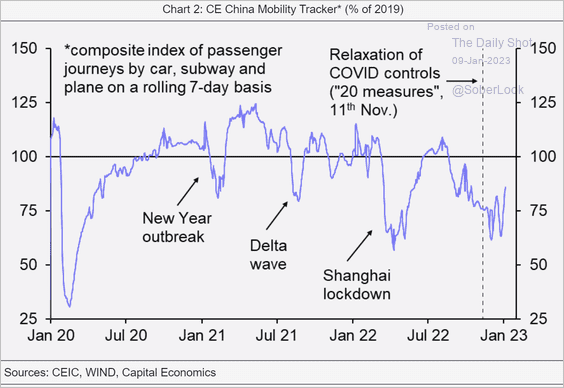 Source: Capital Economics
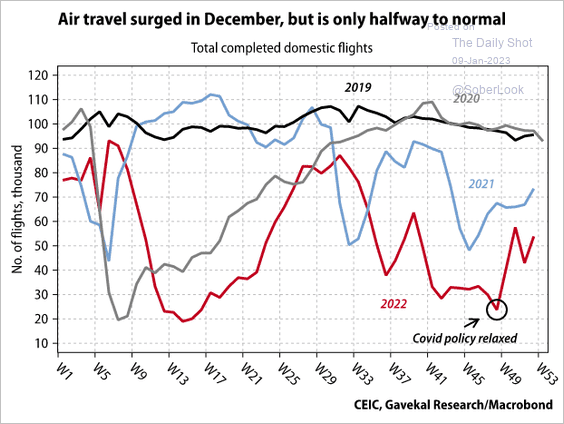 Source: Gavekal Research
——————–
2. Will we see improvements in supply chain pressures?
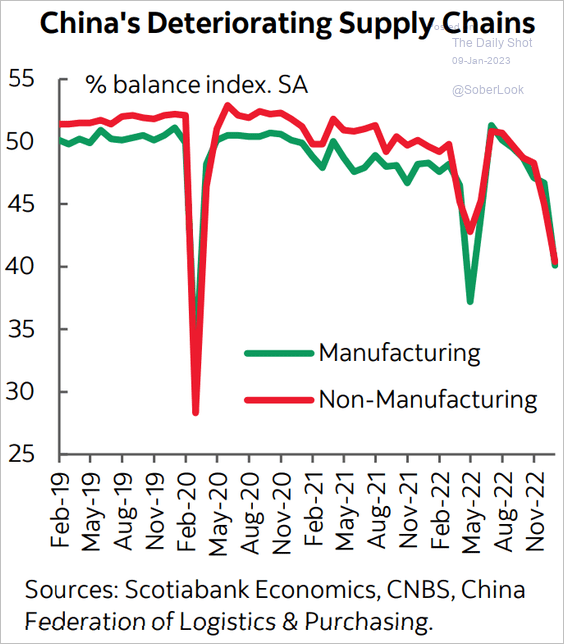 Source: Scotiabank Economics
3. Chinese A-shares are attractively valued relative to history, while investable/offshore stocks are not particularly cheap.
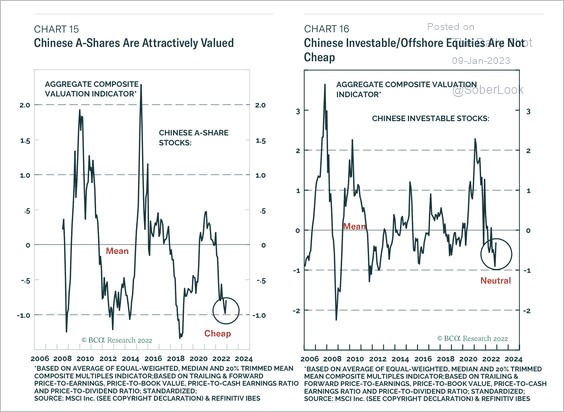 Source: BCA Research
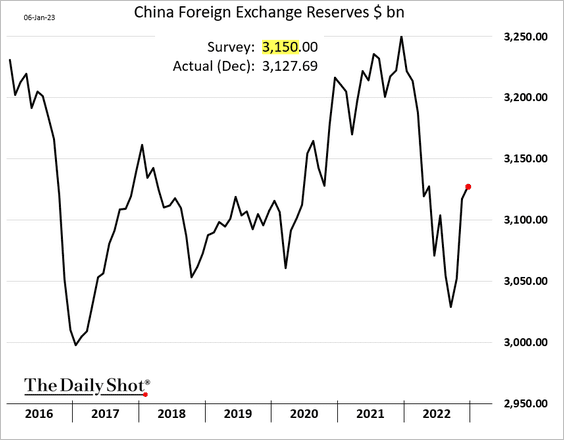
4. China’s FX reserves increased less than expected last month.
Back to Index
Emerging Markets
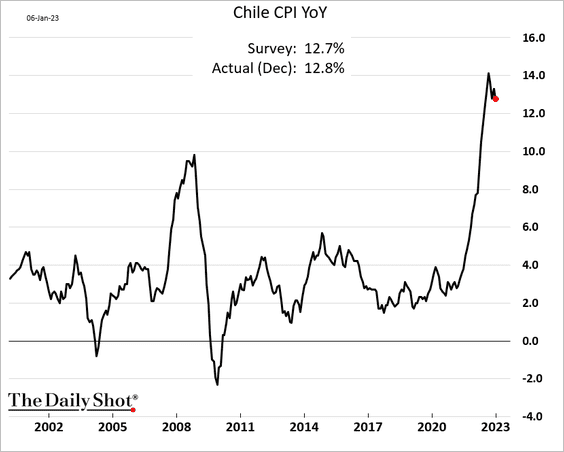
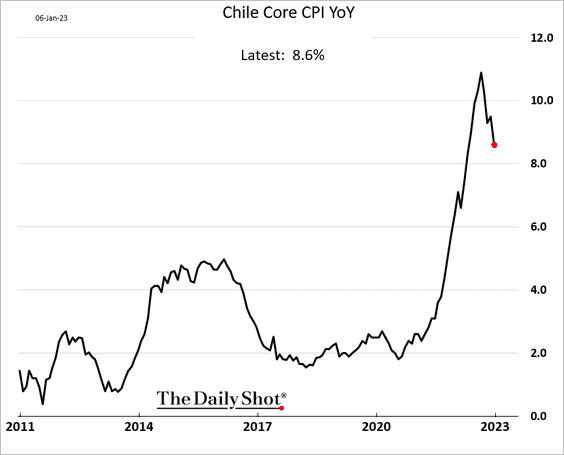
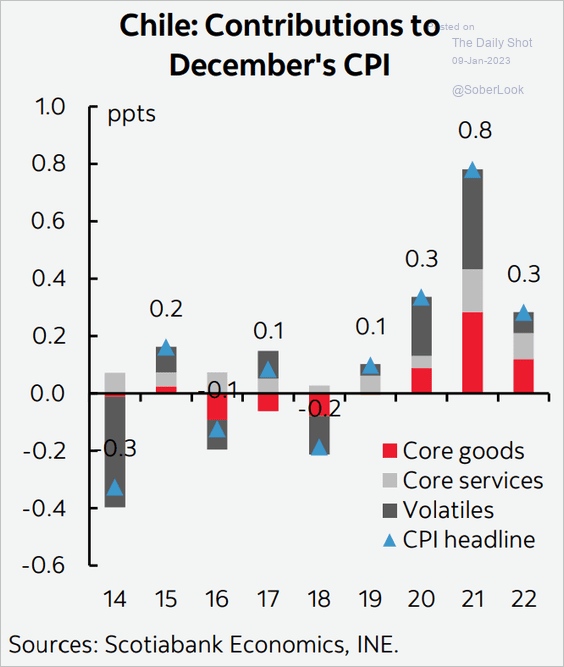
1. Chile’s CPI has peaked.
Here are the monthly contributions.
 Source: Scotiabank Economics
——————–
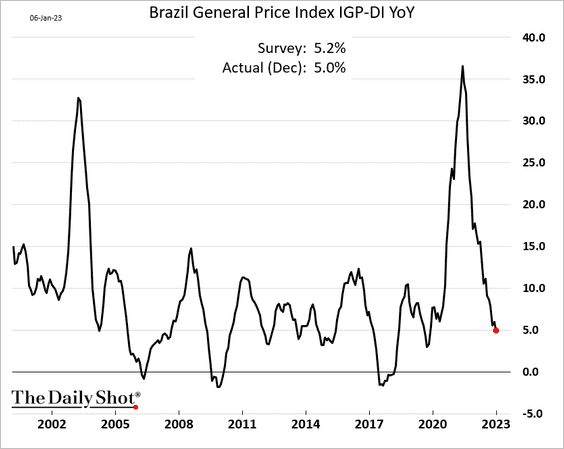
2. Brazil’s inflation continues to ease.
On a separate note, Bolsonaro’s backers did some damage over the weekend …
 Source: Reuters Read full article
——————–
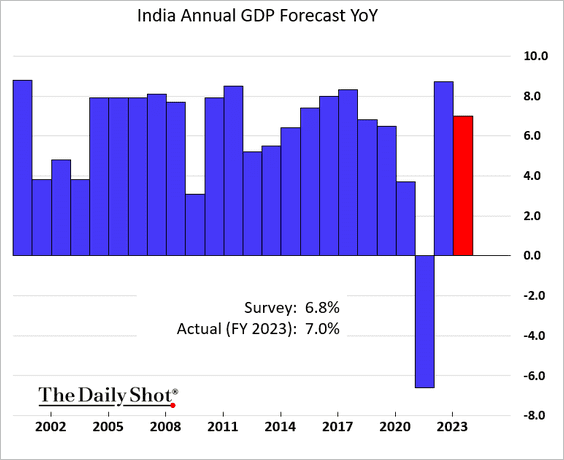
3. India is forecasting a 7% GDP growth in 2023.
 Source: @anuproy05, @29_ruchibhatia, @economics Read full article
——————–
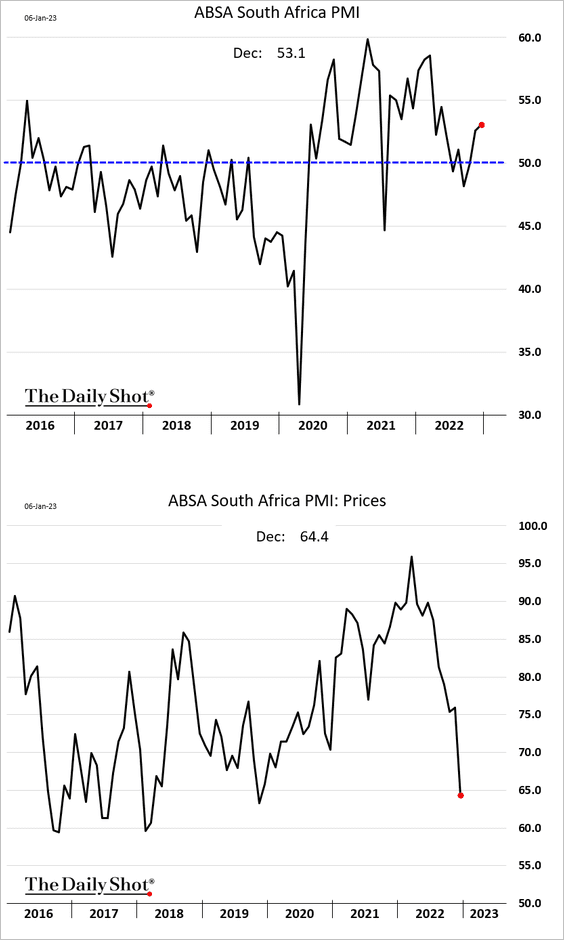
4. South Africa’s business activity improved further last month as price pressures eased.
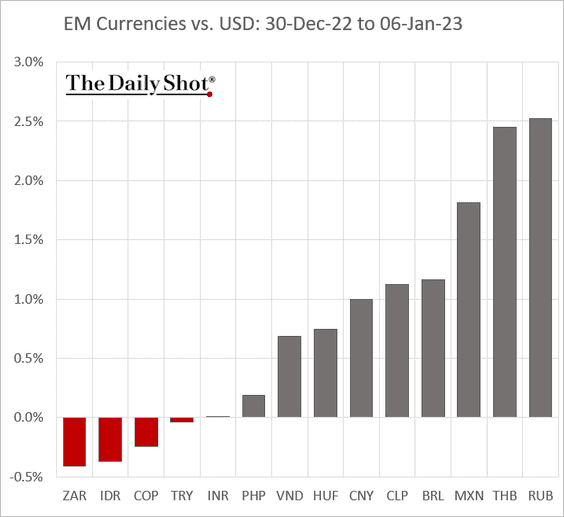
5. Finally, we have some performance data from last week.
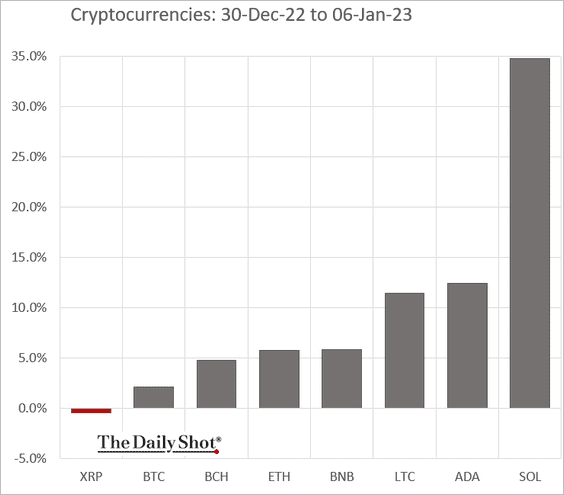
• Currencies:
• Bond yields:
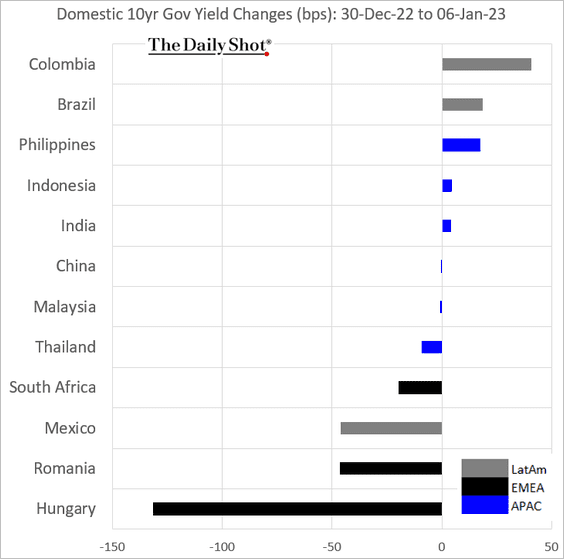
• Equity ETFs:
Back to Index
Cryptocurrency
1. SOL bounced last week after a massive drop in 2022.
2. December was historically quiet for bitcoin and ether in terms of realized volatility. (2 charts)
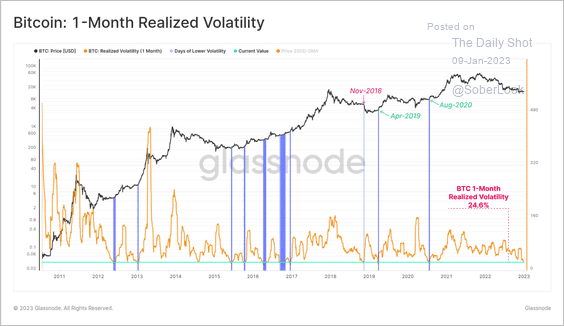 Source: @glassnode
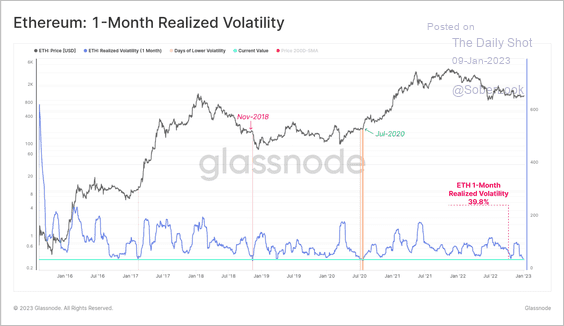 Source: @glassnode
——————–
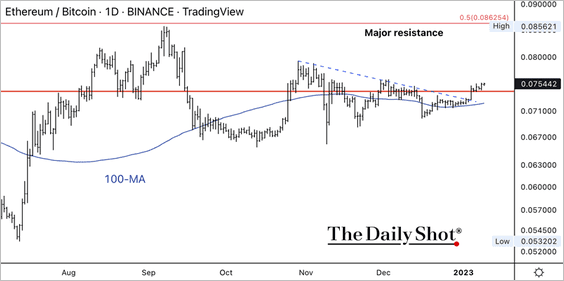
3. The ETH/BTC price ratio improved over the past week but faces strong resistance ahead.
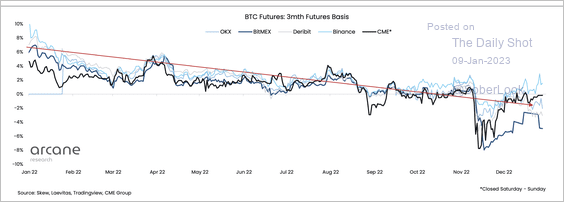
4. BTC futures are trading at substantial discounts to spot as bearish sentiment prevailed.
 Source: @ArcaneResearch
Back to Index
Commodities
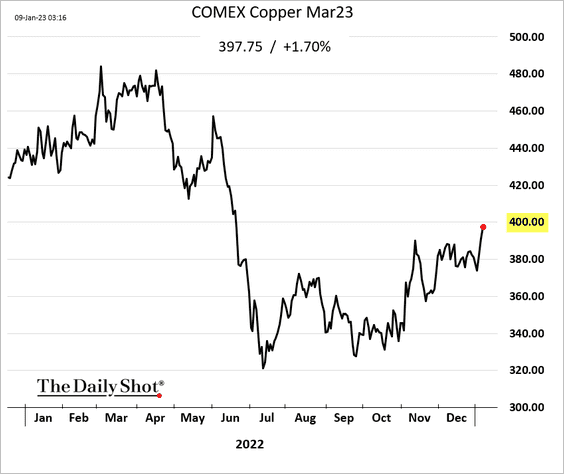
1. Copper is rallying amid China’s reopening and a softer US dollar.
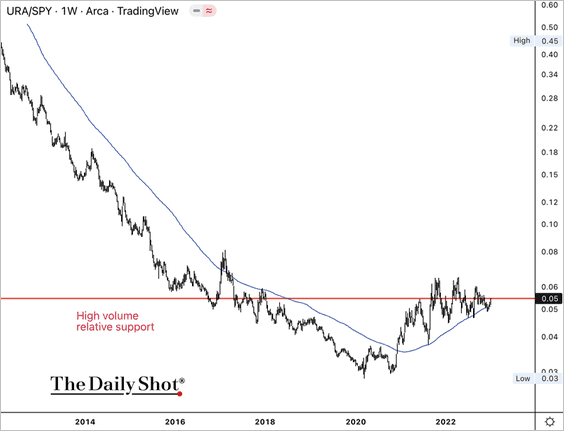
2. The Global X Uranium ETF (URA) is testing its 200-day moving average.
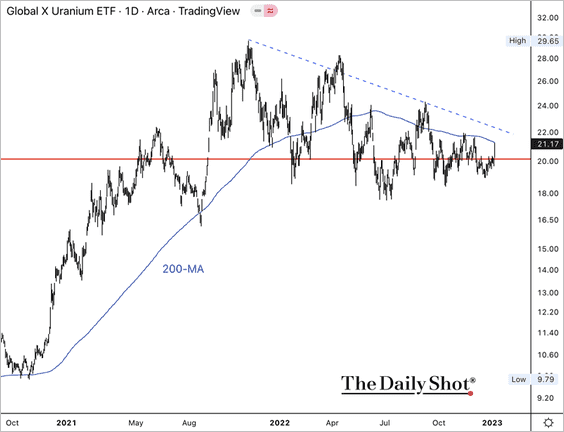
URA is holding support relative to the S&P 500.
——————–
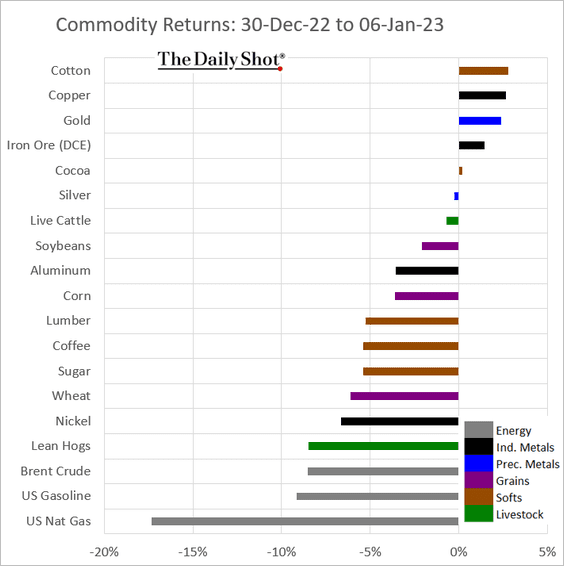
3. Here is last week’s performance across key commodity markets.
Back to Index
Equities
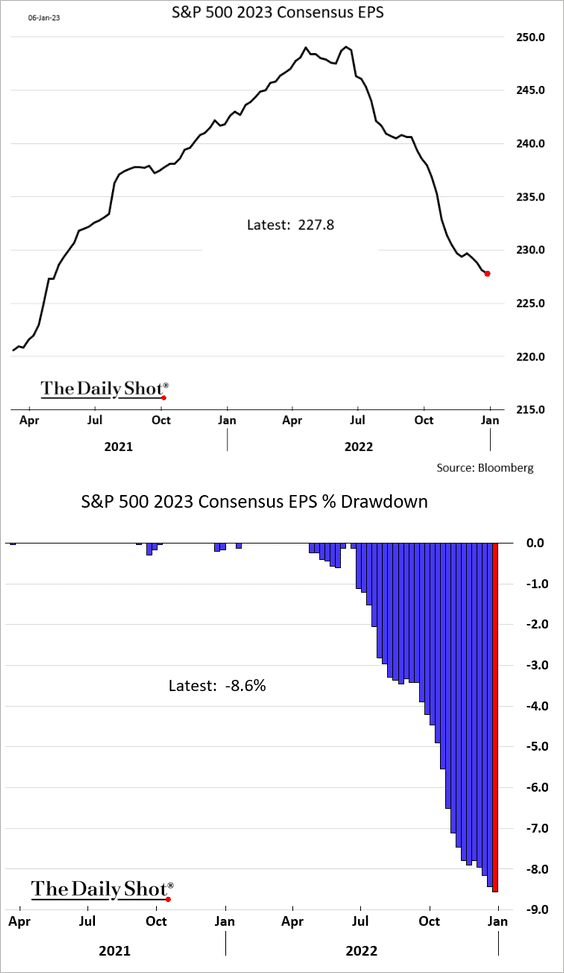
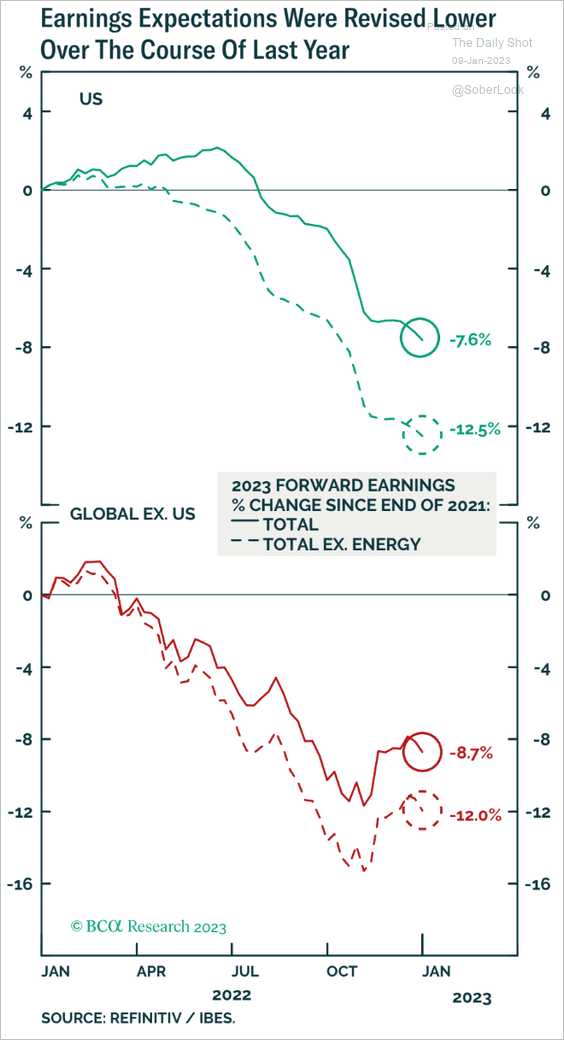
1. The 2023 earnings forecast downgrades continue (3 charts), …
 Source: BCA Research
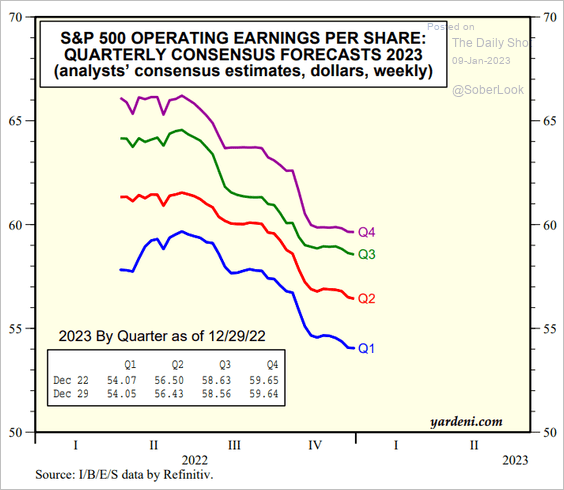 Source: Yardeni Research
… but the revisions have not yet priced in a recession.
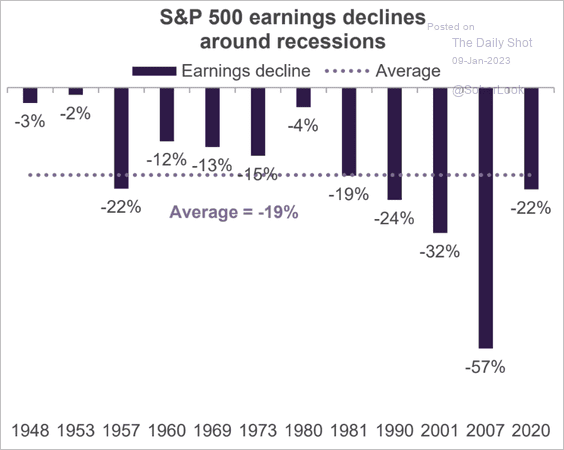 Source: Truist Advisory Services
Here is the difference between the consensus estimate and Deutsche Bank’s hard-landing projection.
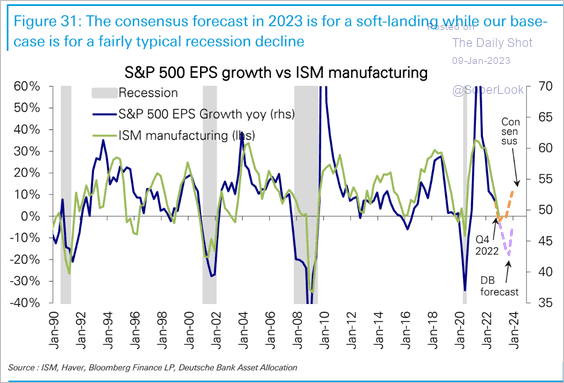 Source: Deutsche Bank Research
——————–
2. Stocks saw significant outflows going into the year-end (2 charts).
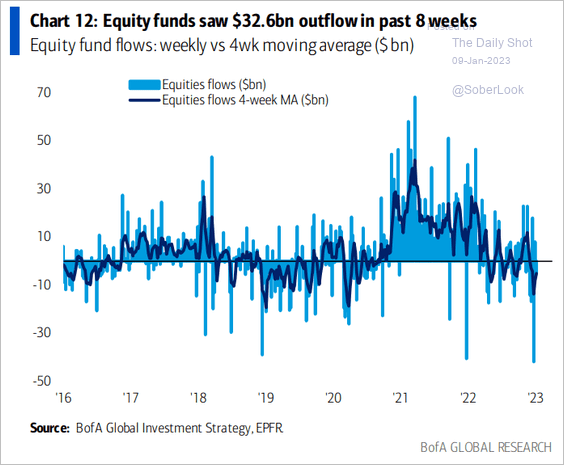 Source: BofA Global Research
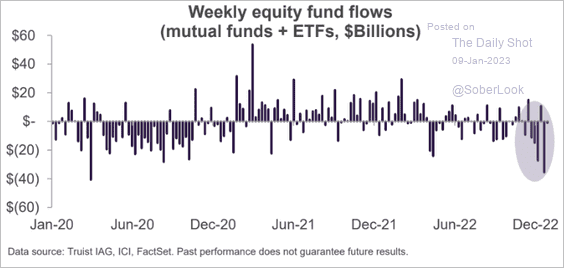 Source: Truist Advisory Services
——————–
3. Given the current equity risk premium, what returns should we expect over the next decade?
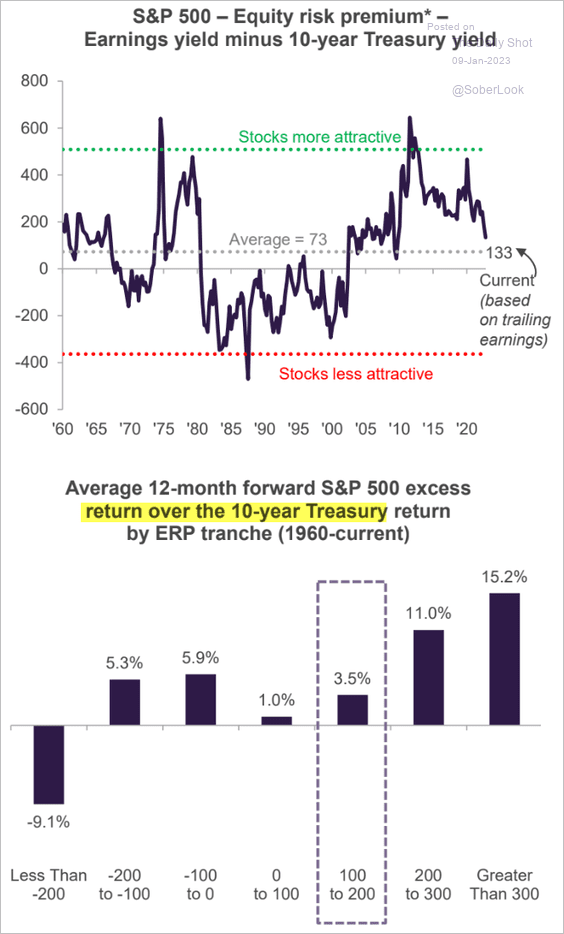 Source: Truist Advisory Services
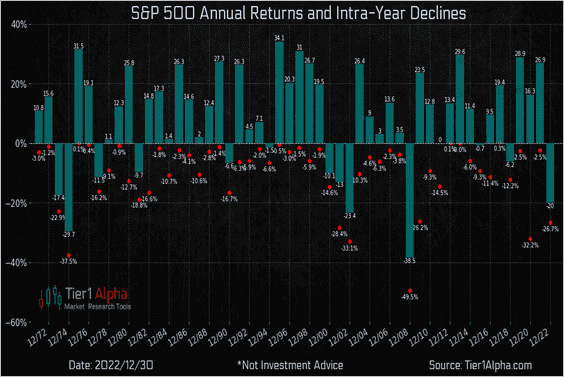
4. This chart shows S&P 500 annual and intra-year declines.
 Source: @t1alpha
5. Investors expect stocks and bonds to become inversely correlated this year.
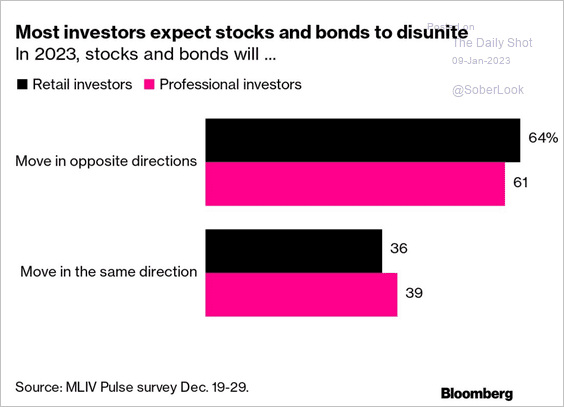 Source: @tatianadariee, @markets Read full article
6. Large-cap stock pickers were more successful last year than at any time since 2007.
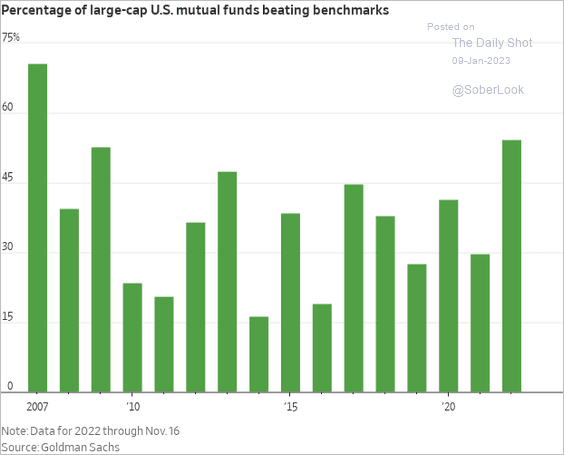 Source: @WSJ Read full article
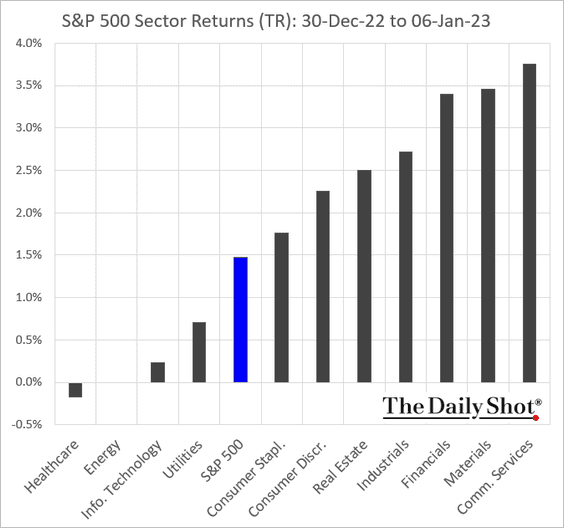
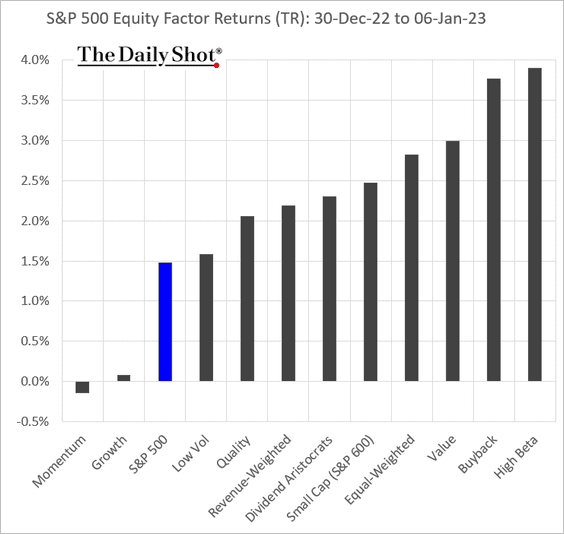
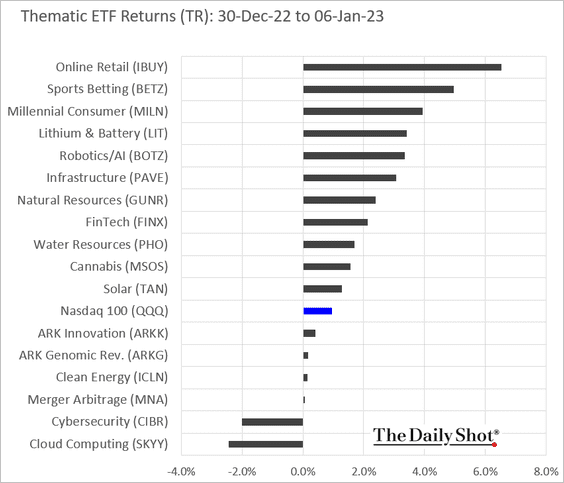
7. Next, we have some performance data from last week.
• Sectors:
• Equity factors:
• Thematic ETFs:
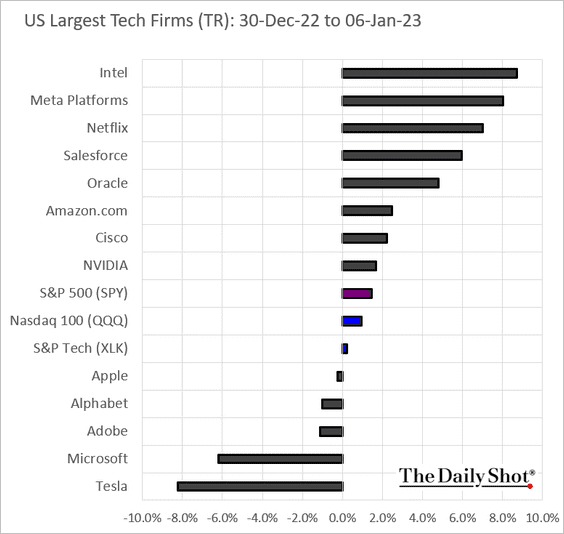
• Largest US tech firms:
Back to Index
Credit
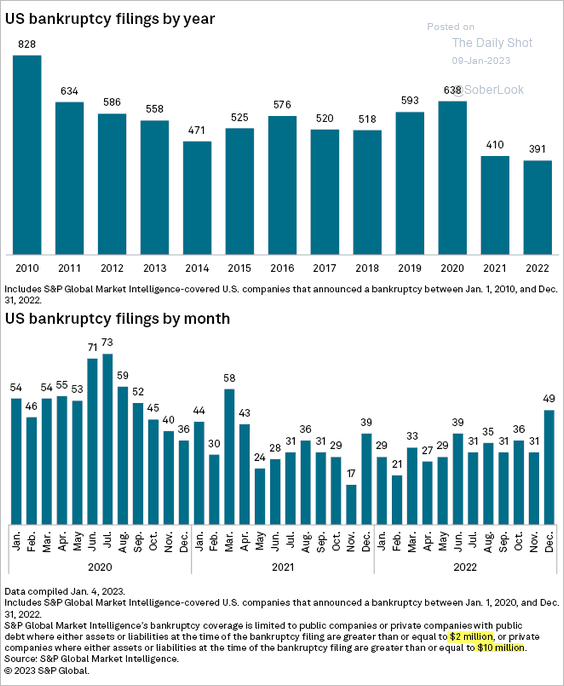
1. Bankruptcies among larger and mid-size firms (see definition below) were relatively low in 2022.
 Source: S&P Global Market Intelligence
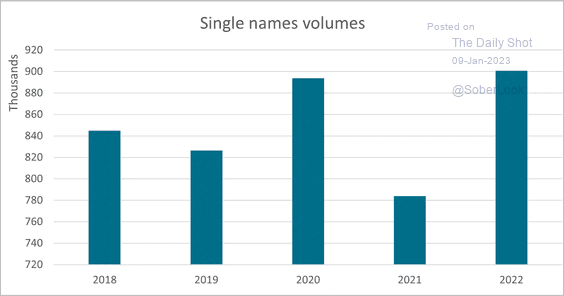
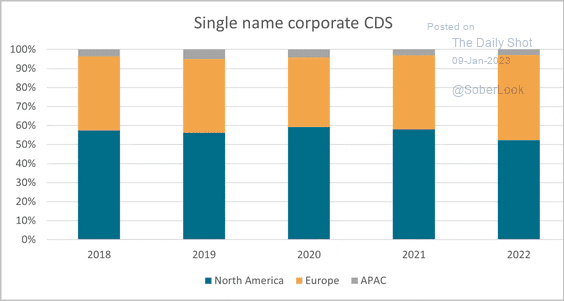
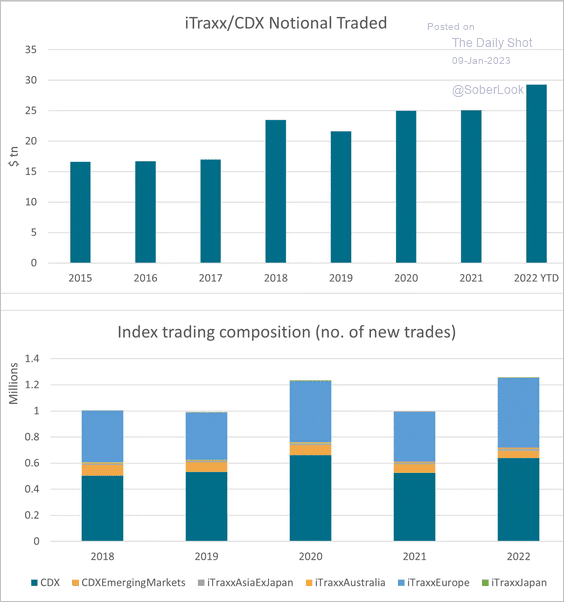
2. CDS volumes were up last year.
 Source: S&P Global Market Intelligence
 Source: S&P Global Market Intelligence
This chart shows index CDS volumes.
 Source: S&P Global Market Intelligence
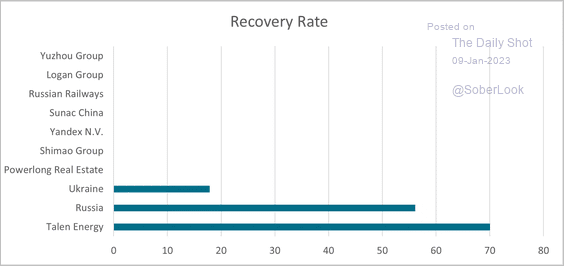
Here is a comment from S&P Global Market Intelligence on CDS credit events.
There have been 10 credit events this year, but only three have met the criteria for an auction ( as deemed by the ISDA Determinations Committee). The remaining seven are all EM corporates, the bulk of them related to Chinese property and construction. The main reason auctions haven’t been held is that the 300/5 transaction criteria hasn’t been fulfilled (essentially not enough trades outstanding and not enough dealers active). This suggests that more liquidity provision is required in the EM corporate market, which will, in turn, give investors the confidence of an auction-derived settlement following a credit event.
 Source: S&P Global Market Intelligence
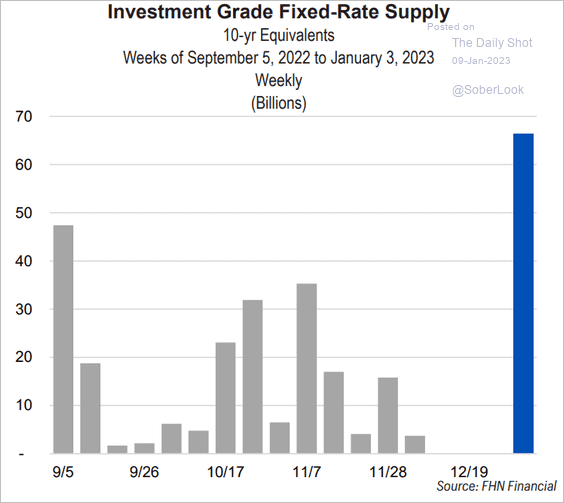
3. Investment-grade debt supply jumped last week.
 Source: FHN Financial
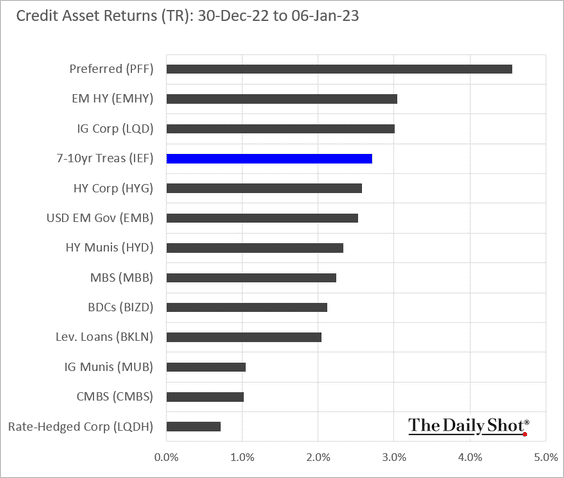
4. Finally, we have last week’s performance data by asset class.
Back to Index
Rates
1. This chart shows the relationship between the 10-year Treasury yield and CPI during the 1970s-80s.
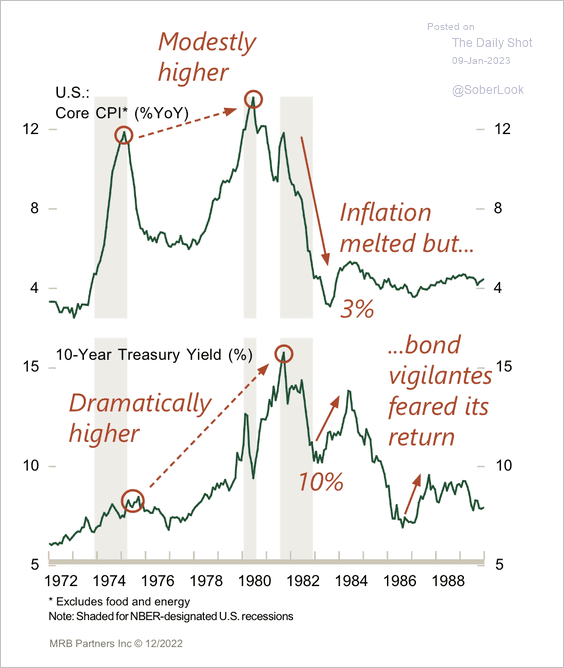 Source: MRB Partners
2. Here is the current tightening cycle and the implied fed funds rate trajectory compared to previous rate hike cycles.
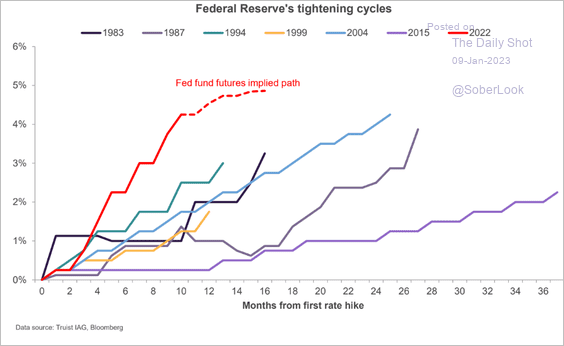 Source: Truist Advisory Services
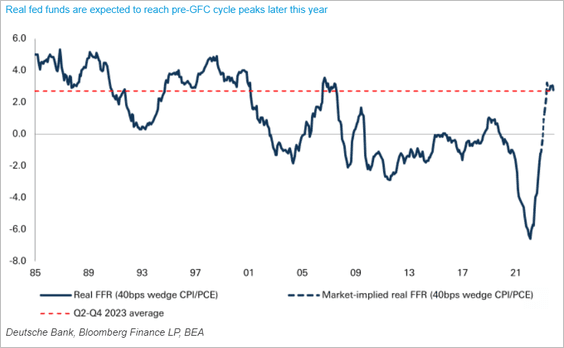
3. The real fed funds rate is moving into positive territory.
4. Speculative accounts hold record-long positions in SOFR (short-term interest-rate) futures.
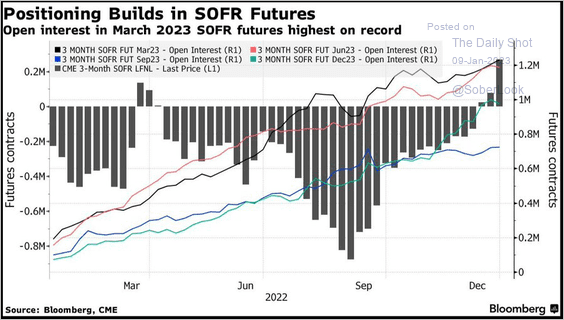 Source: @markets Read full article
Back to Index
Global Developments
1. G7 sovereign bonds are consolidating around oversold levels.
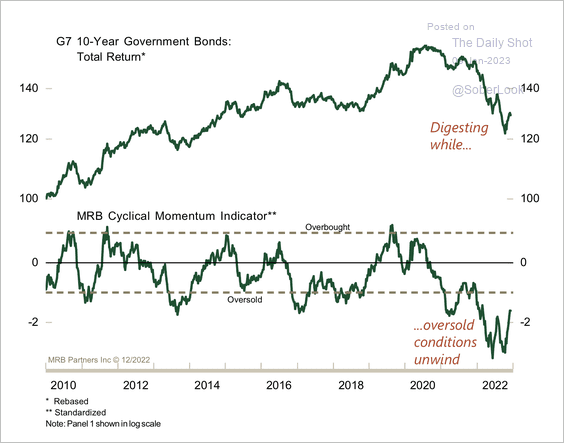 Source: MRB Partners
The spike in G7 sovereign bond yields has only restored valuation to neutral territory, according to MRB Partners.
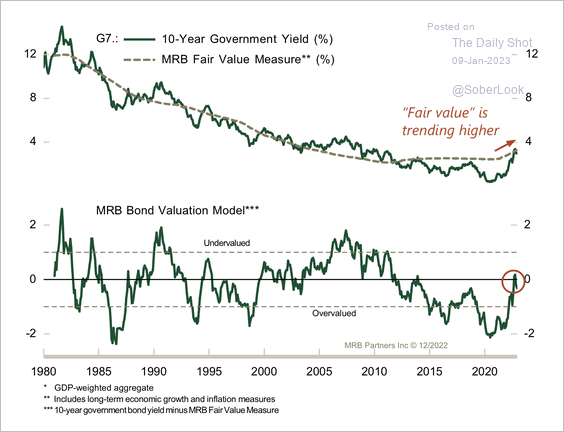 Source: MRB Partners
——————–
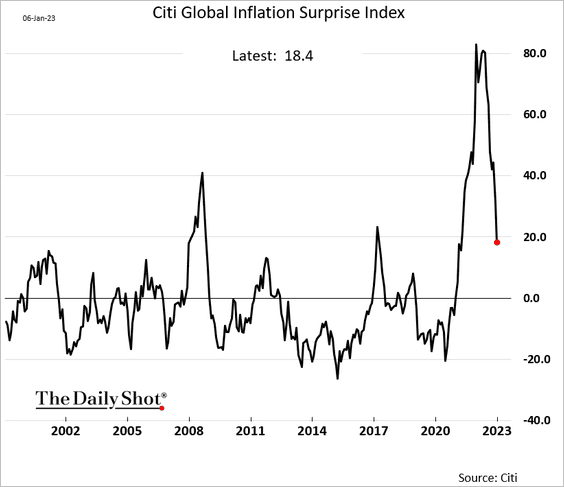
2. Inflation reports no longer surprise to the upside.
3. Here is how global equity funds changed their allocations in 2022.
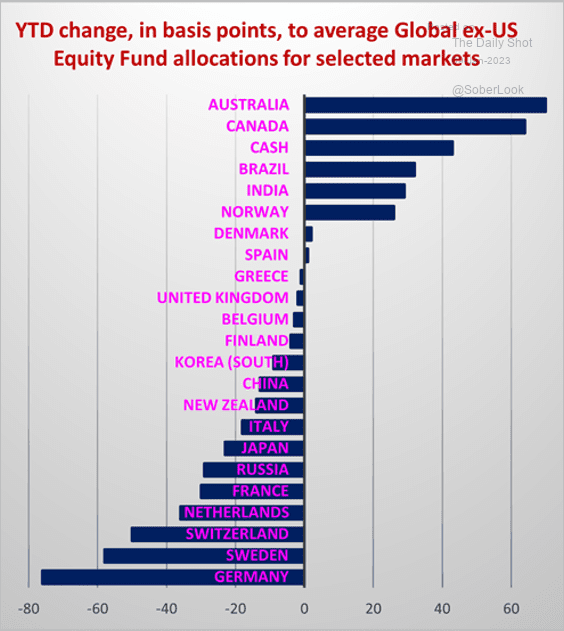 Source: EPFR
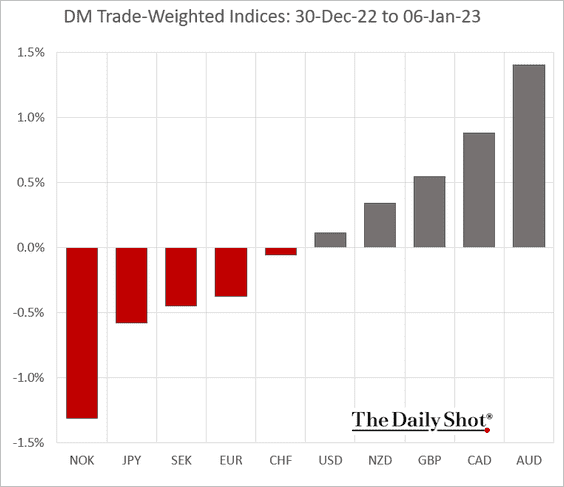
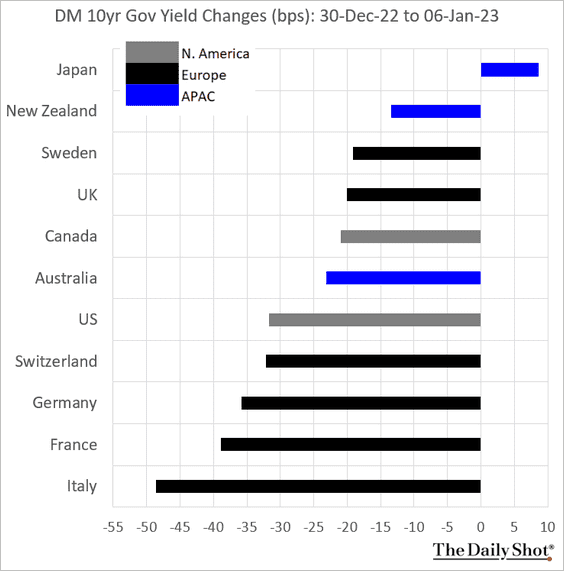
4. Finally, we have last week’s performance data.
• DM currency indices:
• Bond yields:
——————–
Food for Thought
1. Private college costs:
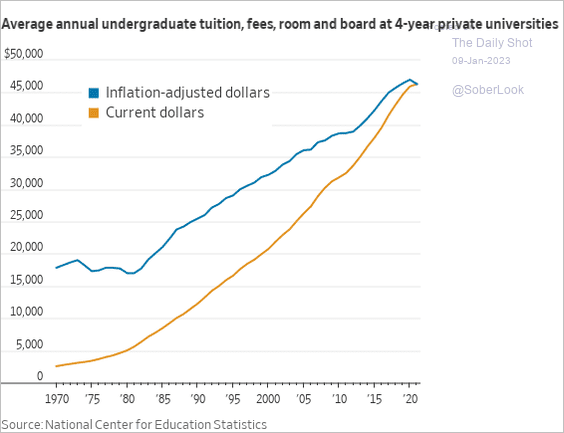 Source: @WSJ Read full article
2. US teacher shortages:
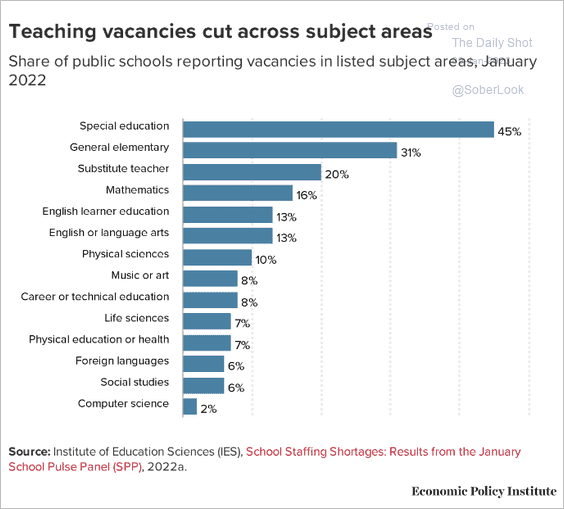 Source: EPI Read full article
3. US road deaths (changes since 1994):
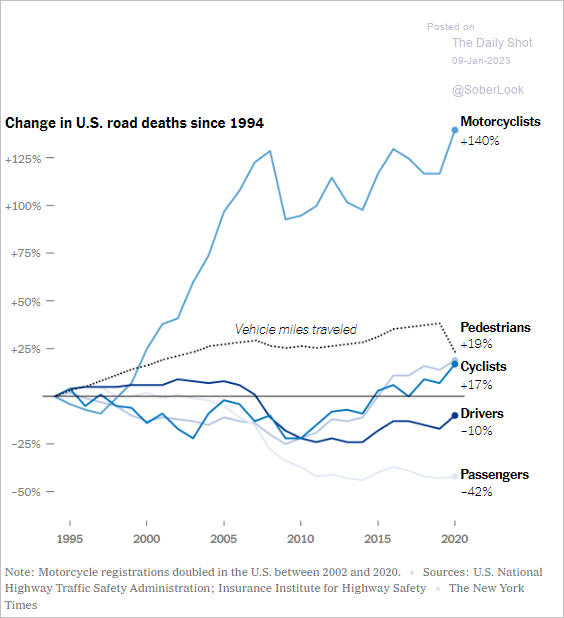 Source: The New York Times Read full article
• vs. other countries:
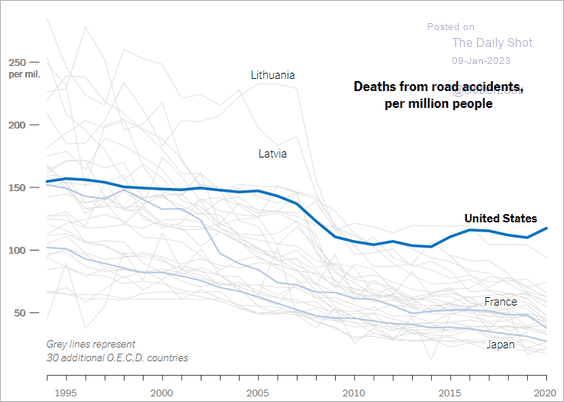 Source: The New York Times Read full article
——————–
4. Migration episodes:
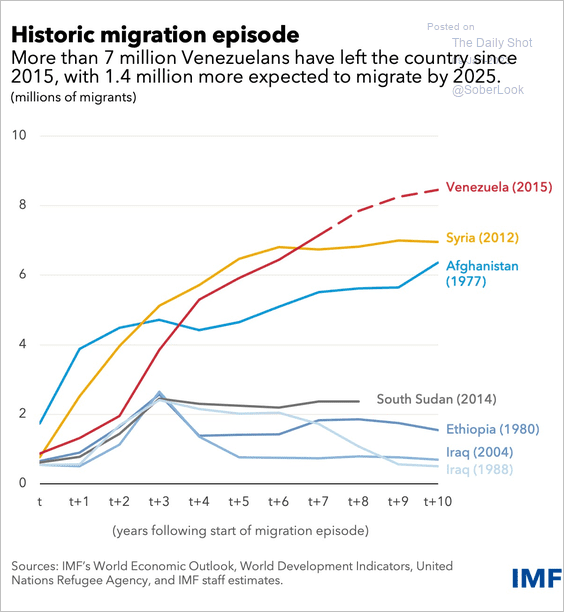 Source: IMF Read full article
5. Landline phone services:
 Source: Statista
6. Texting:
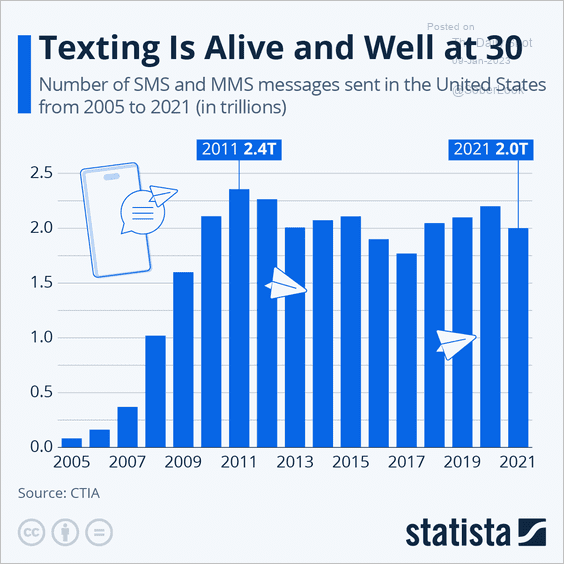 Source: Statista
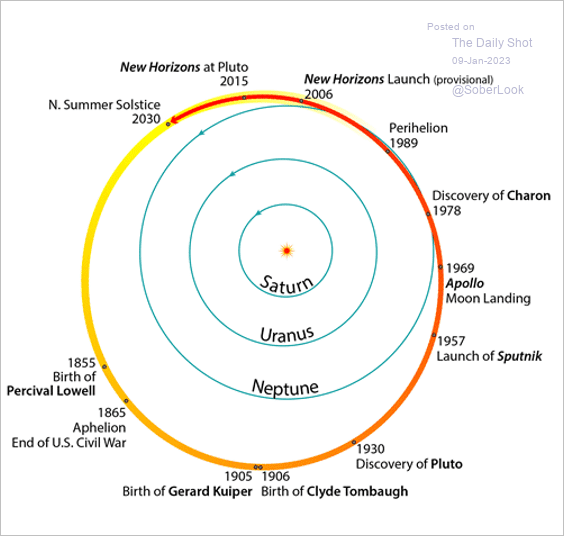
7. Pluto’s orbit:
 Source: NASA Read full article
——————–
Back to Index