
The Daily Shot: 16-Jun-21
• The United States
• The United Kingdom
• The Eurozone
• China
• Emerging Markets
• Cryptocurrency
• Commodities
• Energy
• Equities
• Rates
• Global Developments
• Food for Thought
The United States
1. May retail sales were below market estimates, but there was a significant upward revision for April.
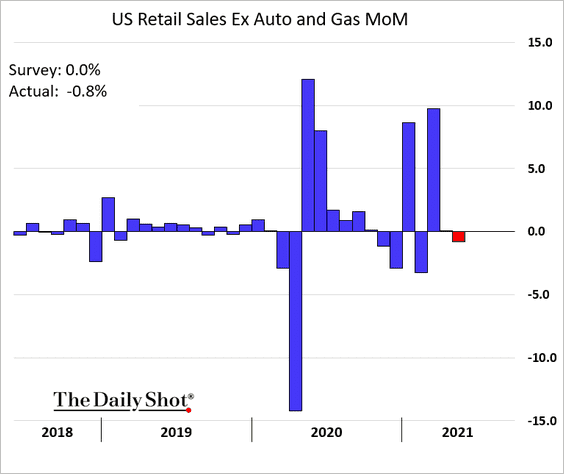
• Retail sales remain well above the pre-COVID trend, …
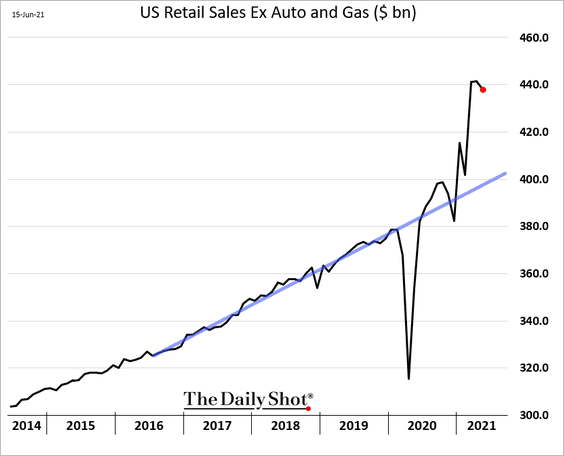
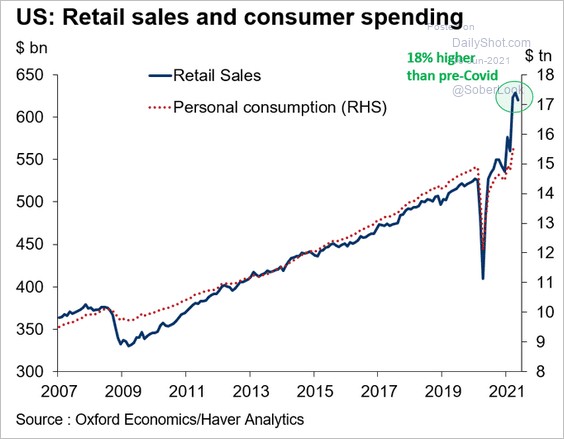
… pointing to strong gains for consumer spending.
 Source: @GregDaco
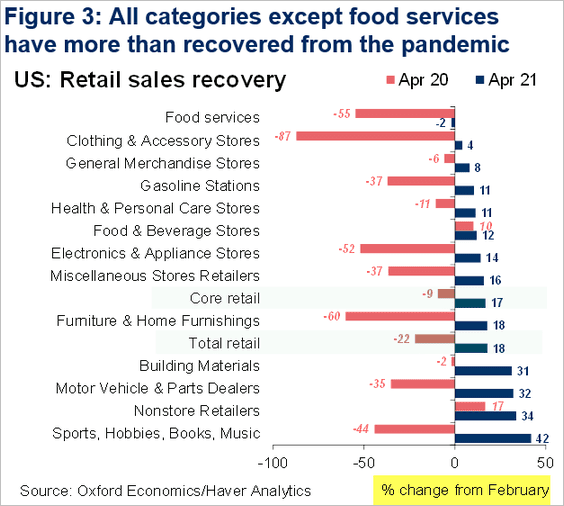
• Most sectors have more than recovered.
 Source: @GregDaco
• This chart shows retail sales vs. the post-2008 recovery.
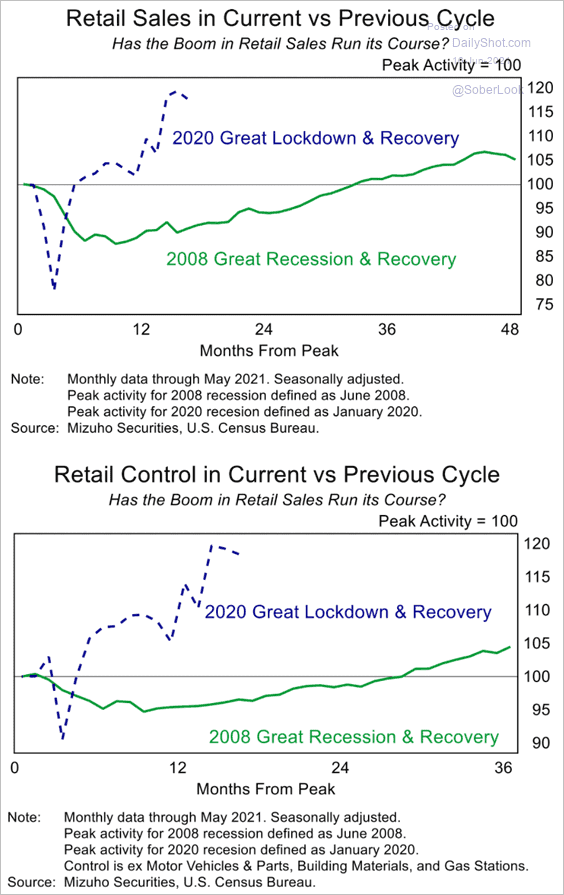 Source: Mizuho Securities USA
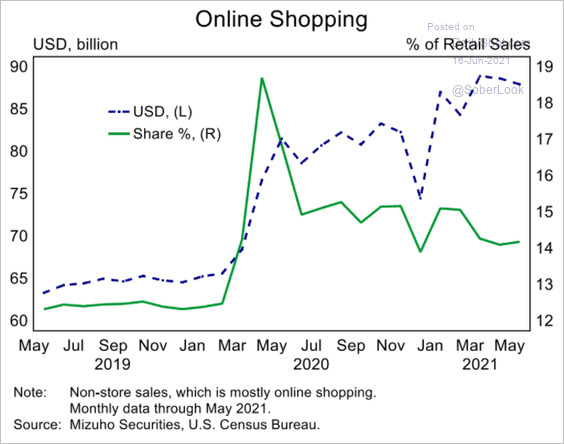
• Online sales remain elevated relative to pre-pandemic levels.
 Source: Mizuho Securities USA
——————–
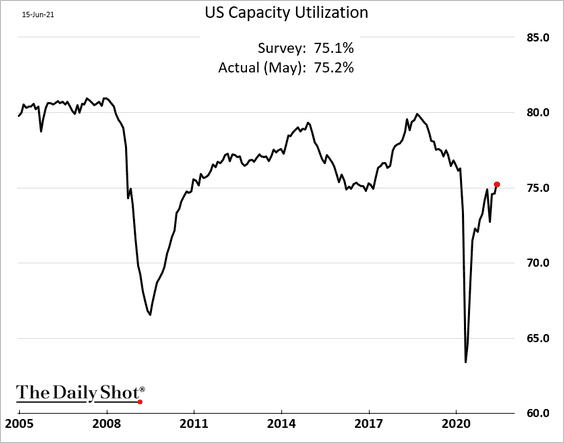
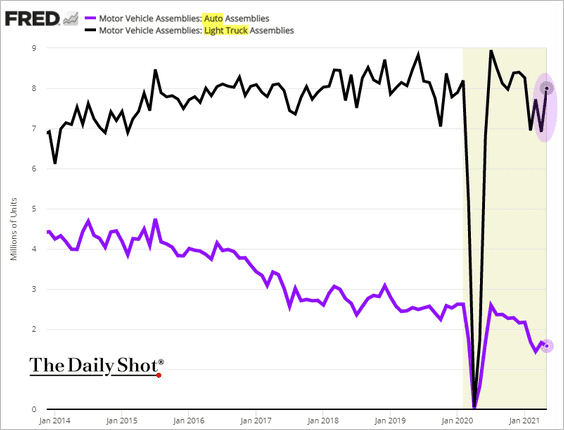
2. Manufacturing output rose in May and is now close to pre-COVID levels.
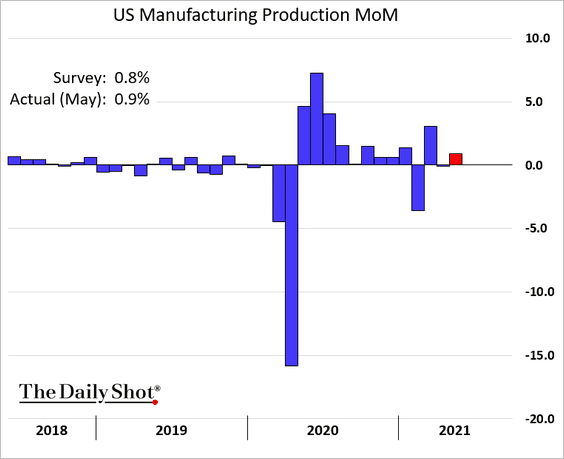
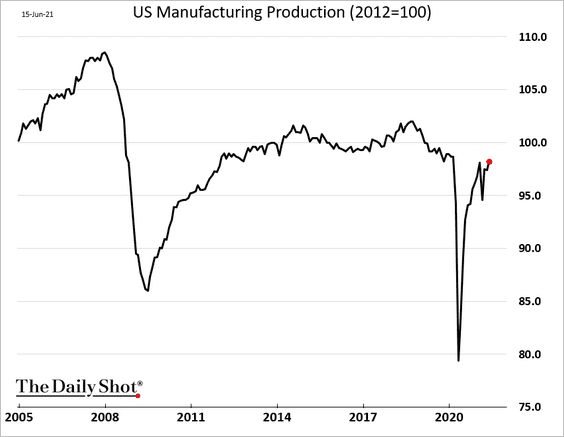
Industrial capacity utilization continues to climb.
It appears that some of the supply bottlenecks in the auto industry may have eased as truck assemblies rebound. Car production continues to trend lower.
——————–
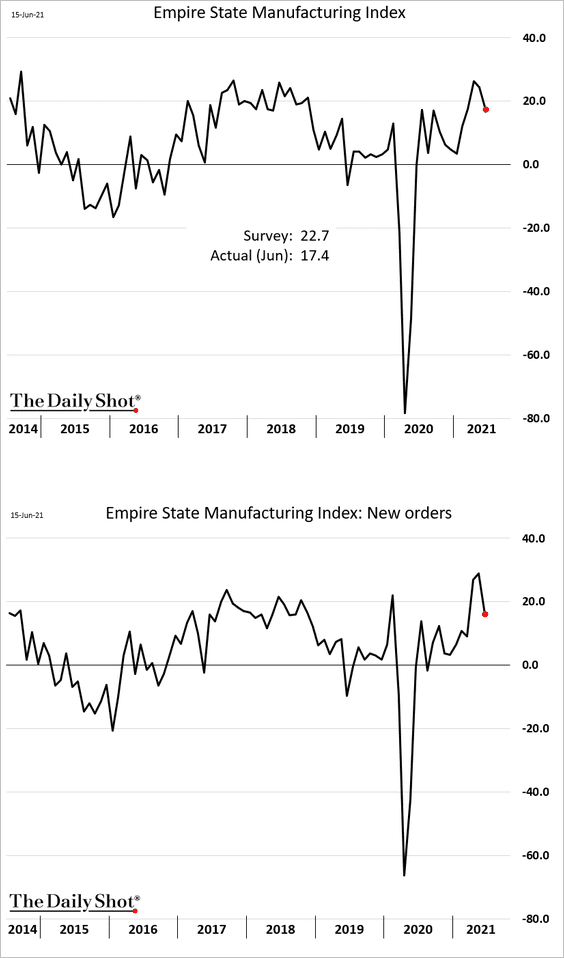
3. The NY Fed’s May manufacturing report (first regional survey of the month) was weaker than expected.
Supplier delays worsened this month, …
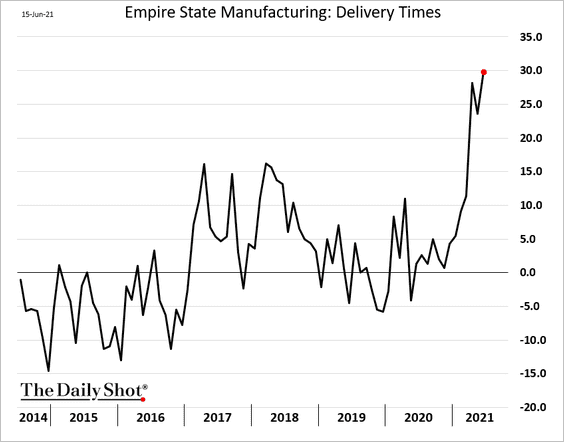
… which has been a national trend.
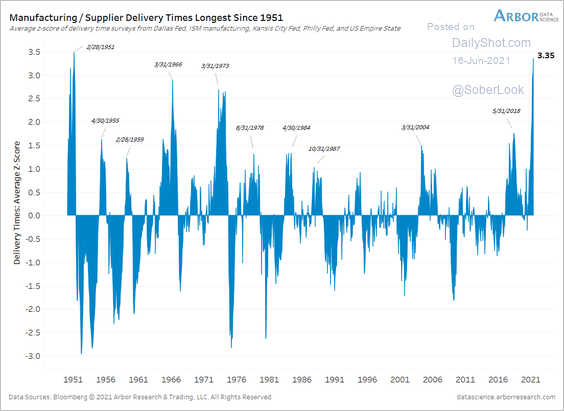 Source: Arbor Research & Trading
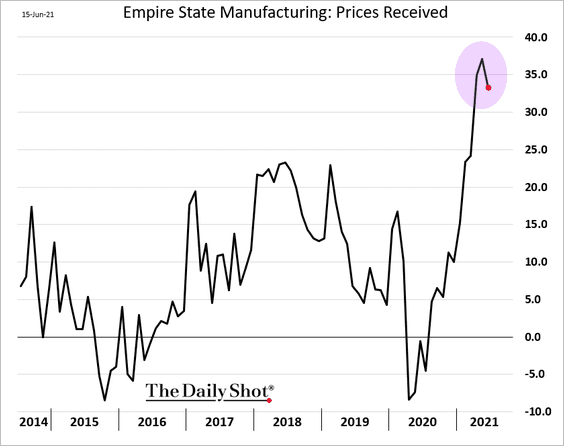
But price indices appear to be peaking.
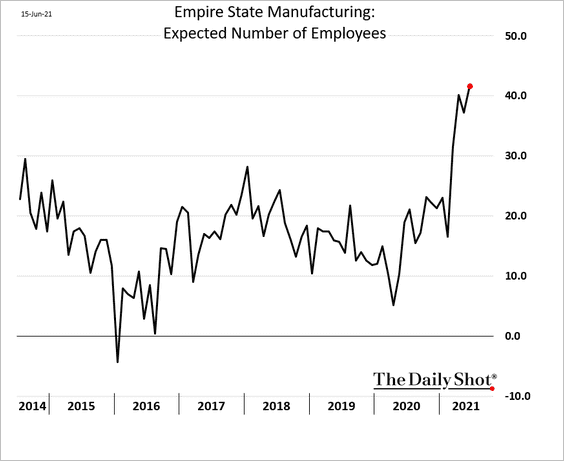
The region’s factories are quite optimistic, expecting to further boost hiring in the months ahead.
——————–
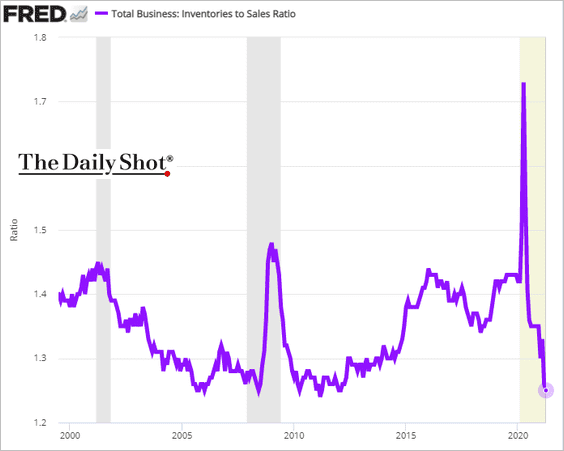
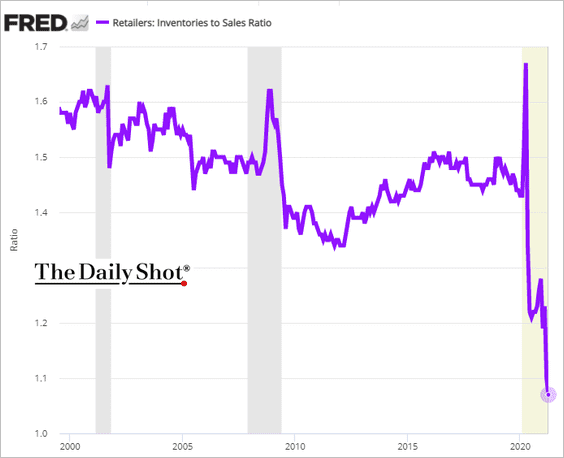
4. US inventory rebuilding paused in May (mostly due to supplier delays).
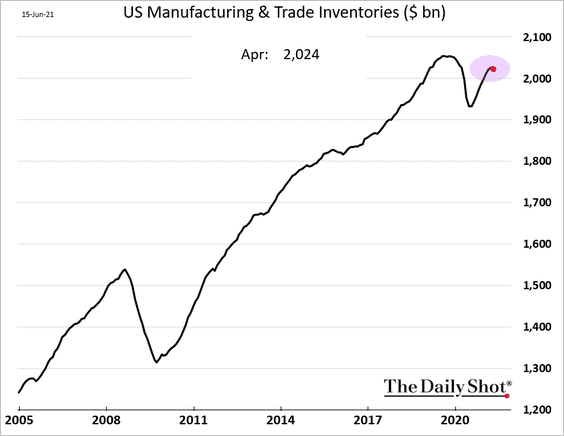
The total inventories-to-sales ratio is nearing record lows.
Retailers’ inventory shortages are becoming more acute.
——————–
5. Next, we have some updates on inflation.
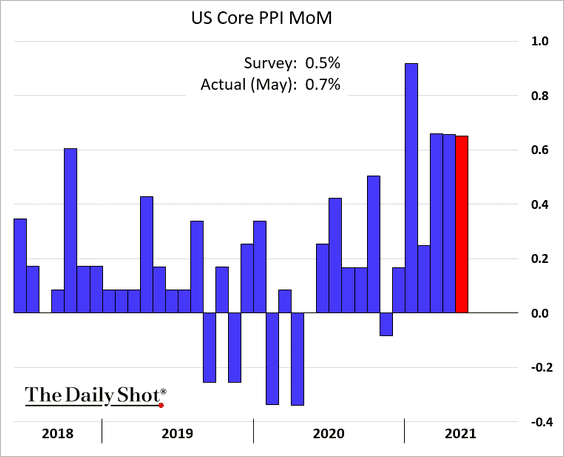
• The PPI print surprised to the upside.
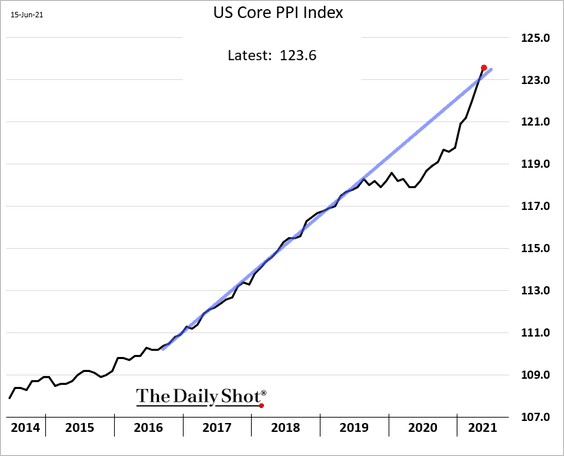
The core PPI index is now above the 2016-2019 trend.
• Internet searches for hyperinflation and disinflation have surged over the past few months.
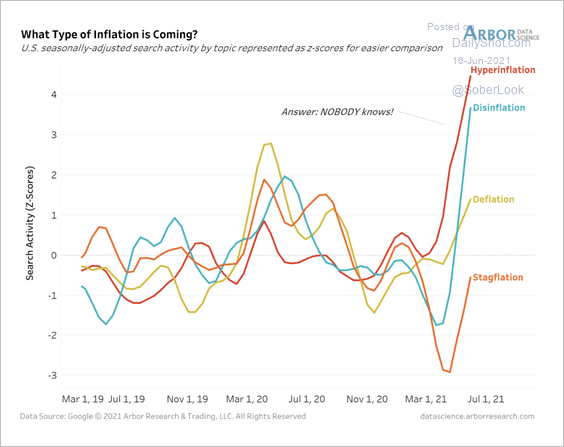 Source: Arbor Research & Trading
• Used-car dealers are gouging customers amid automobile shortages.
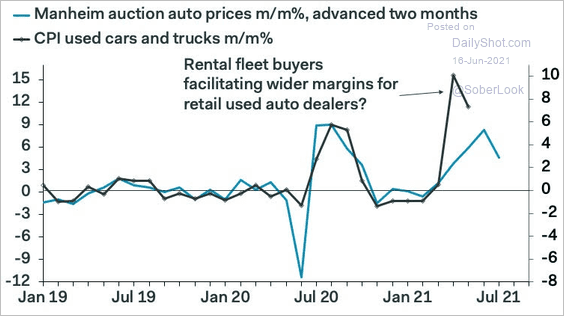 Source: Pantheon Macroeconomics
• Here are the annualized 3-month CPI changes.
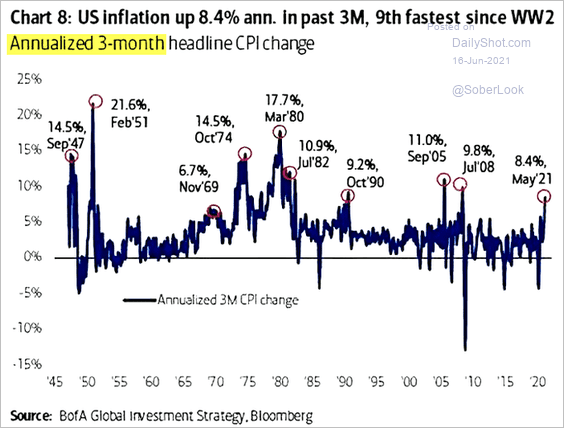 Source: @ISABELNET_SA, @BofAML
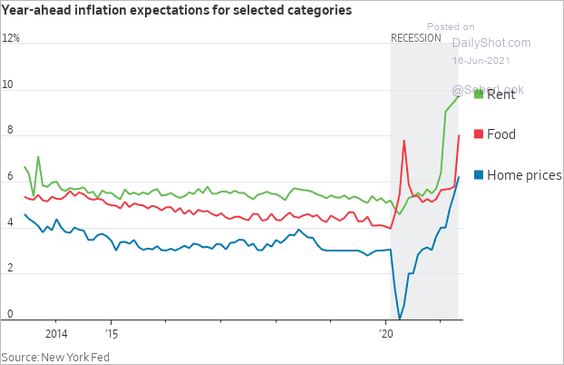
• Consumer inflation expectations rose sharply in May, according to the NY Fed (although they eased in June based on the U. Michigan survey). Older Americans are particularly concerned about rising prices (2nd chart).
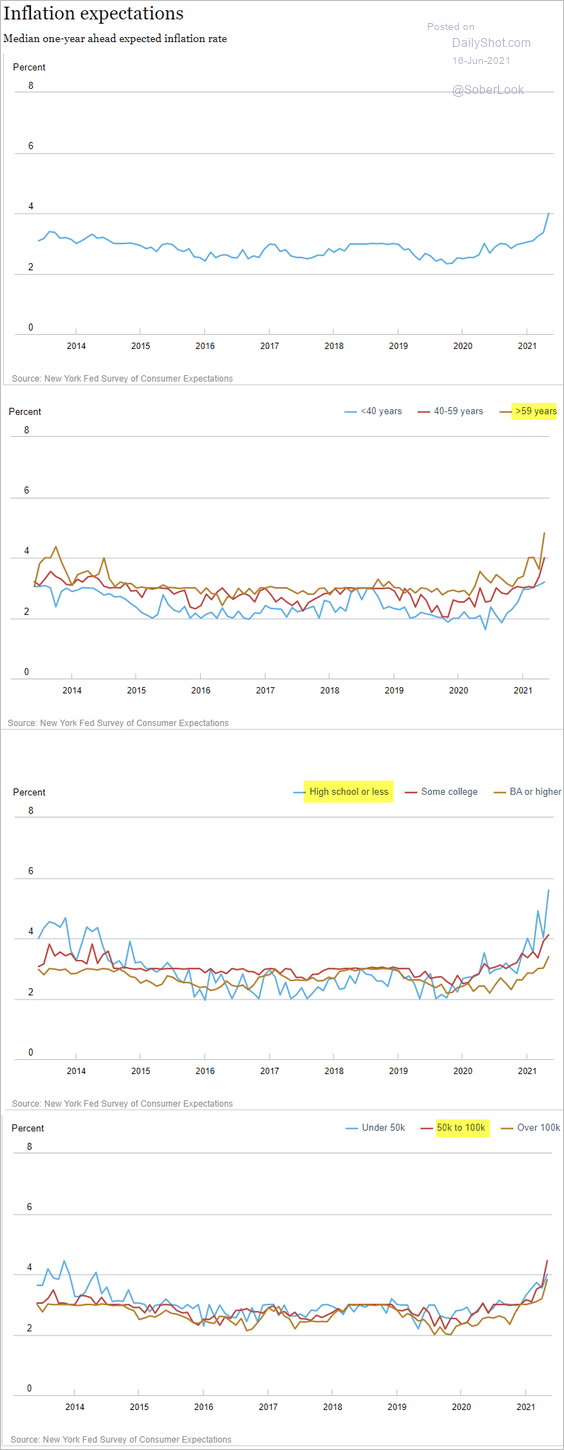 Source: NY Fed
Consumers expect much higher prices on food and rent.
 Source: @WSJ Read full article
——————–
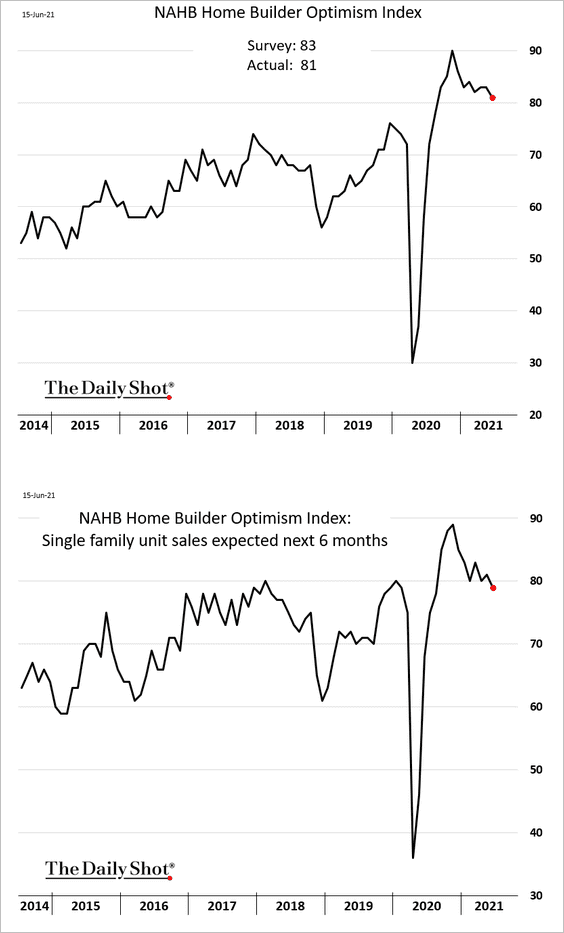
6. With homebuyers increasingly concerned about sharp price gains, builder sentiment continues to moderate.
Back to Index
The United Kingdom
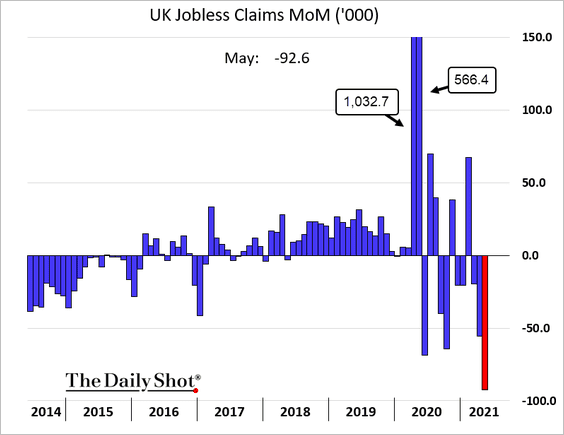
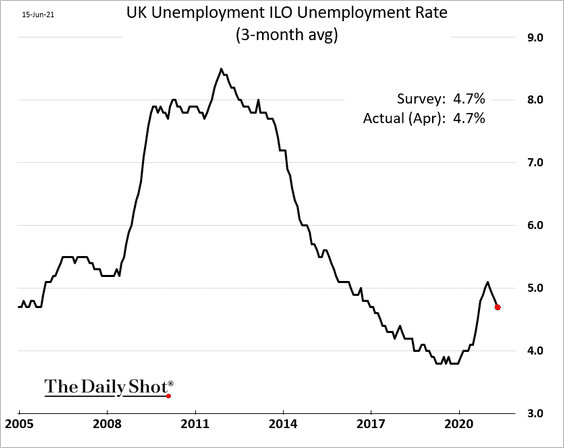
1. The labor market continues to heal as jobless claims drop.
• Part-time workers are taking full-time jobs.
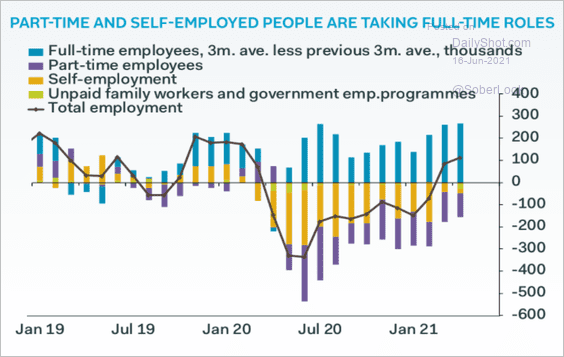 Source: Pantheon Macroeconomics
• There isn’t much slack in the labor force.
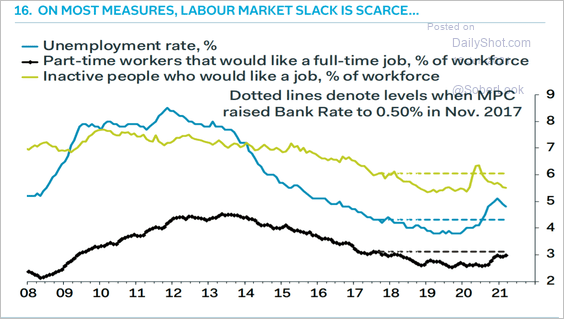 Source: Pantheon Macroeconomics
——————–
2. The bulk of the new COVID cases (new variant) are younger people, suggesting that vaccines have been effective.
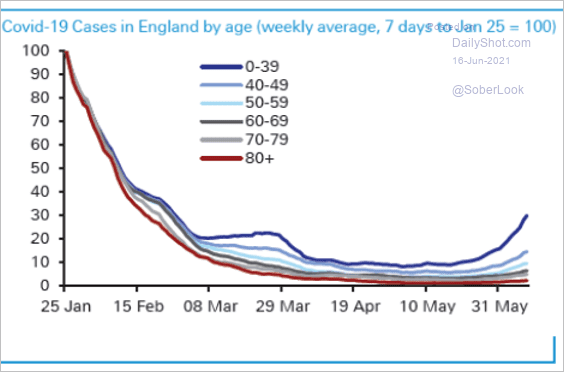 Source: Deutsche Bank Research
3. Renting or buying?
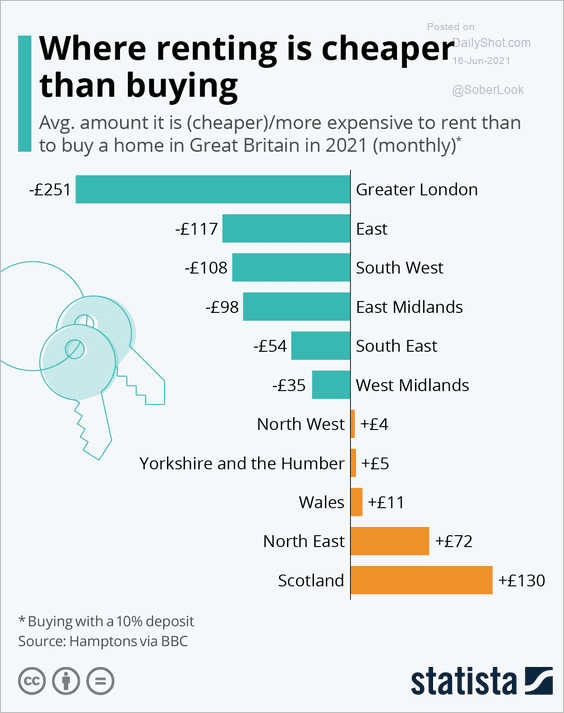 Source: Statista
Back to Index
The Eurozone
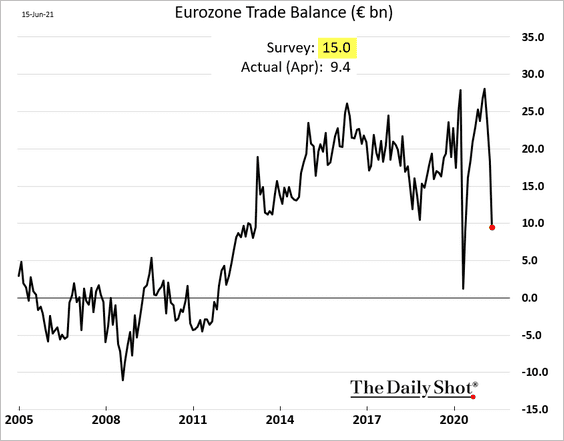
1. The euro-area trade surplus tumbled in April. Economists expect this decline to be temporary.
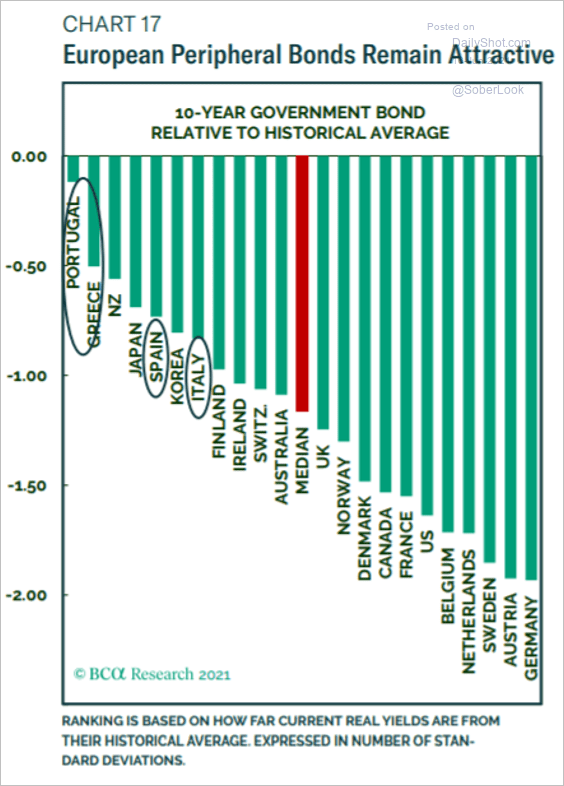
2. Eurozone periphery bonds are attractive on a relative basis.
 Source: BCA Research
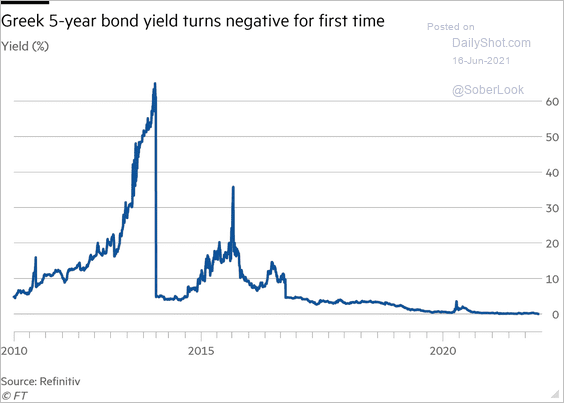
Greek bond yields hit new lows.
 Source: @financialtimes Read full article
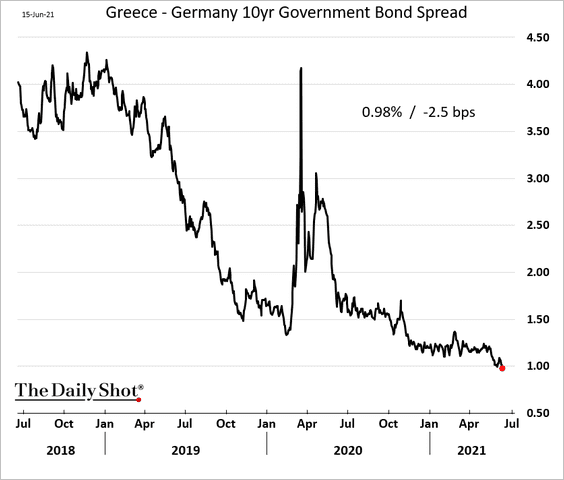
The 10-year Greece-Germany yield spread dipped below 1% for the first time.
——————–
3. European banks are attempting to break out from a long-term relative downtrend.
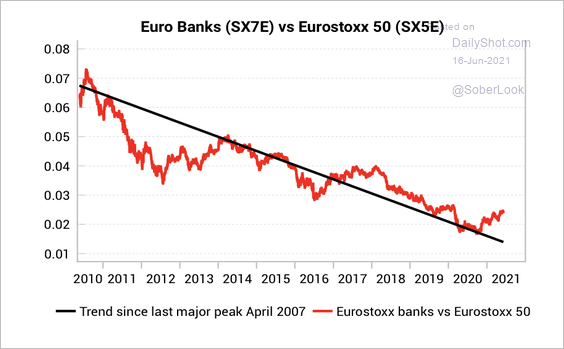 Source: Variant Perception
Bank stocks have been less sensitive to changes in the broader Euro Stoxx 50 index.
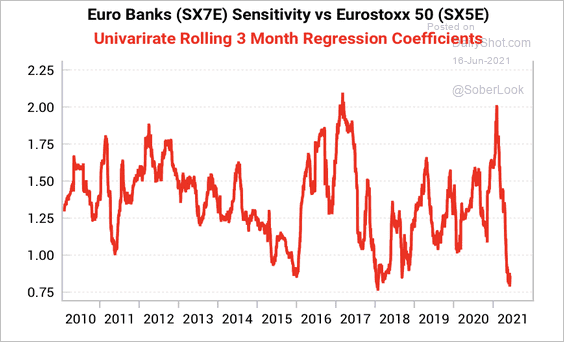 Source: Variant Perception
Back to Index
China
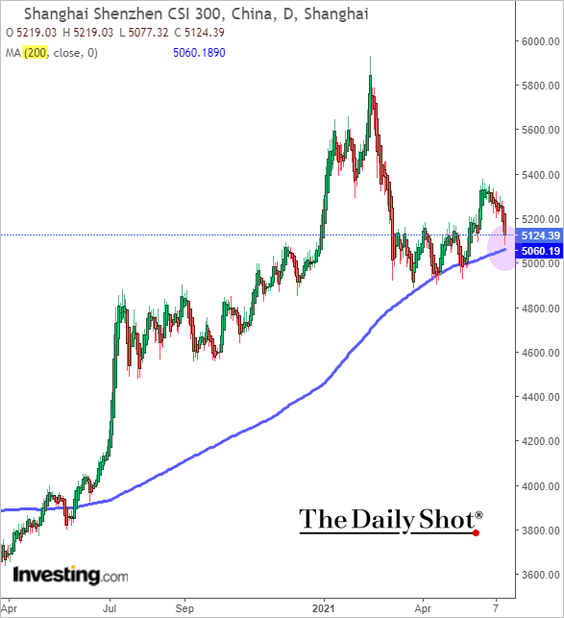
1. The Shanghai Shenzhen CSI 300 index is testing support at the 200-day moving average.
2. Yields and spreads of riskier USD-denominated corporate bonds are rising.
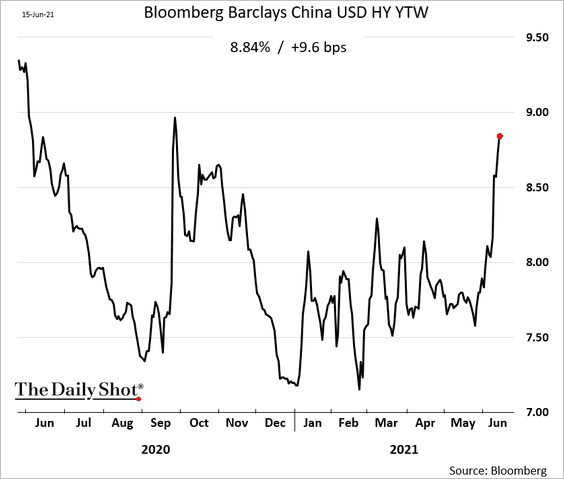 h/t Finbarr Flynn
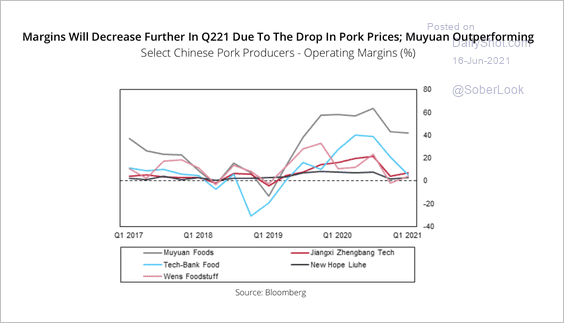
3. Fitch expects the drop in pork prices and elevated grain prices to pressure pork producer margins over the near-term.
 Source: Fitch Solutions Macro Research
Back to Index
Emerging Markets
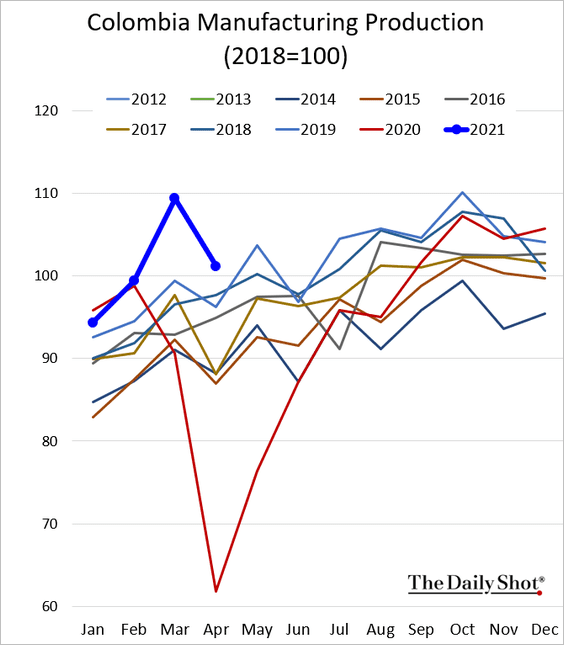
1. Colombia’s factory output remains robust.
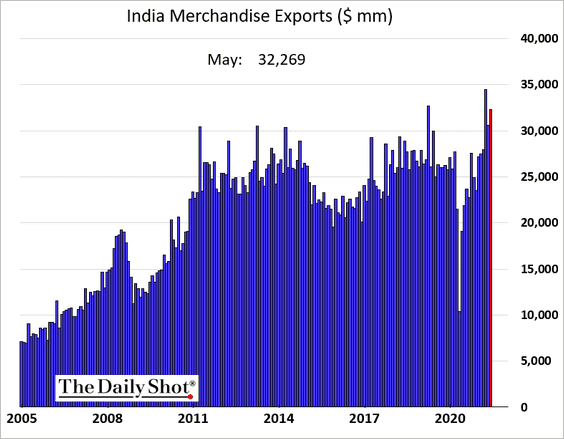
2. India’s exports were near record highs in May.
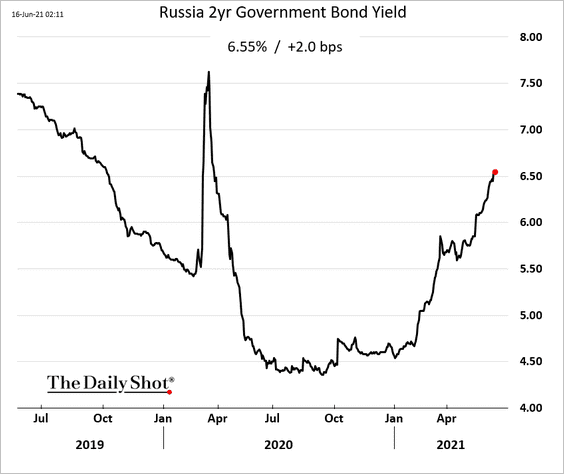
3. Russia’s short-term yields continue to grind higher as the market prices in more rate hikes.
Back to Index
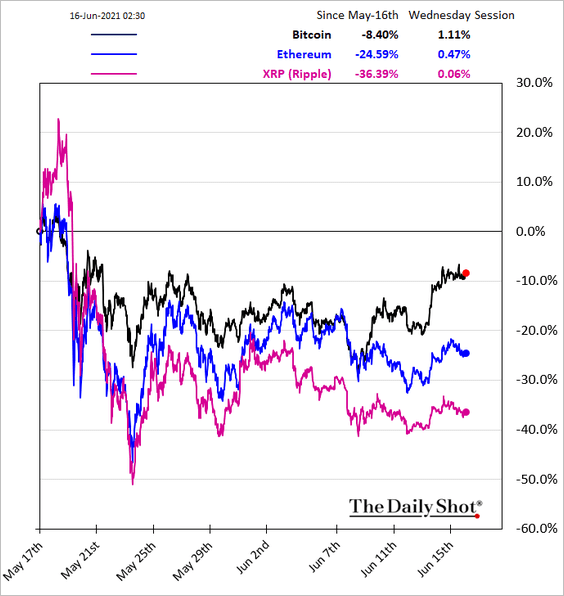
Cryptocurrency
1. Bitcoin is nearing resistance at $42k, …
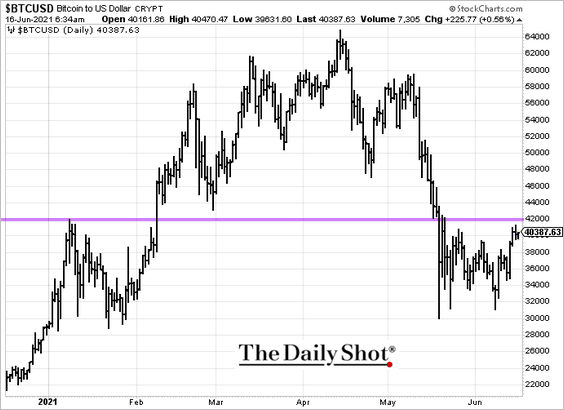
… as it outperforms other major cryptos.
——————–
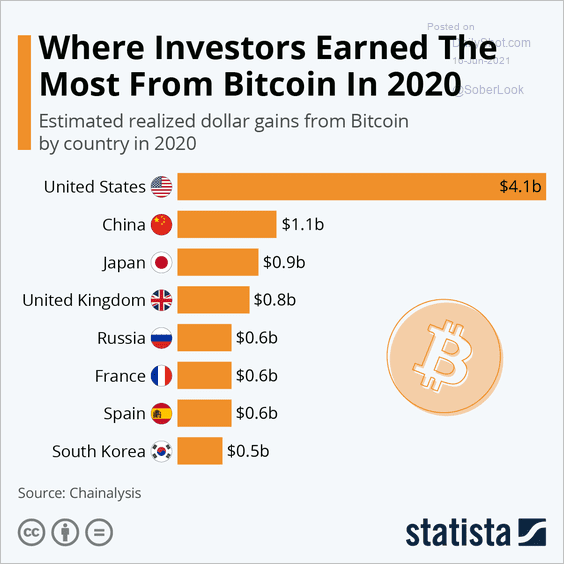
2. This chart shows realized gains in bitcoin by country.
 Source: Statista
Back to Index
Commodities
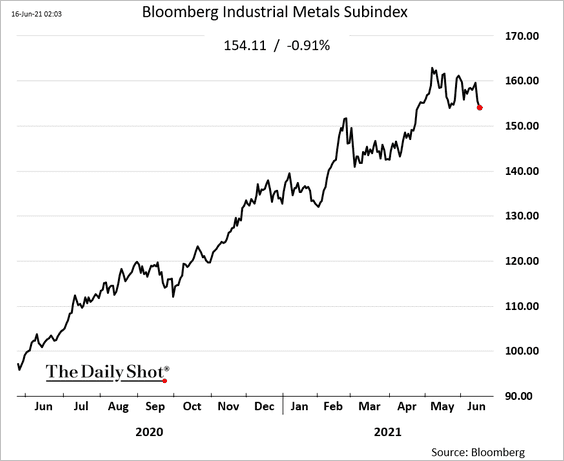
1. Copper has been rolling over.
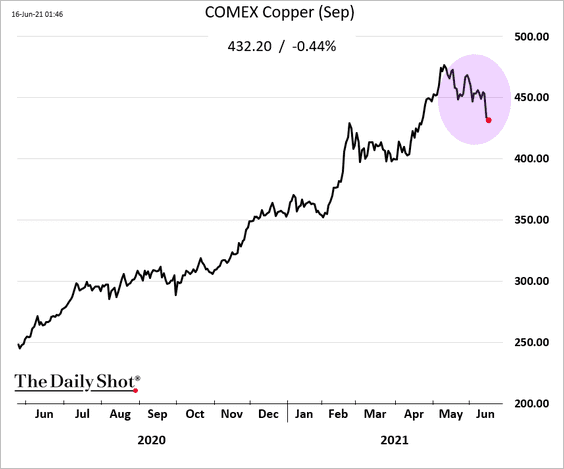
Here is Bloomberg’s industrial metals index.
——————–
2. Fund managers now see commodities as the most crowded trade.
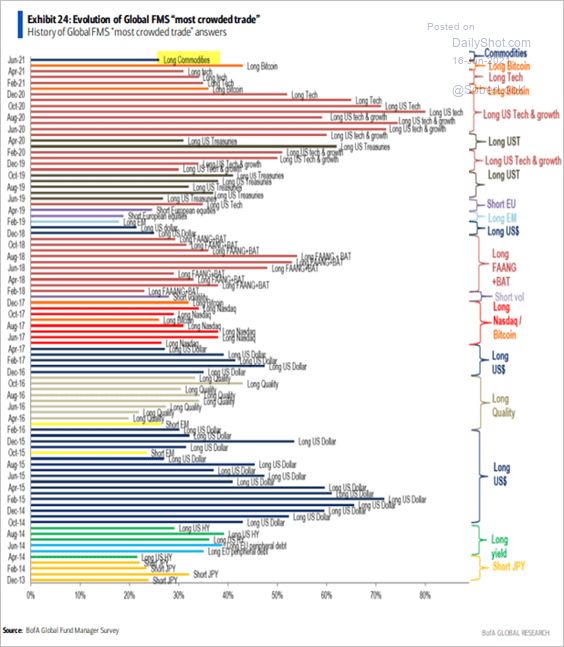 Source: BofA Global Research; @keanferdy
Fewer commodities have been up in recent weeks.
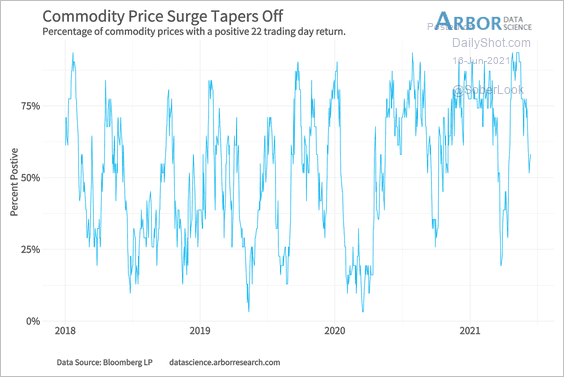 Source: Arbor Research & Trading
——————–
3. The recent decline in lumber prices has coincided with the stall in Treasury yields.
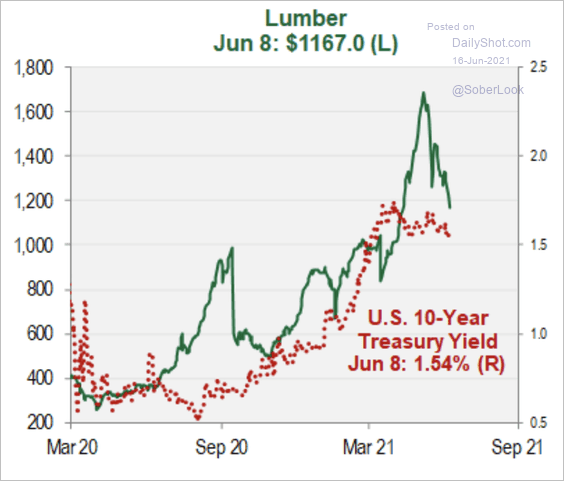 Source: Cornerstone Macro
4. Gold is nearing a golden cross.
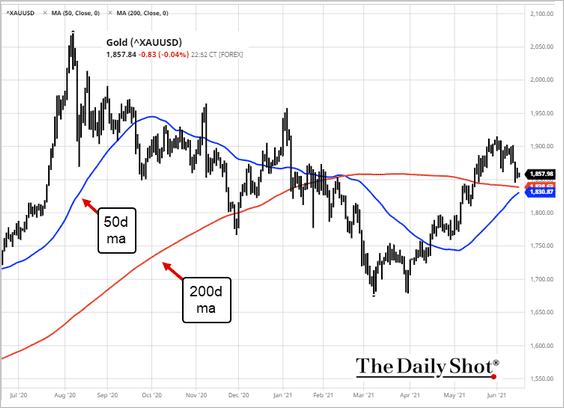 Source: barchart.com; h/t @helloiamyvonne
Back to Index
Energy
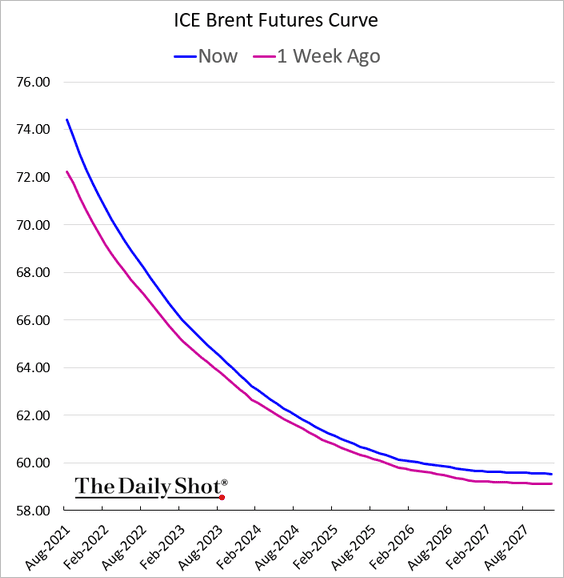
1. Oil prices continue to climb, …
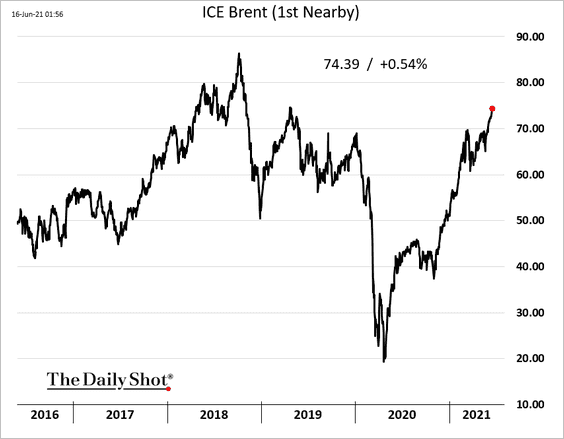
… with the Brent curve moving deeper into backwardation.
——————–
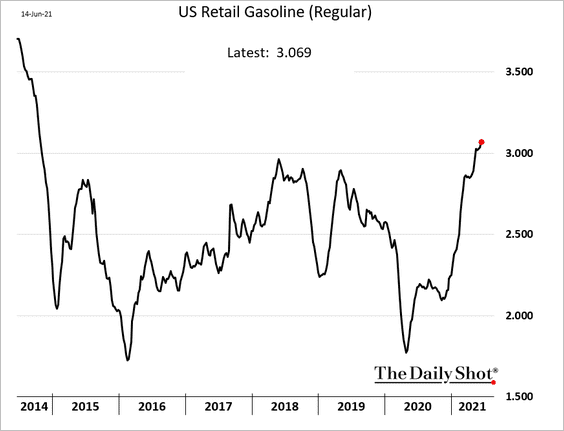
2. US retail gasoline prices hit the highest level since 2014.
3. Oil efficiency in both the US and China has significantly improved over the past 40 years.
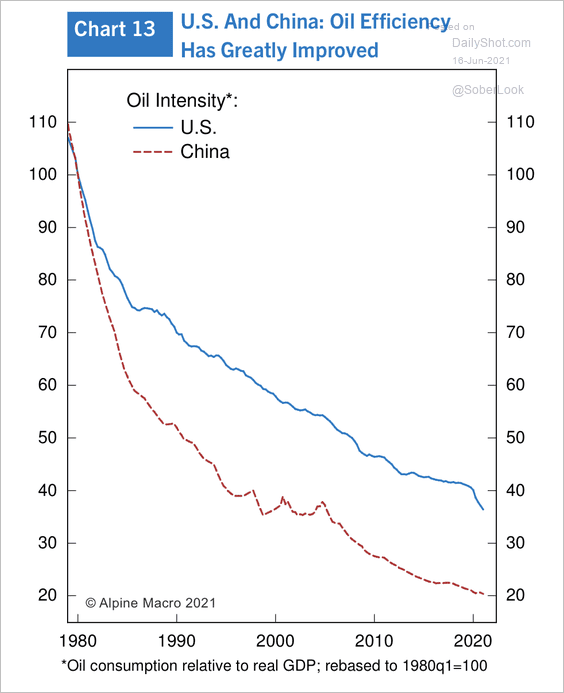 Source: Alpine Macro
4. The gap between traditional and alternative energy companies’ share prices is narrowing.
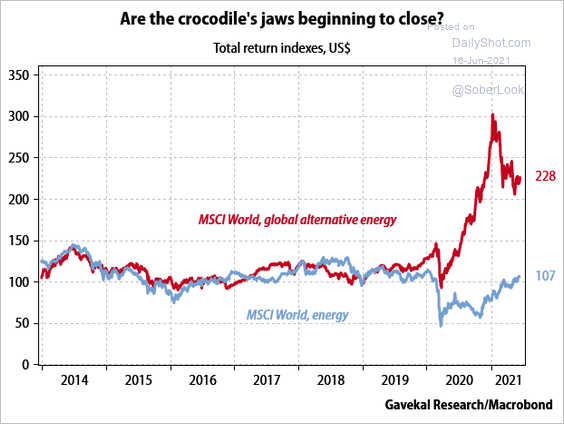 Source: Gavekal Research
Back to Index
Equities
1. The CBOE SKEW index hit a record high as traders buy downside protection ahead of the FOMC meeting.
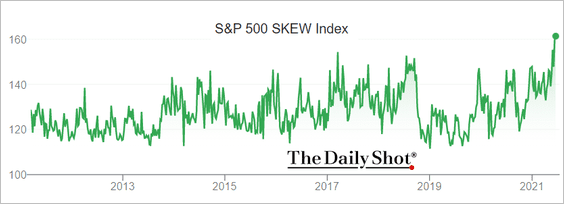 Source: Google
2. Analysts continue to upgrade their S&P 500 earnings estimates.
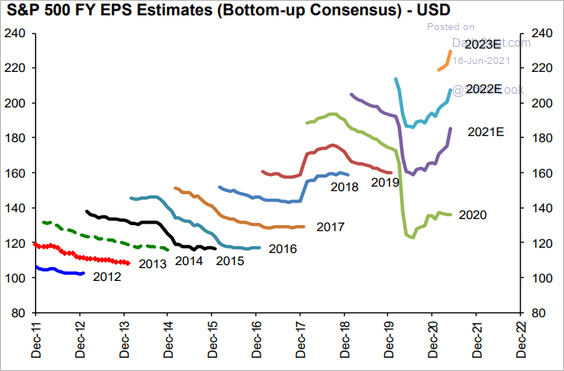 Source: Hugo Ste-Marie, Portfolio & Quantitative Strategy Global Equity Research, Scotia Capital
3. This chart shows price-to-revenue ratios by valuation decile. There is no shortage of richly-priced stocks.
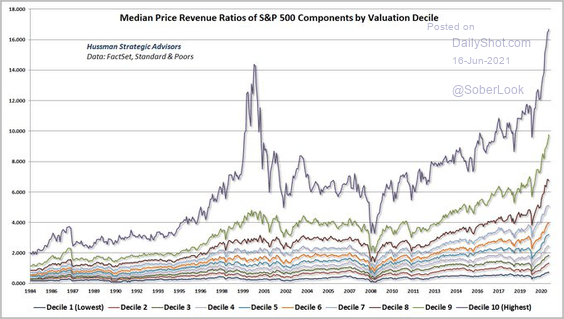 Source: @hussmanjp
4. Tax cut winners have underperformed over the past year.
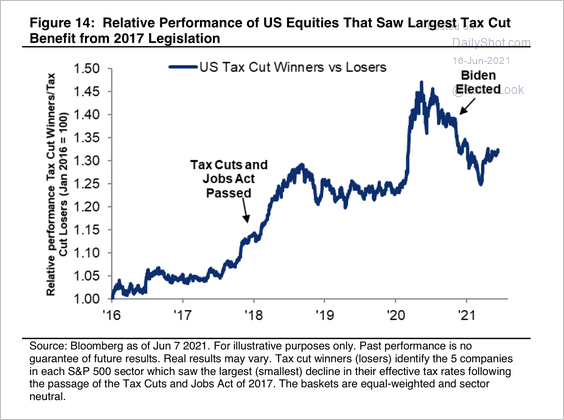 Source: Citi Private Bank
5. Zombie companies continue to outperform the S&P 500.
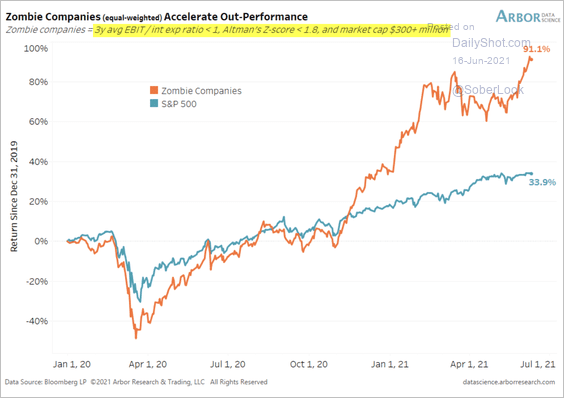 Source: Arbor Research & Trading
6. Should we expect further gains in airline stocks as air travel recovers?
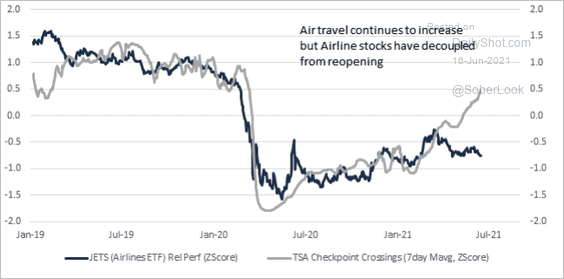 Source: Evercore ISI
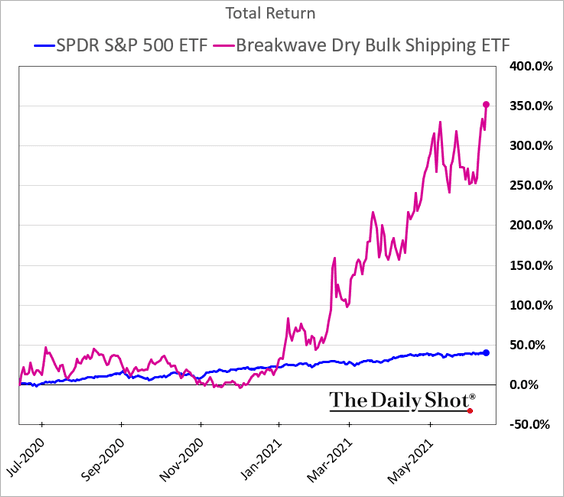
7. Dry bulk shipping companies continue to soar.
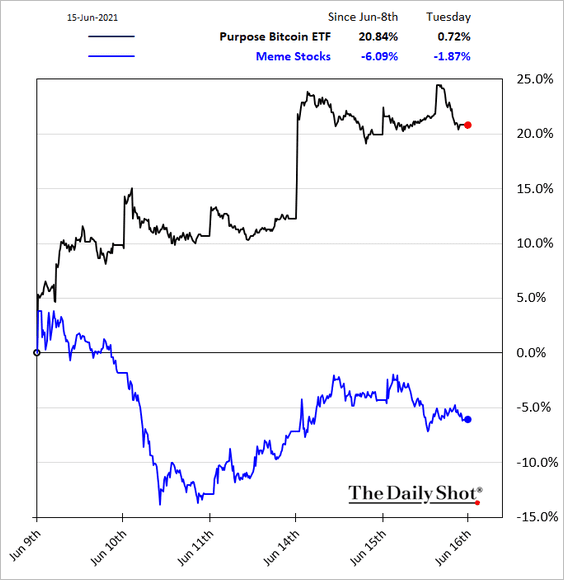
8. Some of the Reddit crowd has been moving back into crypto.
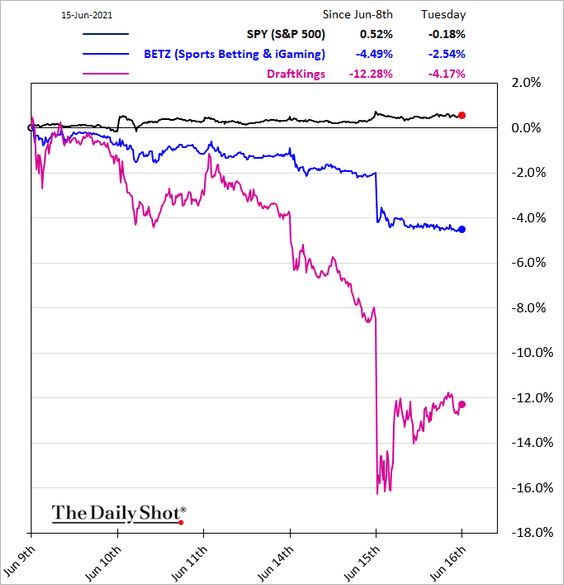
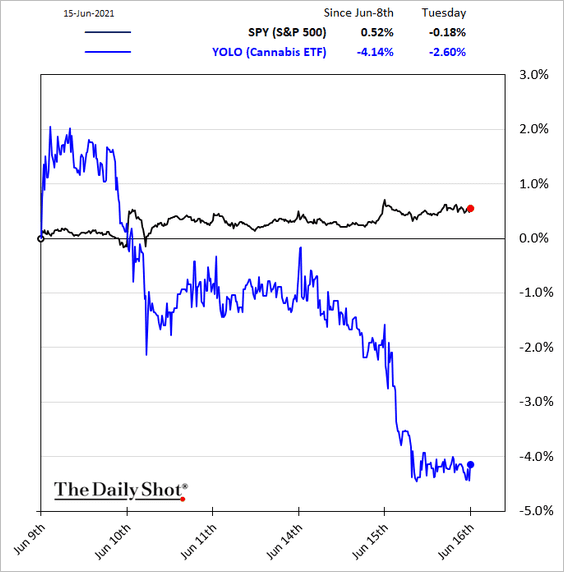
9. Finally, we have an update on some popular thematic portfolios.
• Sports betting:
 Source: @WSJ Read full article
• Cannabis:
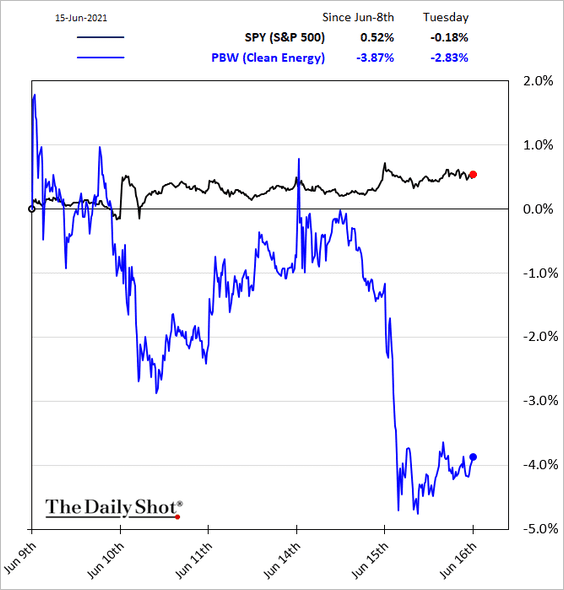
• Clean energy:
Back to Index
Rates
1. Negative yields make T-bills less attractive to foreigners.
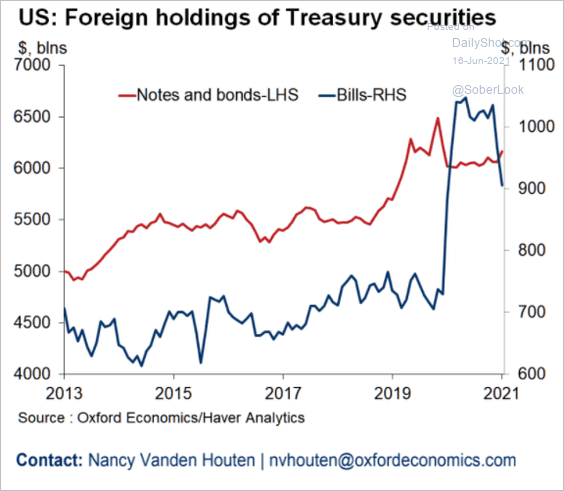 Source: Oxford Economics
2. Below is an overview of supply and demand in the Treasury market.
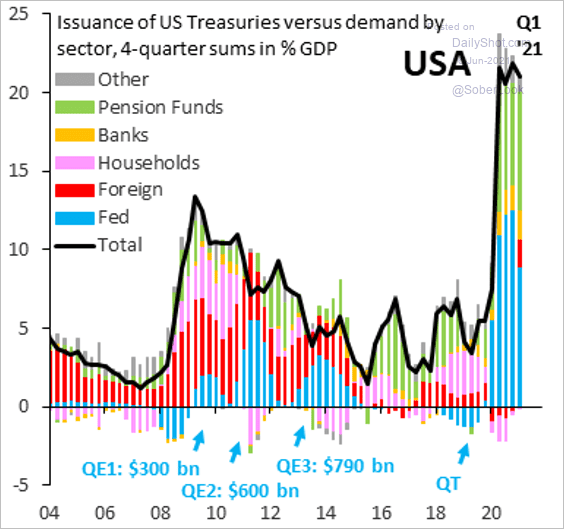 Source: @RobinBrooksIIF
3. US investors have been pushing yields lower.
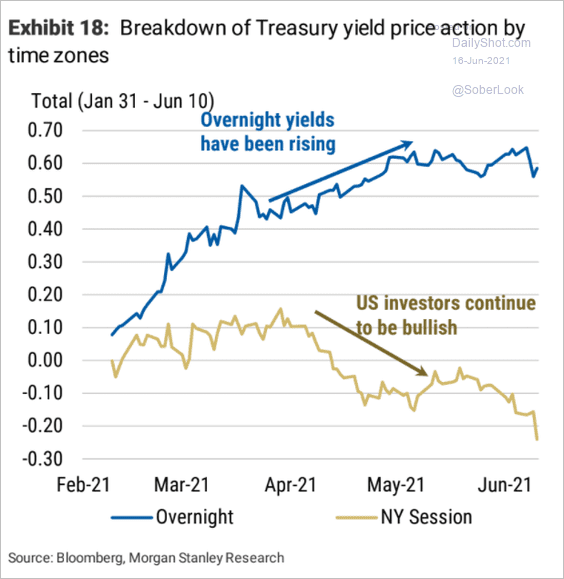 Source: Morgan Stanley Research
Back to Index
Global Developments
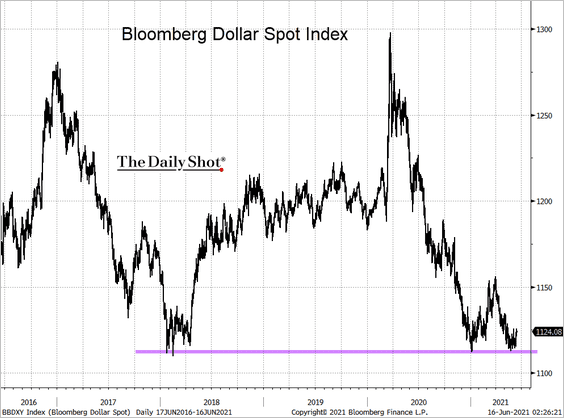
1. Bloomberg’s US dollar index is holding support.
2. Interest rate differentials have been an increasingly important driver of the dollar’s value against most currencies (2 charts).
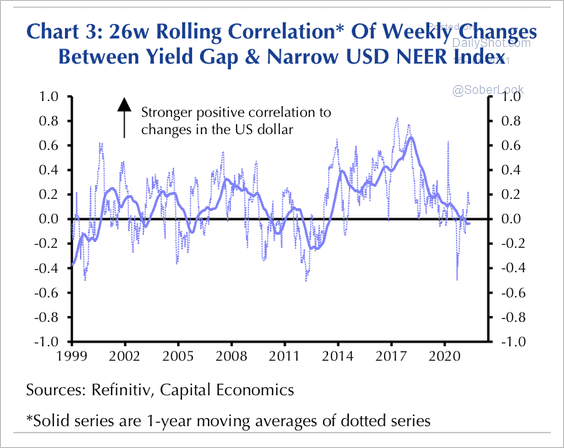 Source: Capital Economics
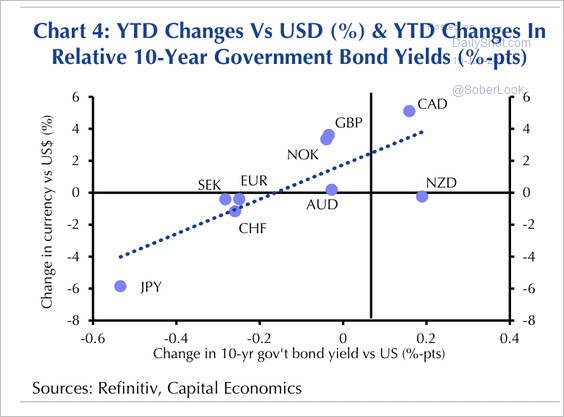 Source: Capital Economics
——————–
3. Here is a look at currency performance year-to-date.
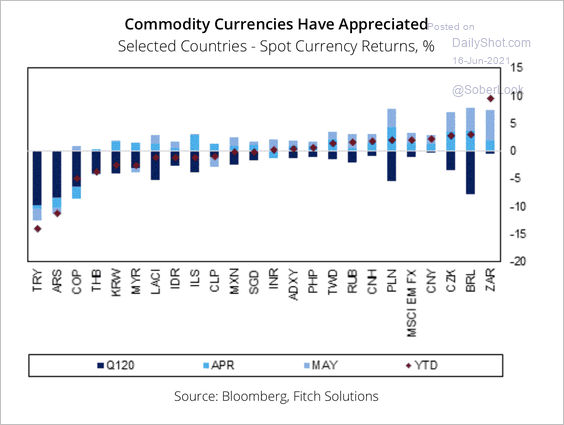 Source: Fitch Solutions Macro Research
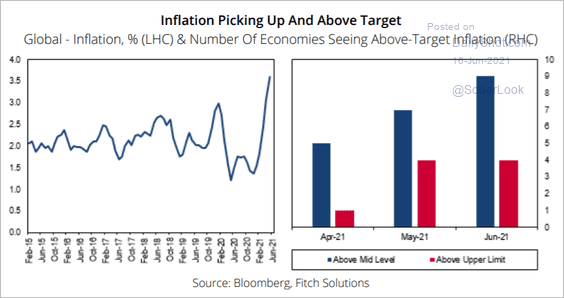
4. Inflation pressures are appearing earlier than at a similar time during the post-2008 recovery.
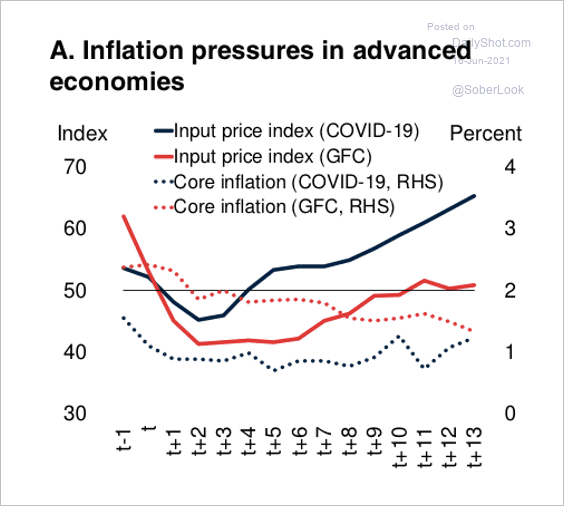 Source: World Bank Group
 Source: Fitch Solutions Macro Research
5. Food import costs hit a record this year.
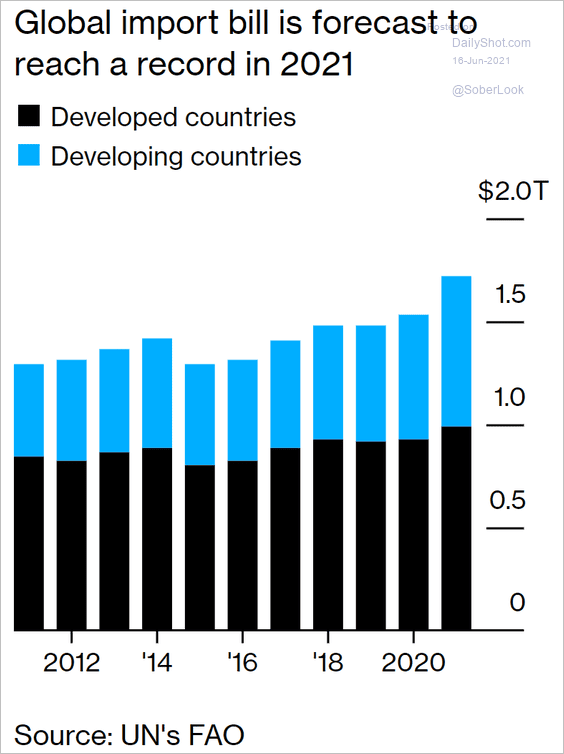 Source: @markets Read full article
6. Supply chain disruptions have been unprecedented.
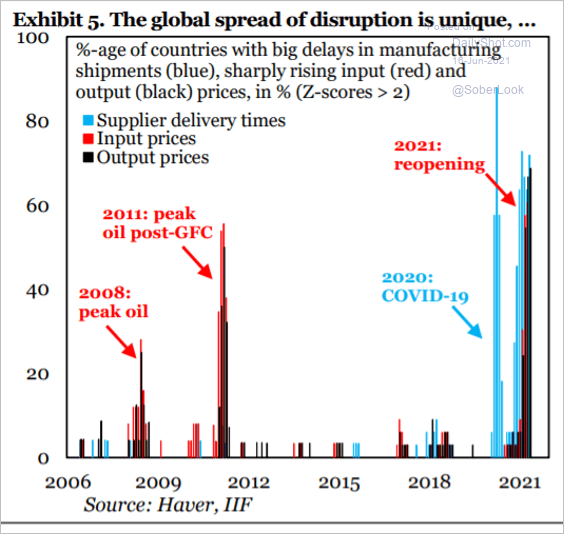 Source: IIF
——————–
Food for Thought
1. Auto workers’ wages:
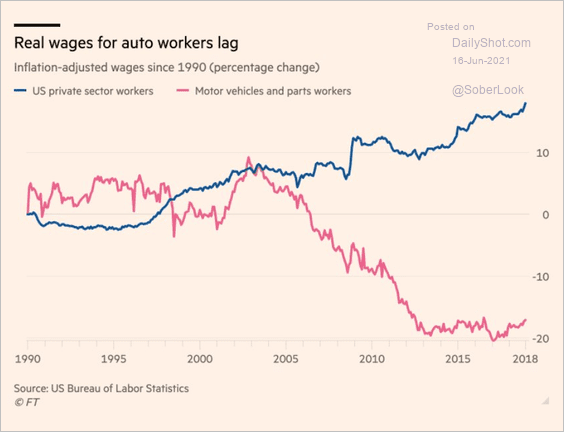 Source: @adam_tooze, @Claire_Bushey Read full article
2. Superforecasters’ odds for US minimum wage legislation:
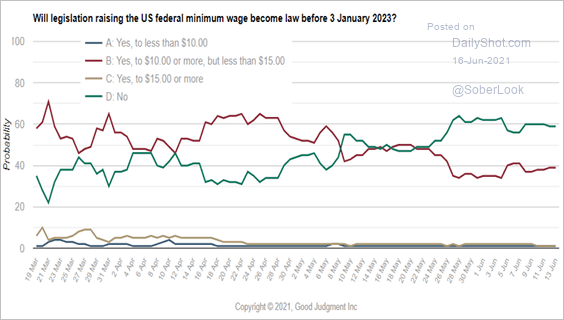 Source: Good Judgment
3. Changes in US labor force participation by age:
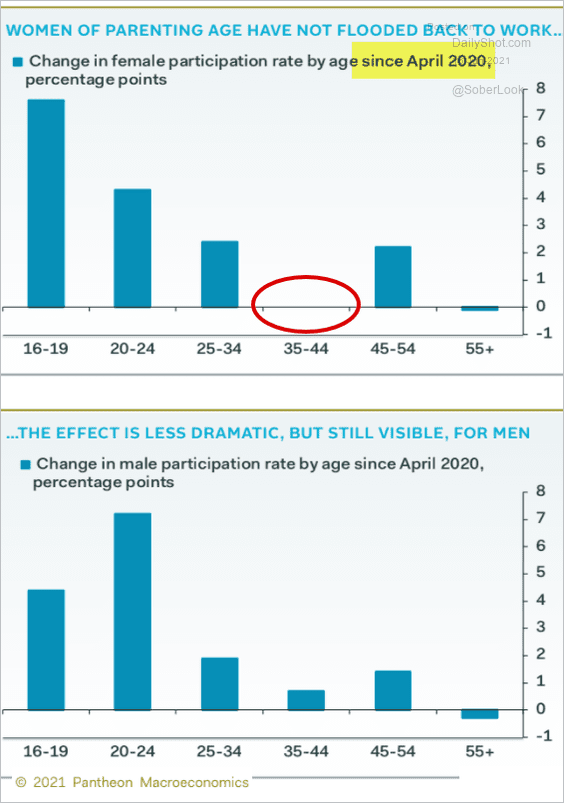 Source: Pantheon Macroeconomics
4. Semiconductor manufacturing capacity:
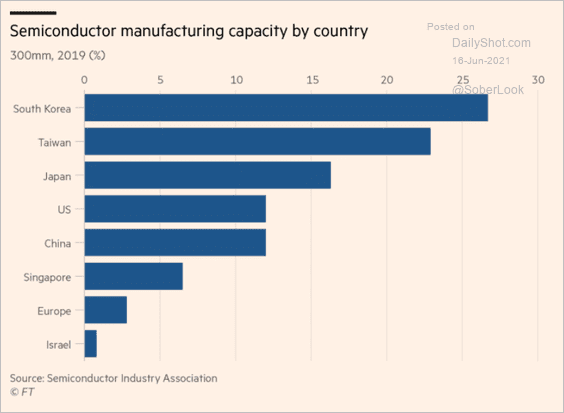 Source: @financialtimes Read full article
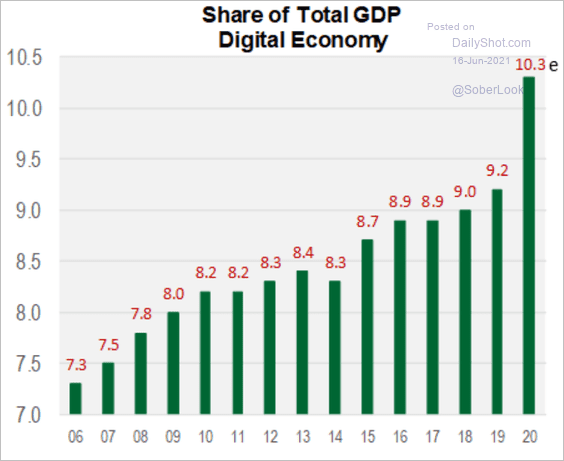
5. US digital economy share of GDP:
 Source: Cornerstone Macro
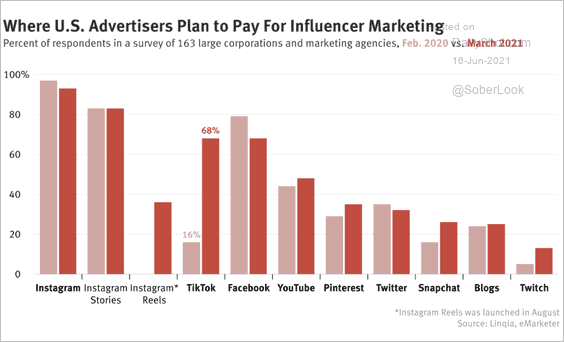
6. Influencer marketing:
 Source: The Information Read full article
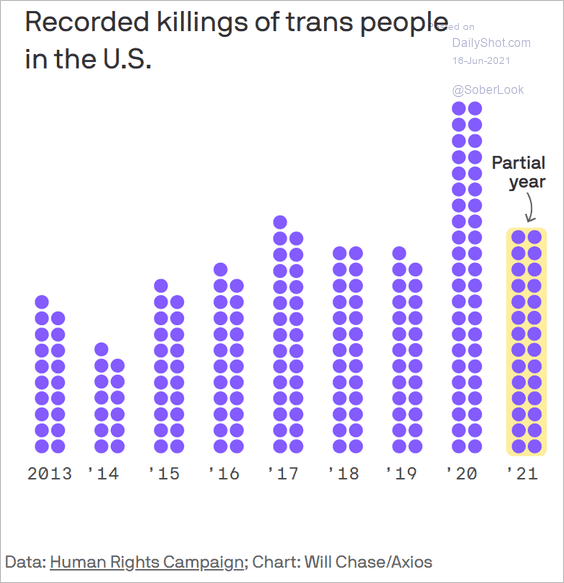
7. Killings of trans people in the US:
 Source: @axios Read full article
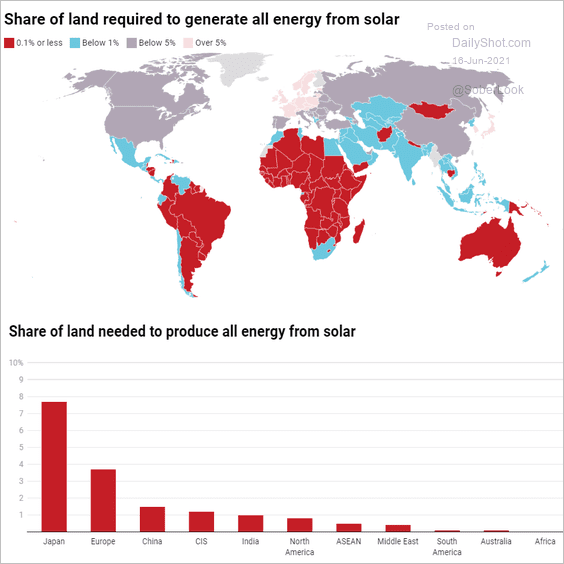
8. Share of land required to generate all energy from solar:
 Source: Carbon Tracker Initiative Read full article
9. Military spending (2 charts):
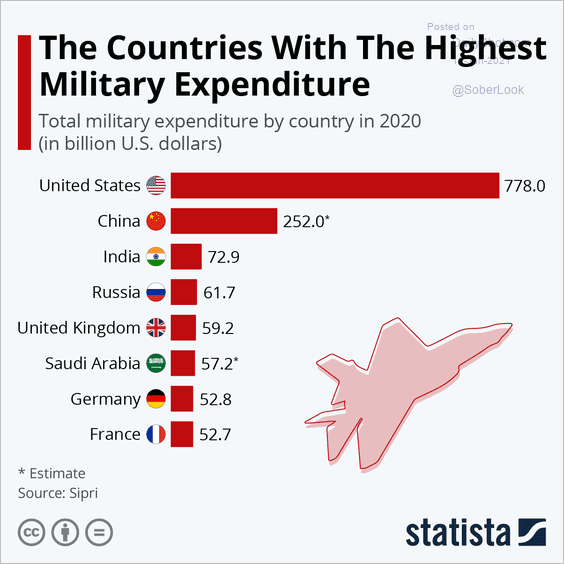 Source: Statista
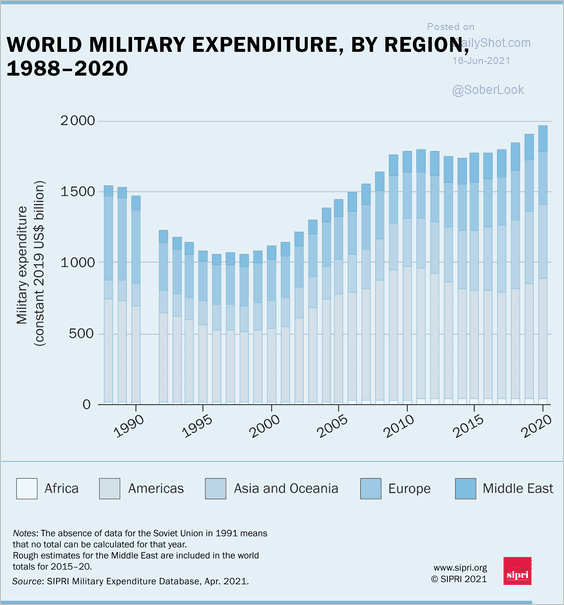 Source: @SIPRIorg
——————–
10. Grand Slam singles titles:
 Source: Statista
——————–
Back to Index