The Daily Shot: 19-Mar-20
• Rates
• Credit
• Equities
• Commodities
• Energy
• Emerging Markets
• China
• Asia -Pacific
• Europe
• Canada
• The United States
• Global Developments
• Food for Thought
Rates
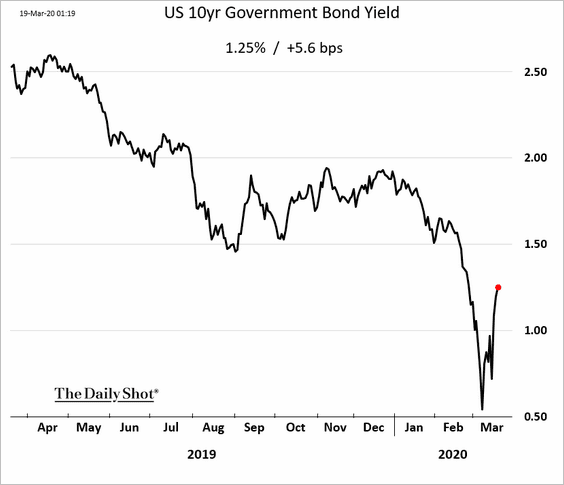
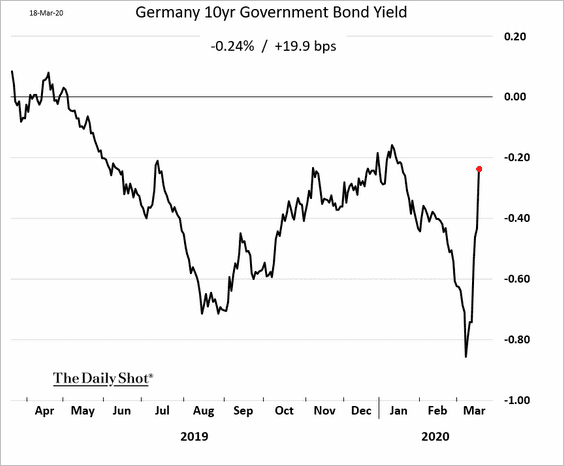
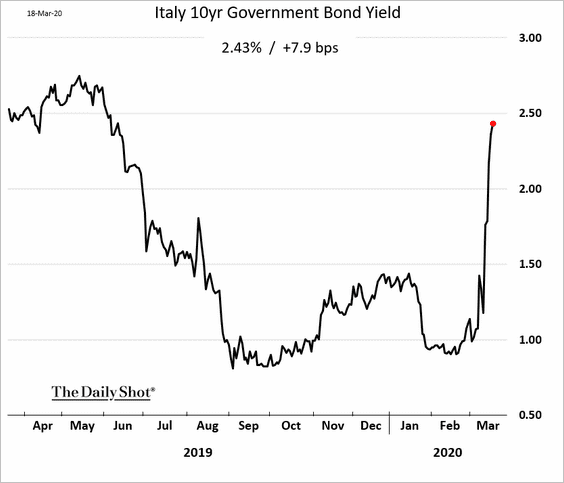
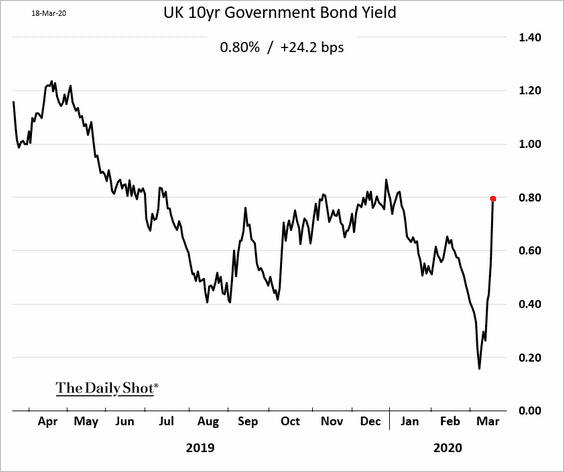
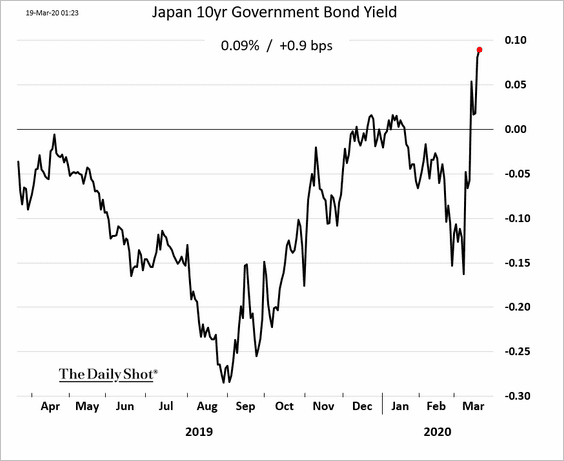
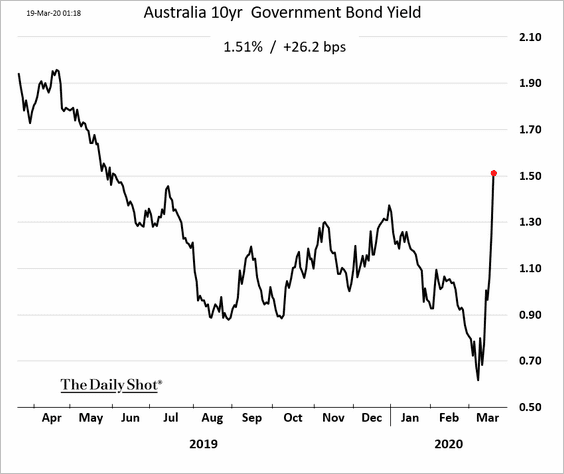
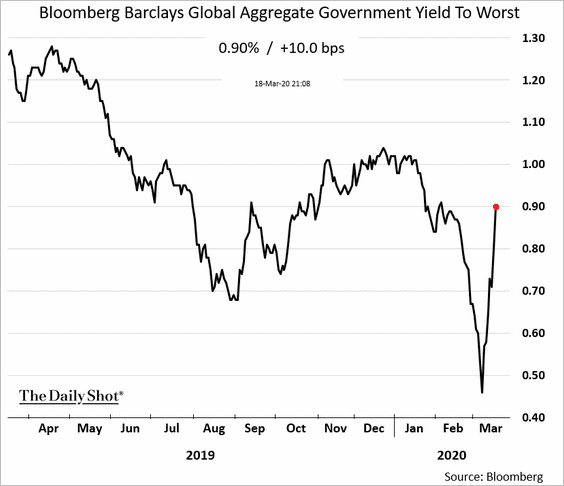
1. The realization that the current pandemic will result in a massive spending boost by governments around the world has spooked bond investors. A wave of new sovereign debt will be hitting the markets shortly. Despite the extreme risk aversion and a historic repricing in stocks and credit, government bond yields are climbing. There is nowhere for investors to hide.
• The US:
• Germany:
• Italy:
• The UK:
• Japan:
• Australia:
• Global average:
——————–
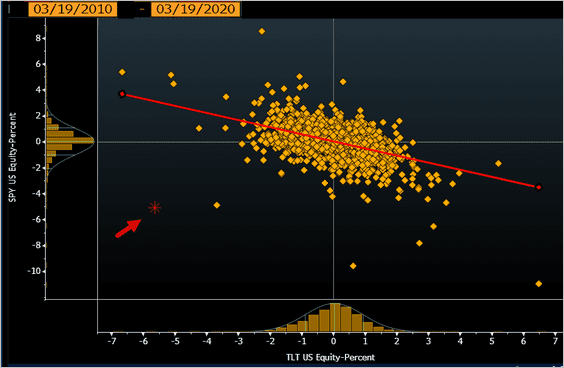
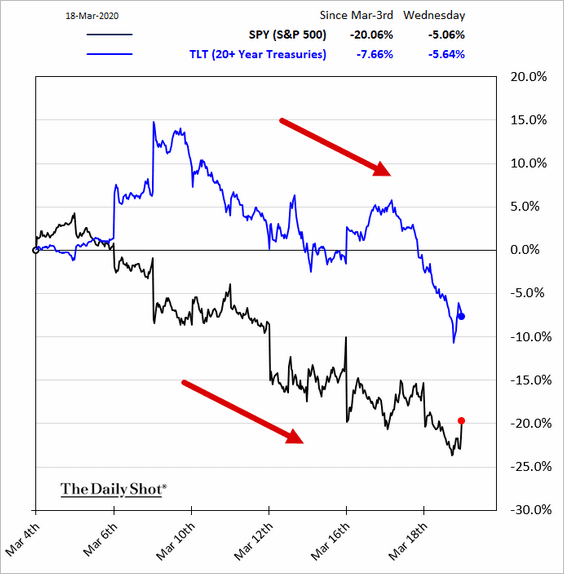
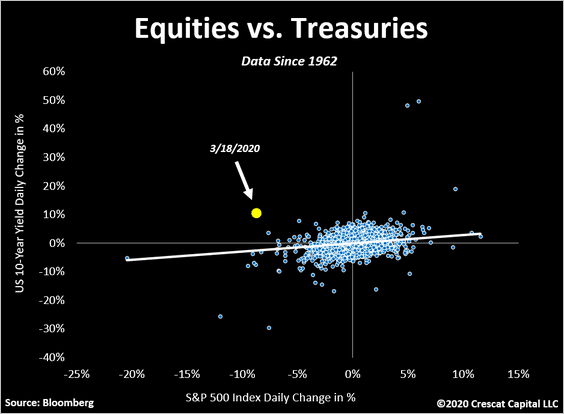
2. This sharp selloff in both bonds and stocks is highly unusual.
• SPDR S&P 500 ETF vs. iShares 20+ yr Treasury ETF:
 Source: @TheTerminal
• The 10yr Treasury yield vs. the S&P 500:
 Source: @TaviCosta
——————–
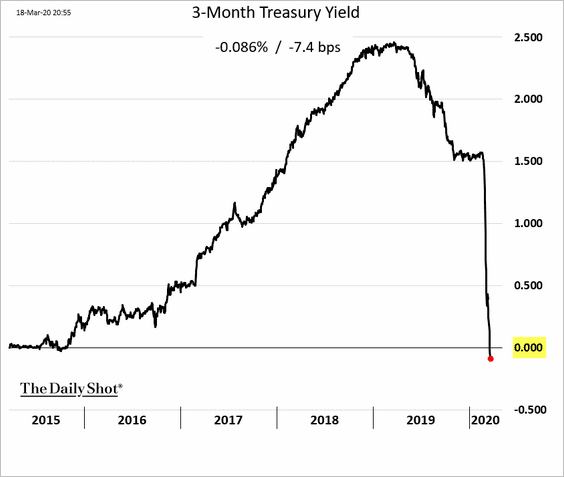
3. Investors are flooding into Treasury bills, rapidly shrinking their portfolio durations. T-Bill yields have turned negative.
4. Central banks are stepping in to absorb some of the extra supply of government paper.
 Source: ECB Read full article
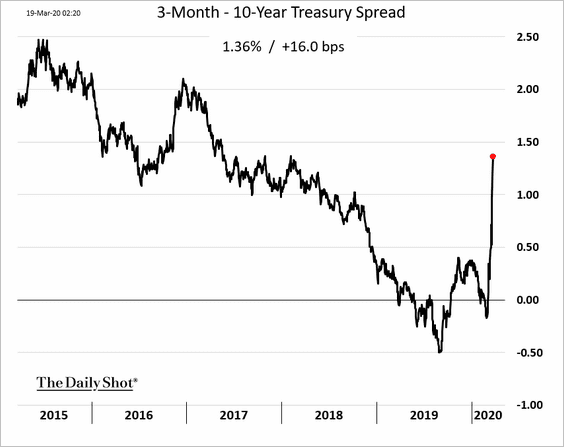
5. The Treasury curve continues to steepen.
Credit
1. The Fed will backstop money-market mutual funds after massive outflows in recent days (see chart). The memory of money market funds breaking the buck after the Lehman default haunts some Fed officials.
 Source: @WSJ Read full article
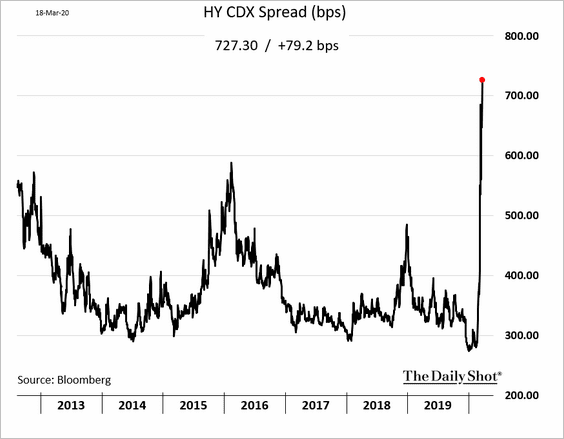
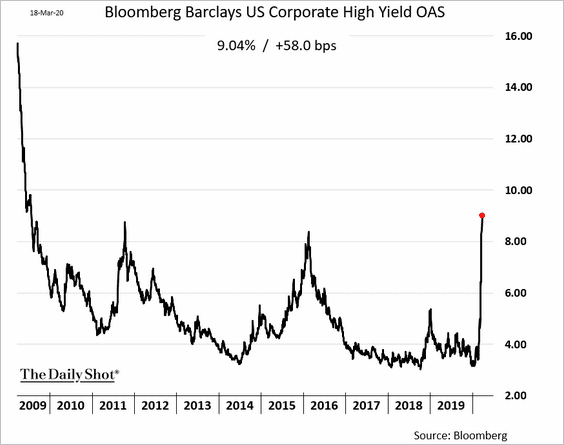
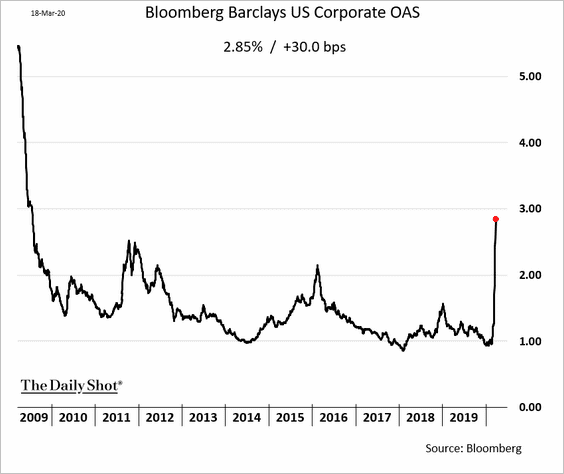
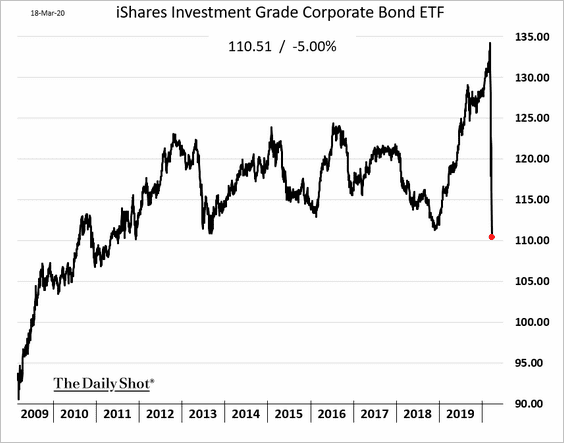
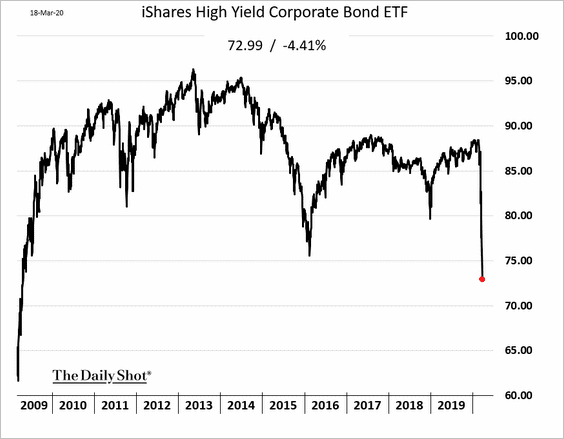
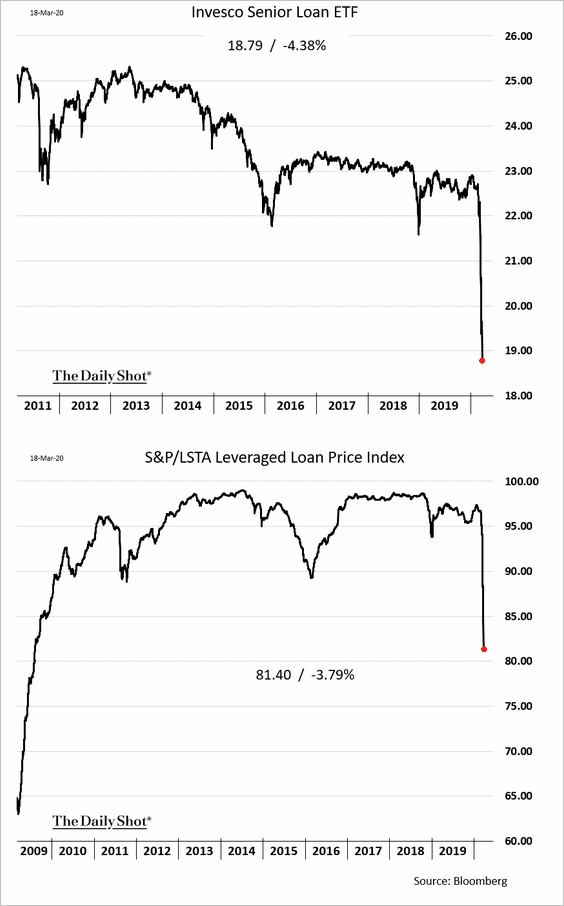
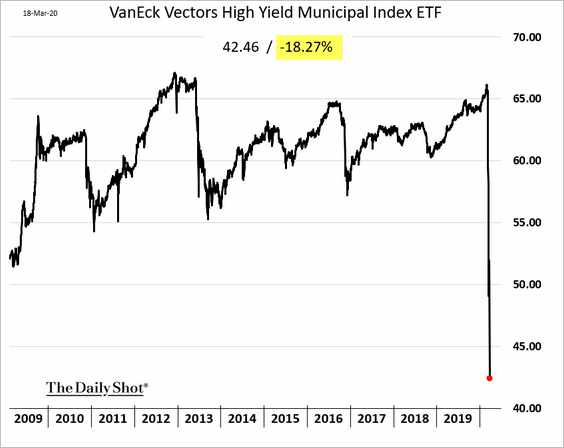
2. Credit markets are under severe pressure.
• The high-yield CDX spread:
• High-yield bond spreads:
• Investment-grade bond spreads:
• Investment-grade bond prices:
• High-yield bond prices:
• Leveraged loan prices:
• High-yield munis:
——————–
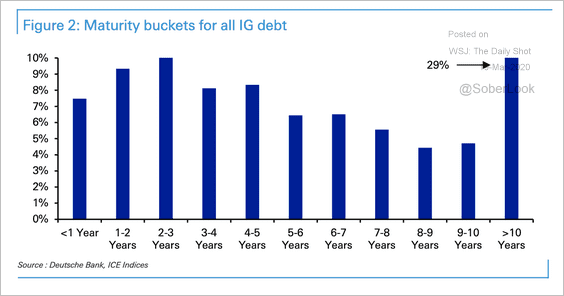
3. Investment-grade firms have lengthened their debt maturities in recent years.
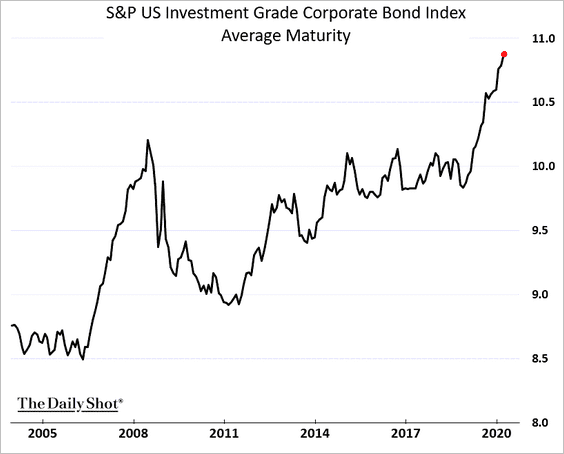
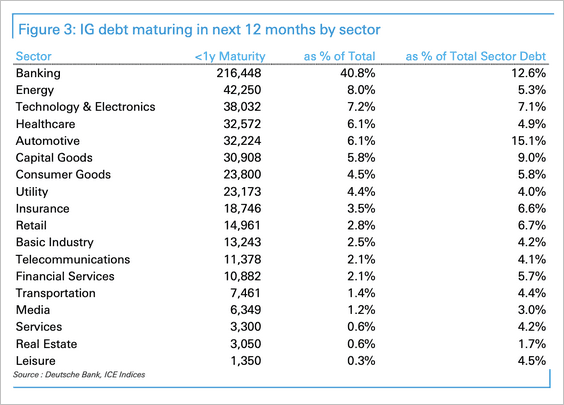
However, over $500 billion of US investment-grade (IG) corporate debt is set to mature in the next 12 months. This is around 7% of the IG market and just less than half the size of the high-yield market, according to Deutsche Bank.
 Source: Deutsche Bank Research
Here’s a sector breakdown of IG debt maturing in the next 12 months.
 Source: Deutsche Bank Research
Equities
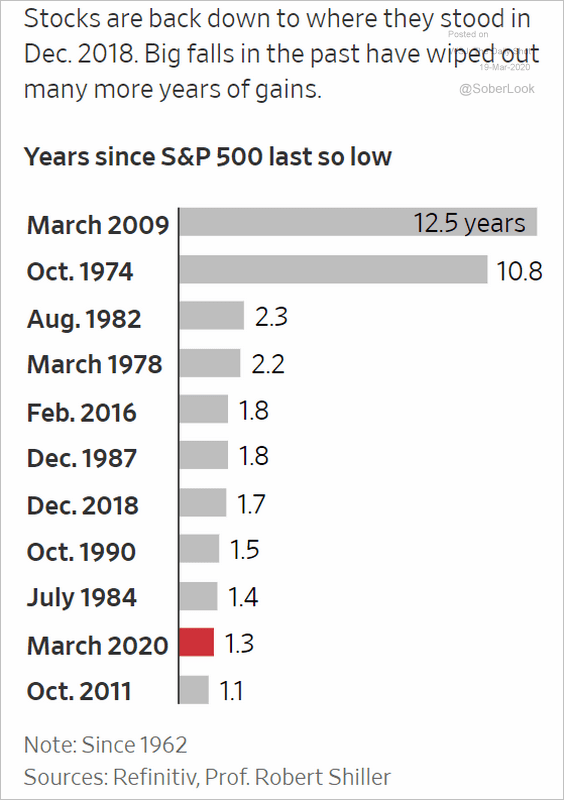
1. How many years of gains have been wiped out by the recent market drop vs. other sell-off events?
 Source: @WSJ Read full article
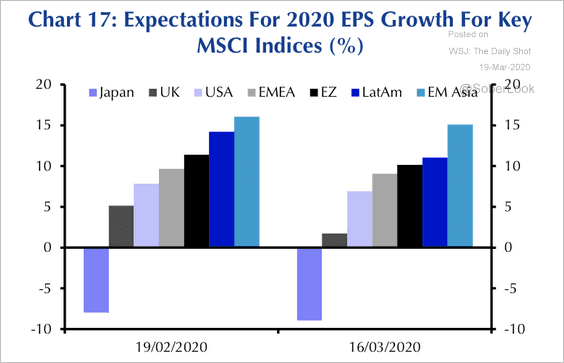
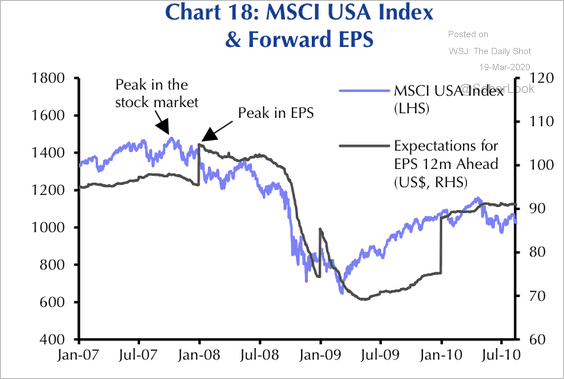
2. Expectations for earnings growth still appear consistent with a strong economic expansion this year.
 Source: Capital Economics
But it’s not unusual for earnings to be revised down with a lag. According to Capital Economics, during the 2008 crisis, earnings expectations started falling three months after the US stock market peaked.
 Source: Capital Economics
——————–
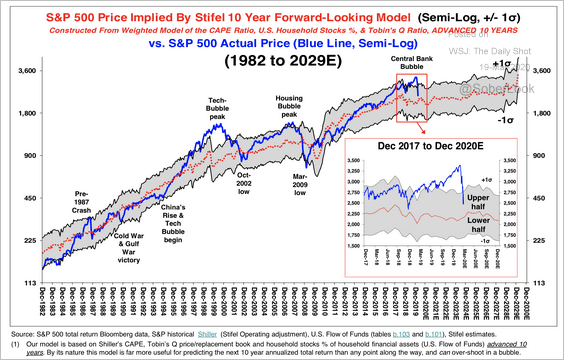
3. According to Stifel, the 2017 tax cut and low nominal bond yields are two factors that could keep the S&P 500 in the upper half of the range shown below.
 Source: Stifel
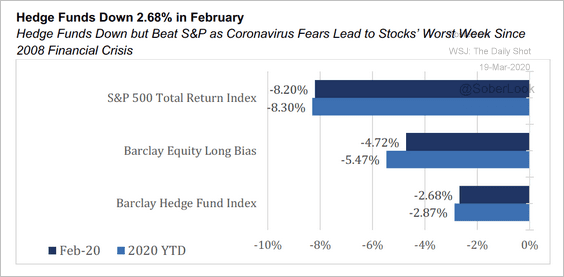
4. Hedge funds are down but are outperforming the S&P 500 so far this year.
 Source: BarclayHedge
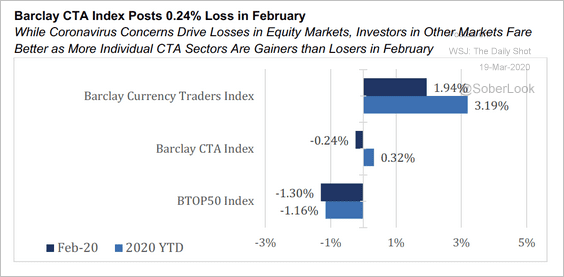
CTAs have also performed well on a relative basis during the equity market selloff.
 Source: BarclayHedge
——————–
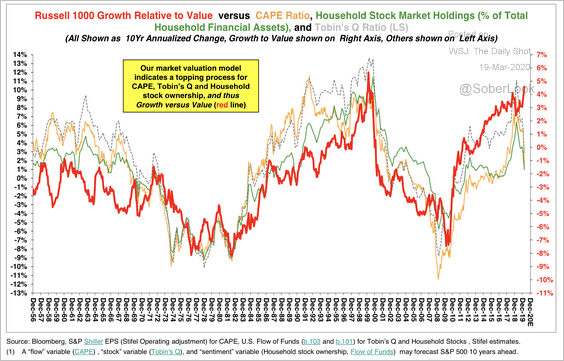
5. Growth shares may soon peak relative to value.
 Source: Stifel
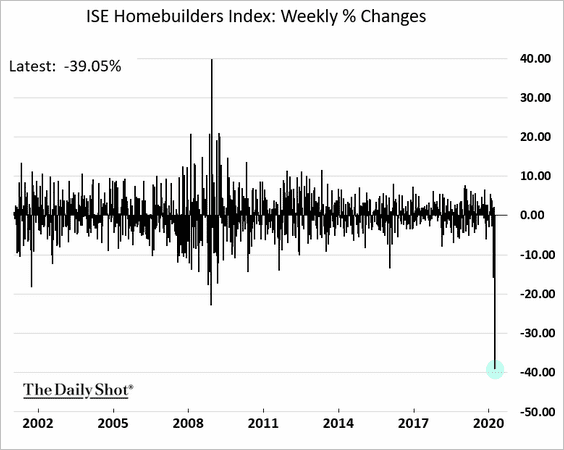
6. Shares of homebuilders are down 39% for the week.
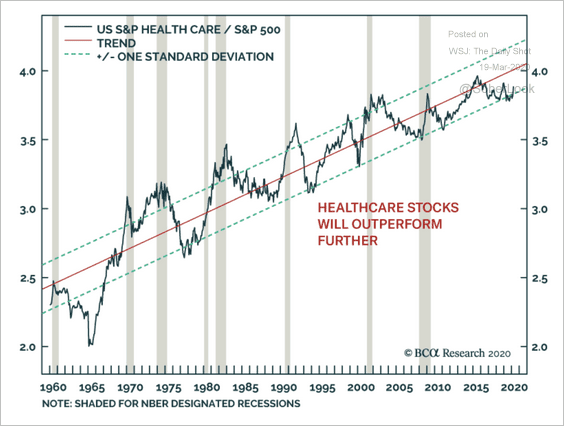
7. Healthcare is holding long-term support relative to the S&P 500.
 Source: BCA Research
Commodities
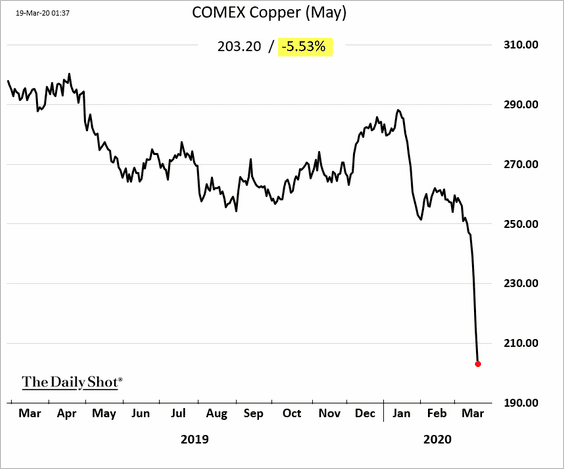
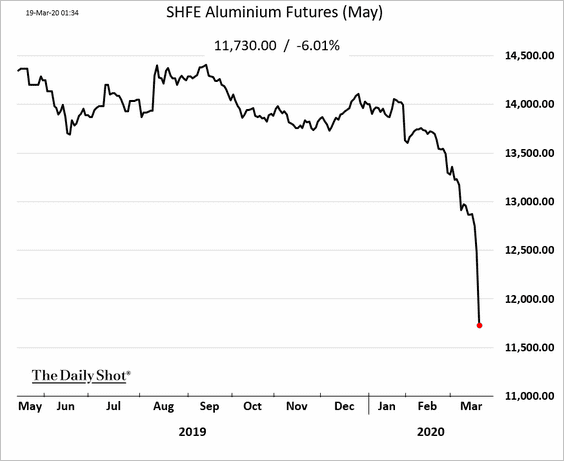
1. The rout in industrial metals has worsened.
• Copper (New York):
• Aluminum (Shanghai):
——————–
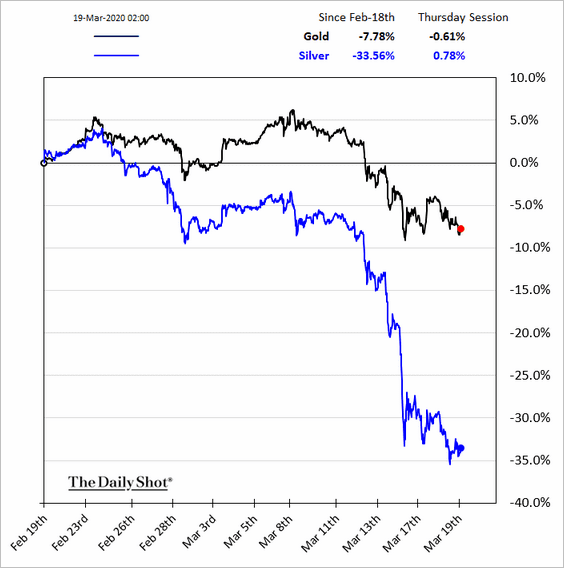
2. Precious metals continue to struggle as investors give up on safe-haven assets.
Energy
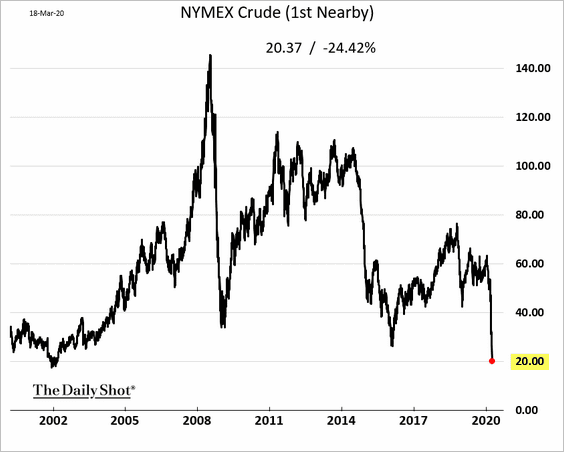
1. US crude oil fell to the lowest level in 18 years.
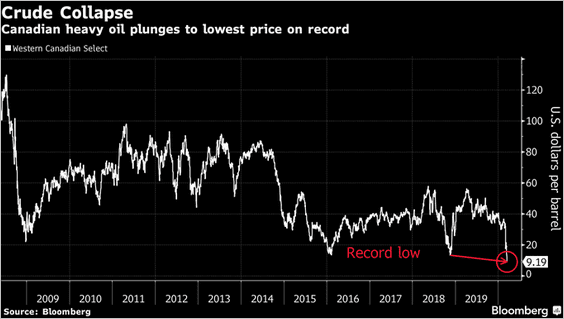
2. Canadian heavy crude hit a record low.
 Source: @StuartLWallace, @roberttuttle Read full article
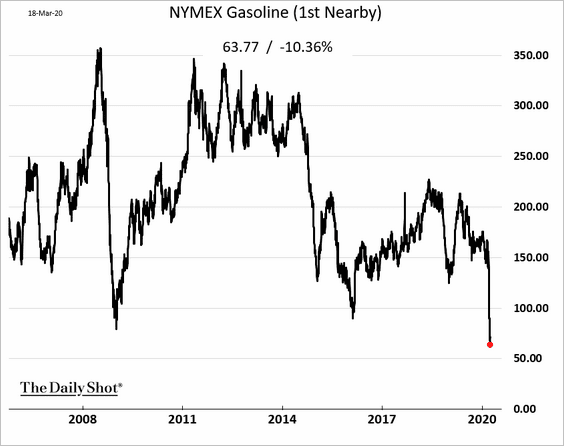
3. US gasoline futures hit the lowest level since the contract was launched in 2005.
Emerging Markets
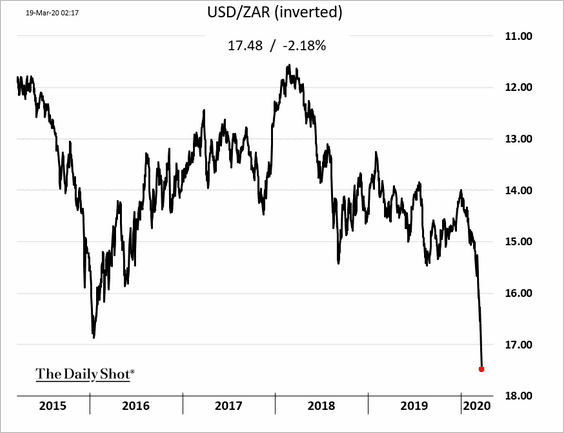
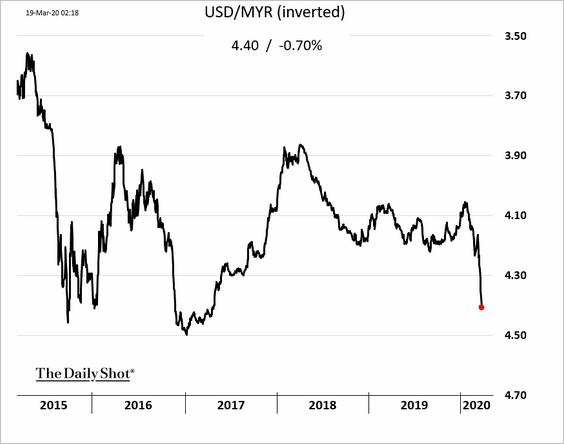
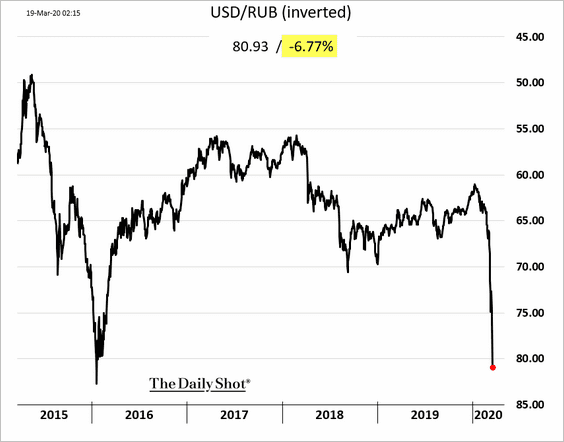
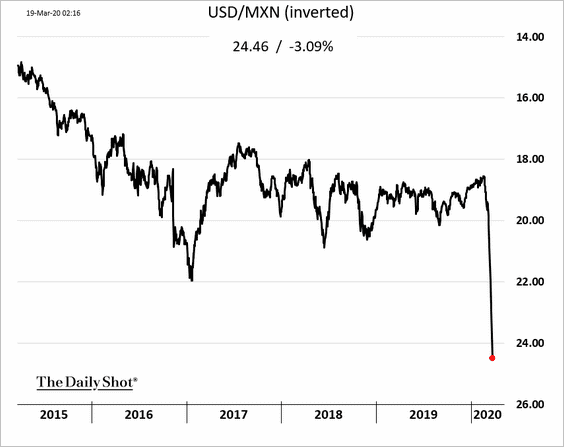
1. Global investors continue to dump EM assets, with many currencies hitting multi-year or record lows.
• The South African rand:
• The Malaysian ringgit:
• The Russian ruble:
• The Mexican peso:
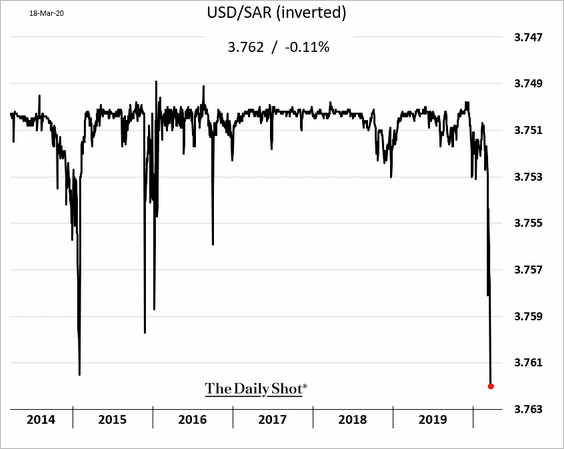
Even the Saudi riyal, which is pegged to the dollar, is under pressure.
——————–
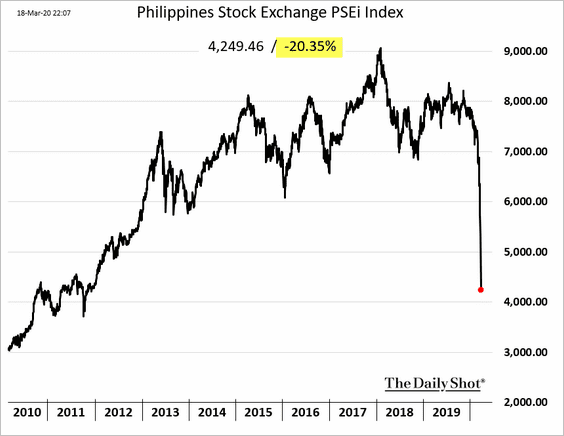
2. Equity markets are tumbling.
• The Philippines (record one-day decline after the market reopened):
• Chile:
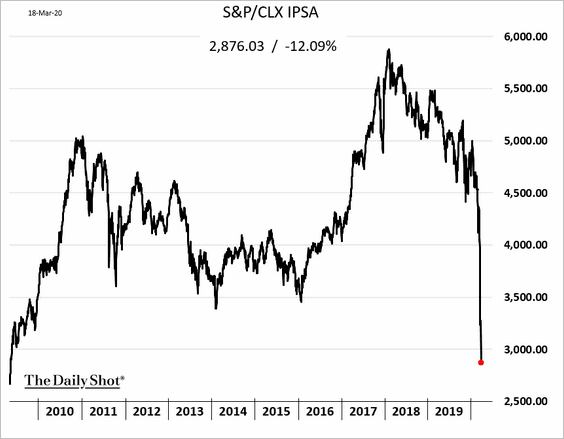
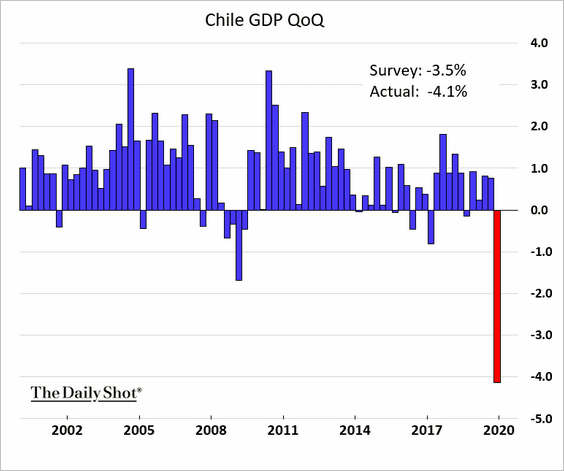
By the way, Chile’s GDP contracted sharply last quarter.
——————–
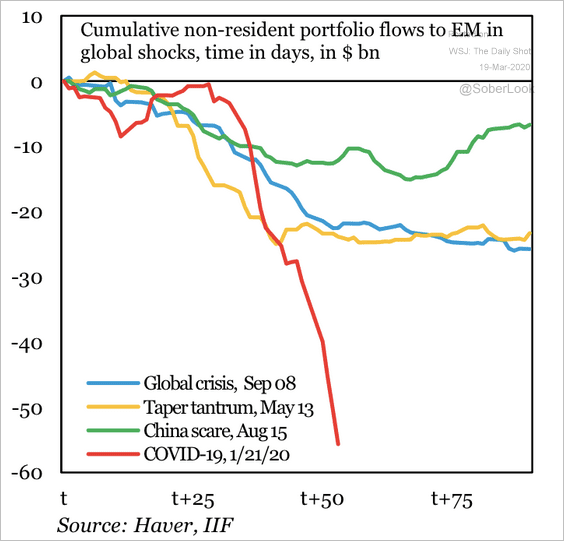
3. EM outflows are already more severe than the 2008 crisis.
 Source: IIF
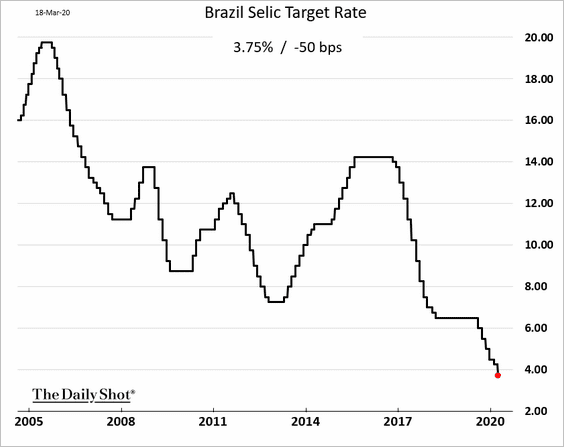
4. Brazil’s central bank cut rates by 50 bps.
China
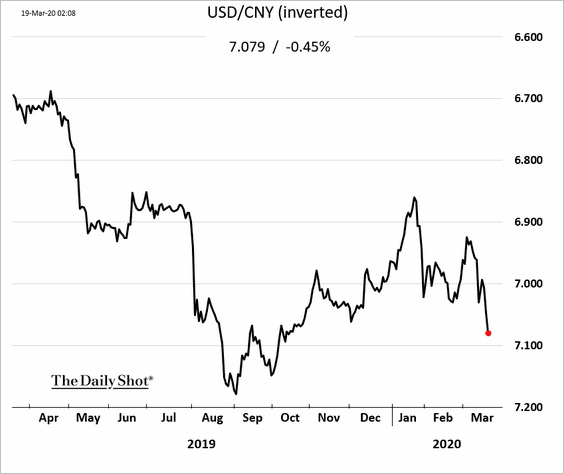
1. The renminbi is moving lower amid the EM currency rout.
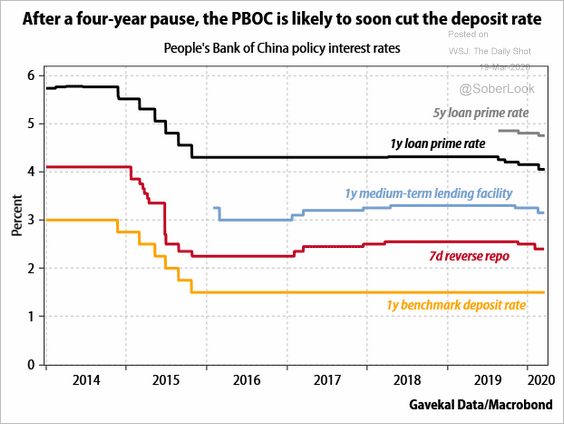
2. Will the PBoC cut deposit rates to reduce margin pressures on China’s banks?
 Source: Gavekal
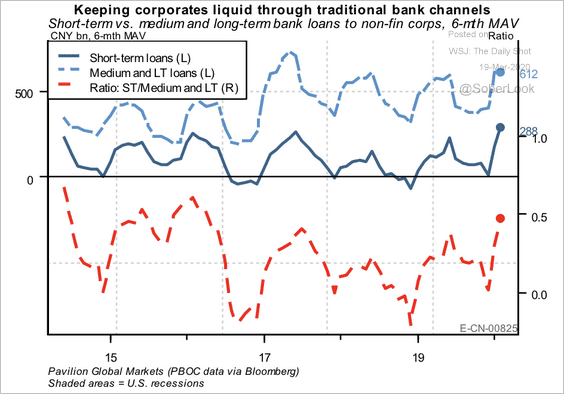
3. Short and medium-term bank loans to non-financial corporations have increased over the past two months.
 Source: Pavilion Global Markets
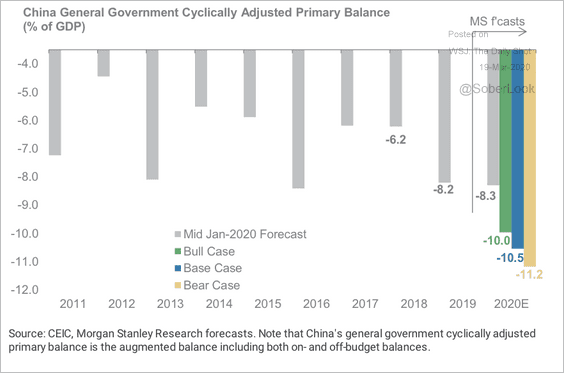
4. Morgan Stanely expects China’s fiscal deficit to increase substantially as Beijing boosts stimulus.
 Source: Morgan Stanley Research
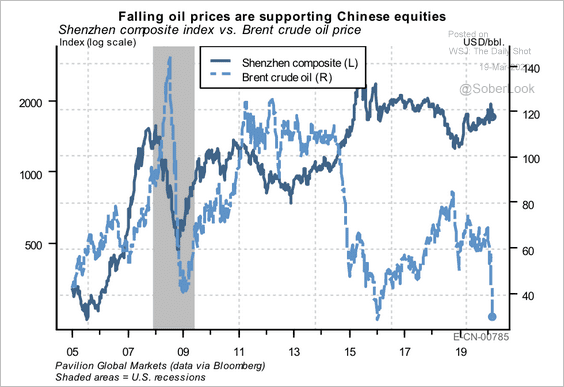
5. The sharp drop in oil prices relieves stress on China’s balance of payments, which could be a positive for on-shore equities. (China is a net oil importer).
 Source: Pavilion Global Markets
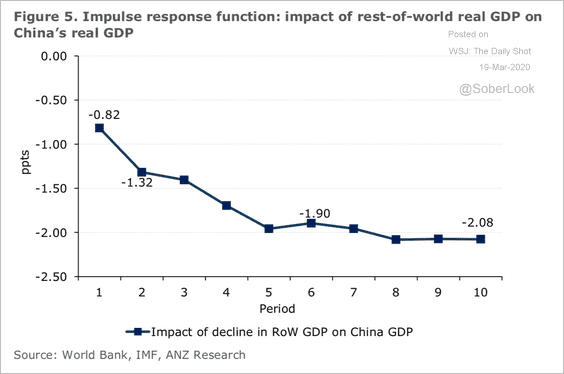
6. How does the rest of the world affect China’s GDP growth? This graph illustrates the impact of a 1% drop in the “rest of the world’s” GDP.
 Source: ANZ Research
7. Wuhan had a day with no new infections.
 Source: @business Read full article
Asia -Pacific
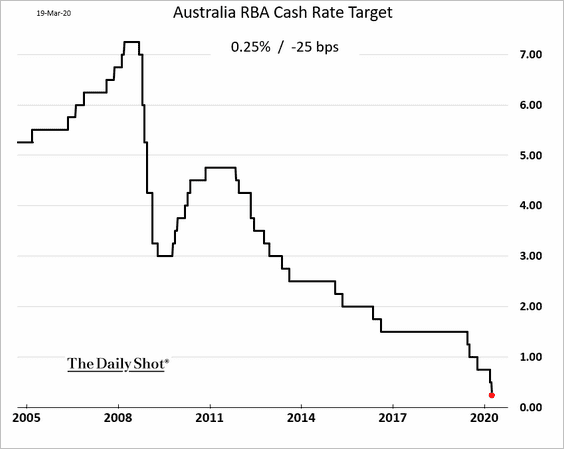
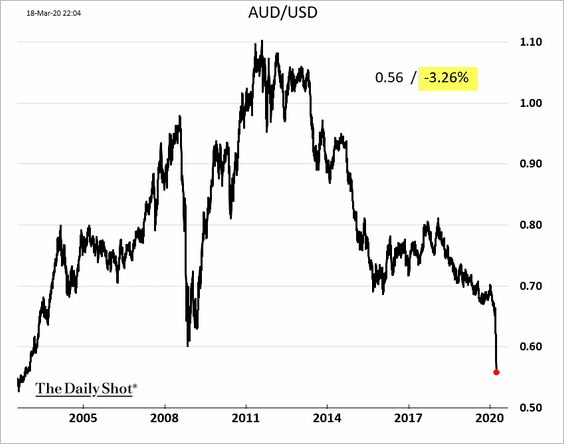
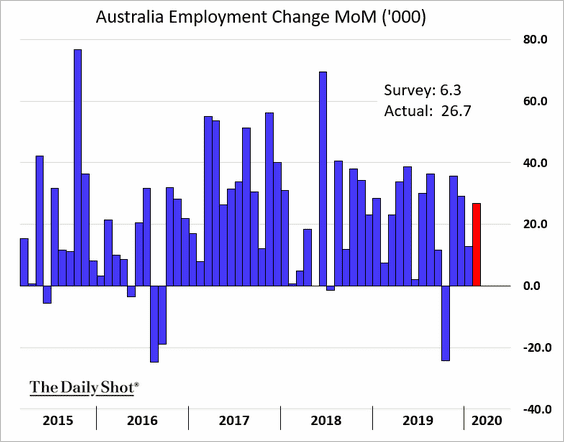
1. Let’s begin with Australia.
• The RBA cut rates to 25bps.
• The Aussie dollar hit the lowest level since 2002.
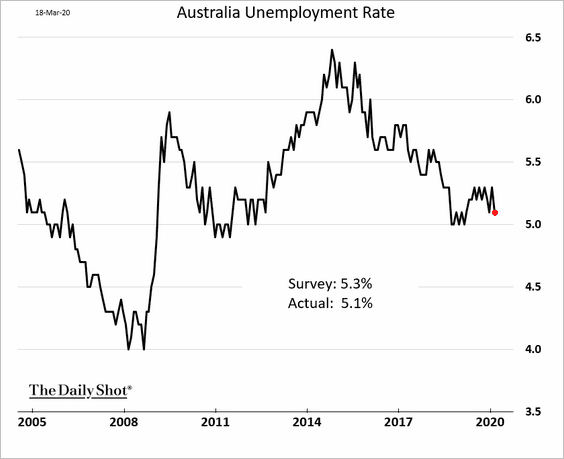
• The February employment report surprised to the upside, although most job gains were in part-time positions.
• The unemployment rate ticked lower.
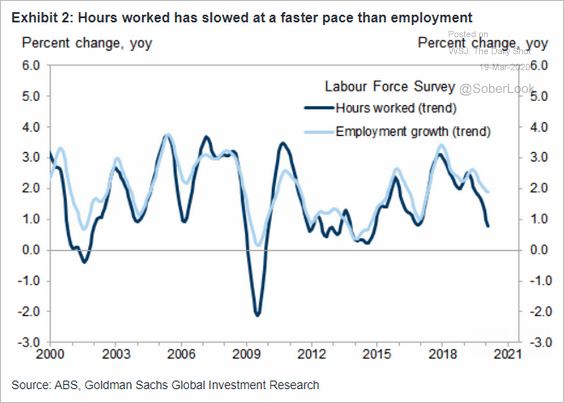
• Hours worked have been declining.
 Source: Goldman Sachs
——————–
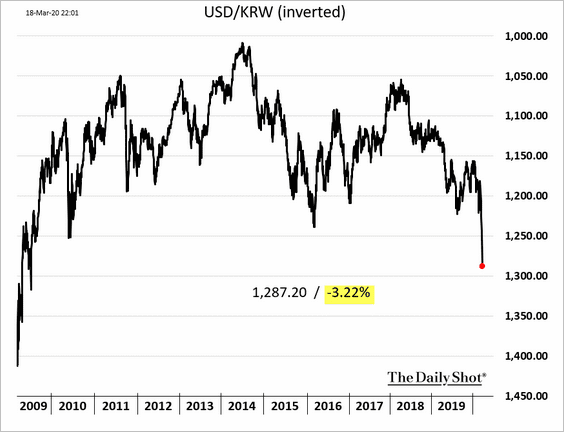
2. The South Korean won is at the lowest level in over ten years.
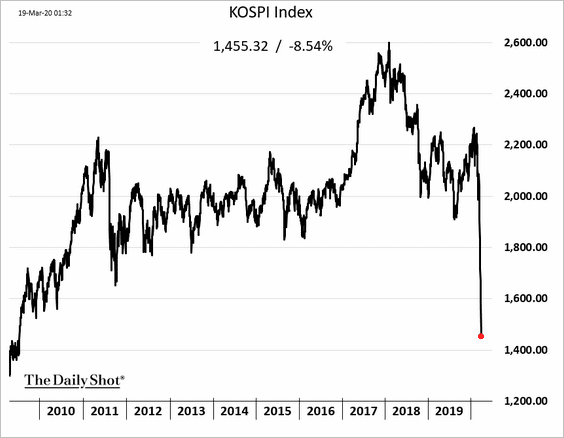
South Korea’s stock market selloff has wiped out a decade of gains.
——————–
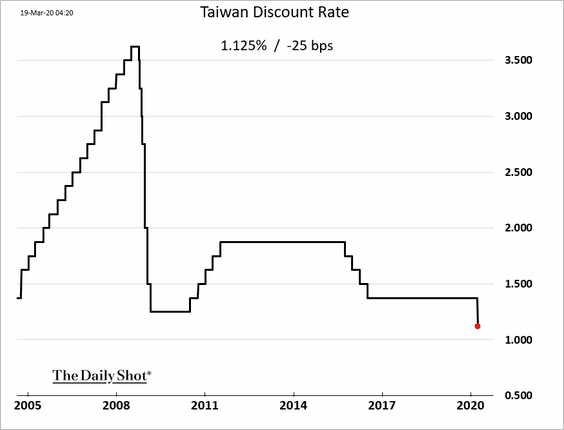
3. Taiwan’s central bank cut rates.
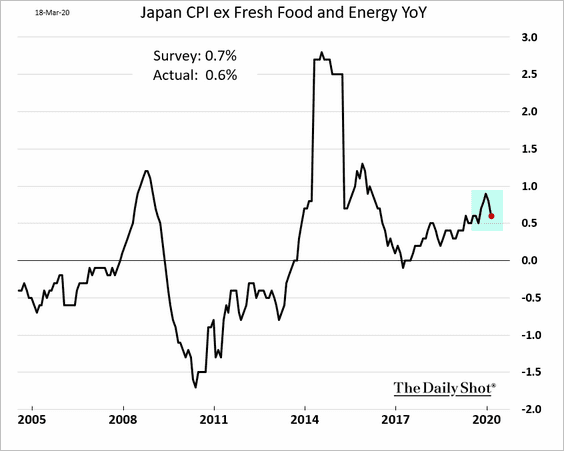
4. Japan’s CPI is rolling over.
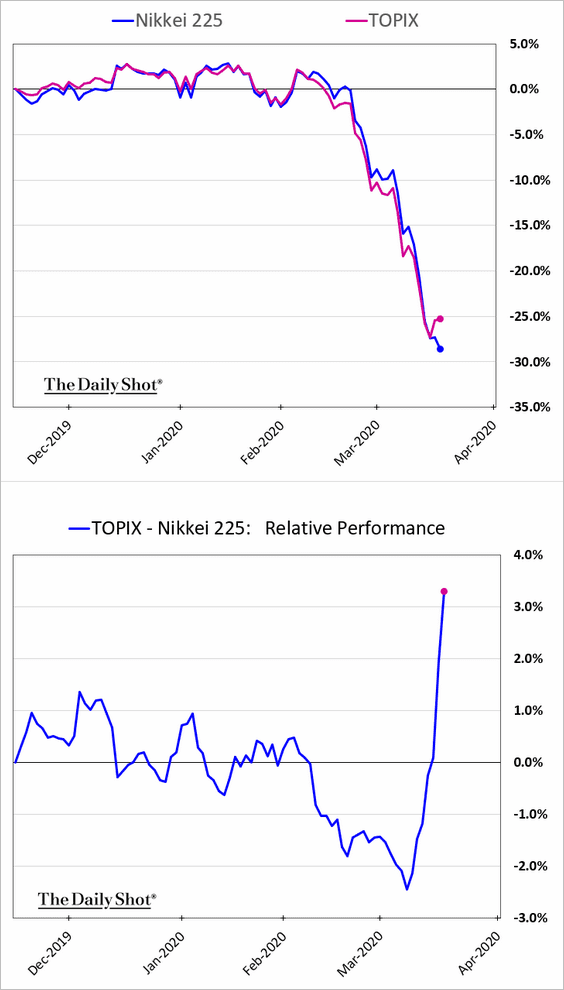
5. Japan’s TOPIX index is outperforming the Nikkei 225 as the BoJ steps up equity ETF purchases.
 h/t Min Jeong Lee, @TheTerminal
Europe
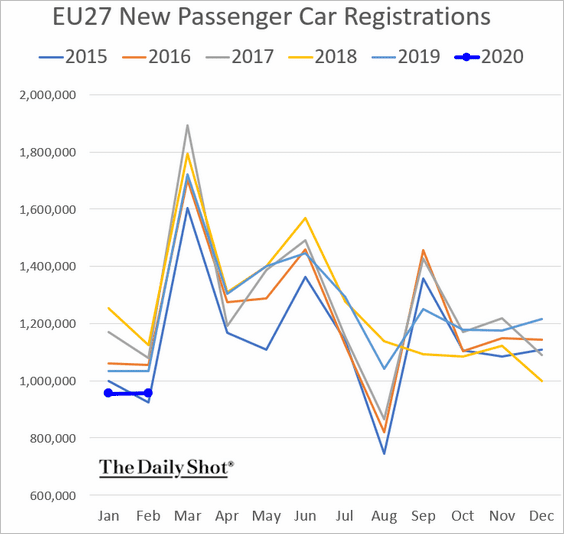
• EU car registrations remain soft.
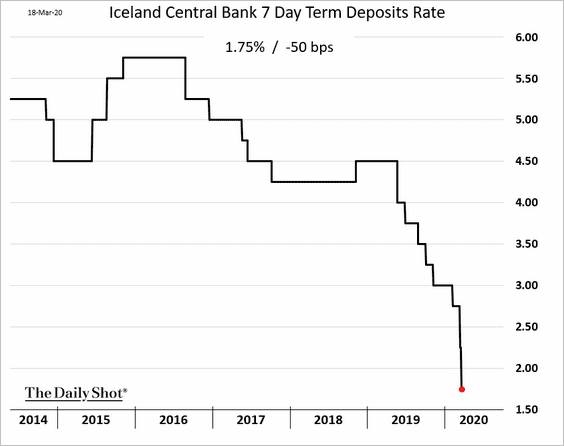
• Iceland’s central bank cut rates again.
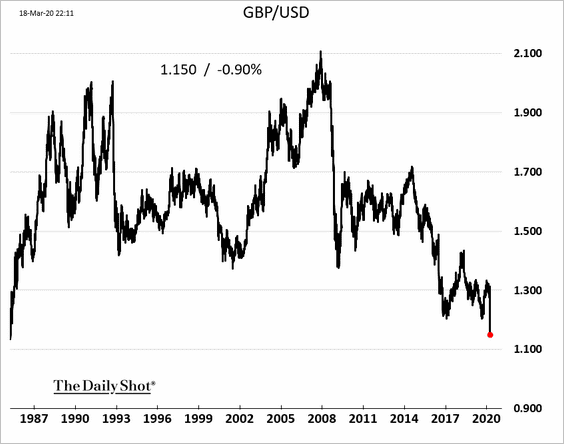
• The British pound hit the lowest level (vs. USD) since 1985.
 Source:
Canada
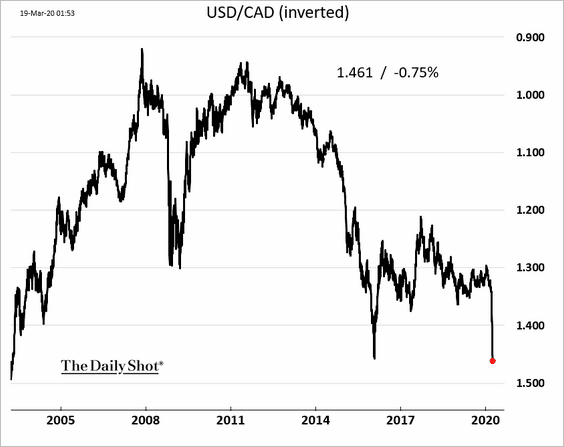
1. The loonie hit a multi-year low.
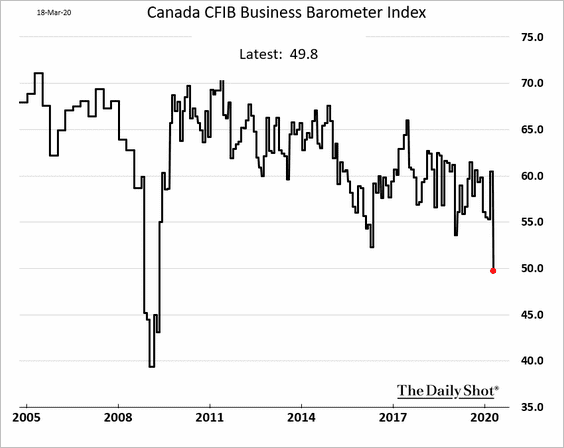
2. Small business sentiment deteriorated sharply this month.
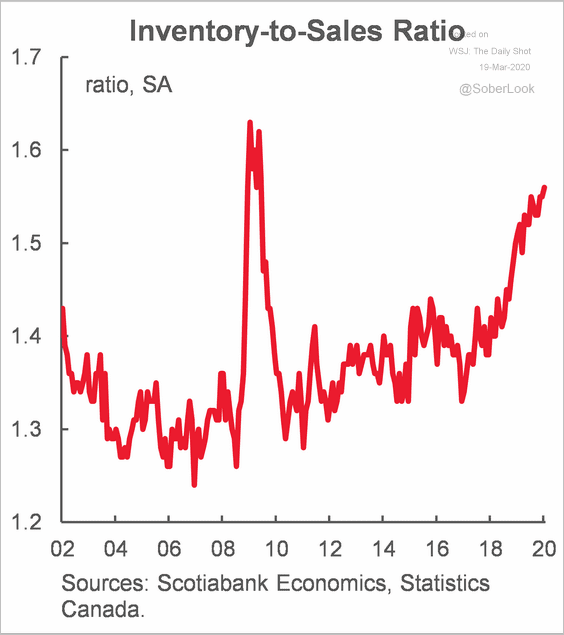
3. The inventory-to-sales ratio keeps climbing.
 Source: Scotiabank Economics
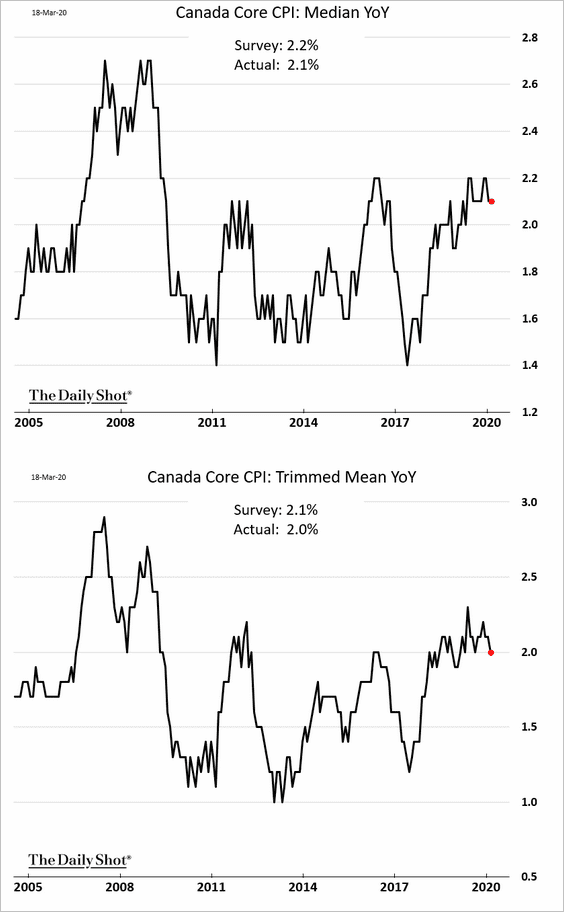
4. Inflation is rolling over.
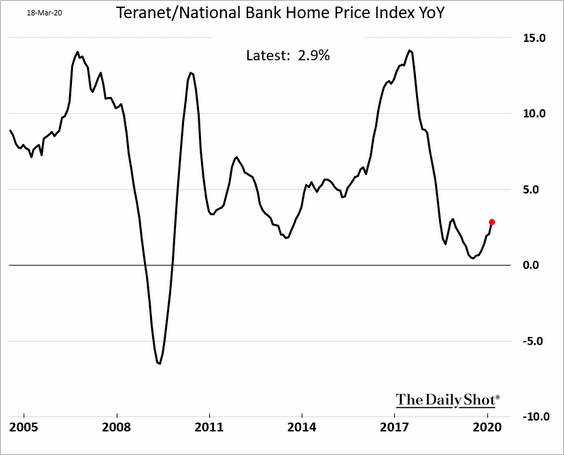
5. Home price appreciation has been improving.
The United States
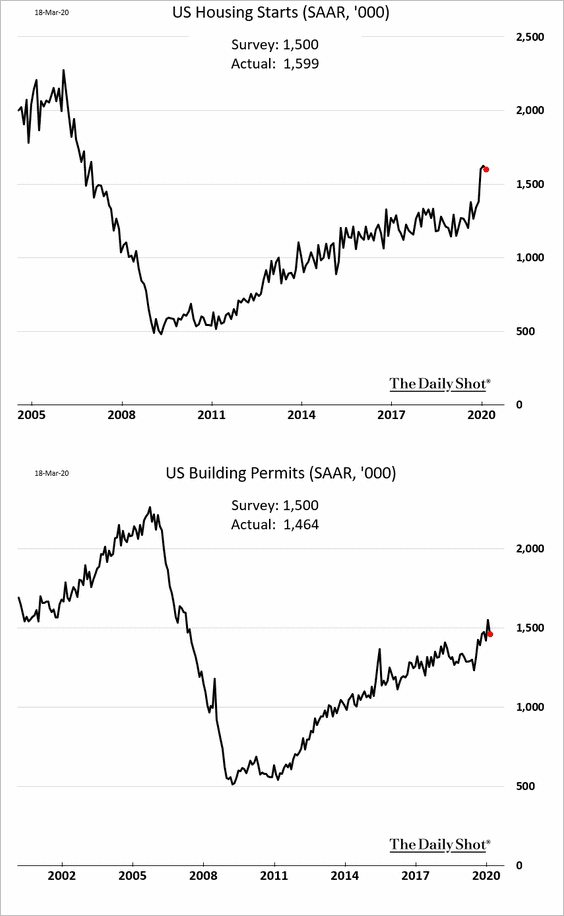
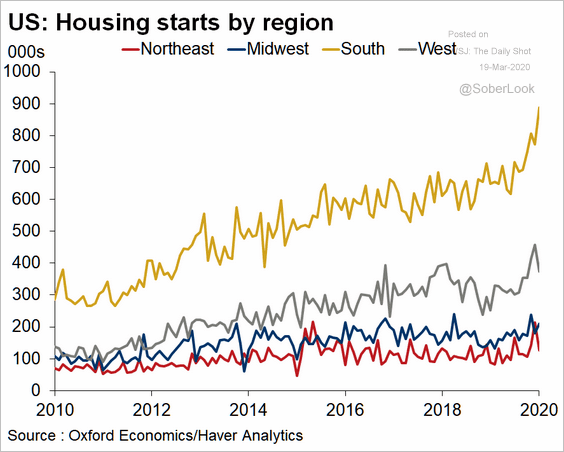
1. Housing starts held up well last month, driven by gains in the South. We will probably see a substantial decline in March.
 Source: Oxford Economics
——————–
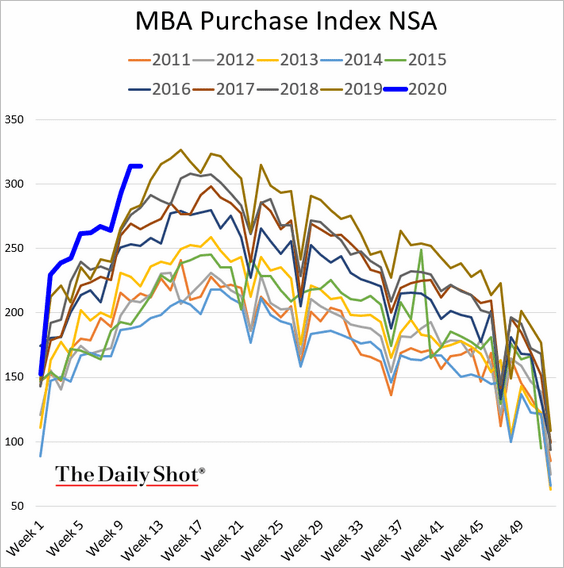
2. Mortgage applications for house purchase remain strong.
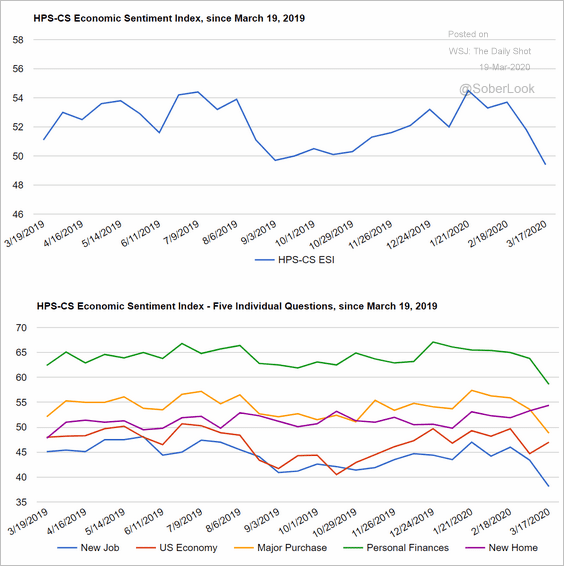
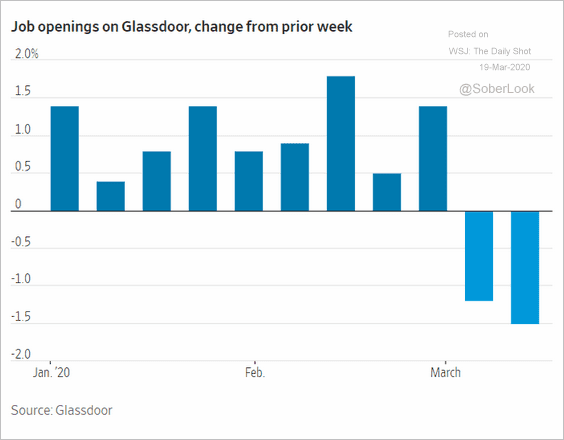
3. Consumer sentiment is starting to deteriorate as the number of coronavirus cases climbs (second chart), and the job market stumbles (third chart).
 Source: @HPS_CS, @HPSInsight
 Source: The New York Times Read full article
 Source: @WSJ Read full article
——————–
4. The selloff in credit markets has been a key contributor to tighter US financial conditions.
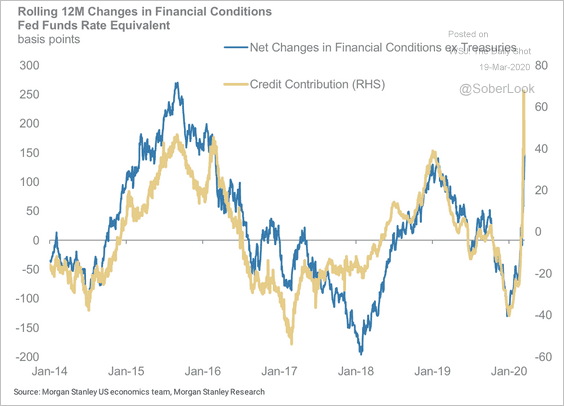 Source: Morgan Stanley Research
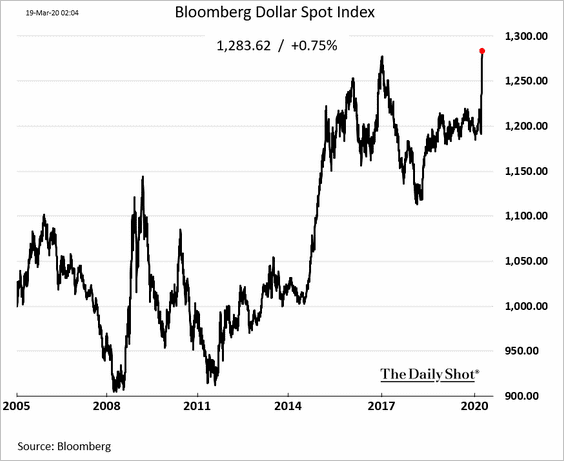
The rising US dollar has also been a factor in tightening financial conditions.
Global Developments
1. Correlations across global equity markets spike.
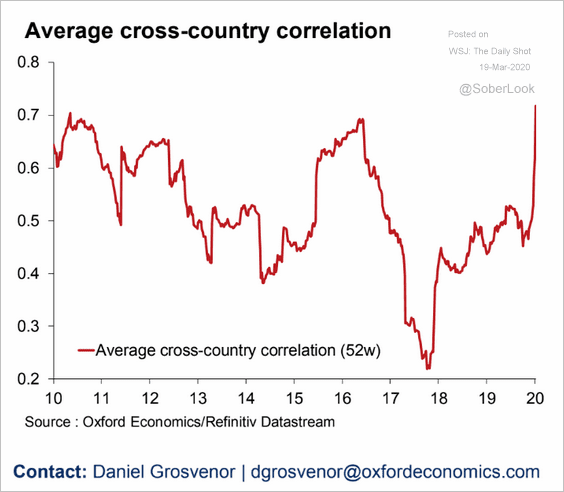 Source: Oxford Economics
2. Online search data show a massive drop in consumer activity.
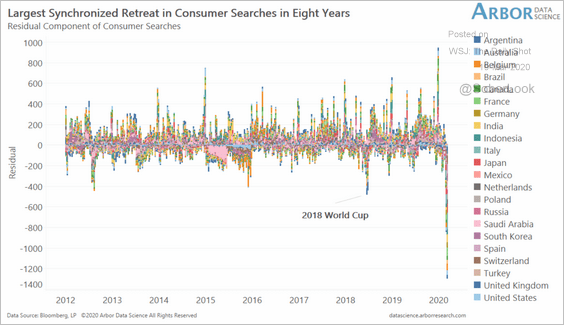 Source: Arbor Research & Trading
——————–
Food for Thought
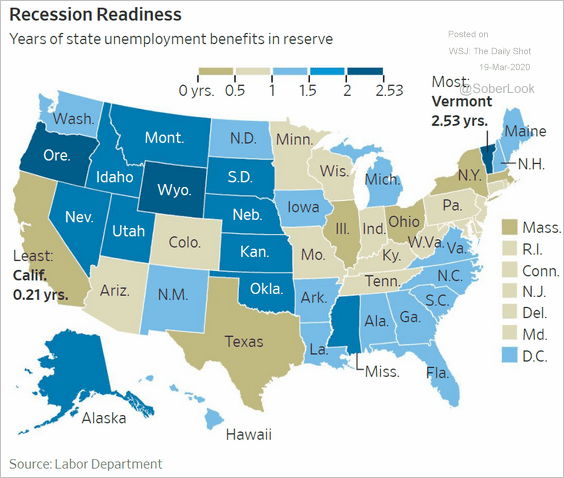
1. States’ recession readiness:
 Source: @WSJ Read full article
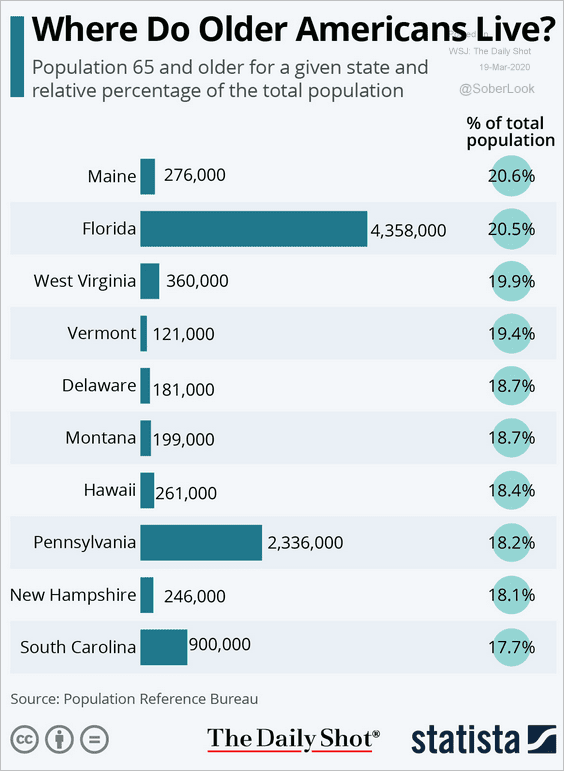
2. Where do older Americans live?
 Source: Statista
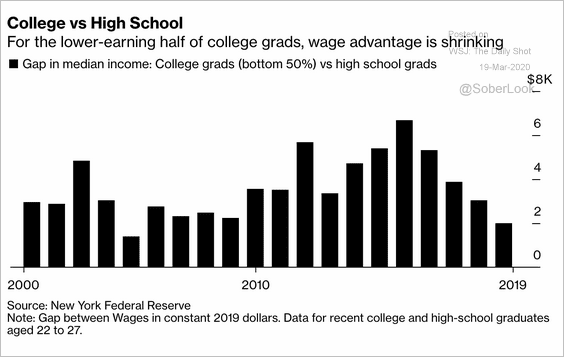
3. High-school vs. college graduates:
 Source: @business Read full article
4. Americans’ views on the coronavirus:
 Source: Pew Research Center Read full article
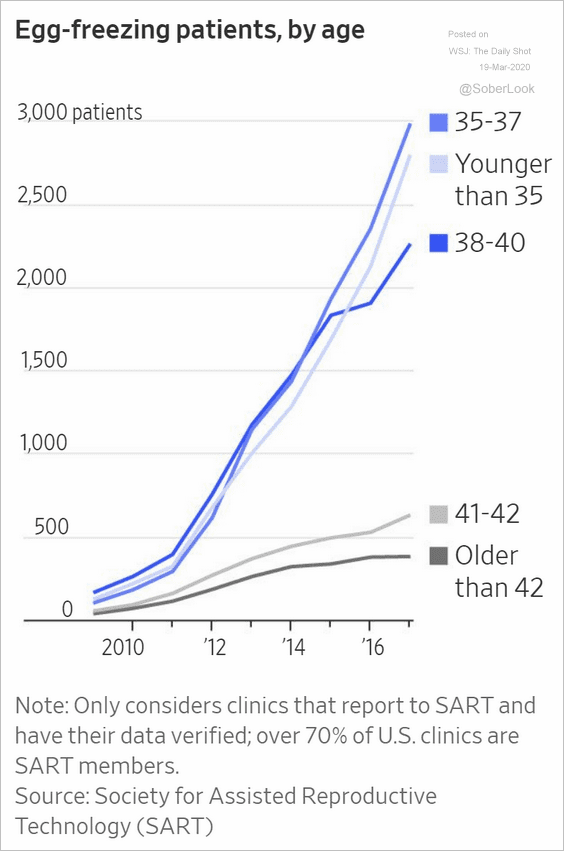
5. Egg-freezing patients:
 Source: @WSJ Read full article
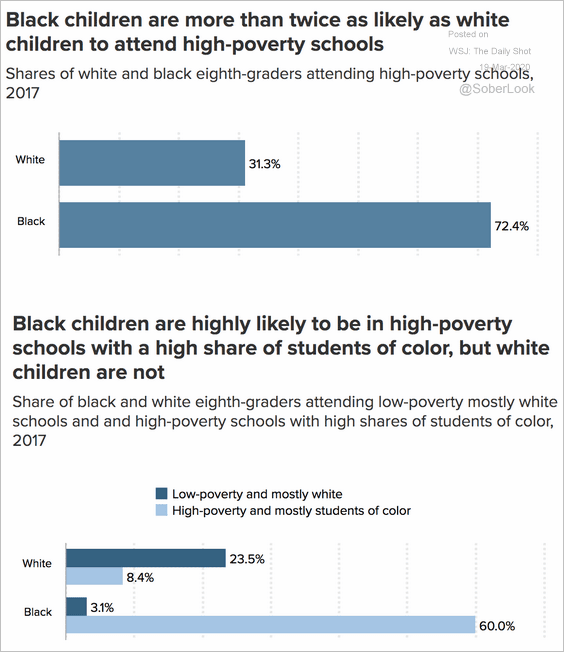
6. High-poverty schools:
 Source: @EconomicPolicy Read full article
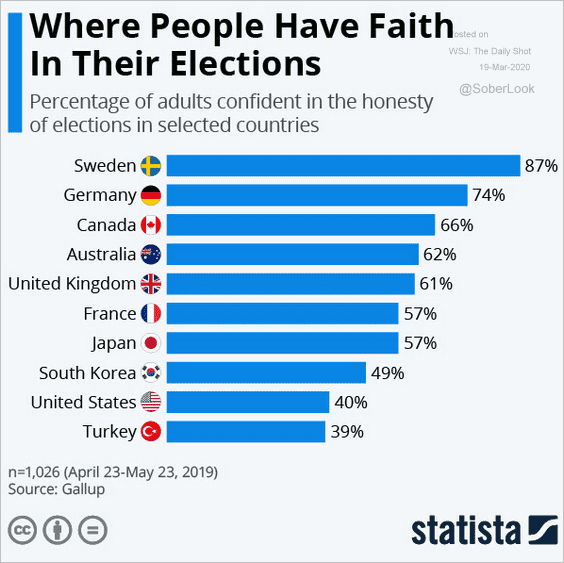
7. Faith in elections:
 Source: Statista
8. Interest in purchasing a gun:
 Source: Google Trends
——————–
