
The Daily Shot: 20-May-20
• The United States
• The United Kingdom
• The Eurozone
• Europe
• China
• Emerging Markets
• Commodities
• Energy
• Equities
• Rates
• Global Developments
• Food for Thought
The United States
1. Let’s begin with the housing market.
• Residential construction activity slowed sharply last month.
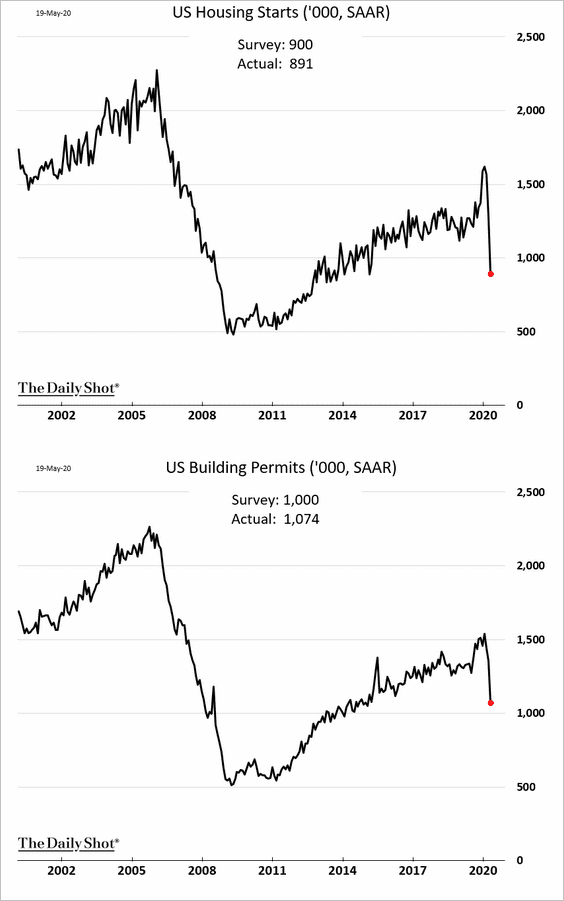
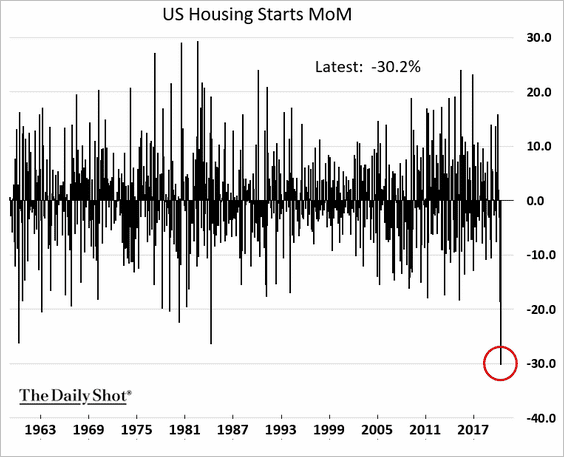
The decline in housing starts was the highest on record.
Single-family building permits decreased faster than multi-family housing.
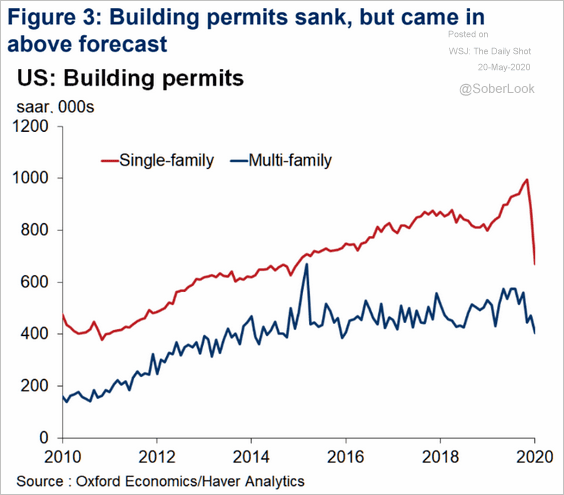 Source: Oxford Economics
• Given the persistent housing shortages and stabilization in builder optimism (see chart), economists expect residential construction to rebound in the months ahead. One potential concern is the availability of credit.
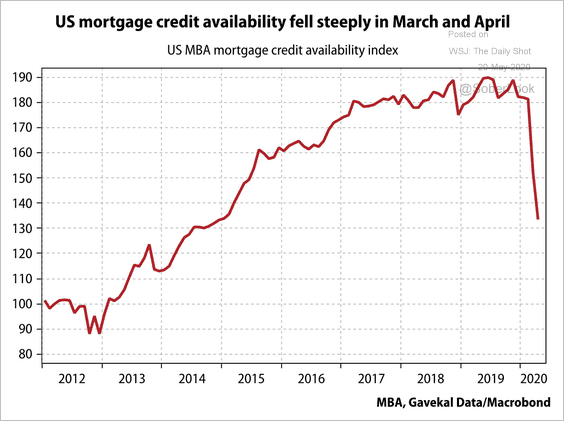 Source: Gavekal
• Searches for real estate listings are starting to recover.
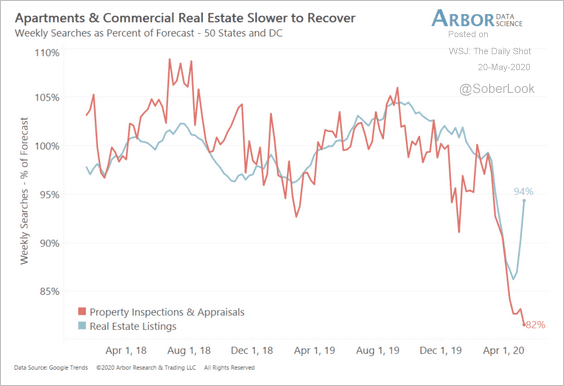 Source: Arbor Research & Trading
——————–
2. Next, we have some updates on US small businesses.
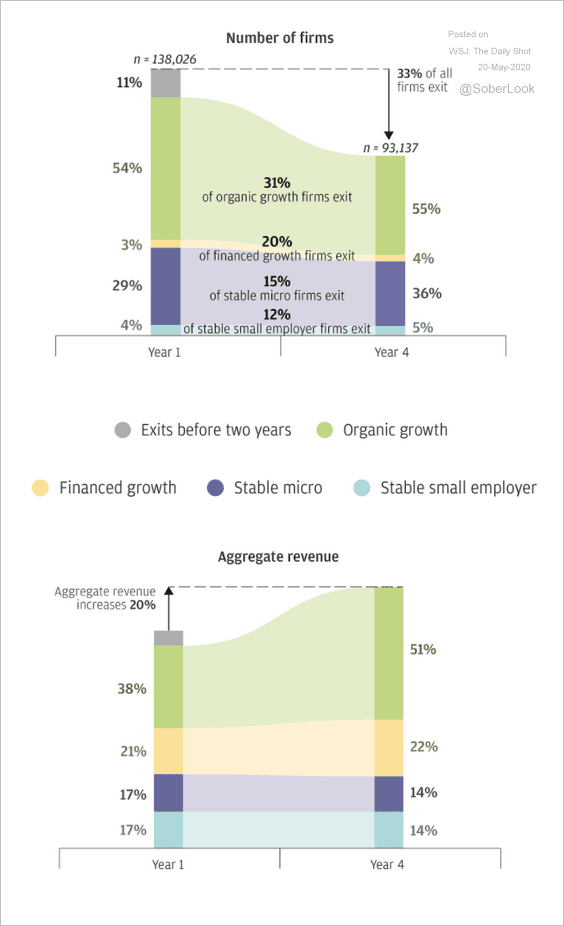
• Organic growth firms account for the majority of small business revenue four years after founding, according to JP Morgan.
 Source: PMorgan Chase Institute Read full article
• Many small businesses have limited liquidity.
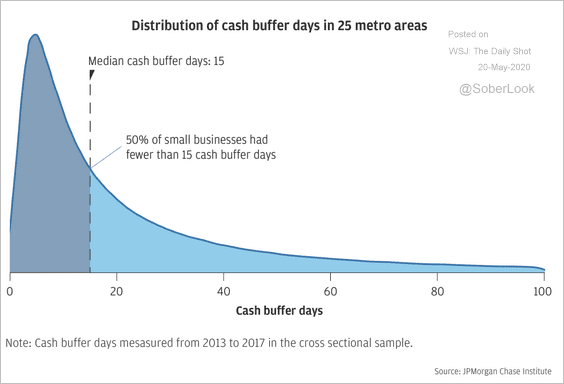 Source: PMorgan Chase Institute Read full article
Here is cash availability by sector.
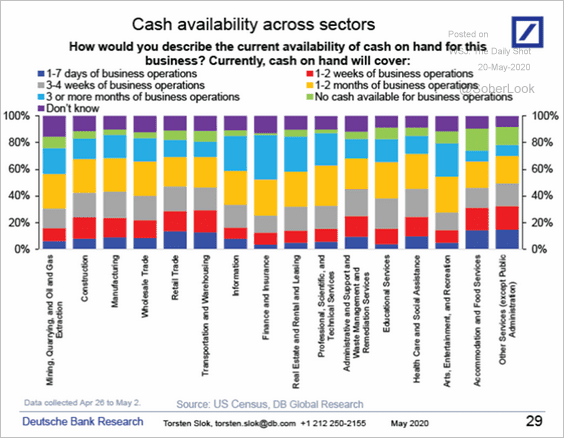 Source: Deutsche Bank Research
• What are the sources of funding for small businesses in the current environment?
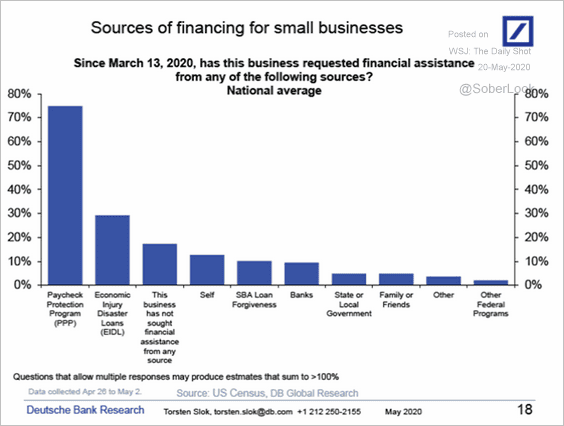 Source: Deutsche Bank Research
• This chart shows the aggregate small business revenue growth by metropolitan area.
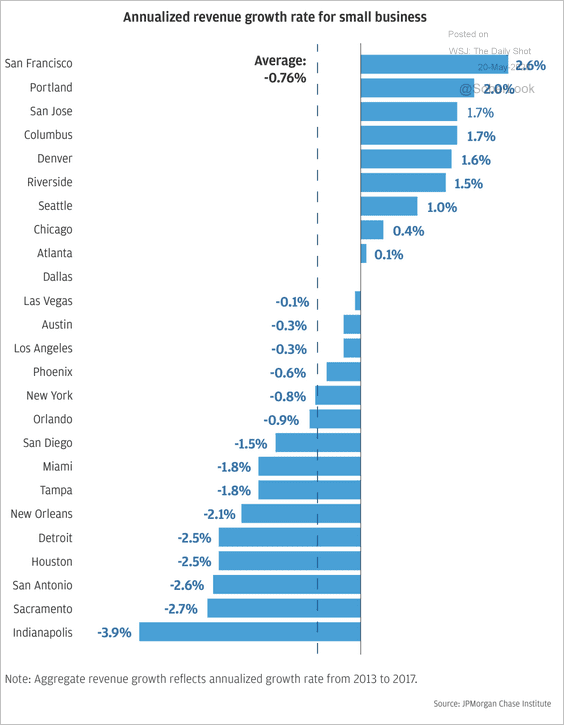 Source: PMorgan Chase Institute Read full article
• Business applications have slowed.
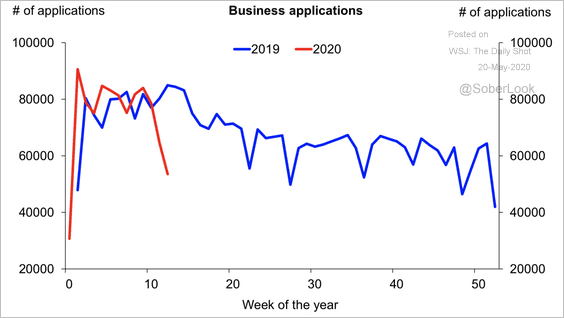 Source: Deutsche Bank Research
——————–
3. Here are some trends in the labor market.
• Unemployment has risen more for lower-skilled workers and women.
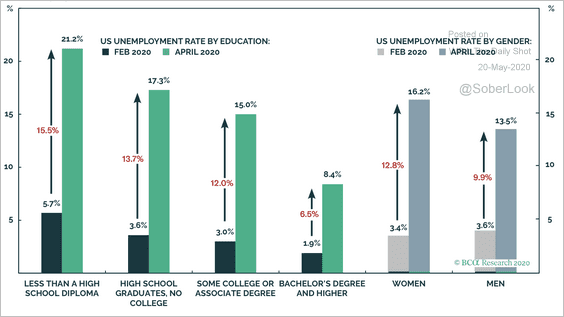 Source: BCA Research
• The Congressional Budget Office sees the unemployment rate peaking just below 16%.
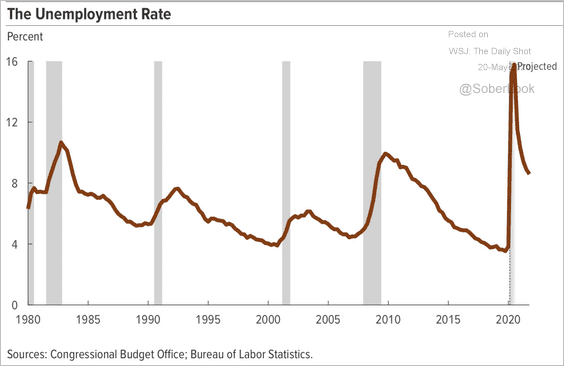 Source: CBO Read full article
• This chart compares job growth to the percentage of employees that are able to telework.
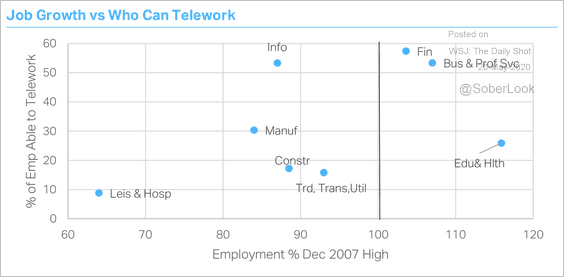 Source: TS Lombard
• State and local government employment plunged this year.
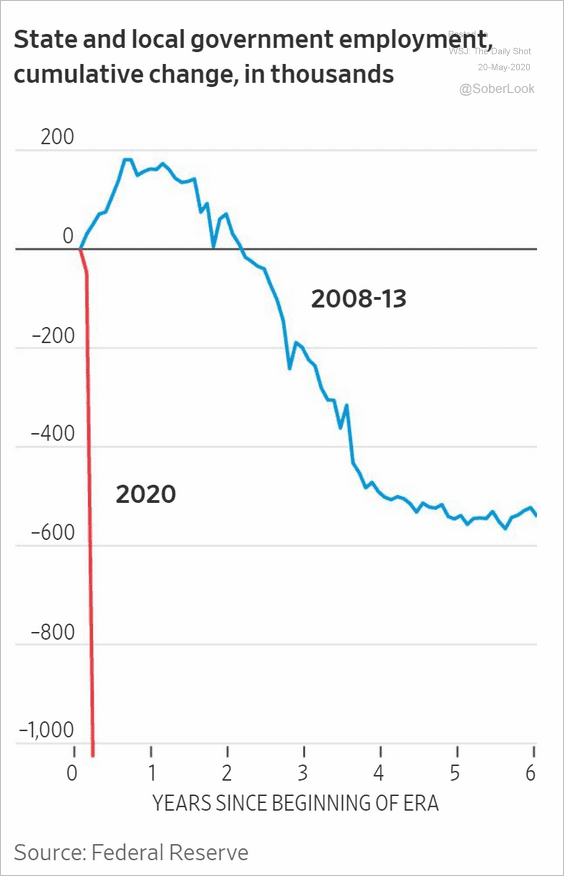 Source: @WSJ Read full article
——————–
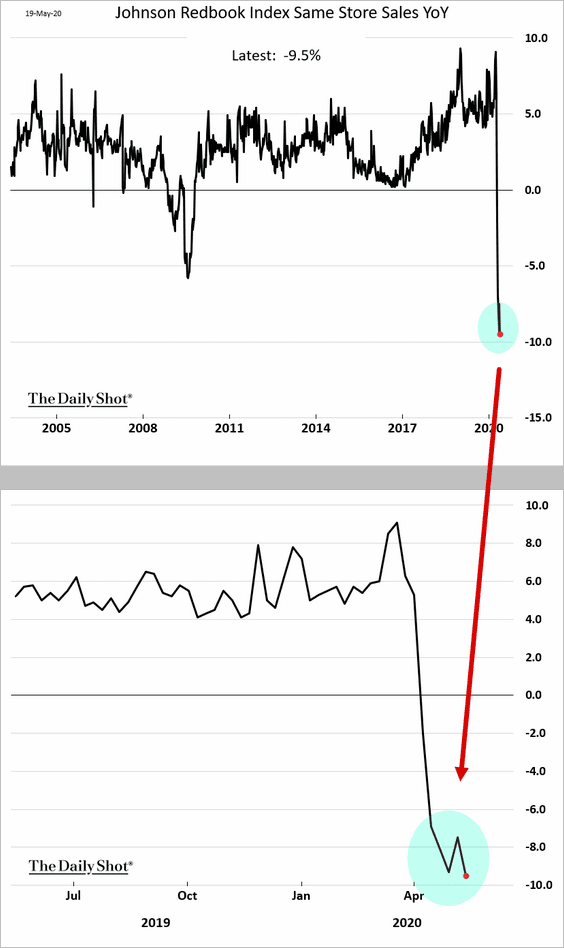
4. Last week it seemed that the Johnson Redbook Index of same-store sales had finally bottomed. Apparently not.
5. This chart from Morgan Stanley shows US cumulative tax returns, including the $300bn of individual rebates from the CARES Act.
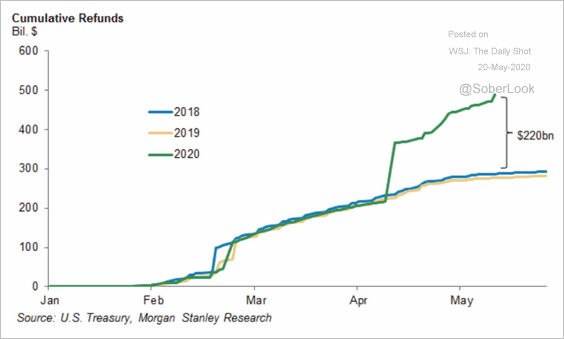 Source: Morgan Stanley Research
6. Analysts expect it to take several months for automobile production to recover to levels projected before the crisis.
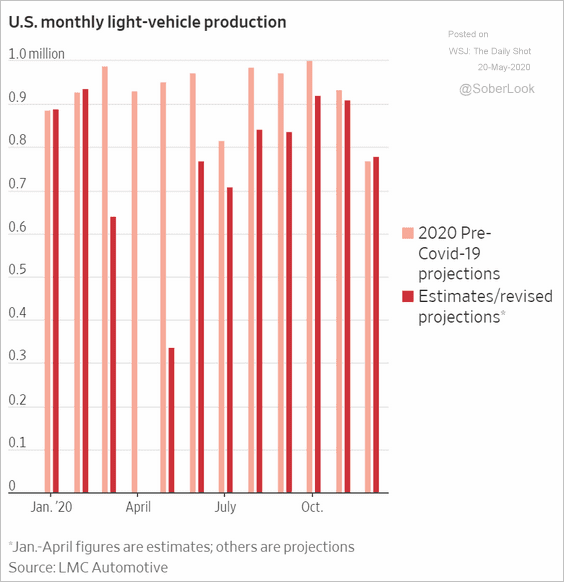 Source: @WSJ Read full article
7. Railcar loadings of containers are starting to recover, albeit far below historical levels.
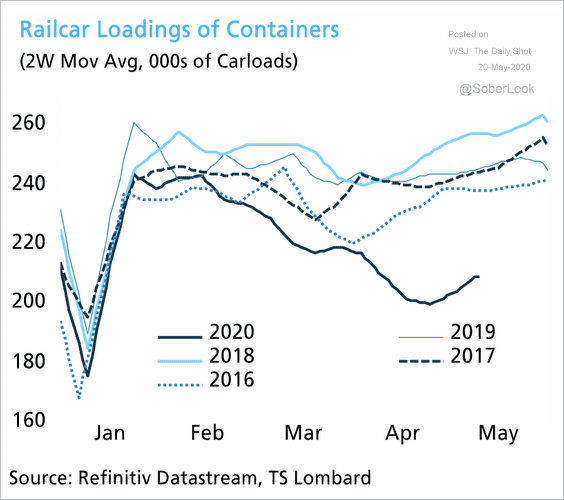 Source: TS Lombard
8. Finally, we have the composition of the 2020 fiscal stimulus measures vs. 2009.
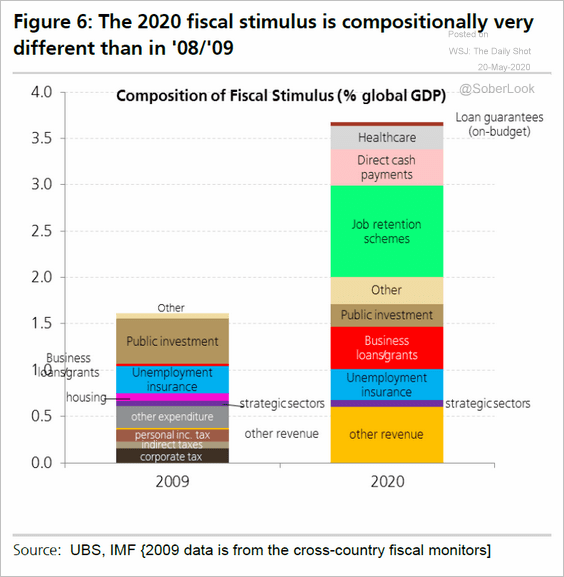 Source: UBS, @tracyalloway
The United Kingdom
1. How are different industries coping with the crisis?
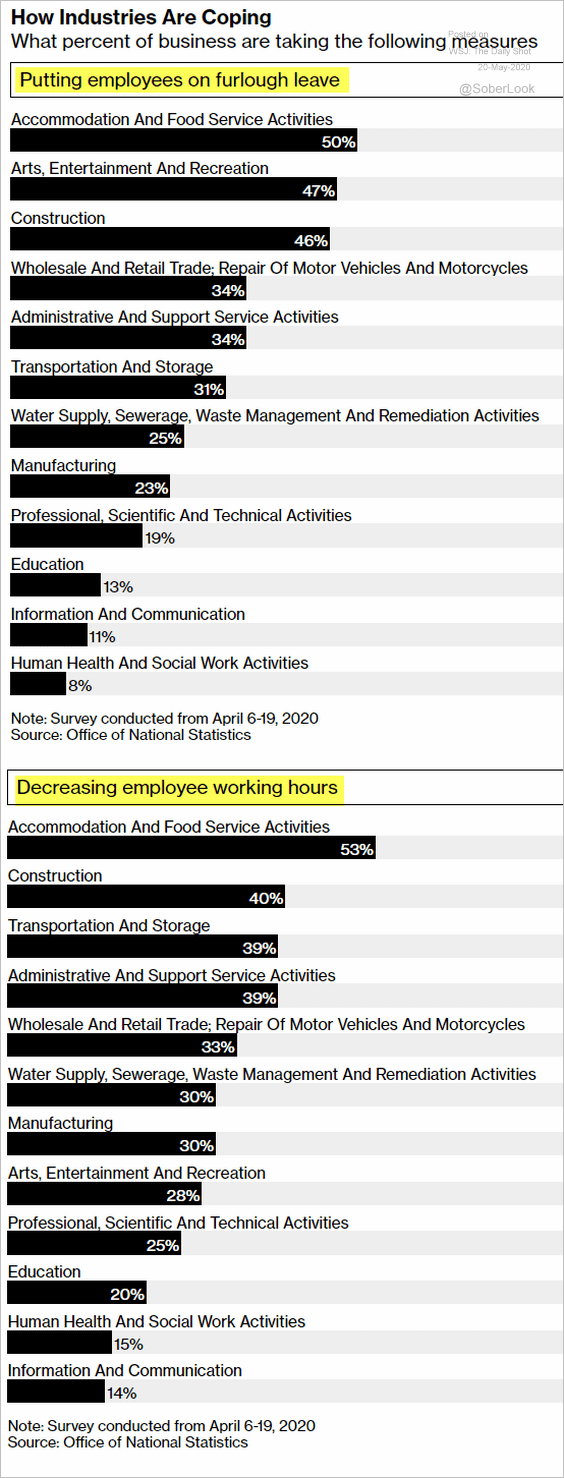 Source: @bbgvisualdata Read full article
2. Vacancy data signal massive job losses this year.
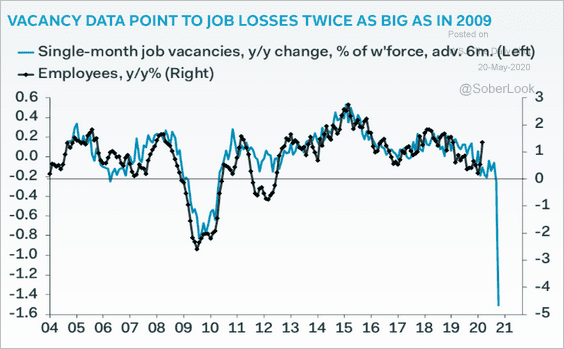 Source: Pantheon Macroeconomics
3. Britons are prioritizing saving lives vs. avoiding further damage to the economy.
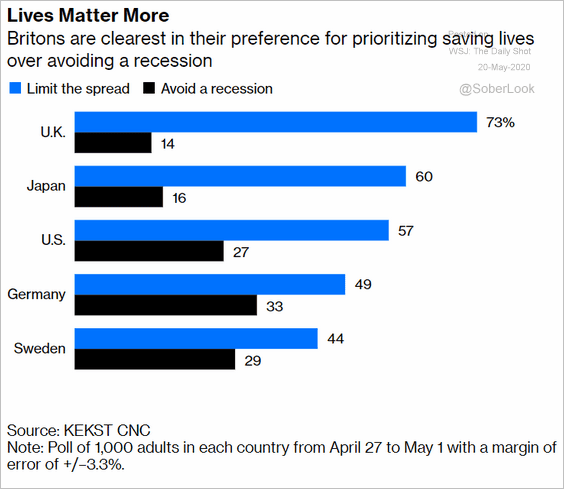 Source: @ThereseRaphael, @bopinion Read full article
The Eurozone
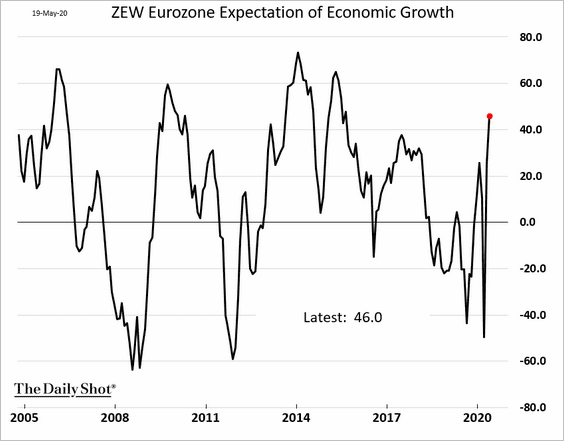
1. The ZEW Germany survey points to extreme weakness in current conditions but a sharp rebound in expectations (second chart).
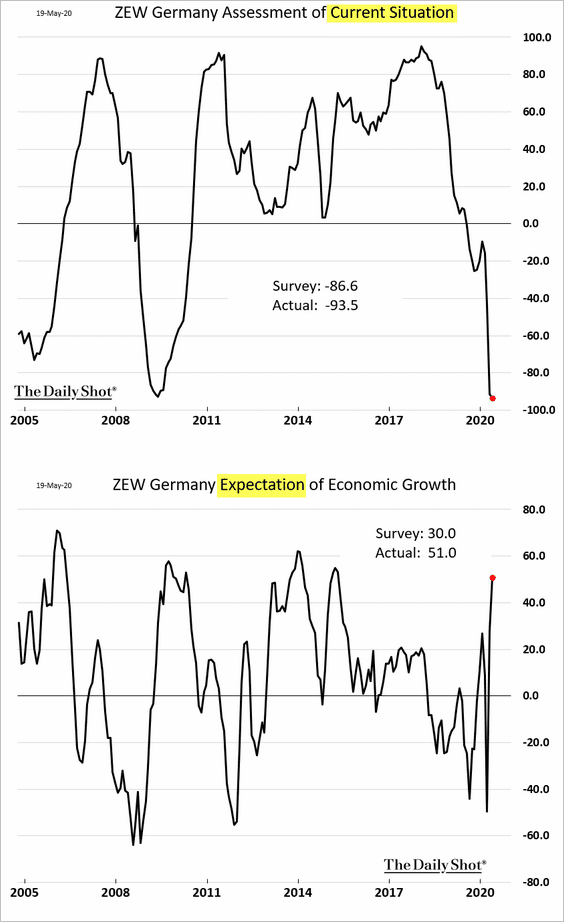
Here is the index at the Eurozone level.
——————–
2. Car registrations plummetted last month.
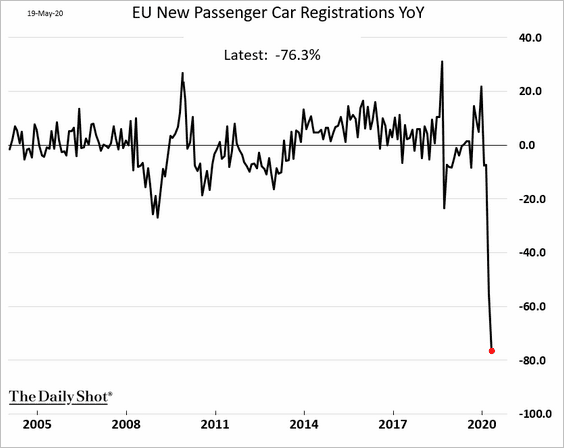
And we saw this collapse reflected in automobile production.
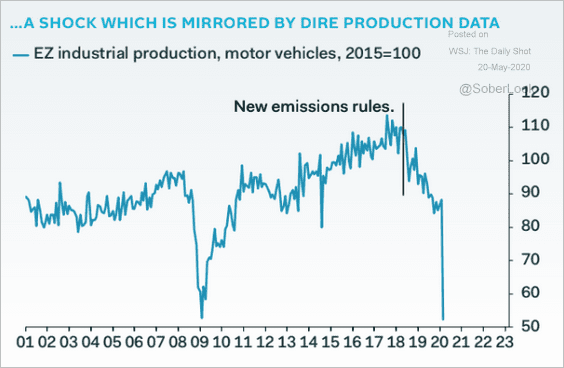 Source: Pantheon Macroeconomics
——————–
3. Construction output in March declined by the highest percentage in decades.
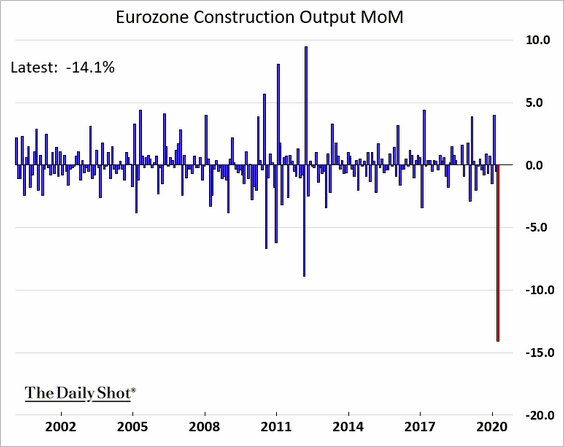
The Eurozone has underperformed the rest of the EU.
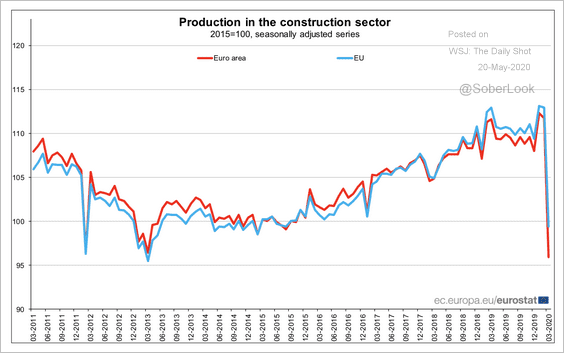 Source: Eurostat Read full article
——————–
4. Euro-area financial conditions are improving.
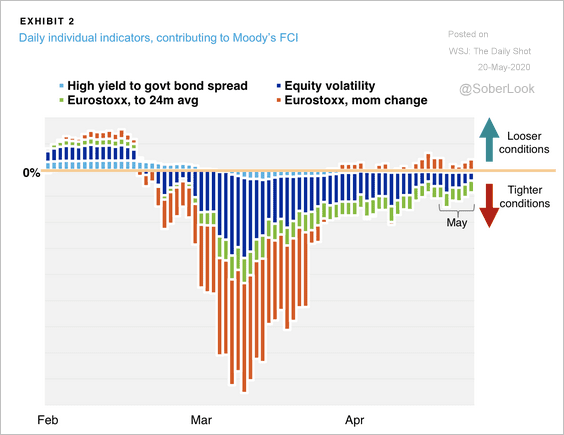 Source: Moody’s Investors Service
5. German restaurants are starting to see some traffic.
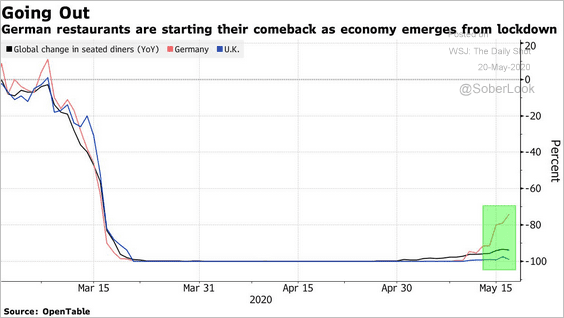 Source: @business Read full article
6. The ECB’s securities purchases allowed Spain and Italy to sell quite a bit of debt this year.
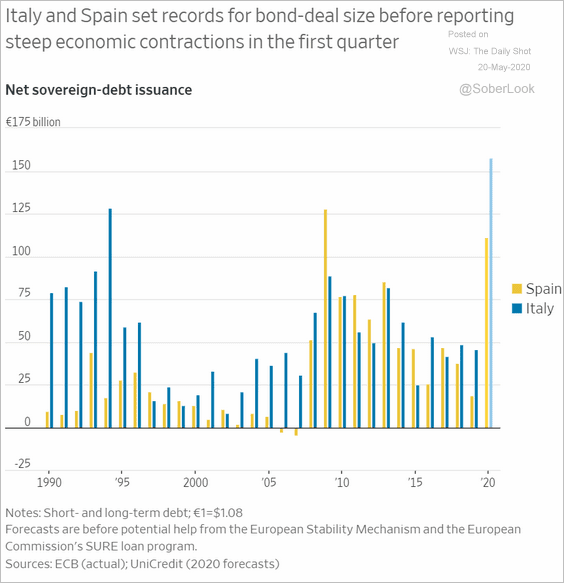 Source: @WSJ Read full article
7. How much support is there for the euro and the ECB?
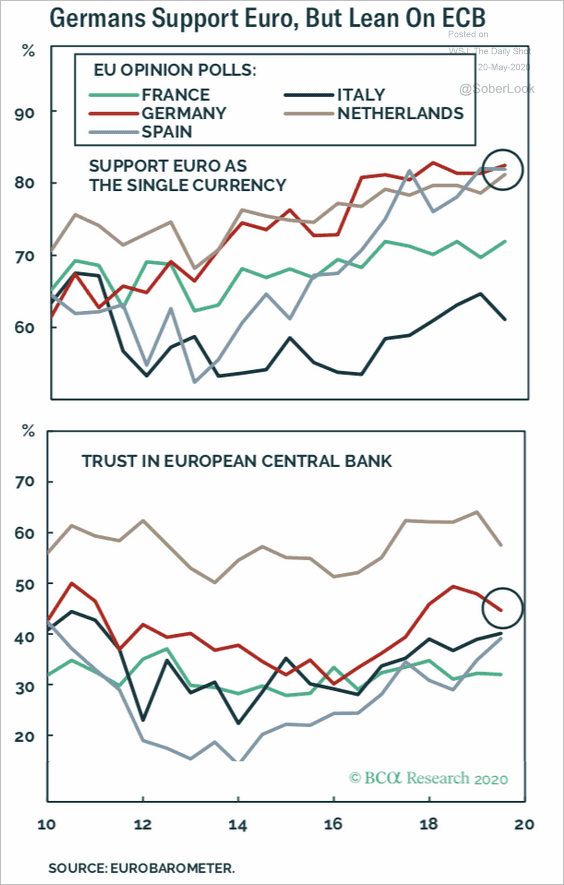 Source: BCA Research
Europe
1. Banks’ price-to-book ratios dipped below the 2009 lows.
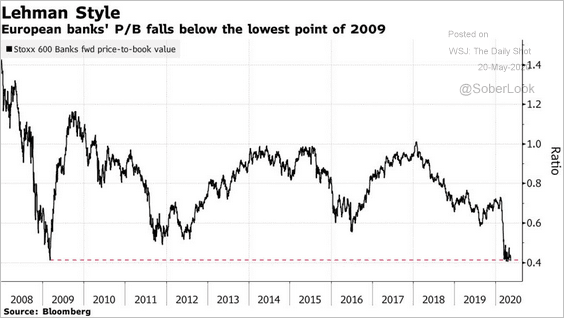 Source: @markets Read full article
Analysts see banks having the biggest upside potential.
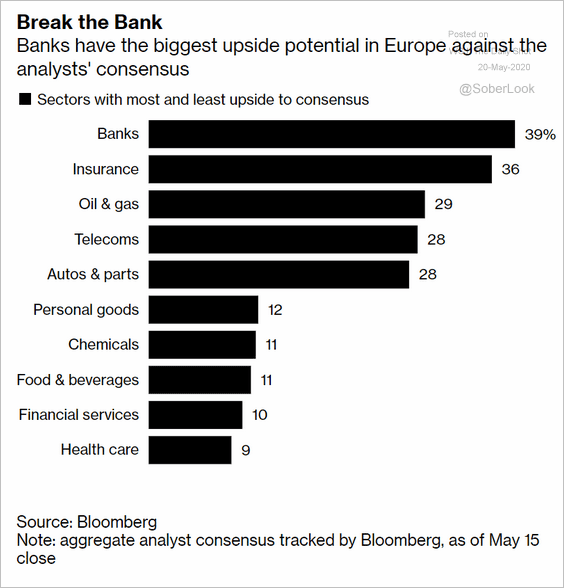 Source: @markets Read full article
——————–
2. This map shows the median disposable income across Europe.
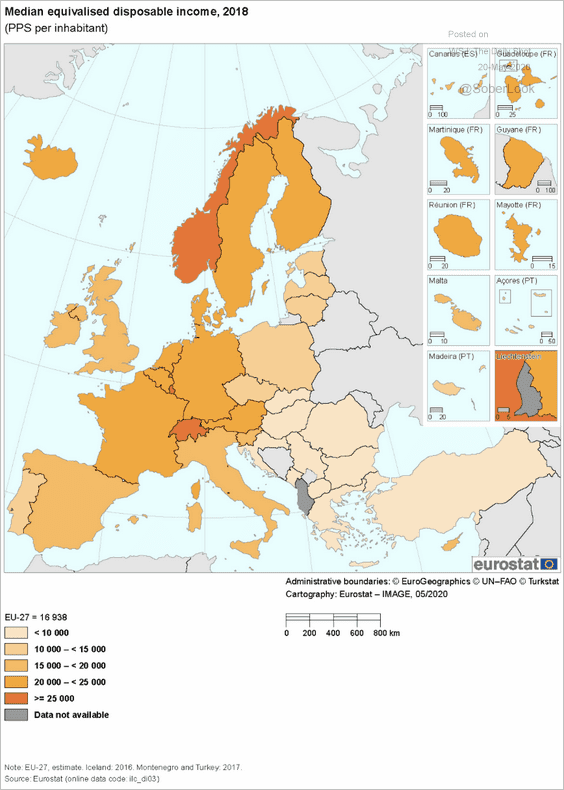 Source: Eurostat Read full article
China
1. Local government bond issuance spiked this month, according to ANZ.
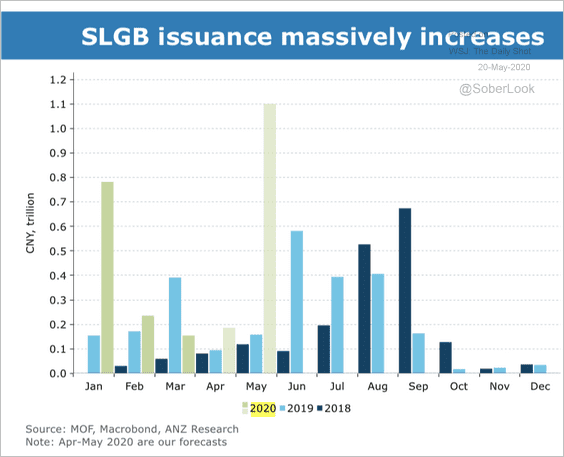 Source: ANZ Research
2. The overall debt as a percentage of the GDP hit another record high.
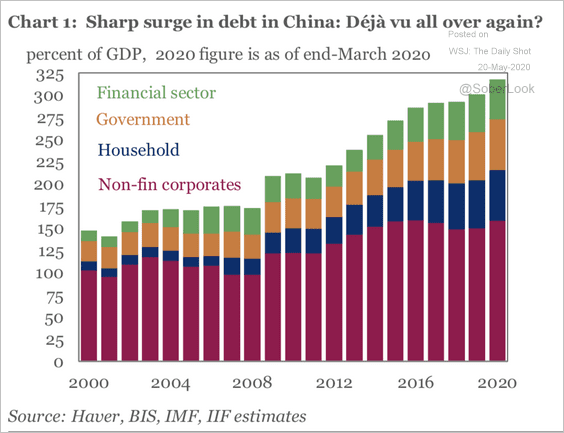 Source: IIF
3. The savings rate is slowing as the population ages.
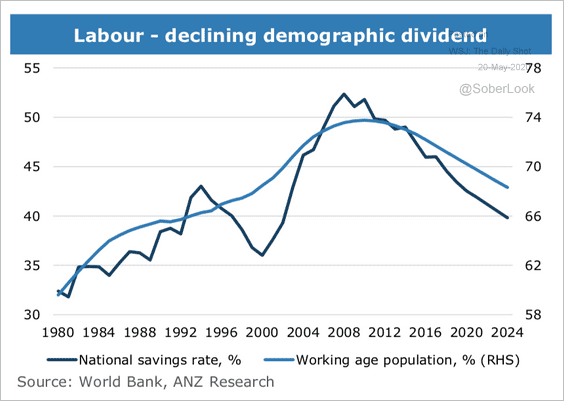 Source: ANZ Research
Emerging Markets
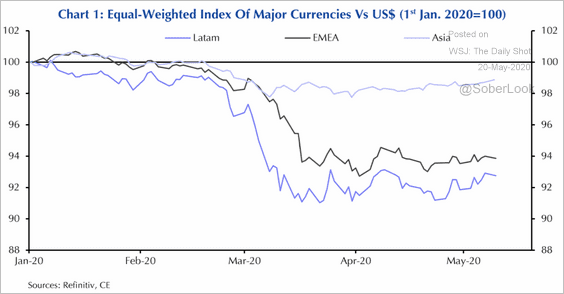
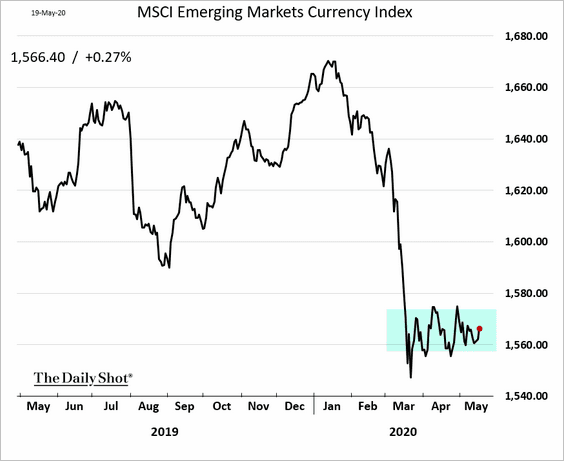
1. Let’s begin with the currency markets.
• EM Asia currencies have outperformed, but the overall market has been relatively stable in recent weeks (3 charts).
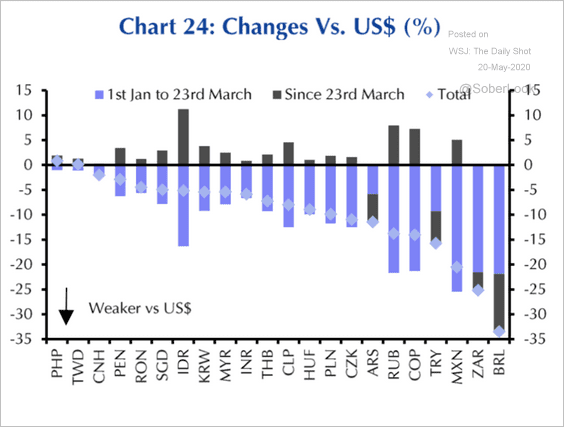 Source: Capital Economics
 Source: Capital Economics
——————–
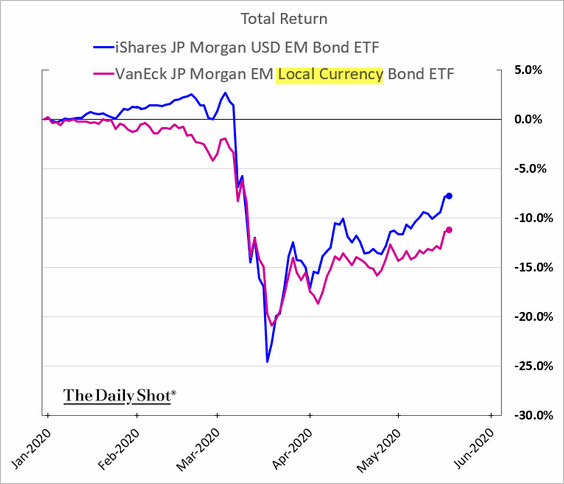
2. With currency volatility easing, investors are returning to local currency bonds, which (in dollar terms) have been lagging USD-denominated debt.
3. The price-to-earnings ratio for EM equities is near record lows.
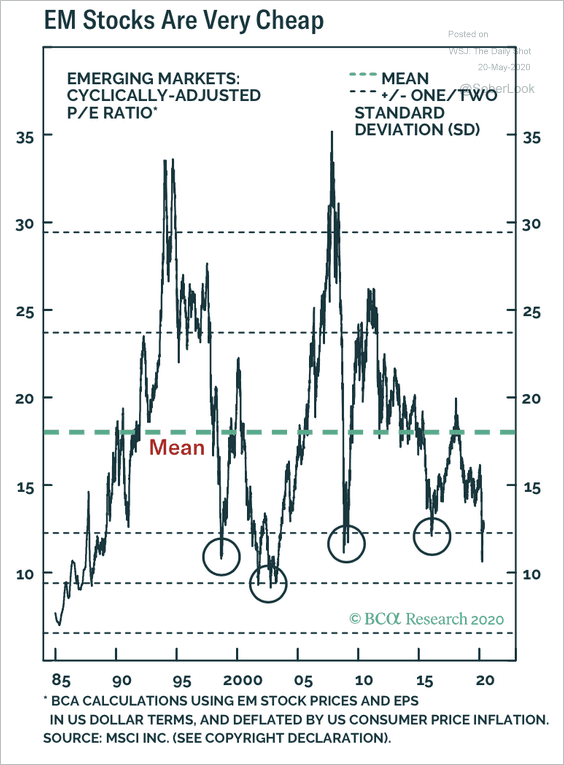 Source: BCA Research
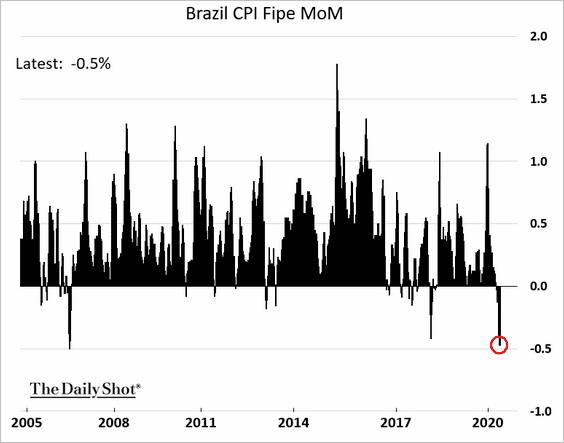
4. Brazil’s weekly inflation measure registered the largest decline in years.
Separately, portfolio outflows from Brazil hit a record.
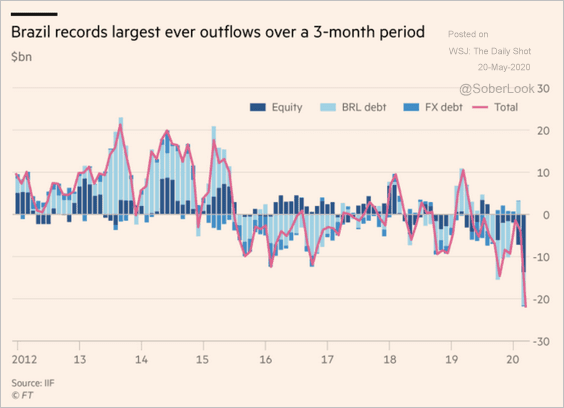 Source: @financialtimes Read full article
——————–
5. Turkey’s F/X reserves are shrinking rapidly.
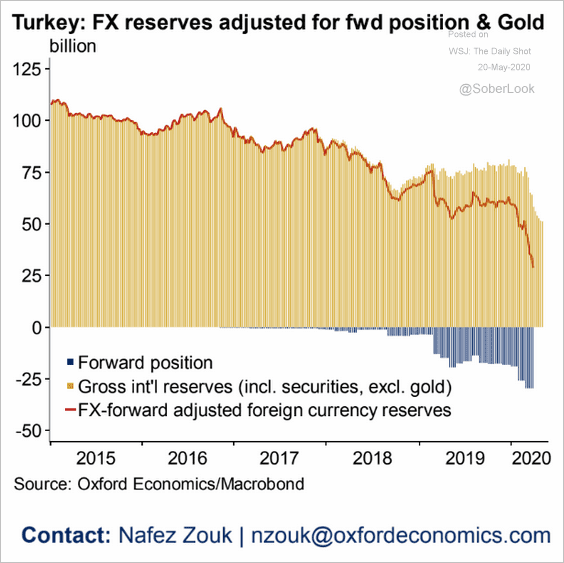 Source: Oxford Economics
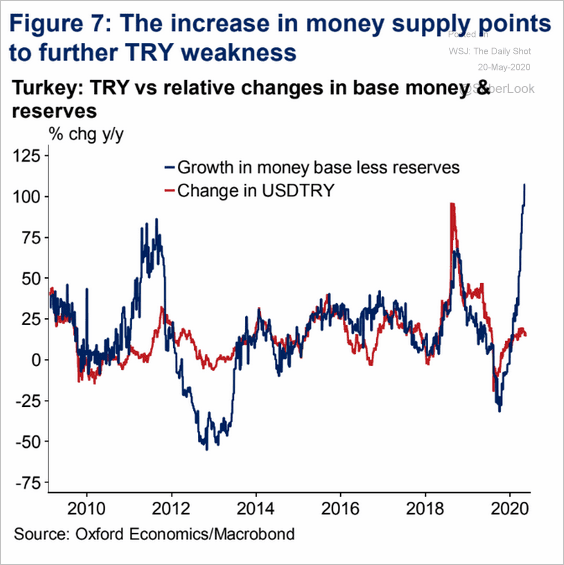
Downside risks for the lira are building as the monetary base blows up. Inflation is expected to accelerate, forcing the central bank to tighten.
 Source: Oxford Economics
——————–
Commodities
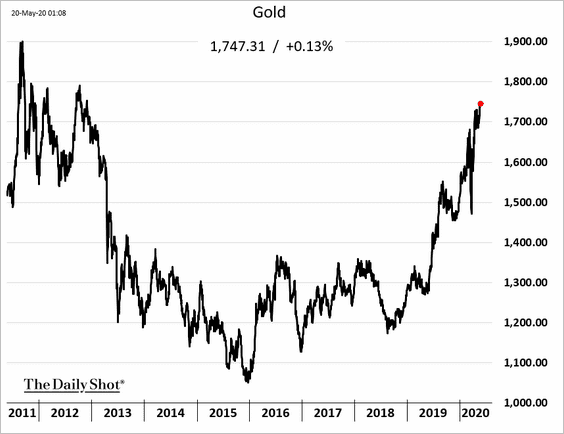
1. Gold hit the highest level since 2012.
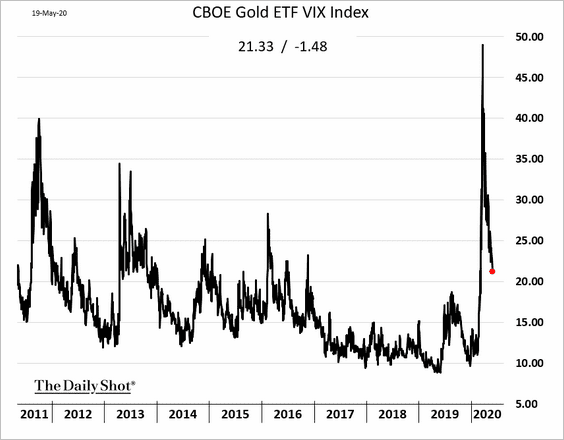
• Gold implied volatility continues to ease.
• But long gold is an increasingly crowded trade.
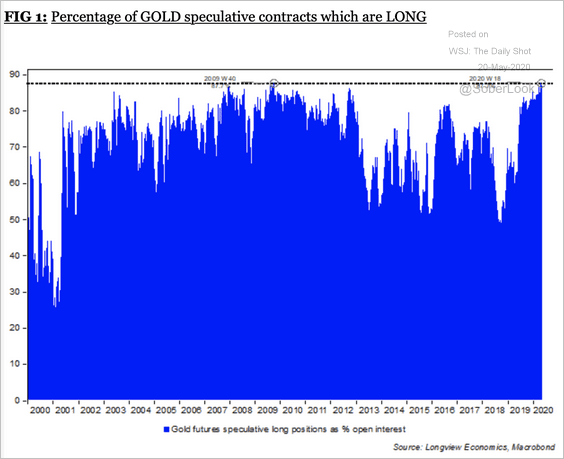 Source: Longview Economics
• The gold/copper ratio is at an extreme.
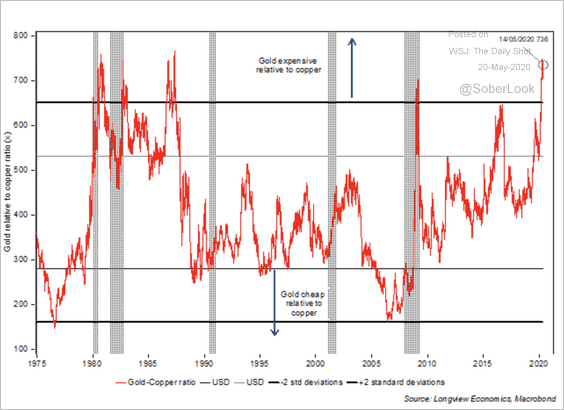 Source: Longview Economics
——————–
2. So far, there is no evidence that China is accelerating its purchases of US agricultural goods as it agreed to do.
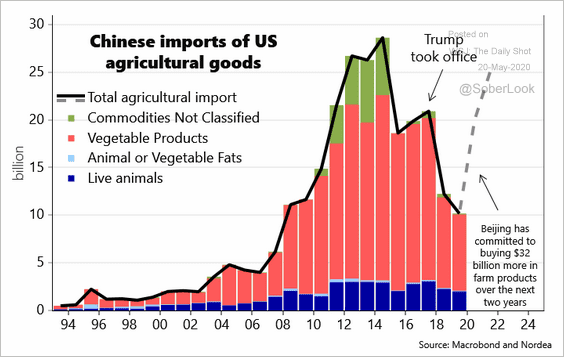 Source: @AndreasSteno Read full article
China’s suppliers are buying record amounts of soybeans from Brazil …
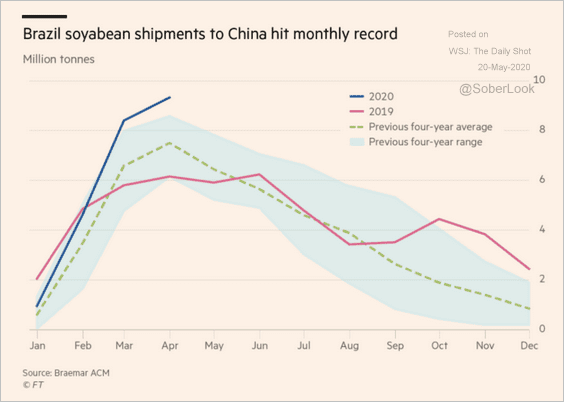 Source: @financialtimes Read full article
… because of the price differential.
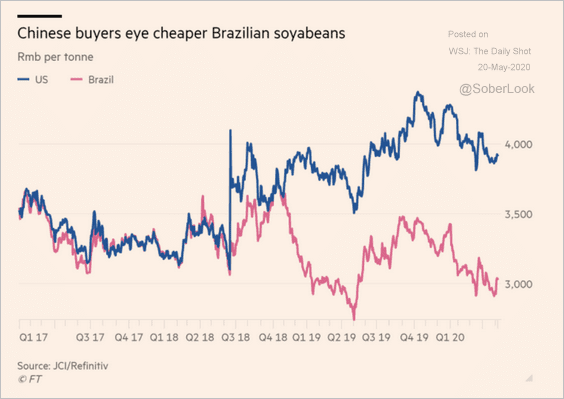 Source: @financialtimes Read full article
——————–
3. US inventories of unroasted coffee beans registered the largest monthly increase since 2012, as demand from restaurants tumbled.
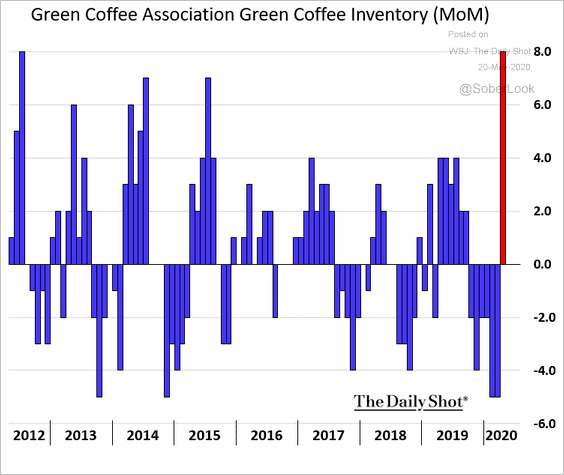 h/t @MarvinPerezmkts
Growth in retail demand for coffee is expected to be robust.
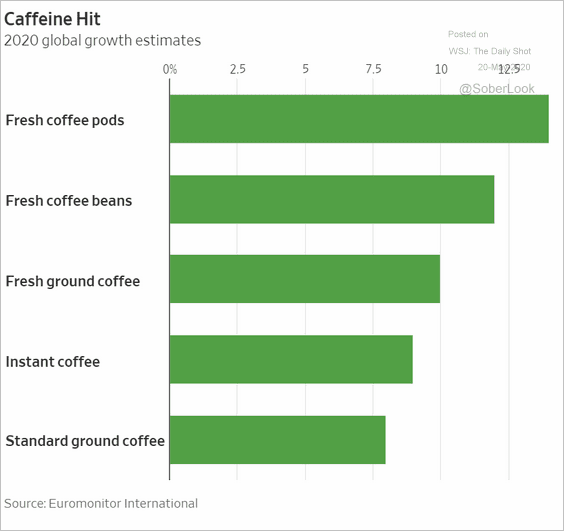 Source: @WSJ Read full article
——————–
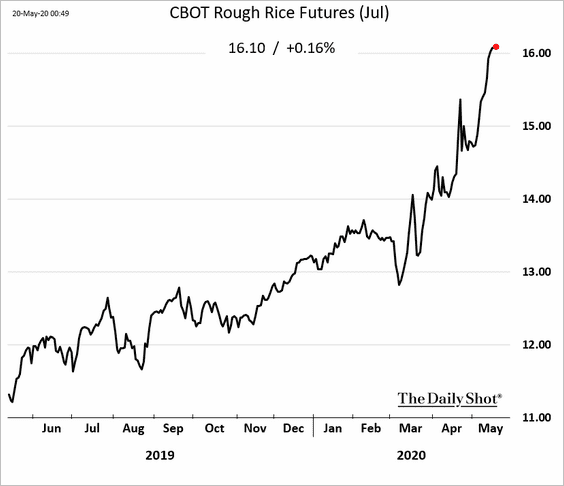
4. Rice futures continue to rally in response to households’ stockpiling and export restrictions in several countries (#2 here).
Energy
1. Aramco has been outperforming other oil firms.
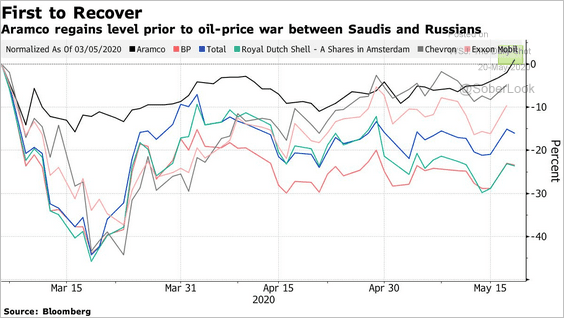 Source: @markets Read full article
2. After the negative-price fiasco in WTI, some traders have been avoiding the front futures contract, focusing on later months instead.
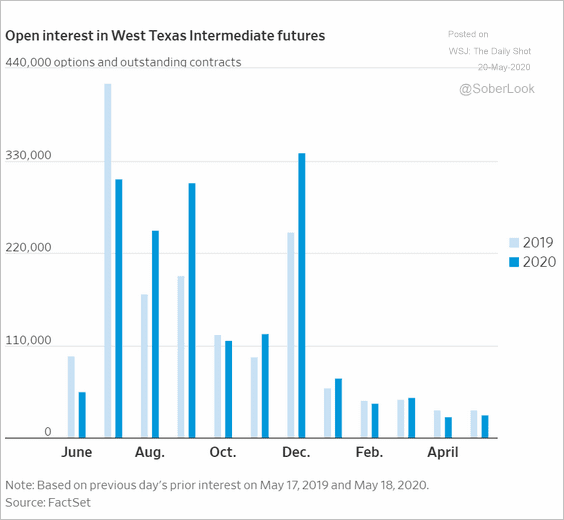 Source: @WSJ Read full article
3. China’s refinery demand has rebounded.
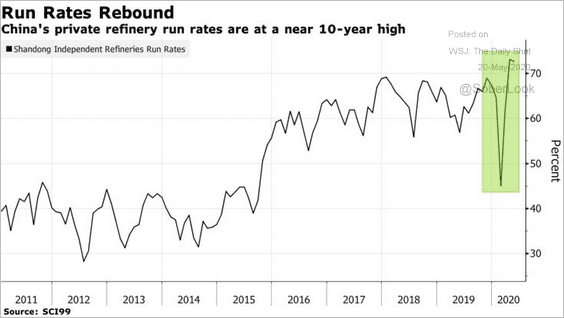 Source: @business Read full article
Equities
1. Will the market follow the 2009 pattern?
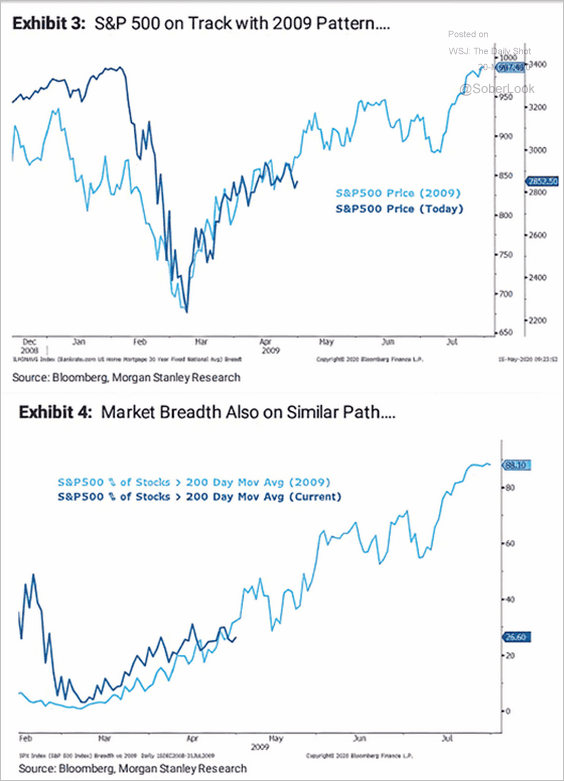 Source: @ISABELNET_SA, @MorganStanley
2. The market has been more forgiving than usual to companies that missed earnings estimates.
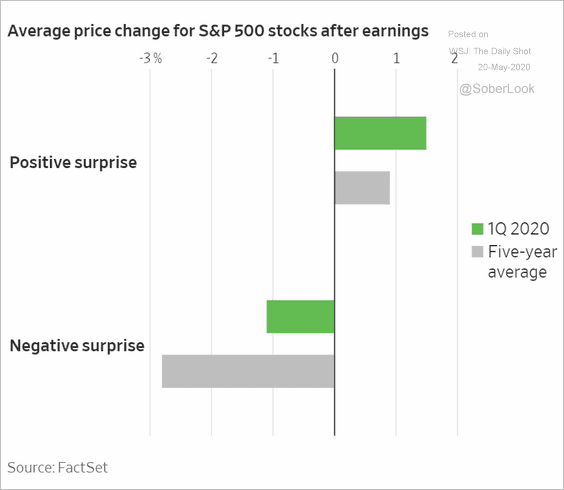 Source: @WSJ Read full article
3. The tech mega-caps are approaching their all-time high.
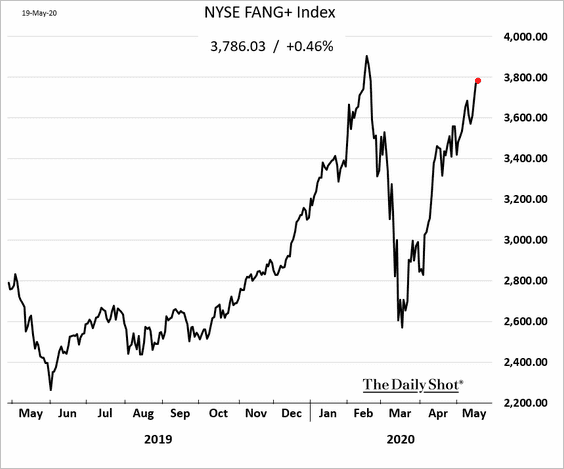 h/t Brandon Kochkodin
4. Next, we have some updates on valuations.
• Valuations of S&P 500 companies in the fourth quintile look especially cheap.
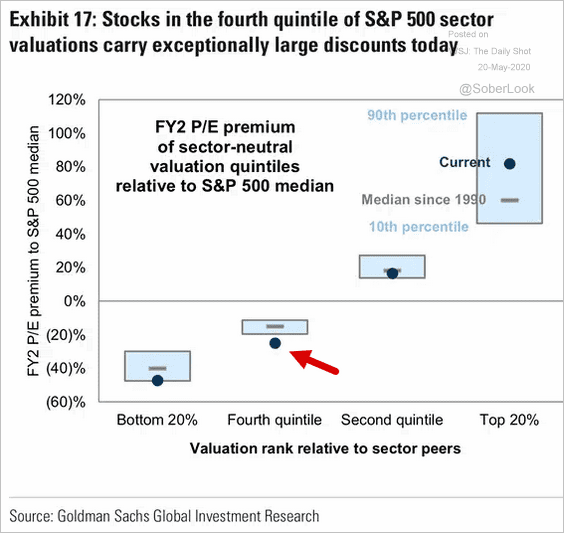 Source: @ISABELNET_SA, @GoldmanSachs
• Stocks look cheap relative to the money supply (which has exploded since the Fed launched its QE). Here is the definition of MZM.
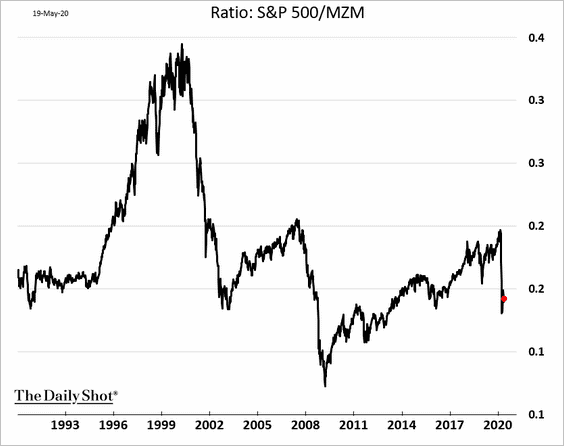 h/t @TheOneDave, MKM Partners
• The Russell 2000 (small-cap) forward P/E ratio spiked in recent weeks.
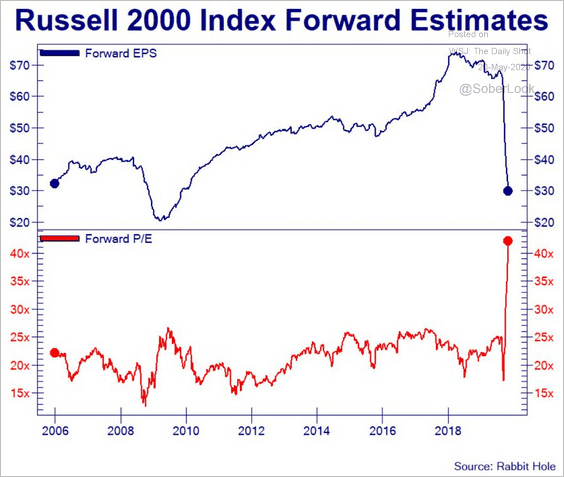 Source: @Not_Jim_Cramer
These charts show the 12-month forward P/E ratios for large- , mid- , and small-cap shares.
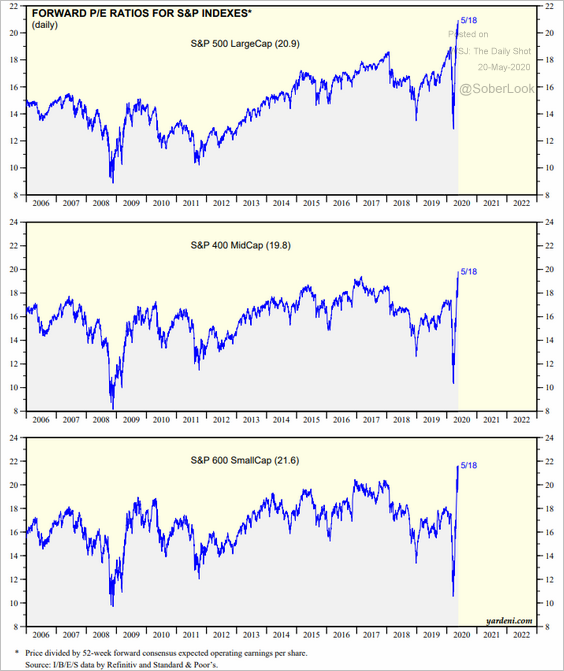 Source: Yardeni Research
Valuations don’t look as ridiculous when longer-term earnings estimates are taken into account (18 months). The stock market is pricing in a sharp rebound in earnings in 2021.
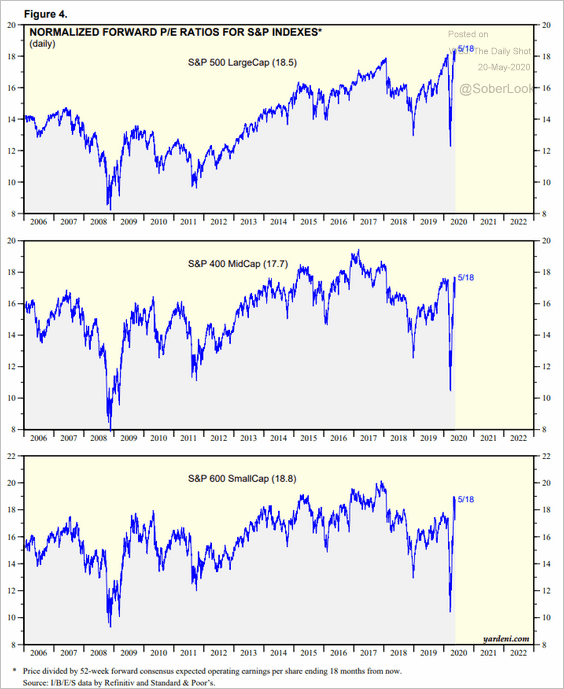 Source: Yardeni Research
——————–
5. Next, we have a couple of sector charts.
• Automakers and homebuilders have underperformed during the market rally.
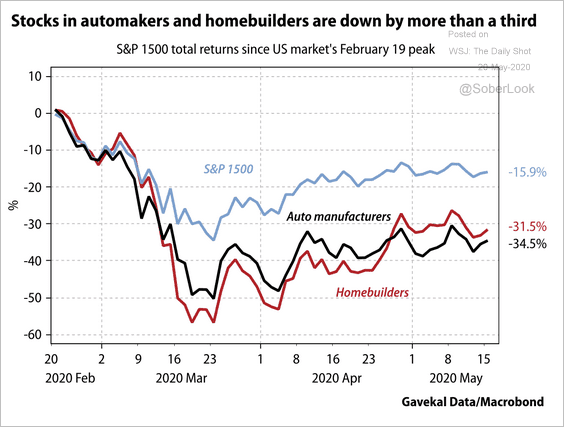 Source: Gavekal
• Lower bond yields have not helped REITs.
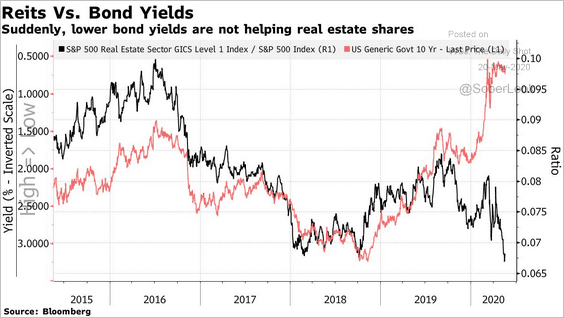 Source: @johnauthers, @bopinion Read full article
——————–
6. Finally, we have some updates on the volatility markets.
• Speculative accounts have sharply reduced both long and short positions in VIX futures.
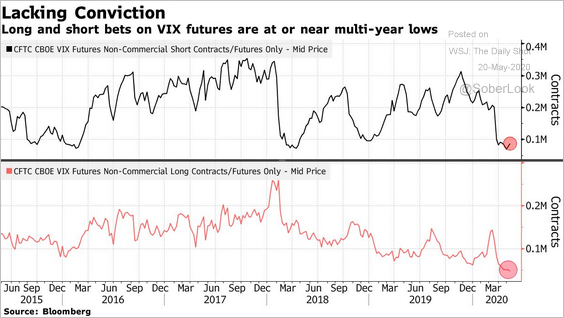 Source: @markets Read full article
• The put/call ratio has declined to pre-selloff levels as risk aversion recedes.
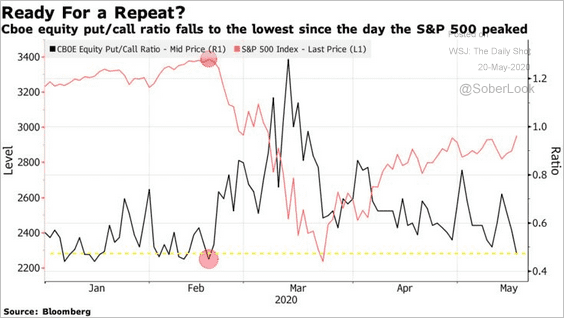 Source: @markets Read full article
• Small traders in the equity options markets have been quite bullish.
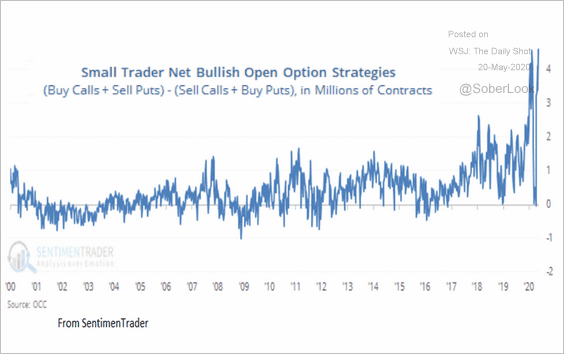 Source: @markets, @sentimentrader Read full article
Rates
1. The 10-year Treasury yield’s fair value is around 20-basis points, according to TS Lombard.
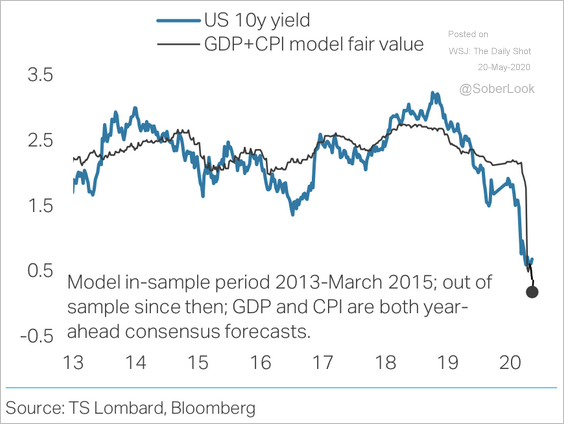 Source: TS Lombard
2. US inflation expectations have stabilized.
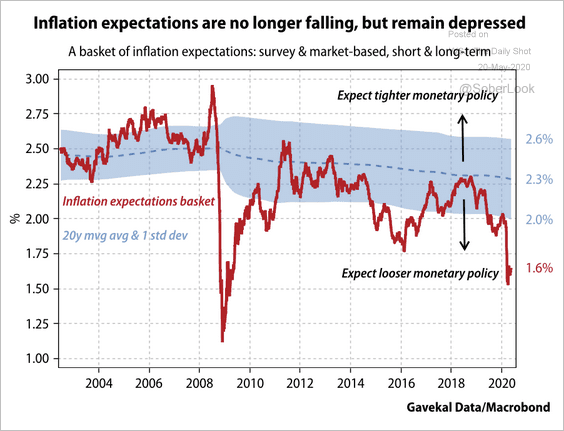 Source: Gavekal
3. US mortgage rates have declined less in real terms than in nominal terms.
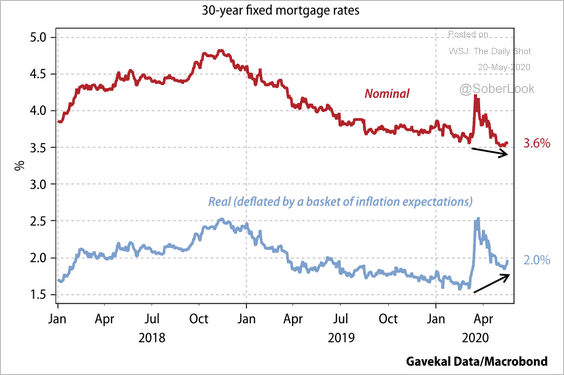 Source: Gavekal
Global Developments
1. Investors have been extremely pessimistic on real estate this year.
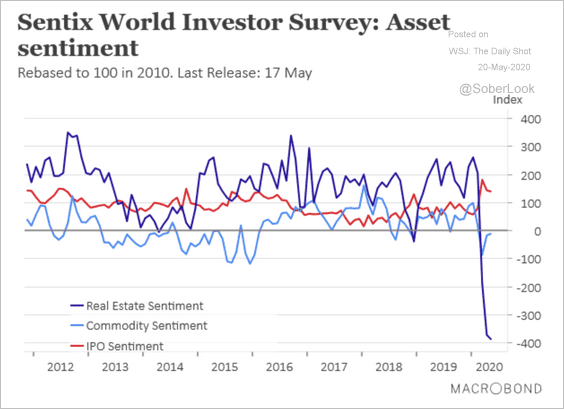 Source: Macrobond Read full article
2. An expansion of valuation multiples has driven the rally across global equities, even as earnings expectations contracted across the board, according to BlackRock.
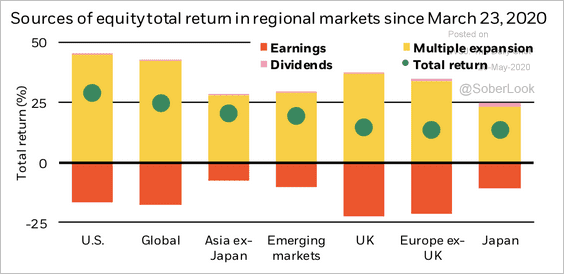 Source: BlackRock
3. This chart shows mobility trends in Italy, the US, and Germany.
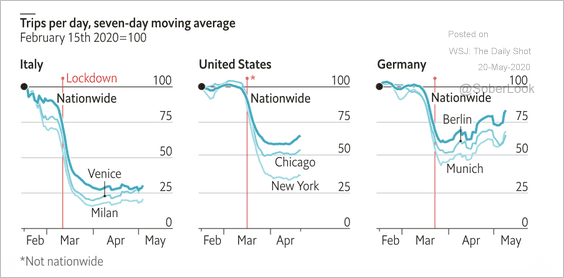 Source: The Economist Read full article
4. Passenger air travel is recovering.
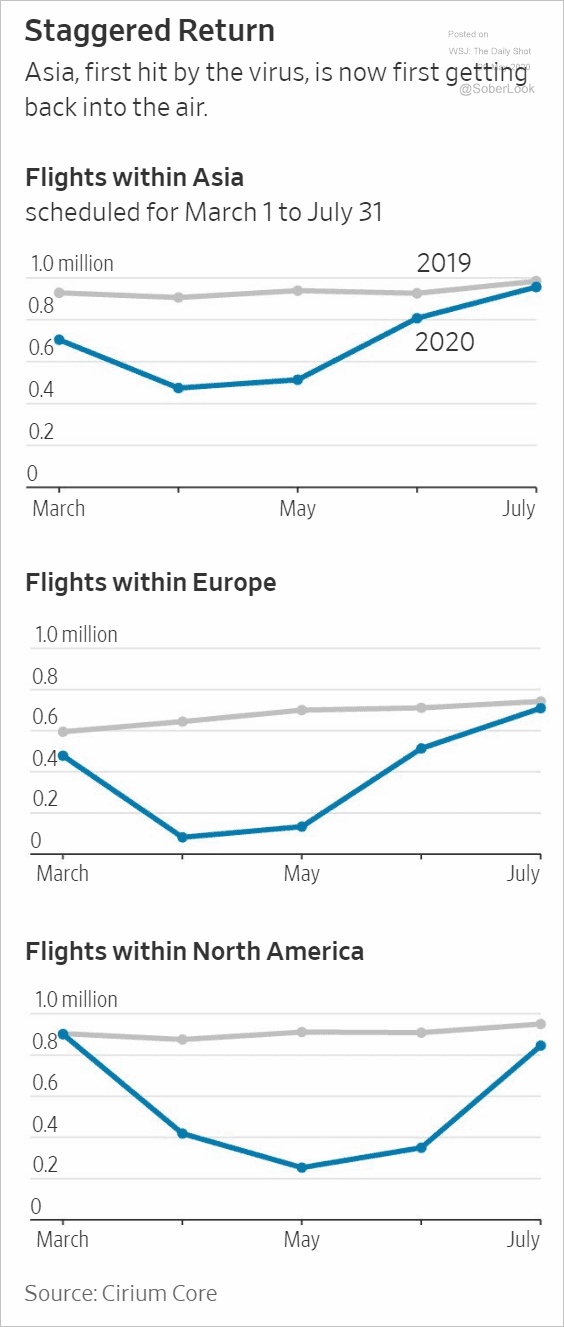 Source: @WSJ Read full article
——————–
Food for Thought
1. Charitable giving by income group:
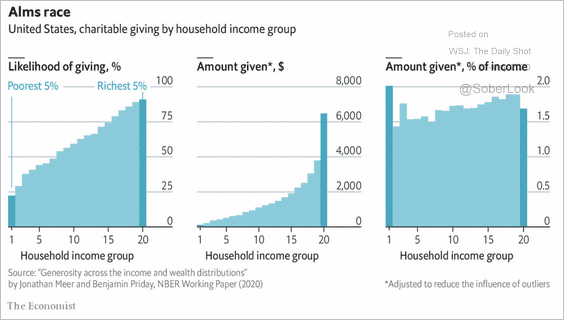 Source: The Economist Read full article
2. Advertising revenue of US newspapers:
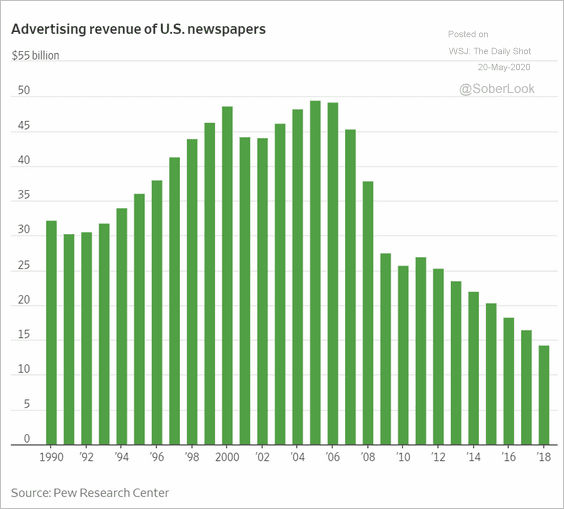 Source: @WSJ Read full article
3. US employment at young firms:
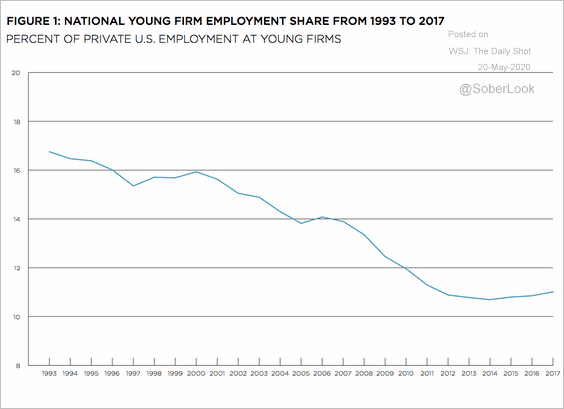 Source: Heartland Forward Read full article
4. Coronavirus-related cyberattacks:
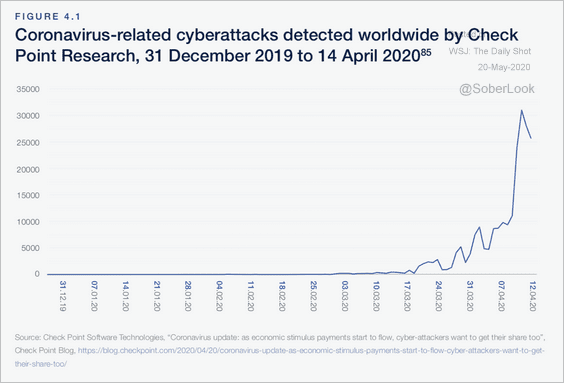 Source: WEF Read full article
5. New coronavirus cases in states that have eased lockdowns:
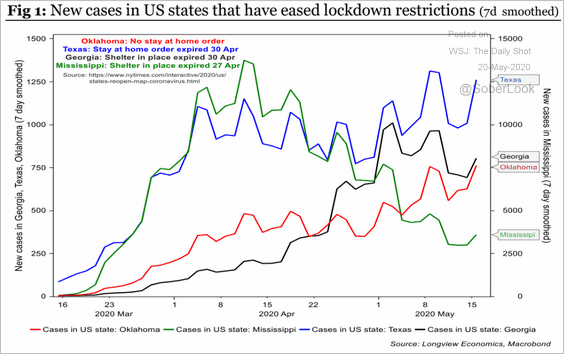 Source: Longview Economics
6. US deaths from all causes:
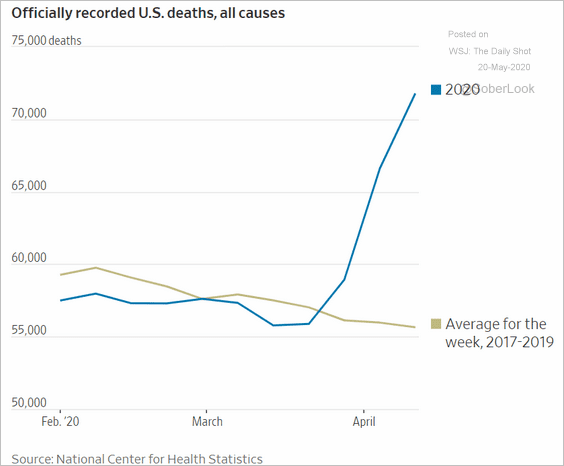 Source: @WSJ Read full article
7. A survey of Gen-Z and Millennials:
 Source: Morning Consult Read full article
8. Visiting a buffet-style restaurant:
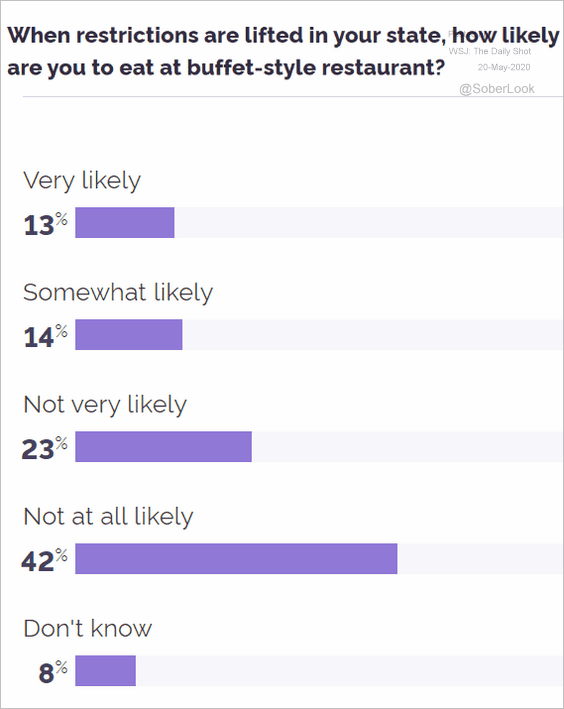 Source: YouGov Read full article
——————–