
The Daily Shot: 27-Jan-21
• Equities
• Rates
• Commodities
• Emerging Markets
• China
• Asia – Pacific
• Europe
• The United Kingdom
• The United States
• Global Developments
• Food for Thought
Equities
1. We continue to see market distortions caused by individual investors’ increasingly aggressive activity. The SPDR retail sector ETF has gone vertical.


Many of the stocks that have become targets of retail investors were heavily shorted, generating a series of short-squeeze rallies. With short-sellers getting pushed out, the market becomes extremely vulnerable to a downside gap.

Retail interest in “short squeeze” hit a record (2 charts).
 Source: Arbor Research & Trading
 Source: Investopedia.com
Where possible, small investors create a melt-up using call options, thus punching above their weight in moving markets.
 Source: Deutsche Bank Research
The US put-call ratio continues to hit multi-year lows.

——————–
2. The pro-cyclical trade appears overextended, in the near-term at least.
 Source: BCA Research
• Metals & Mining:

• Energy:

• Transportation:
![]()
——————–
3. Here are several other sector trends.
• Banks:

• Tech:

• Communication Services:

• Semiconductors:

• REITs:

• It’s been a rough few months for private prison stocks.
 Source: CNBC Read full article

——————–
4. As market “amplitudes” rise, will the next market correction be more severe than the pandemic selloff?
 Source: Stifel
5. The S&P 500 realized correlation is dangerously low.
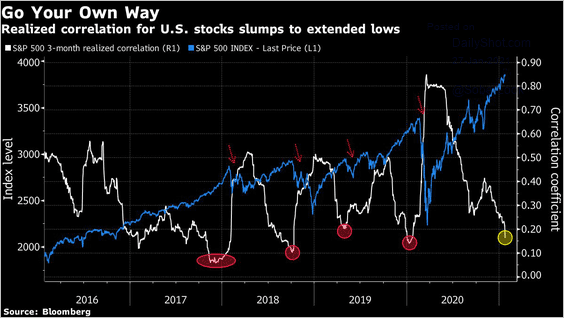 Source: @BloombergQuint Read full article
6. The correlation between the S&P 500 and the 10-year Treasury yield has been declining.
 Source: BCA Research
7. The S&P 500 CAPE ratio is now above 1929 levels but is still below the dot-com peak.
 Source: Deutsche Bank Research
At previous peak valuation levels, S&P 500 returns were low to negative ten years out (2 charts).
 Source: Deutsche Bank Research
 Source: Deutsche Bank Research
——————–
8. In real (inflation-adjusted) terms, the S&P 500 looks extended versus its long-term trend.
 Source: BCA Research
9. The stock market’s divergence from consumer sentiment continues to widen.
 Source: Piper Sandler Read full article
10. There is a strong relationship between excess money growth and equities.
 Source: Alpine Macro
11. Here is a comparison with the 2009 S&P 500 trajectory.
 Source: @ISABELNET_SA, @MorganStanley
Back to Index
Rates
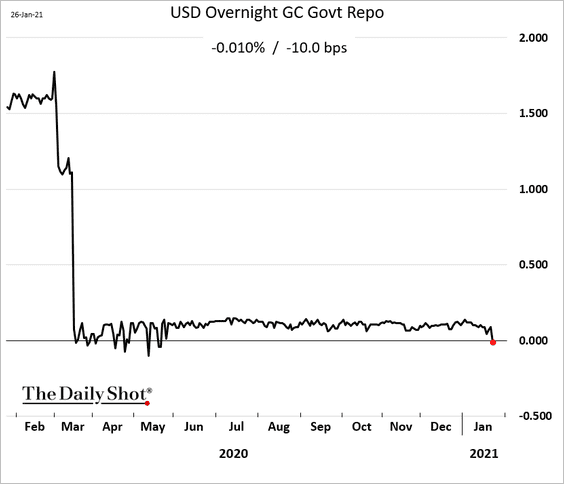
1. US government bond overnight repo rates are back in negative territory as money markets are flooded with liquidity.
 Source: @TheTerminal, Bloomberg Finance L.P.
2. When will the Fed begin to taper?
 Source: @adam_tooze, @markets Read full article
3. Leveraged funds are now net long the 10-year Treasury note futures.

Back to Index
Commodities
1. US corn futures hit a multi-year high.
 Source: @WSJ Read full article

——————–
2. China’s steel mills are losing money.
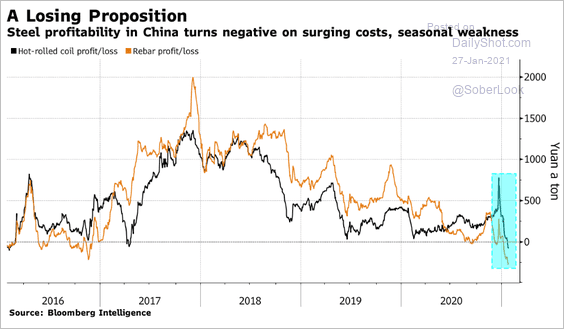 Source: @krystalchia, @business, Bloomberg Finance L.P.
Back to Index
Emerging Markets
1. Let’s begin with Mexico.
• Retail sales and the overall economic activity continued to recover in November.


• Domestic bond yields are at multi-year lows.

——————–
2. The rebound in Brazil’s inflation has been slowing.

Brazil’s consumer confidence is deteriorating again.

——————–
3. EM equities have outperformed the S&P 500 in US-dollar terms.

EM stocks remain significantly undervalued versus US stocks.
 Source: BCA Research
——————–
4. Here is the GDP per capita for select economies (as % of US GDP per capita).
 Source: @WSJ Read full article
Back to Index
China
1. Money market rates continue to climb.
 Source: Reuters Read full article

——————–
2. Industrial profits are up 20% vs. a year ago.

3. Shipping costs have surged in recent weeks.
 Source: Barclays Research
4. Chinese companies increasingly dominate the domestic heavy equipment market.
 Source: @WSJ Read full article
5. China dominates the world’s lithium-ion battery supply chain.
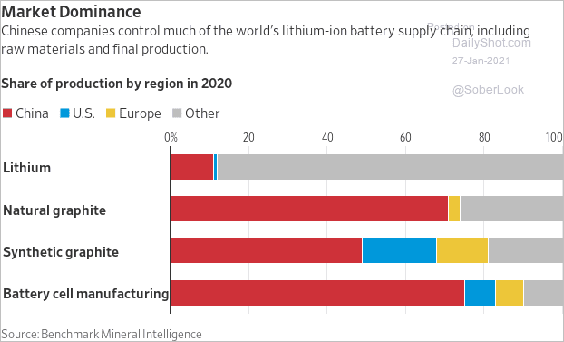 Source: @WSJ Read full article
6. Hong Kong’s exports accelerated in December.

Back to Index
Asia – Pacific
1. Singapore’s industrial production growth remains strong.

2. South Korea’s consumer confidence continues to improve.

3. Next, we have some updates on Australia.
• Consumer confidence is now above pre-COVID levels.

 Source: ANZ Research
• Business confidence pulled back from the November multi-year high.

• The Q4 CPI was a bit stronger than expected but remains well below the RBA target.

 Source: ANZ Research
Back to Index
Europe
1. The ECB is expected to remain accommodative, which should cap the rise in bond yields.
 Source: BCA Research
2. This chart shows the pace of vaccinations across the EU.
 Source: @jfkirkegaard
Back to Index
The United Kingdom
1. The CBI report showed deterioration in retail activity this month.
 Source: Reuters Read full article

——————–
2. Retail post-holiday discounting and store closures pushed the BRC shop price inflation near record lows.

3. UK consumption has underperformed other advanced economies.
 Source: @WSJ Read full article
4. The unemployment rate (average of September, October, and November) was a bit lower than expected.
 Source: @financialtimes Read full article

——————–
5. Businesses are concerned about shortages.
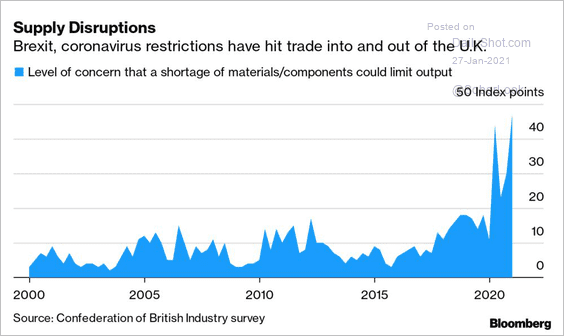 Source: @business Read full article
6. When will schools reopen?
 Source: Pantheon Macroeconomics
7. Here is an illustration of the north-south mobility gap.
 Source: Huq Read full article
8. UK equities are in a secular downtrend relative to the euro area. Will support hold?
 Source: BCA Research
9. This chart shows UK equity index sector weights vs. the US.
 Source: Pantheon Macroeconomics
10. EUR/GBP is testing support again.

Back to Index
The United States
1. US consumer confidence ticked higher in January (according to the Conference Board).

• Sentiment changes have not been even across income categories.

This confidence gap is also showing up in this well-being survey.
 Source: @BW Read full article
• The labor differential (“jobs plentiful” – “jobs hard to get”) is not recovering.

• With the “jobs hard to get” indicator on the rise, will we see an increase in the unemployment rate?
 Source: Mizuho Securities USA
——————–
2. Home price appreciation surprised to the upside again. The Case-Shiller national index is approaching 10% year-over-year gains.

The FHFA’s home price index is up 11% relative to November of 2019, exceeding the housing bubble peak.

The gap between wages and home prices continues to widen.

——————–
3. The Richmond Fed’s manufacturing index showed some loss of momentum this month.

• Forward-looking indicators softened.

• However, employment metrics remain robust.

• Unlike in other regions (see example), the report showed severe supply-chain bottlenecks (exceeding the China tariffs crunch in 2018).

Back to Index
Global Developments
1. Very few market participants see no bubbles, according to a Deutsche Bank survey.
 Source: Deutsche Bank Research
2. Which economies will recover to pre-COVID levels this year?
 Source: IMF,@markets Read full article
3. The global manufacturing recovery will likely benefit risk-on currencies.
 Source: BCA Research
4. This chart shows the combined “total wealth” in the US, UK, Japan, and the Eurozone.
 Source: Natixis
——————–
Food for Thought
1. Americans’ favorite savings strategies:
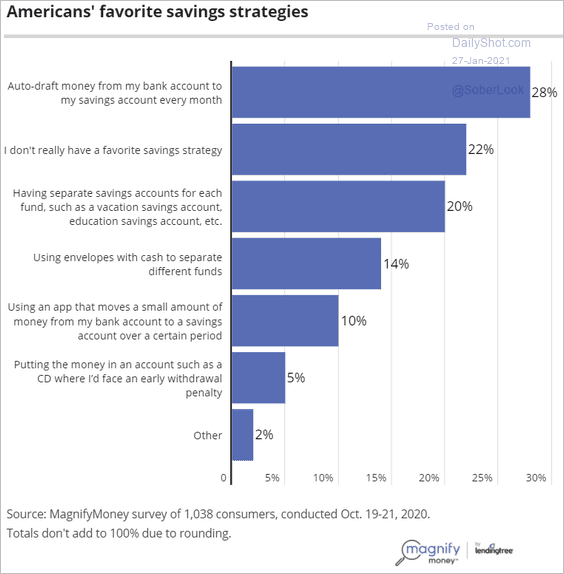 Source: MagnifyMoney Read full article
2. The global market value of plant-based meat:
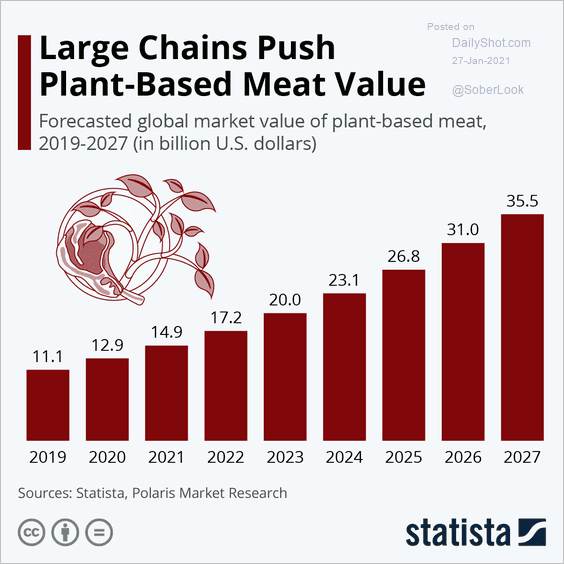 Source: Statista
3. US COVID deaths by region:
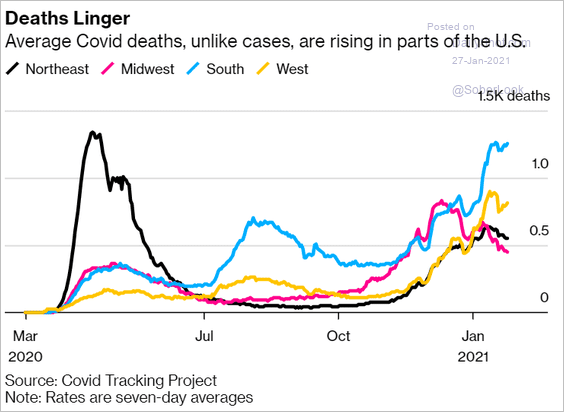 Source: @bpolitics Read full article
4. Working from home:
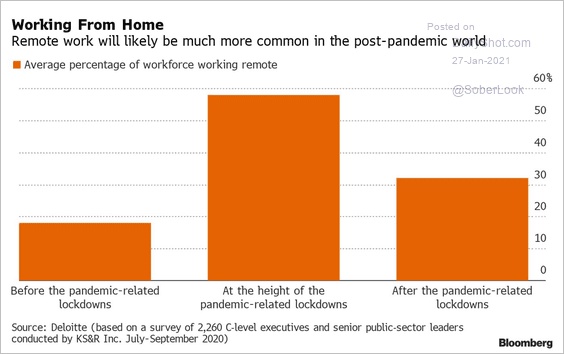 Source: @business Read full article
5. Employment status vs. child’s learning arrangement:
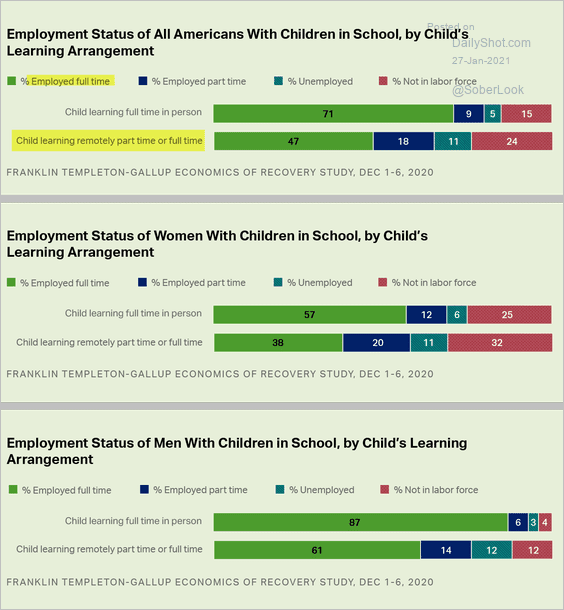 Source: Gallup Read full article
6. Satisfaction with the way things are going in the US:
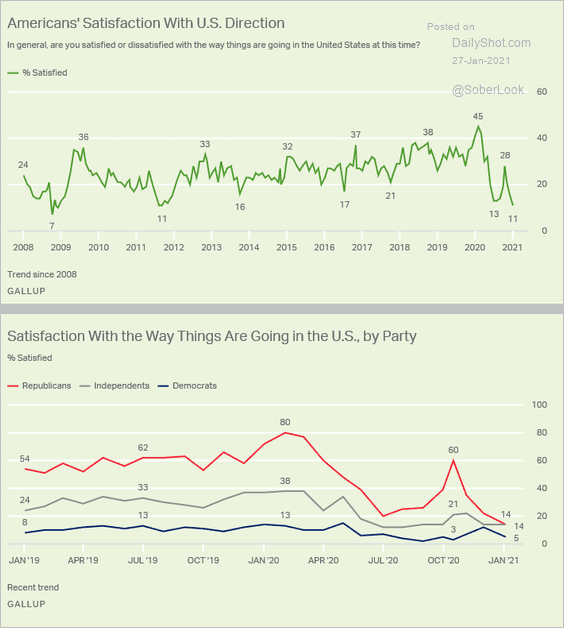 Source: Gallup Read full article
7. Capitol riot arrests:
 Source: Statista
8. Firearms in civilian hands:
 Source: Statista
9. Tracking one eagle over a 20-year span:
![]() Source: Playjunkie, h/t Walter Read full article
Source: Playjunkie, h/t Walter Read full article
——————–
Back to Index