
The Daily Shot: 30-Aug-21
• Administrative Update
• The United States
• The Eurozone
• Japan
• Asia – Pacific
• China
• Emerging Markets
• Cryptocurrency
• Energy
• Equities
• Rates
• Global Developments
• Food for Thought
Administrative Update
1. Please note that The Daily Shot will not be published on Friday, September 3rd and Monday, September 6th.
2. All administrative updates are posted online.
Back to Index
The United States
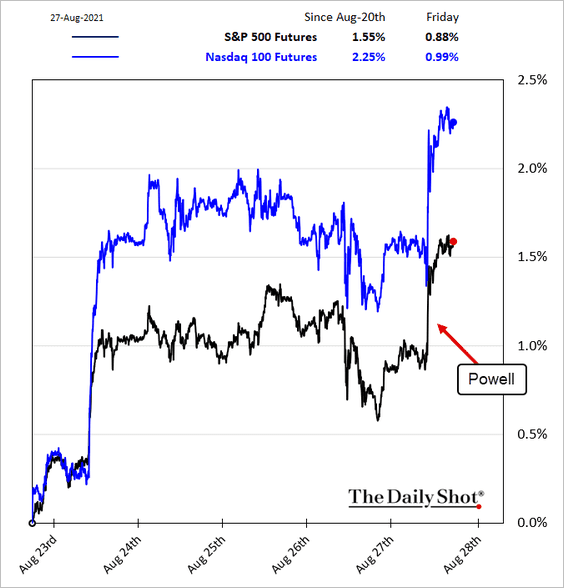
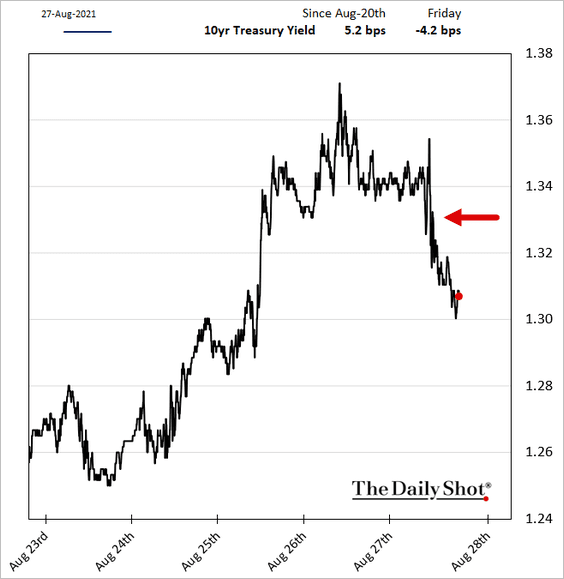
1. Fed Chair Powell reiterated the central bank’s intention to begin tapering later this year if the economy performs as expected. However, Powell decoupled taper from rate hikes.
The timing and pace of the coming reduction in asset purchases will not be intended to carry a direct signal regarding the timing of interest rate liftoff, for which we have articulated a different and substantially more stringent test.
 Source: CNBC Read full article
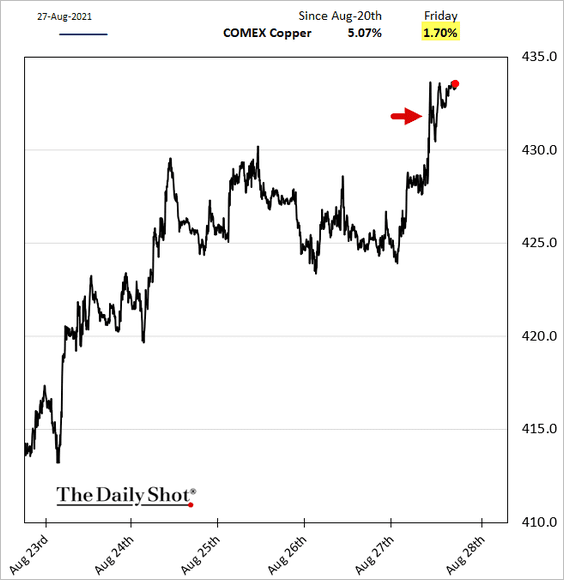
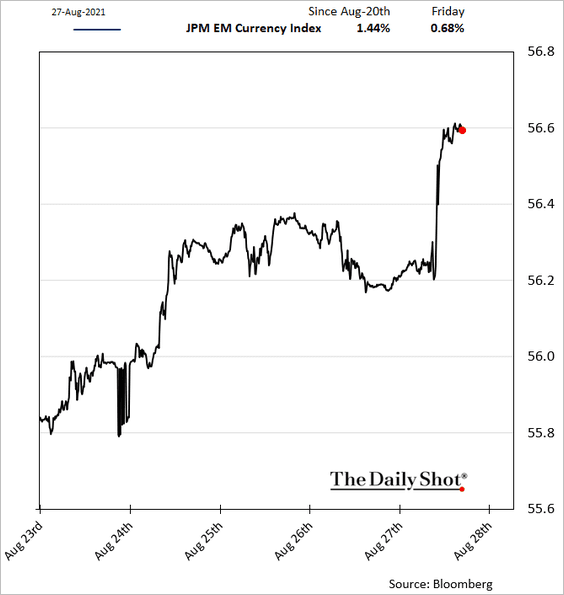
• Risk assets surged.
– Stocks:
– Copper:
– EM Currencies:
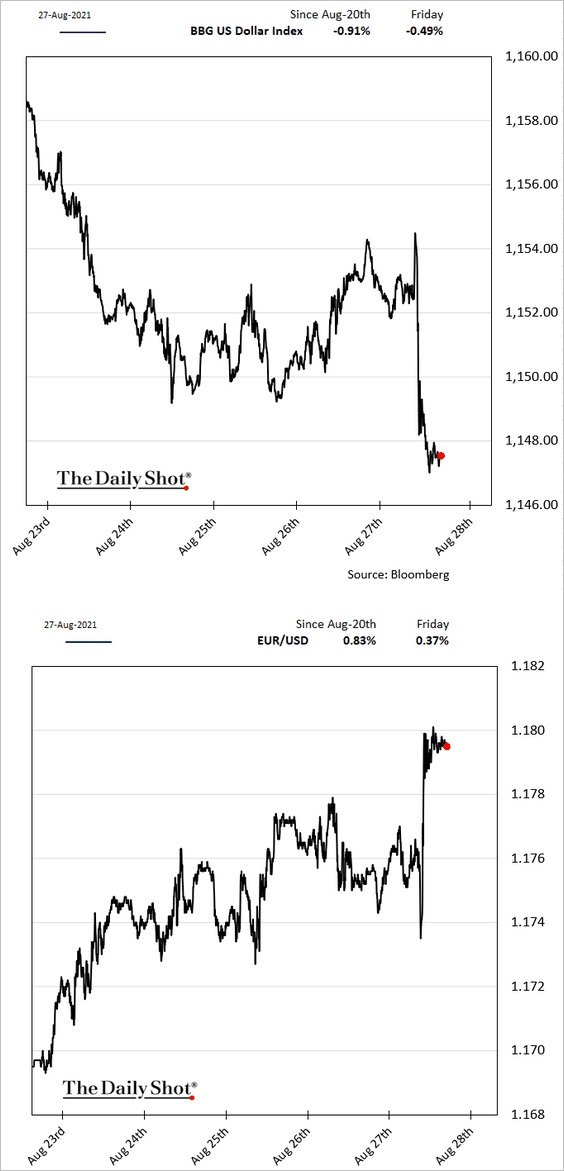
• The dollar and Treasury yields slumped.
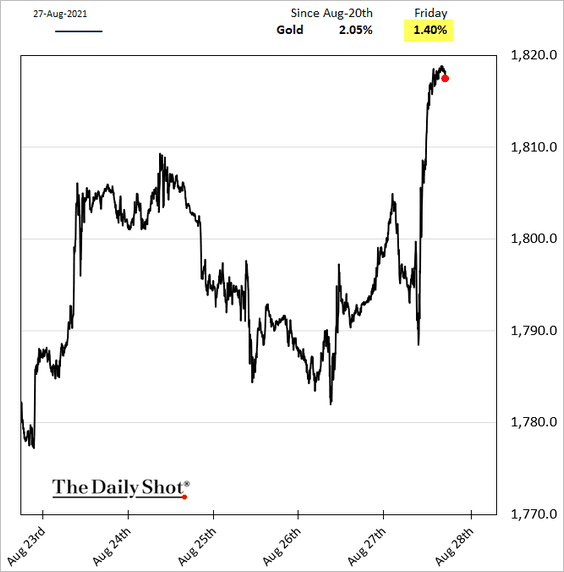
• Gold shot up 1.4%.
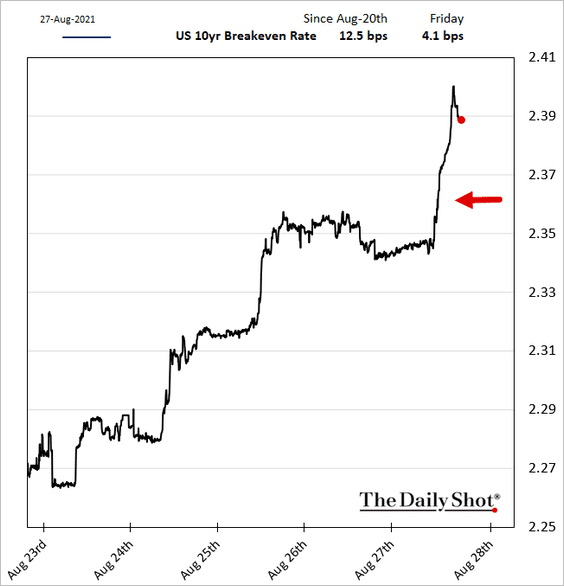
• Inflation expectations moved higher (the market expects the Fed to let inflation “overshoot”).
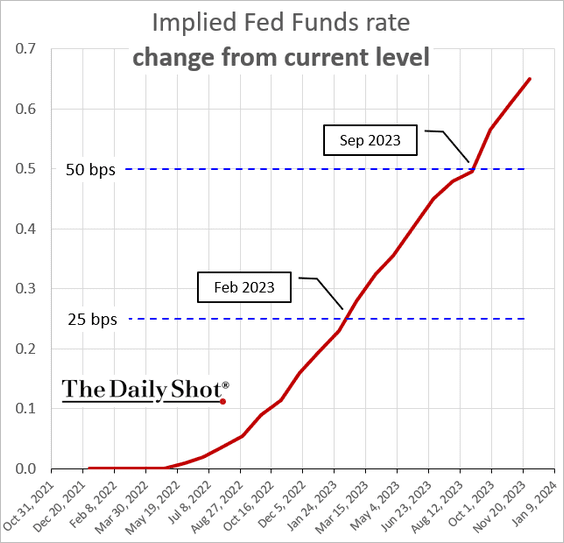
• The market is pricing in the first full 25 bps hike by February of 2023.
——————–
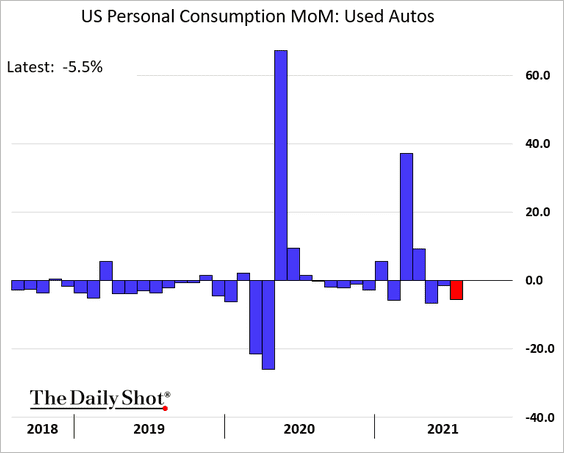
2. Last month’s consumer spending was a bit below consensus, …
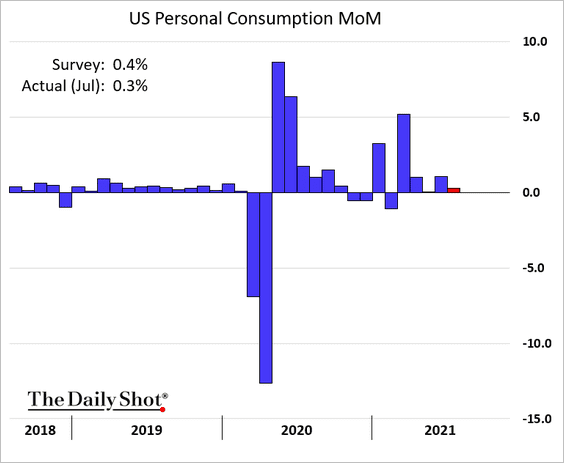
… pulled down by weaker automobile purchases.
 Source: Reuters Read full article
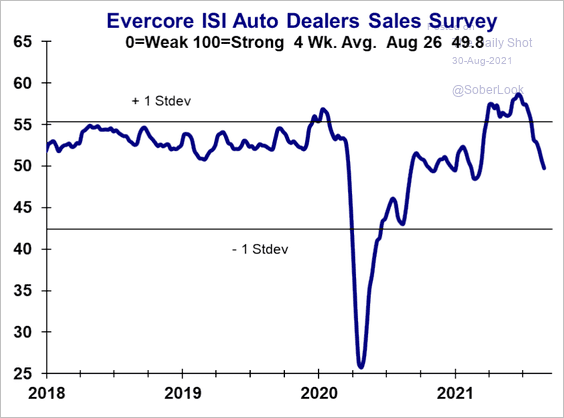
By the way, this slowdown is visible in the Evercore ISI auto dealers’ survey.
 Source: Evercore ISI
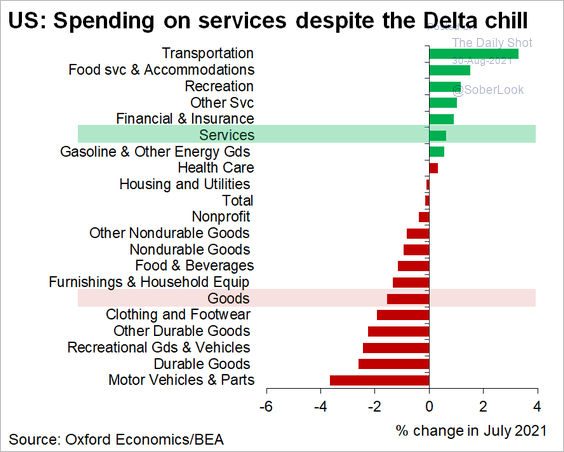
• Here is the breakdown by sector.
 Source: @GregDaco
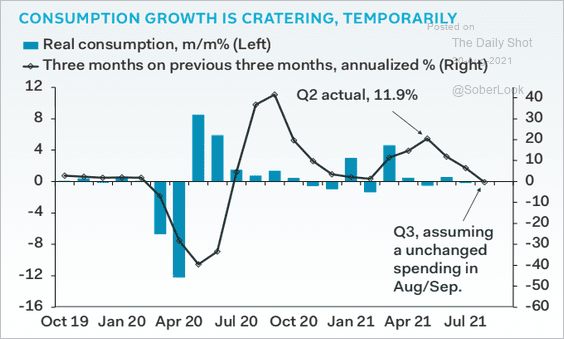
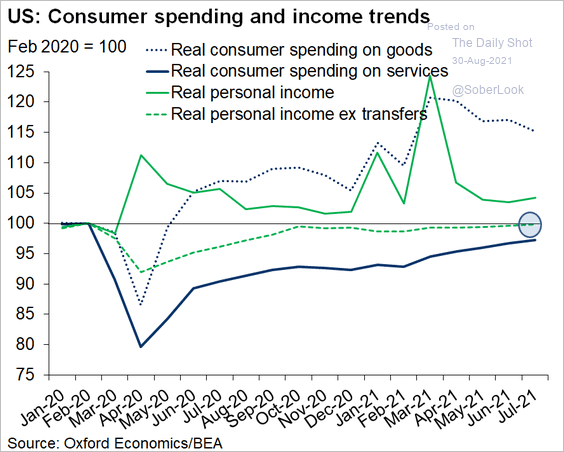
• Spending remains above the pre-COVID trend.
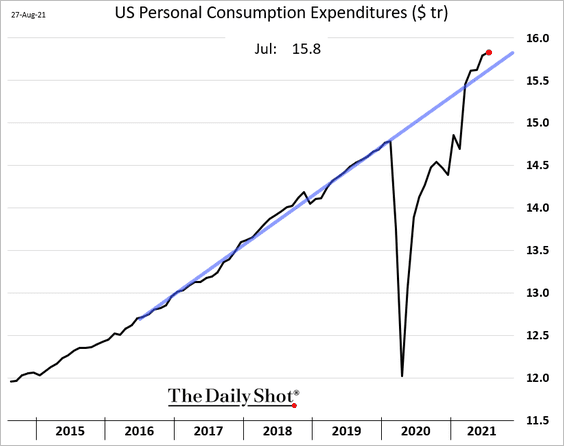
But inflation-adjusted consumption has returned to trend.
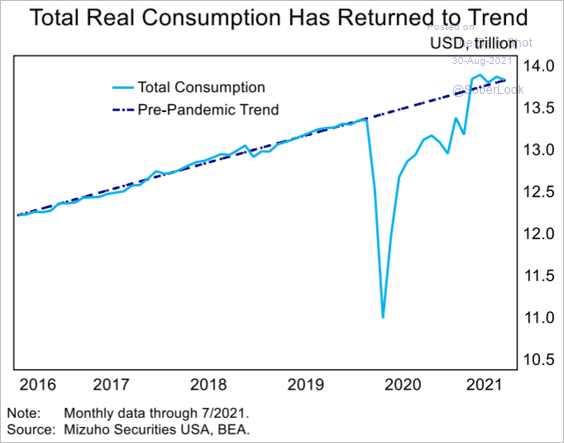 Source: Mizuho Securities USA
• Goods spending is declining while services expenditures are gradually recovering.
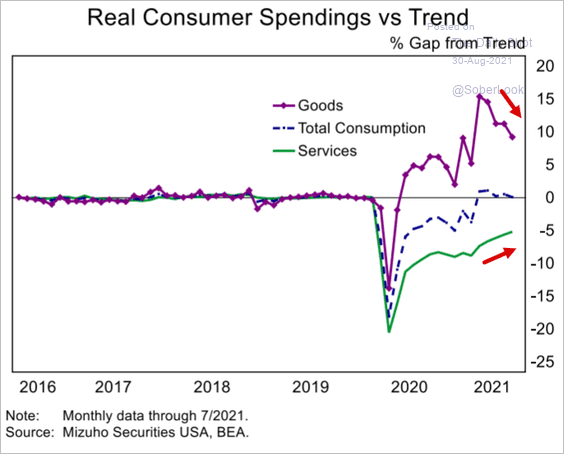 Source: Mizuho Securities USA
Durable goods spending has been slowing, with household durables shares underperforming recently.
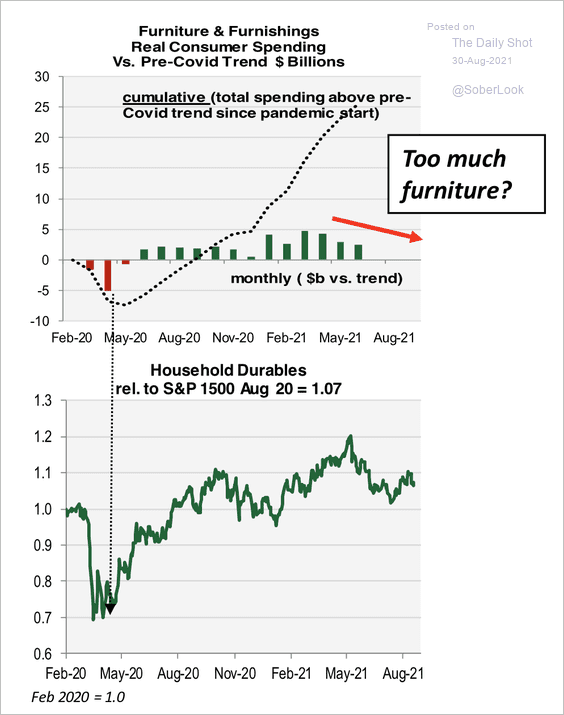 Source: Cornerstone Macro
• Softer spending …
 Source: Pantheon Macroeconomics
… will result in GDP growth downgrades. Here is the Atlanta Fed’s GDP Now model.
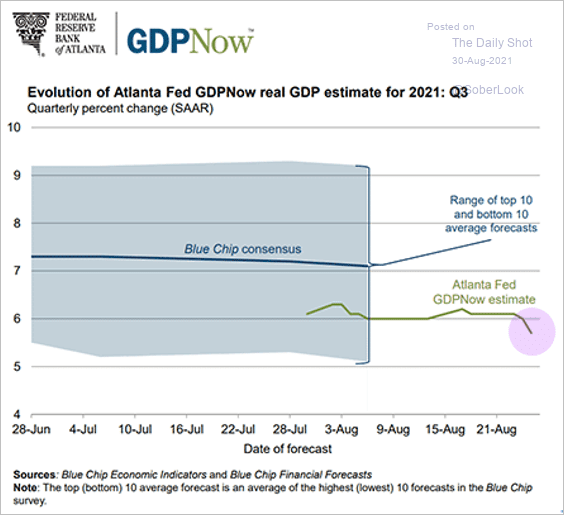 Source: @AtlantaFed Read full article
——————–
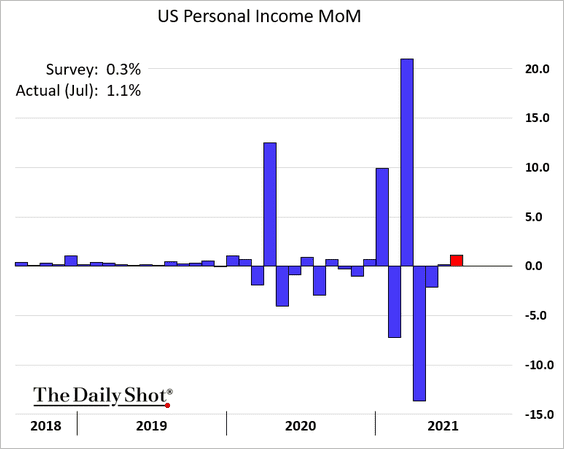
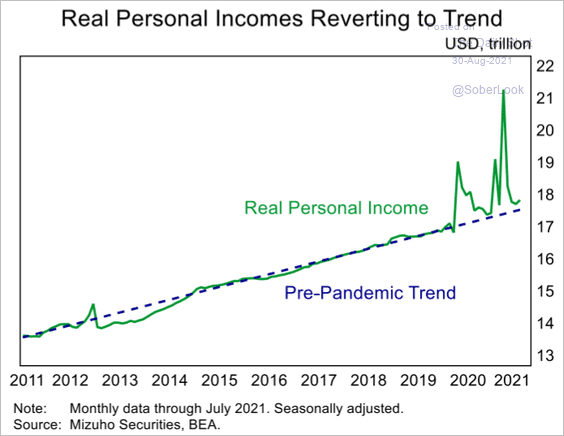
3. Personal income topped forecasts, running slightly above trend.
 Source: Mizuho Securities USA
Excluding transfers (government payments), personal income has just returned to pre-COVID levels.
 Source: @GregDaco
——————–
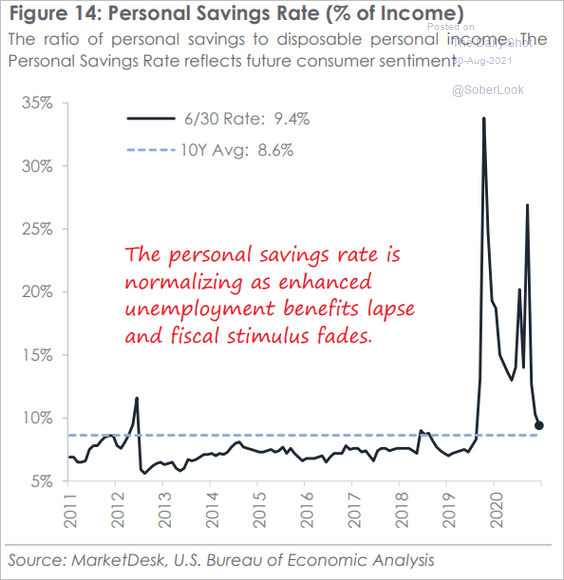
4. The personal savings rate is normalizing.
 Source: MarketDesk Research
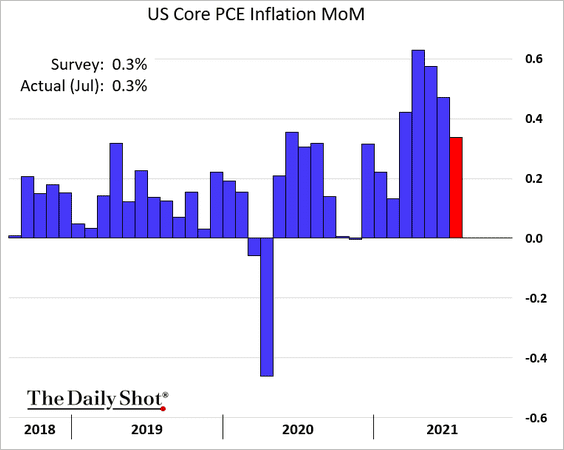
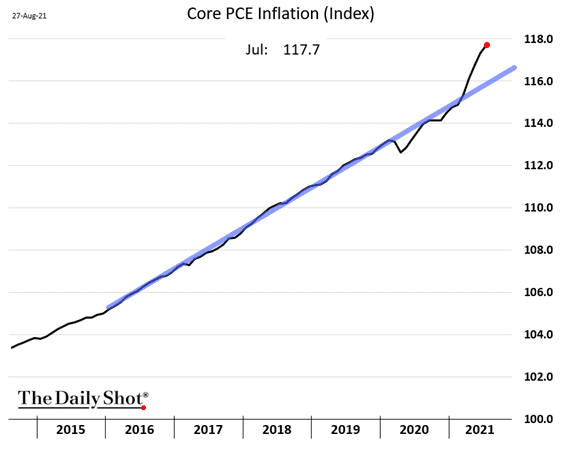
5. The PCE inflation grew at a slower rate last month.
——————–
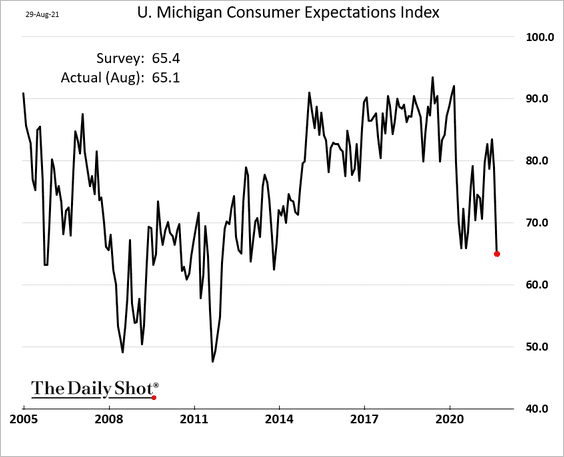
6. The updated U. Michigan consumer sentiment figures were even weaker than the earlier report.
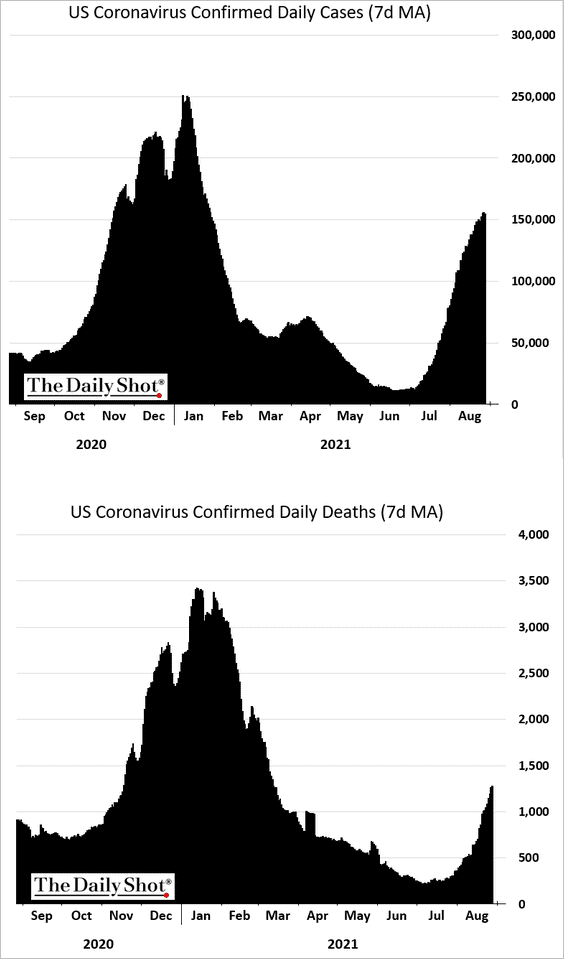
7. Next, we have some high-frequency trends.
• COVID cases:
• The Evercore ISI restaurants survey:
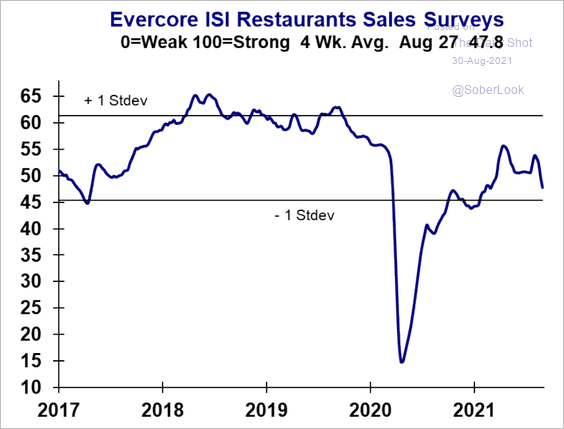 Source: Evercore ISI
• Air travel:
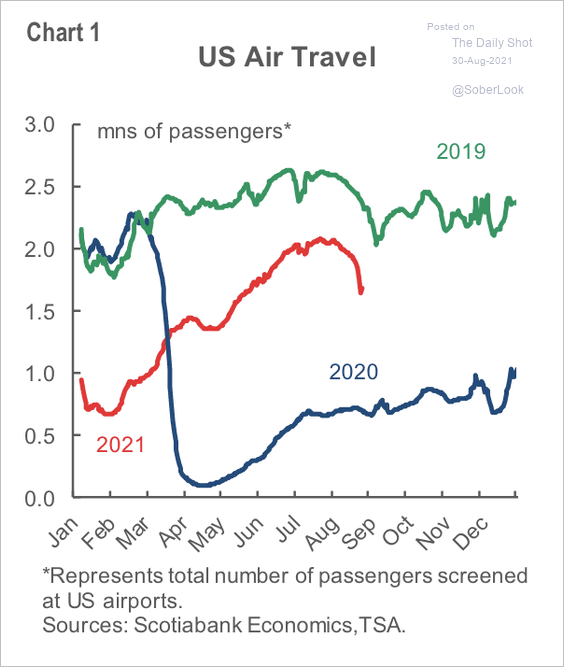 Source: Scotiabank Economics
• Mobility trends:
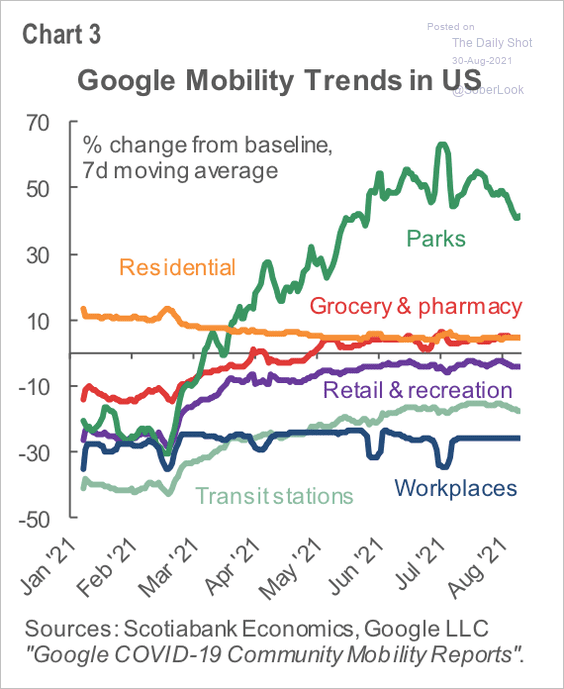 Source: Scotiabank Economics
• Public transport usage:
![]() Source: Scotiabank Economics
Source: Scotiabank Economics
Back to Index
The Eurozone
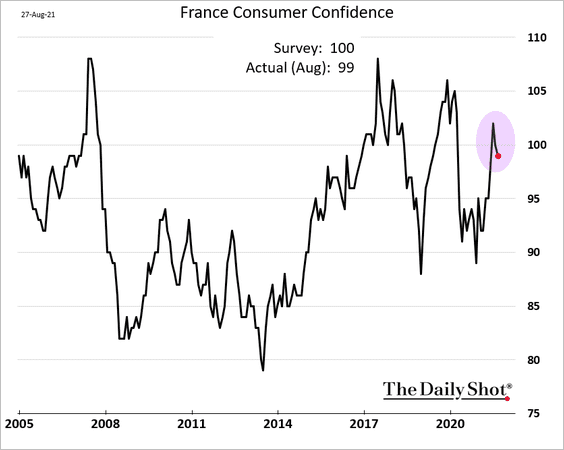
1. French consumer confidence declined again.
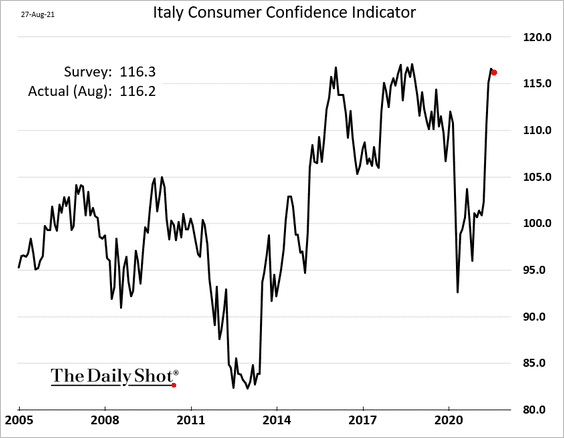
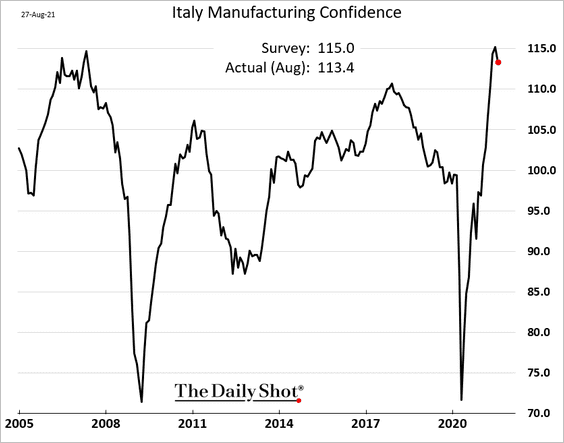
2. Italian consumer and manufacturing confidence indicators appear to have peaked.
——————–
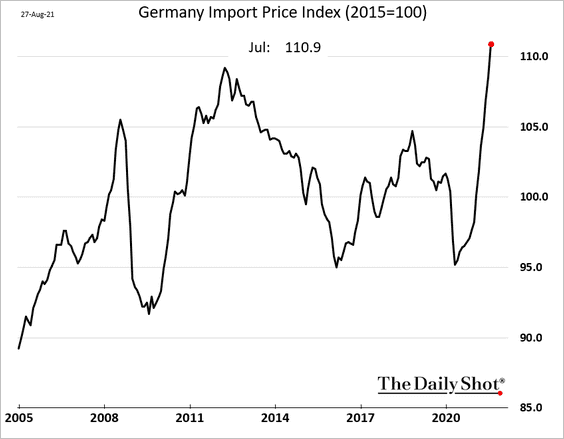
3. German import prices are surging.
Separately, SPD continues to climb in the polls.
 Source: Reuters Read full article
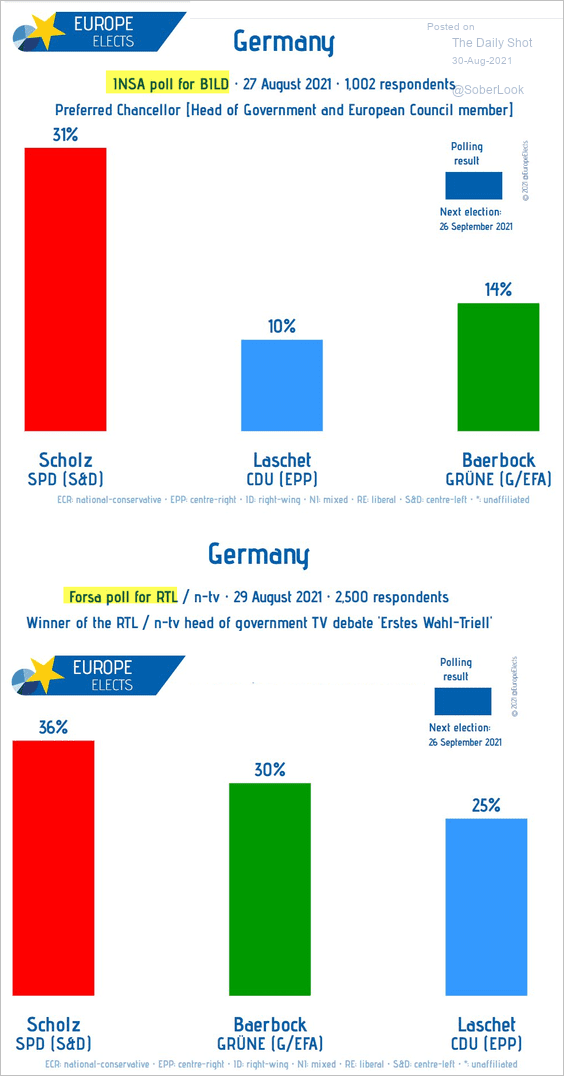 Source: @EuropeElects Read full article
Here are the betting markets’ odds.
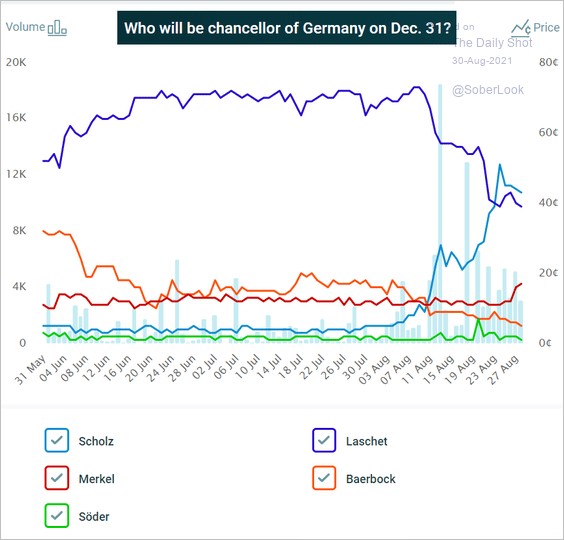 Source: @PredictIt
——————–
4. Eurozone marriage rates have been declining, except in Germany.
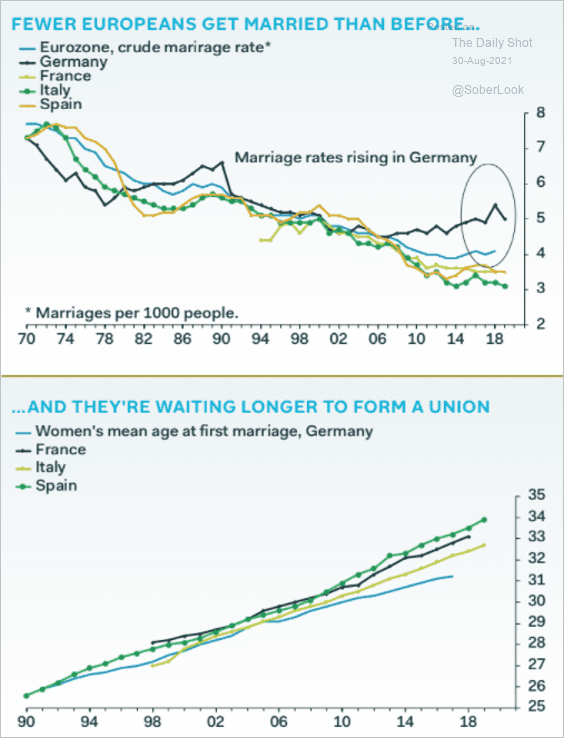 Source: Pantheon Macroeconomics
Back to Index
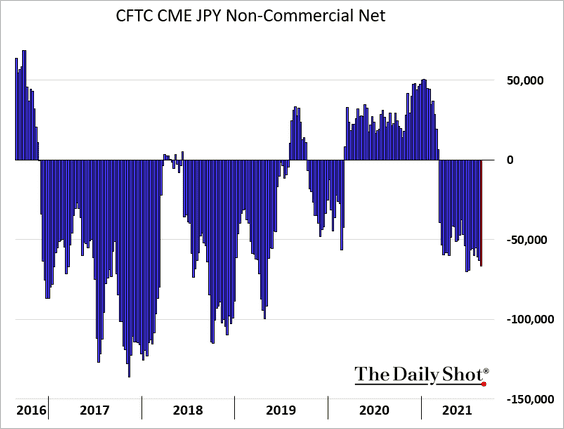
Japan
1. Speculators remain short the yen (often the short leg of carry trades).
2. Retail sales are approaching 2019 levels.
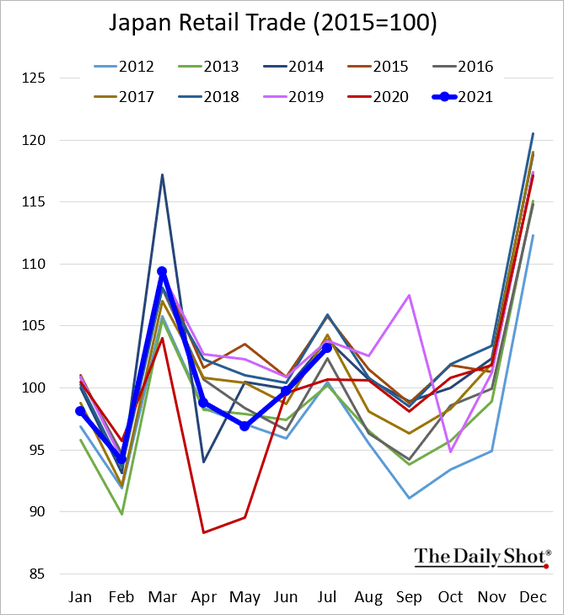
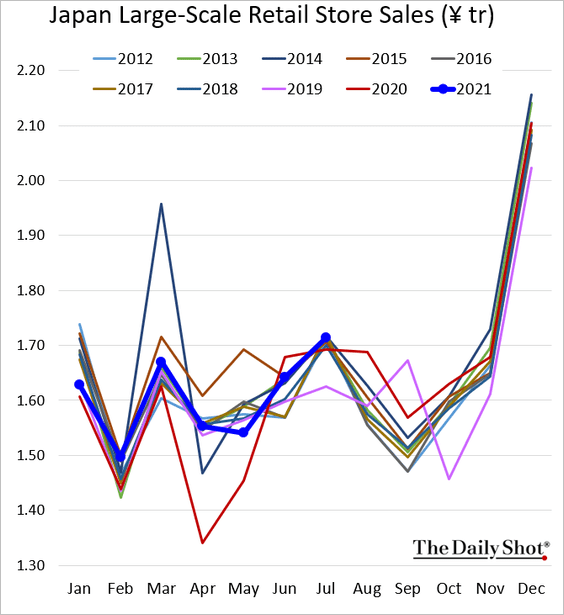
Large retail store sales are up sharply.
Back to Index
Asia – Pacific
1. Asian tech IPOs outside of China surged this year.
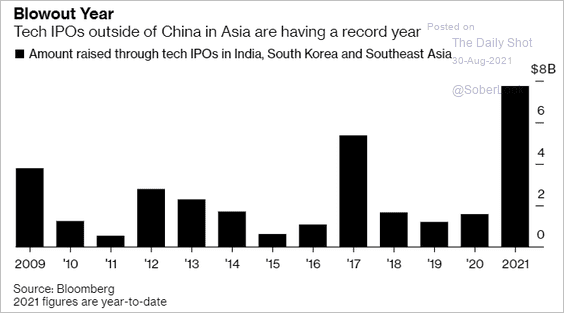 Source: @markets Read full article
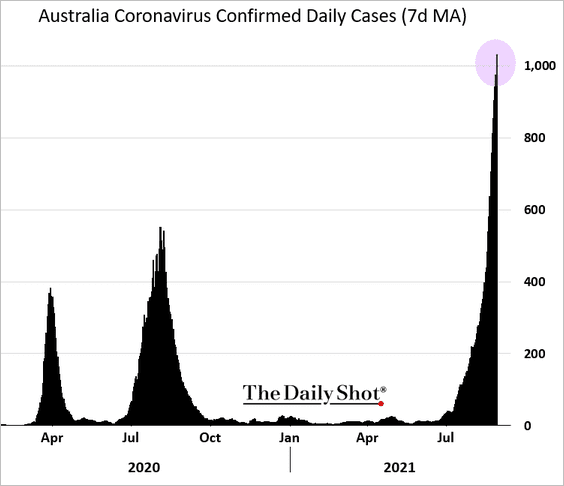
2. Australia’s COVID cases hit a new high.
 Source: Reuters Read full article
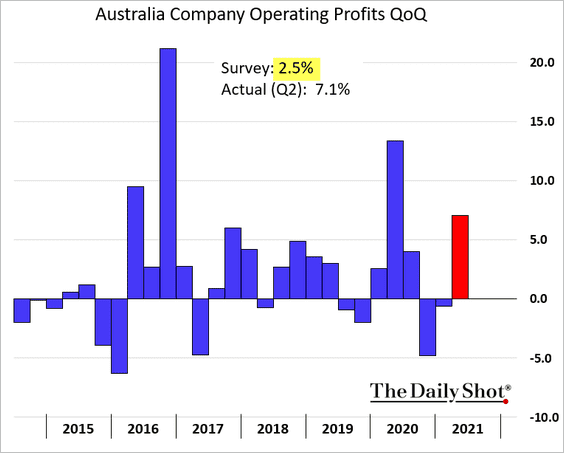
Separately, second-quarter corporate profits surprised to the upside.
Back to Index
China
1. The benchmark stock market index may test support again.
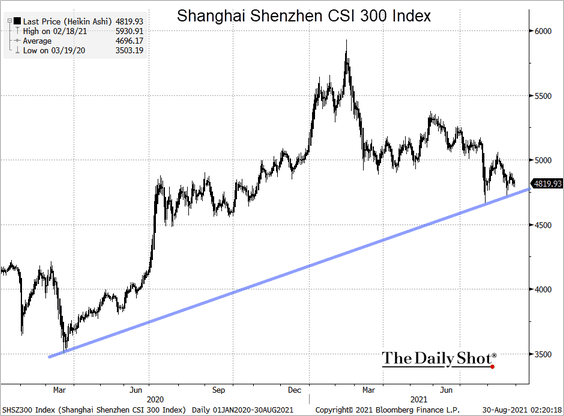 Source: @TheTerminal, Bloomberg Finance L.P.
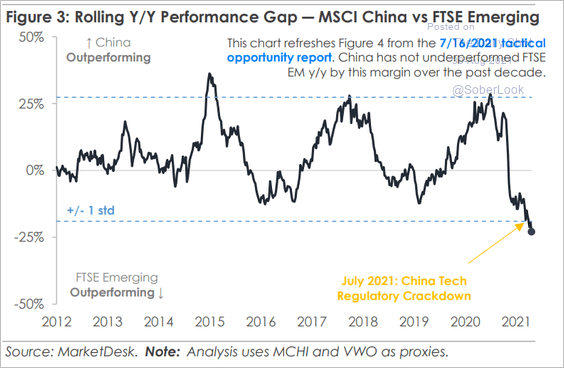
Shares have massively underperformed other emerging markets (2 charts).
 Source: MarketDesk Research
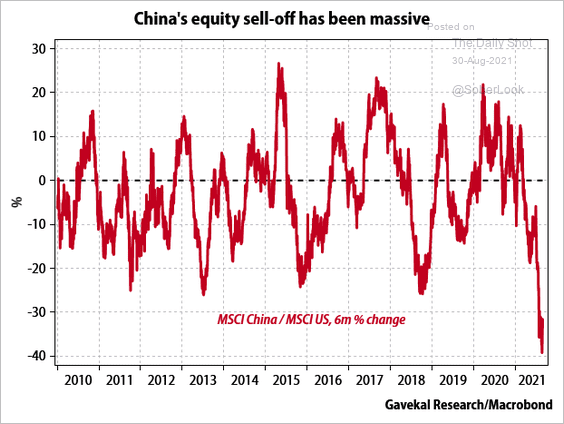 Source: Gavekal Research
——————–
3. International firms’ China sales have been weakening in line with the manufacturing PMI.
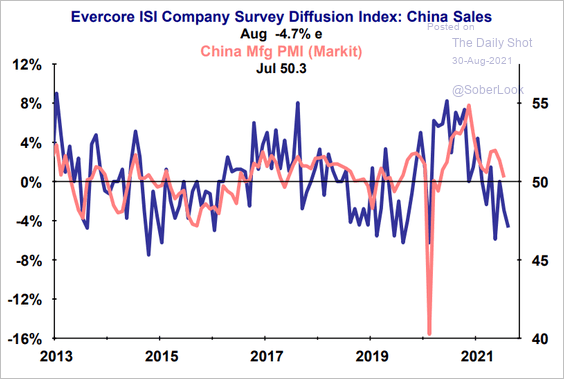 Source: Evercore ISI
Back to Index
Emerging Markets
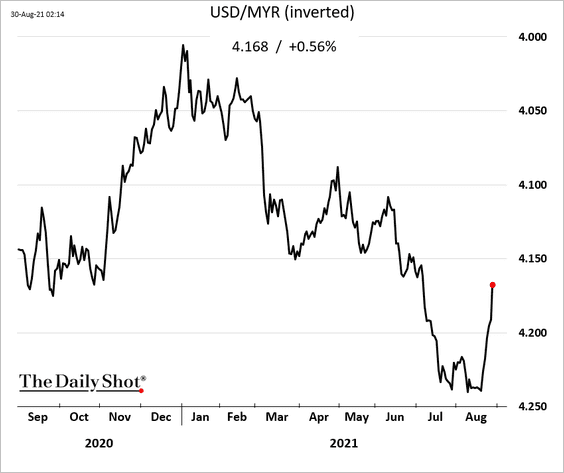
1. Asian currencies are rebounding.
• The Malaysian ringgit:
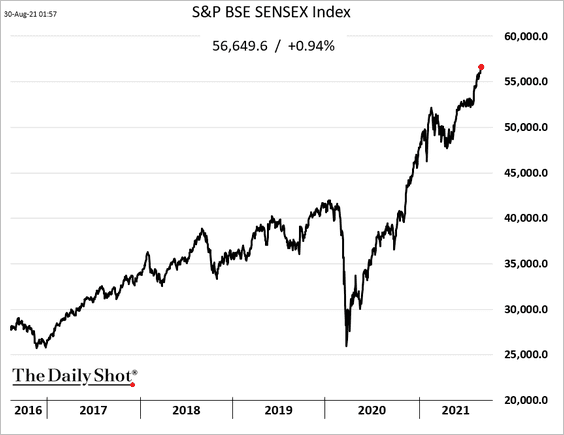
• The Indian rupee:
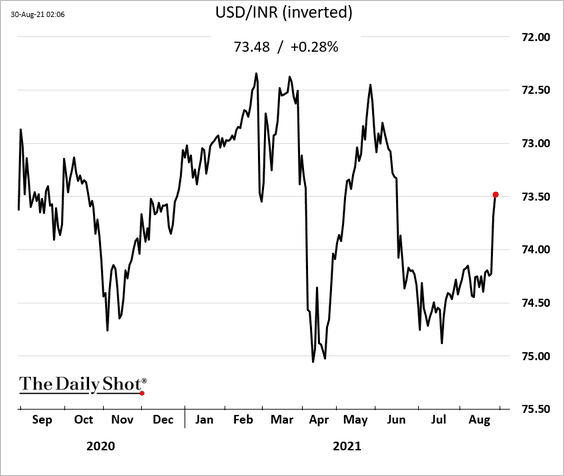
Indian shares continue to hit new highs.
——————–
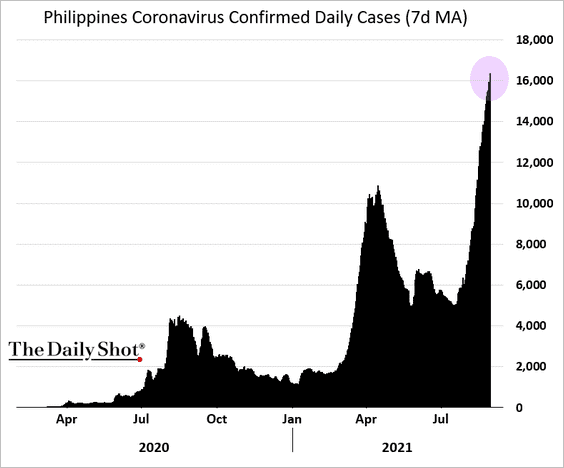
2. COVID cases in the Philippines are climbing.
 Source: Reuters Read full article
——————–
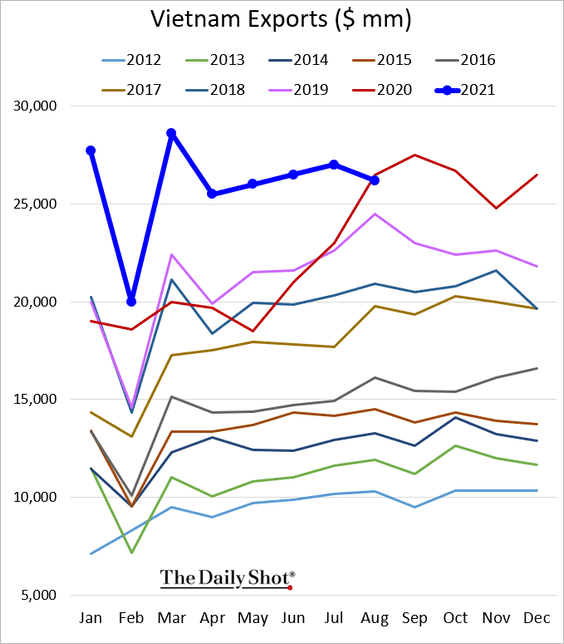
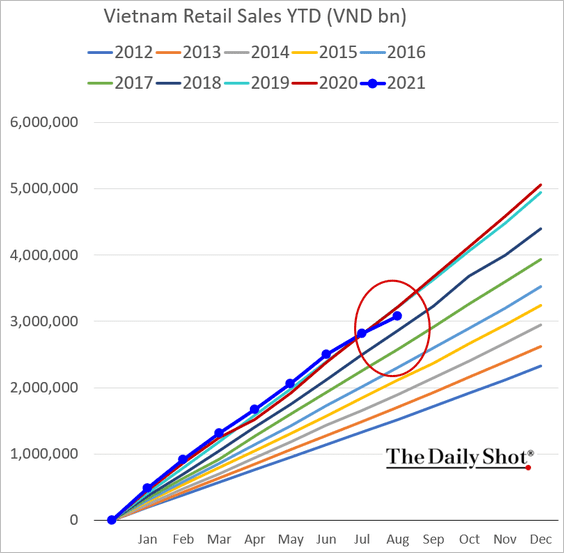
3. Vietnam’s exports slowed this month but remain strong.
The pandemic is pressuring Vietnam’s retail sales.
——————–
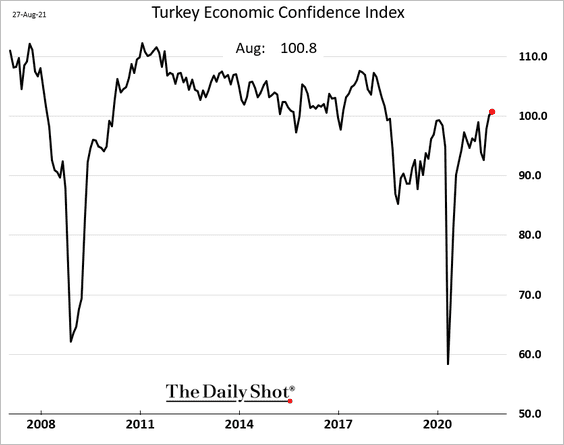
4. Turkey’s economic confidence is trending higher.
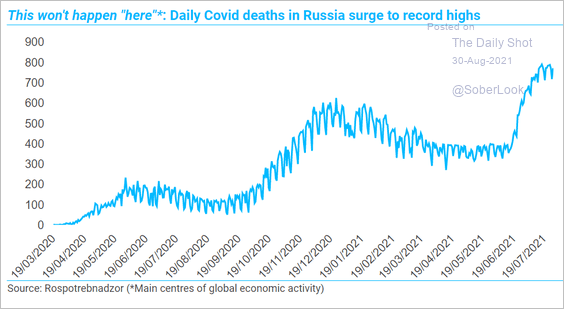
5. Russia’s COVID-related deaths are at record highs.
 Source: TS Lombard
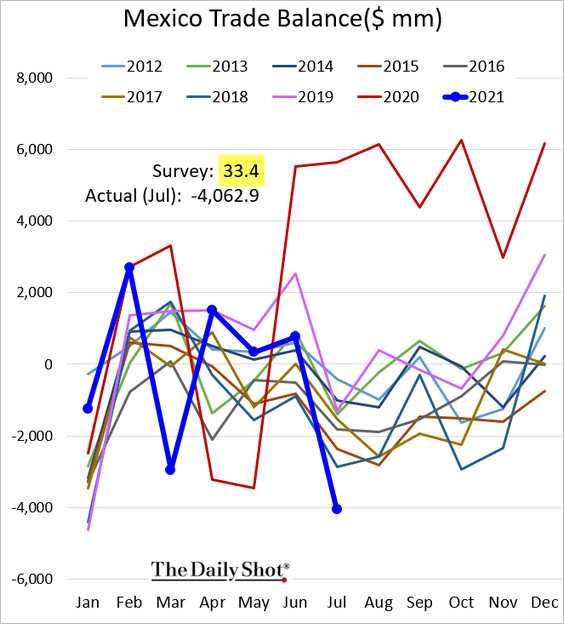
6. Mexico’s trade balance swung into a massive deficit, surprising economists.
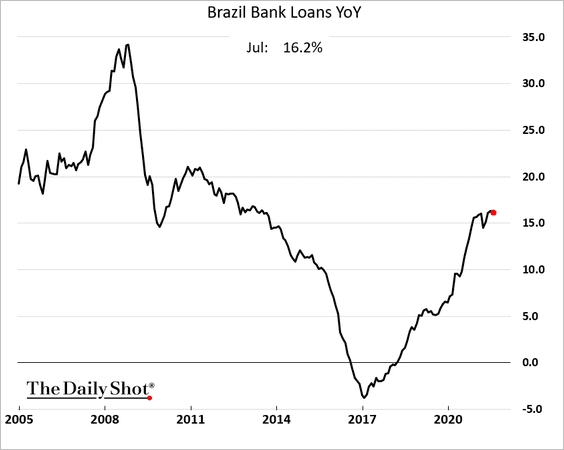
7. Bank lending in Brazil remains robust.
8. Many EM central banks have aggressively hiked rates since the beginning of this year.
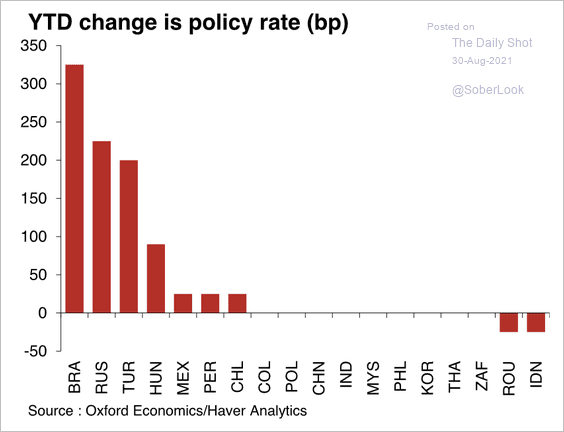 Source: Oxford Economics
9. Egyptian real yields are the highest among major EMs.
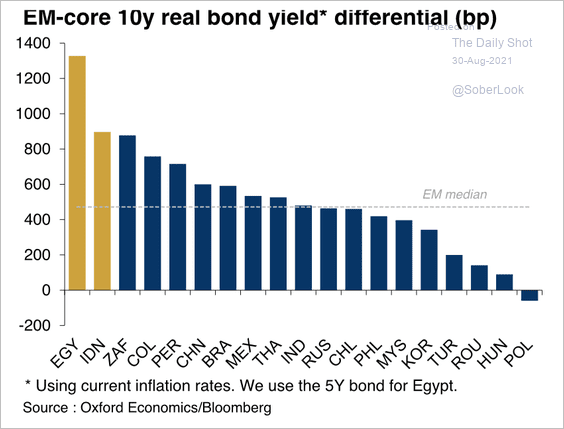 Source: Oxford Economics
10. EM equity correlations to commodities have been declining.
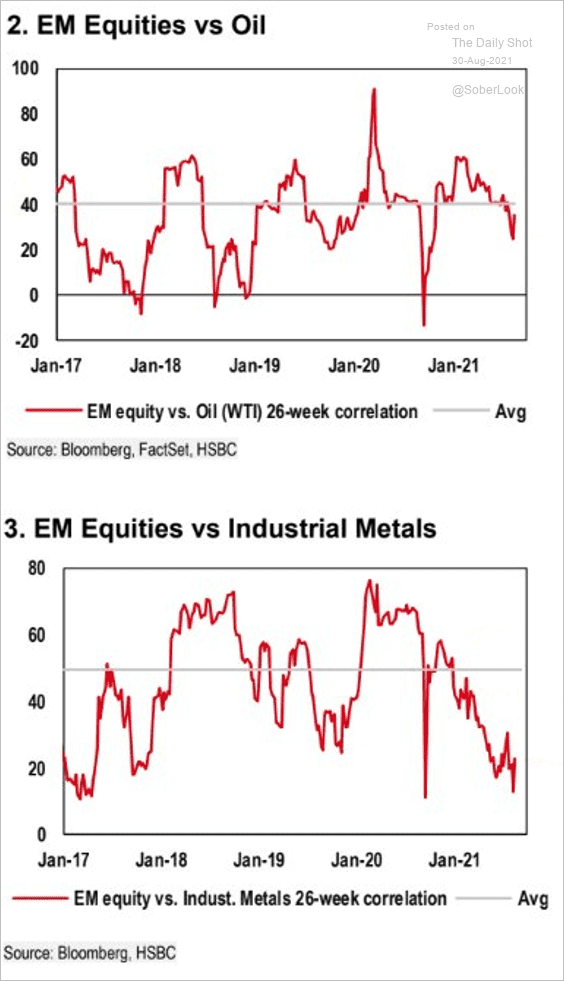 Source: HSBC Global Research
Back to Index
Cryptocurrency
1. XRP has outperformed other large cryptos this month.
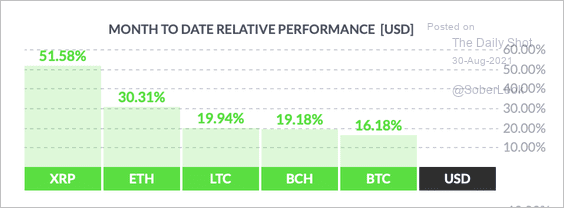 Source: FinViz
2. Extreme leverage is declining, as seen in the lower premium of bitcoin futures to spot prices over the past few months.
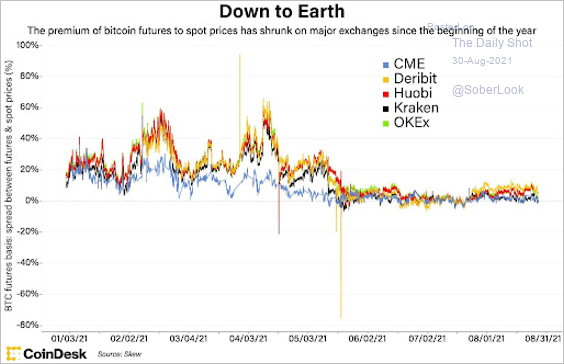 Source: CoinDesk Read full article
3. Bitcoin’s hashrate continues to recover as Chinese miners speed up their migration to alternate locales and US miners expand capacity.
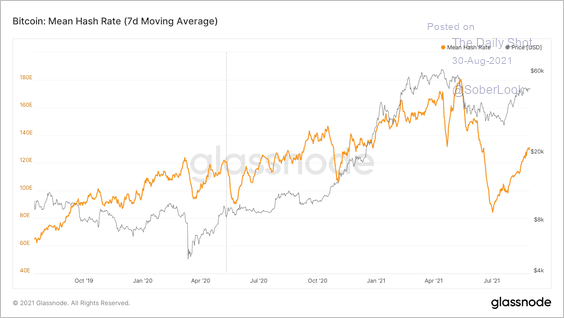 Source: Glassnode Read full article
4. Bitcoin has been declining in the middle of the week before rising towards the end of the week in August.
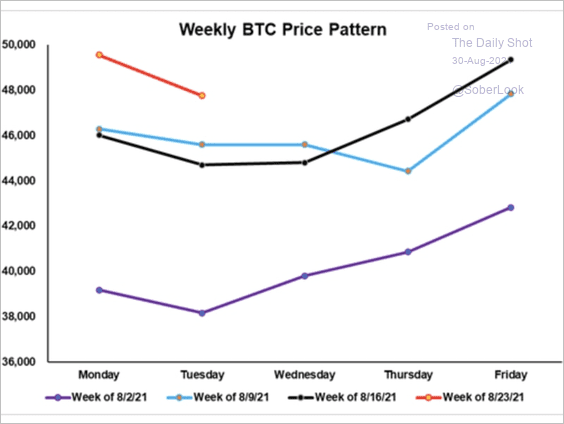 Source: FundStrat
5. Bitcoin and ether are lagging popular tech stocks on a risk-adjusted basis.
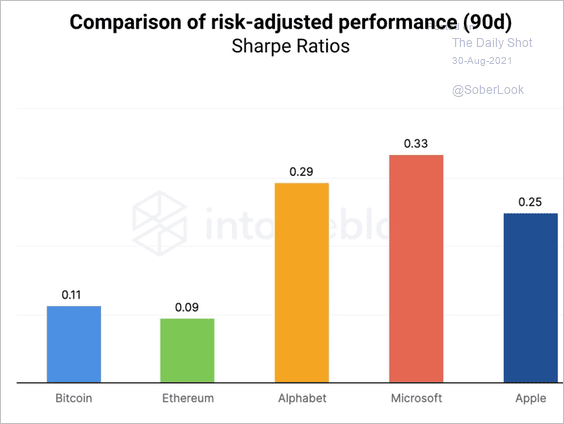 Source: IntoTheBlock
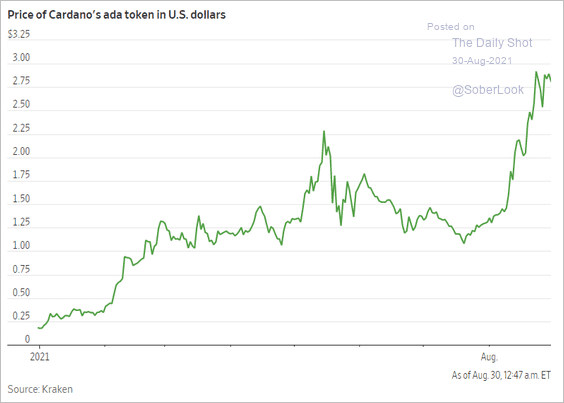
6. There has been a shift toward altcoins recently.
 Source: @markets Read full article
Here is the price chart of Cardano’s ADA token.
 Source: @WSJ Read full article
Back to Index
Energy
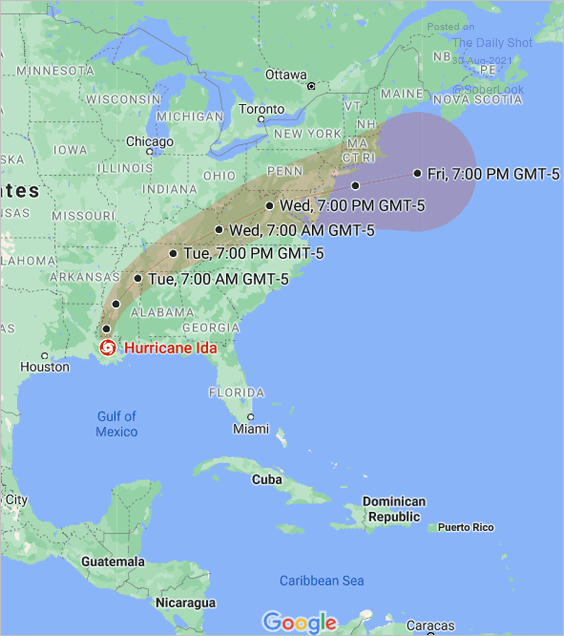
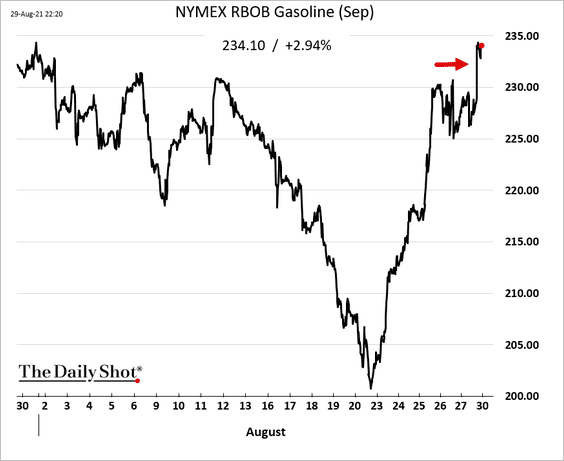
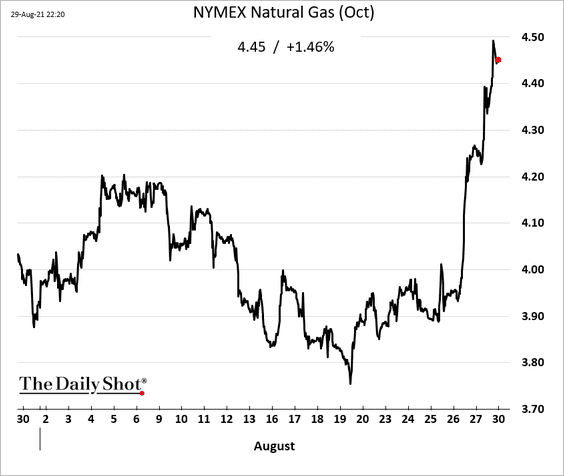
1. Hurricane Ida sent gasoline and natural gas prices higher this morning.
 Source: Google
 Source: Platts Read full article
——————–
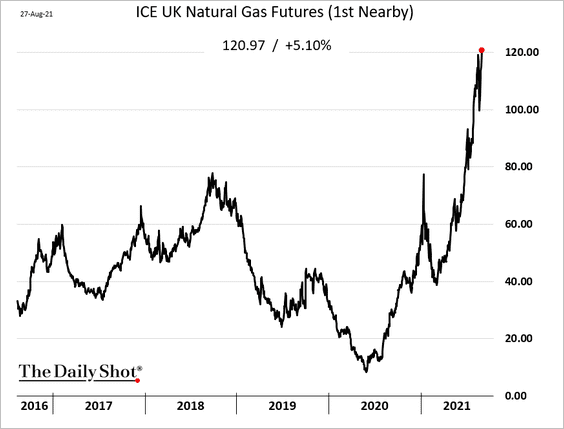
2. European natural gas prices continue to surge.
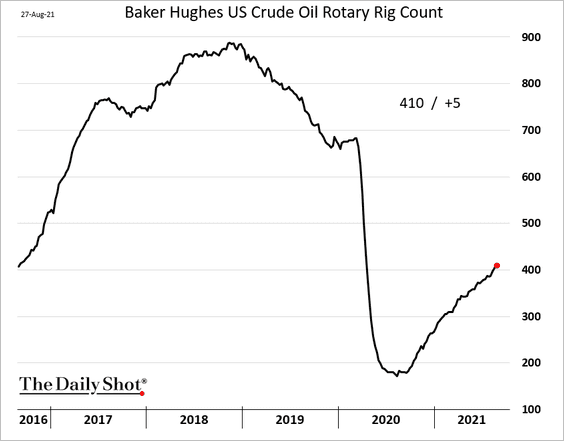
3. US rig count recovery picked up in recent weeks.
Back to Index
Equities
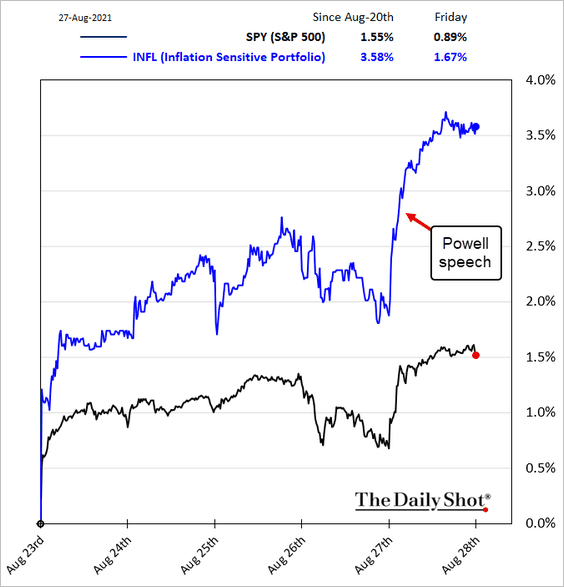
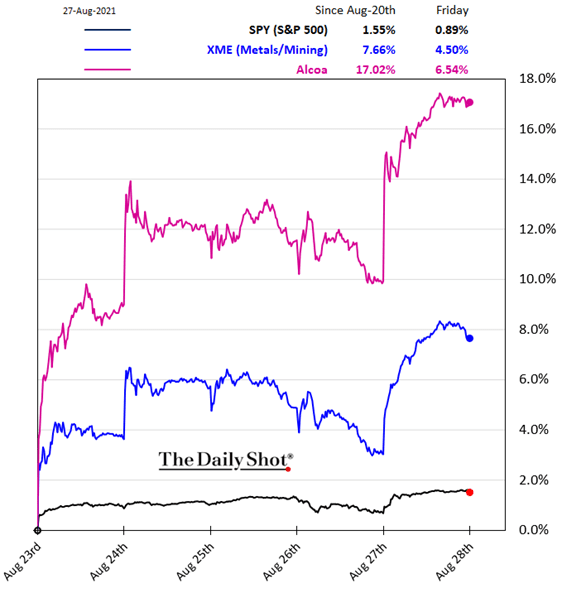
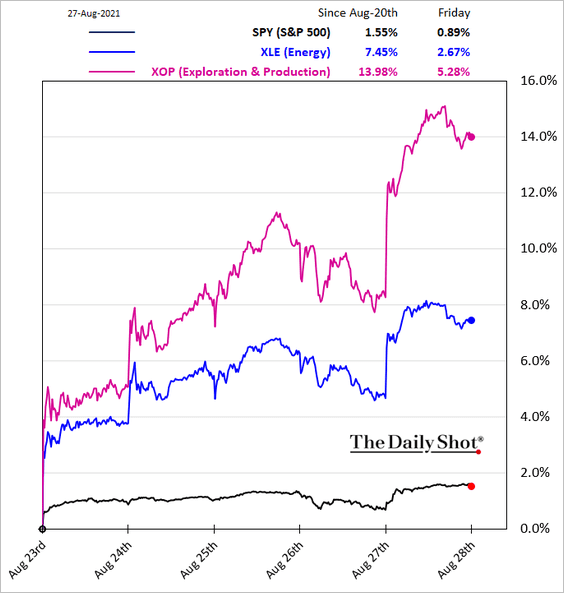
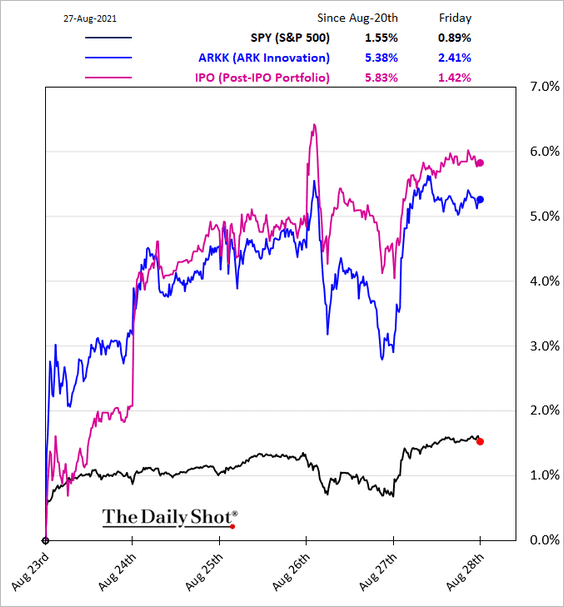
1. Powell’s dovish speech (decoupling taper from rate hikes) sent inflation-sensitive shares up sharply. US indices hit record highs.
• Inflation ETF:
• Metals & Mining:
• Energy:
Riskier stocks that benefit the most from lower rates also rallied.
• Small caps:
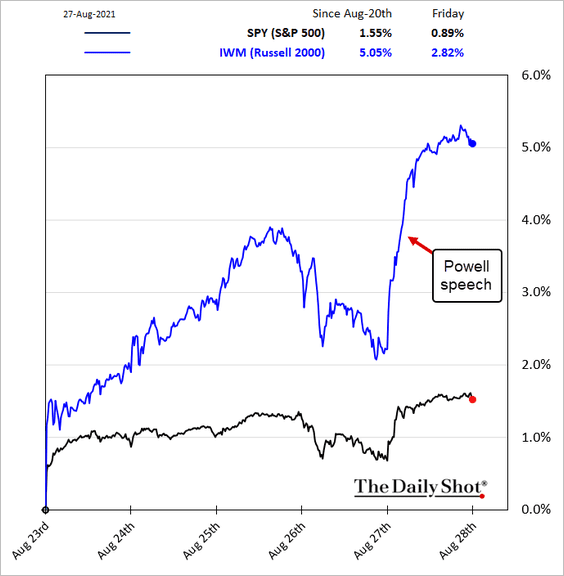
• High-growth/speculative stocks:
——————–
2. The iShares Russell 2,000 small-cap ETF (IWM) is holding support relative to the S&P 500.
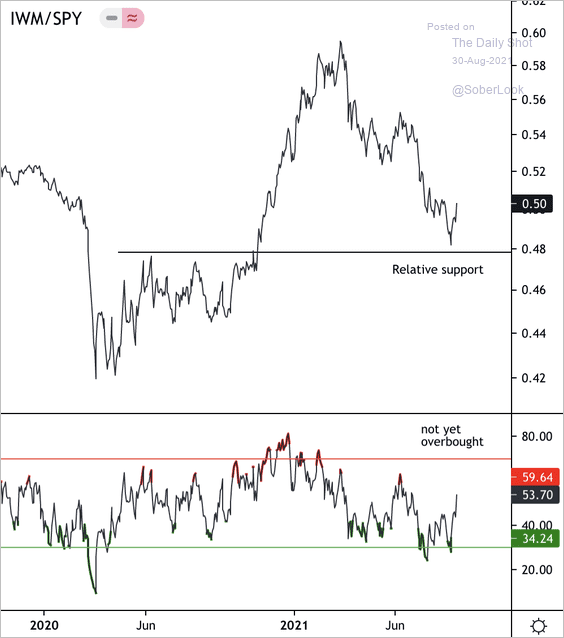 Source: Dantes Outlook
Micro-cap stocks are starting to rise relative to the broader market after a period of underperformance (increased risk appetite).
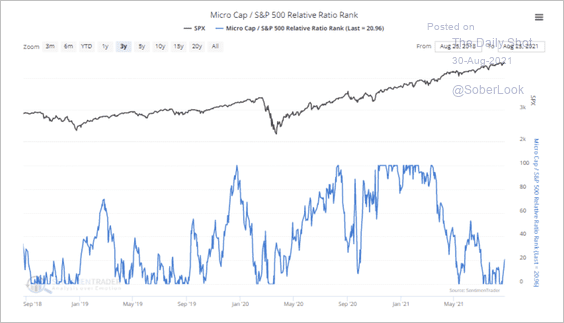 Source: SentimenTrader
——————–
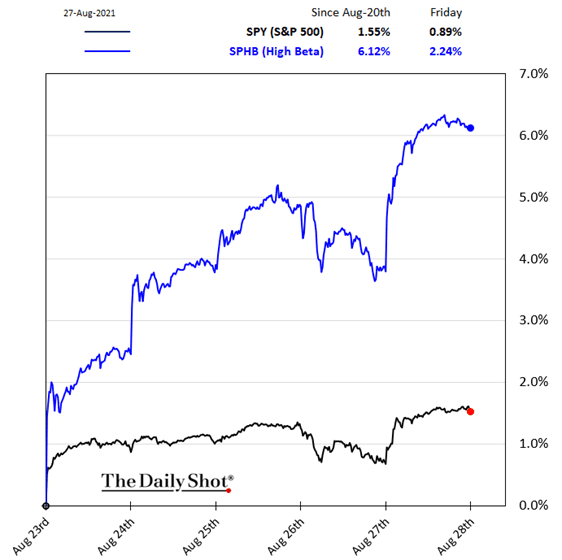
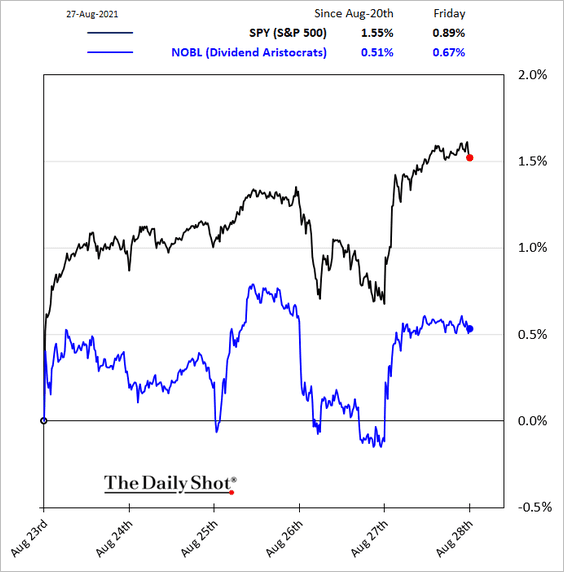
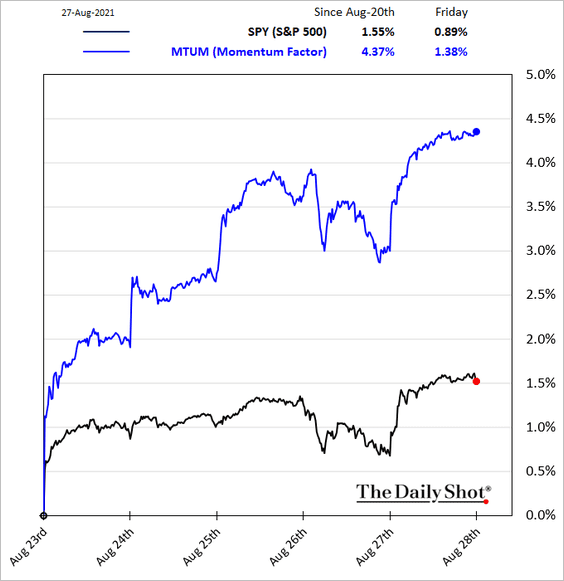
3. Here are last week’s equity factor trends.
• High-beta:
• Dividend Aristocrats:
• Momentum:
• Quality:
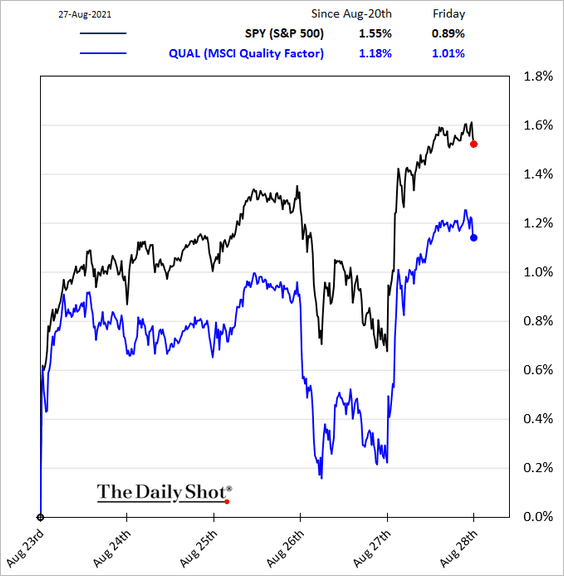
By the way, quality stocks have been outperforming small-caps this year.
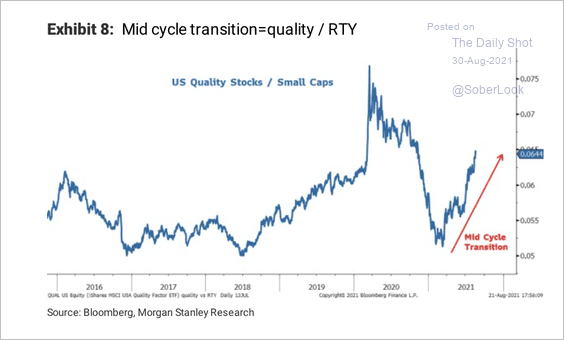 Source: Morgan Stanley Research
——————–
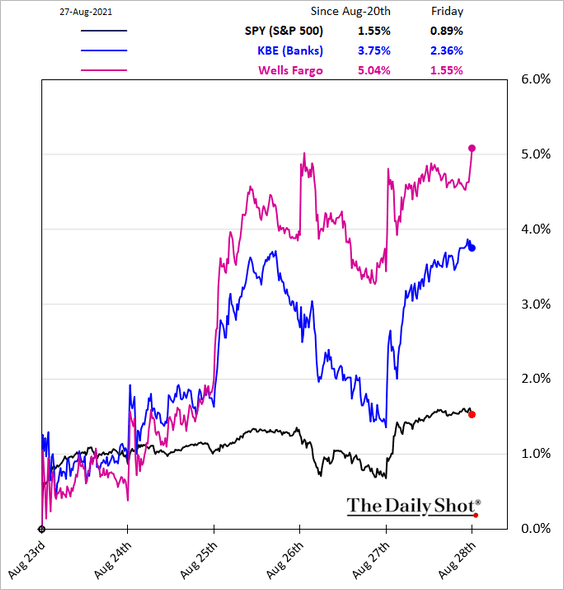
4. Next, we have some sector updates.
• Banks:
• Transportation:
![]()
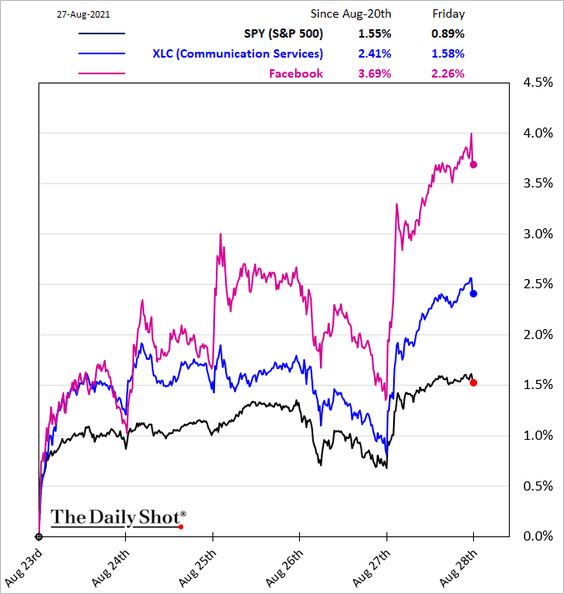
• Communication services:
• Consumer discretionary:
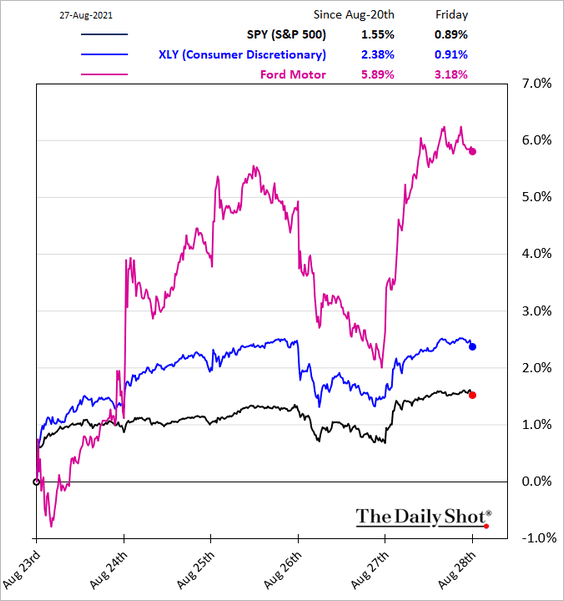
By the way, consumer discretionary shares have been underperforming this year …
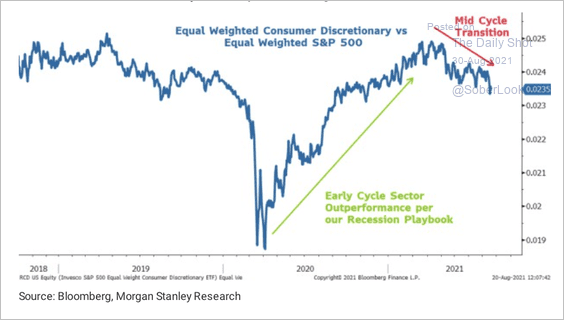 Source: Morgan Stanley Research
… pressured by Amazon.
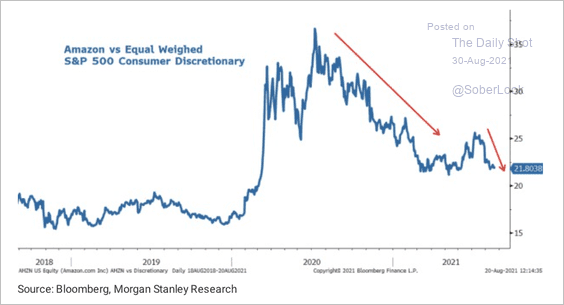 Source: Morgan Stanley Research
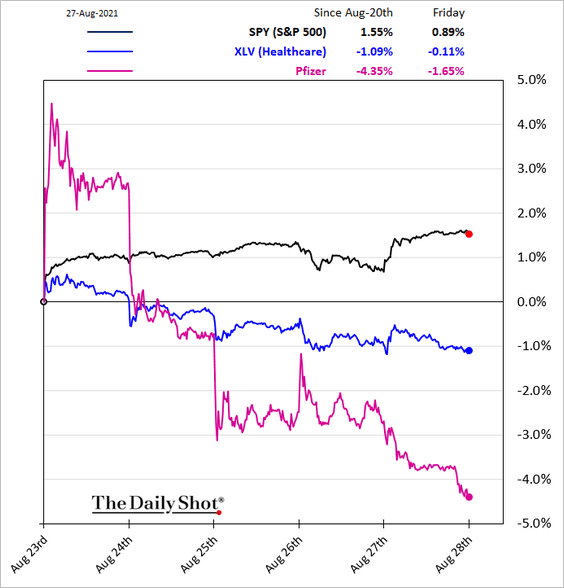
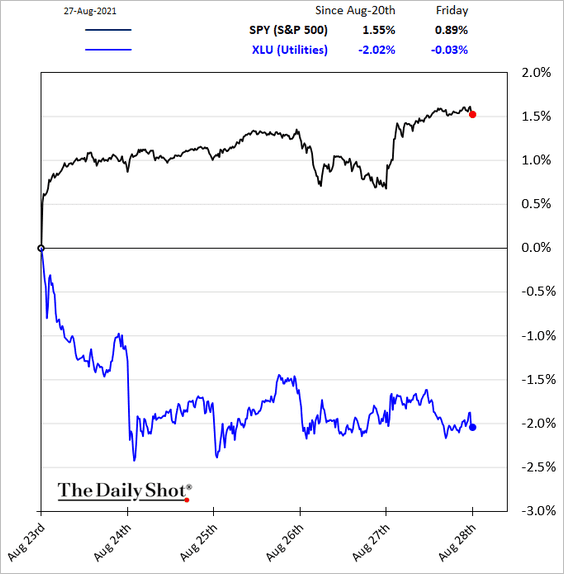
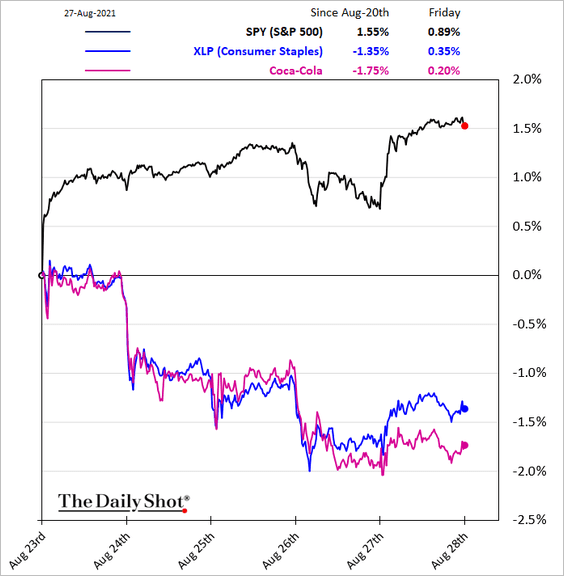
• Defensive sectors:
– Healthcare:
– Utilities:
– Consumer staples:
——————–
5. The cyclically adjusted earnings yield is at multi-year lows.
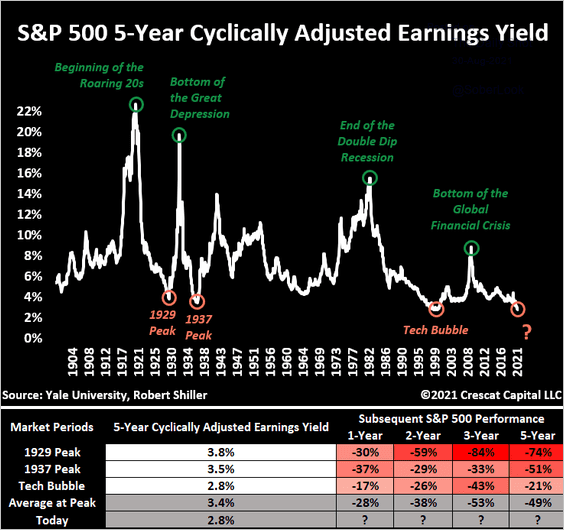 Source: @TaviCosta
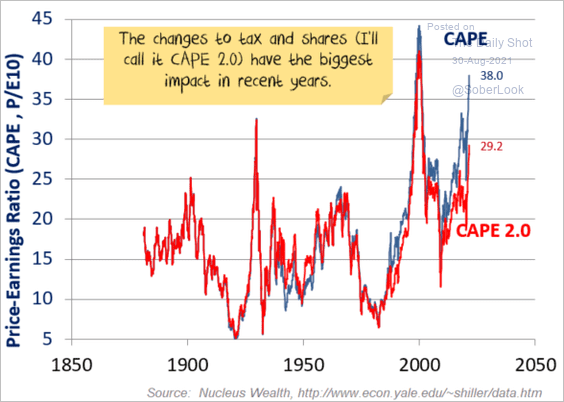
However, according to Damien Klassen (Nucleus Wealth), an adjusted CAPE calculation suggests that stocks may not be as expensive as traditional CAPE estimates suggest.
Rather than averaging real 10-year earnings per share,
• average ten years of pretax earnings (not per share),
• apply today’s tax rate,
• apply today’s number of buyback adjusted shares.
It’s a subtle difference in the definition, which has a substantial impact on the outcome.
 Source: Nucleus Wealth Read full article
——————–
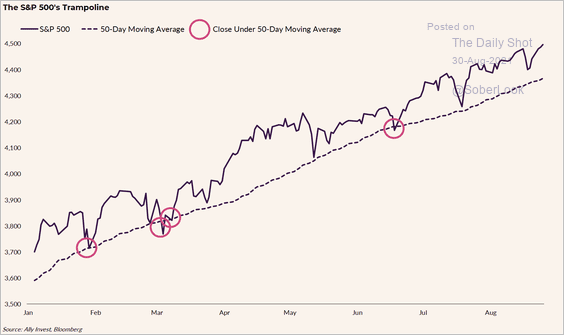
6. According to Lindsey Bell (Ally),
This year, the S&P 500 has closed under its 50-day moving average in just four days. Each time, the index rallied 1.4% or more the day after breaking the line, and was back to record highs within five trading days.
 Source: Lindsey Bell, Ally
7. Options activity has grown versus spot activity over the past year, mostly driven by call buying (3 charts).
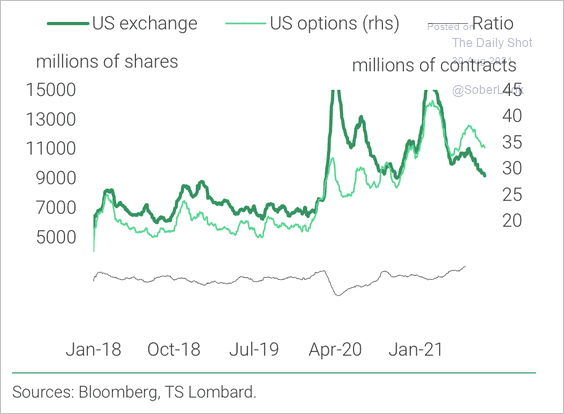 Source: TS Lombard
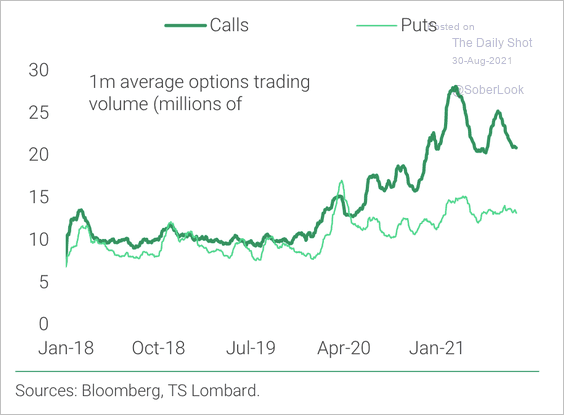 Source: TS Lombard
 Source: @markets Read full article
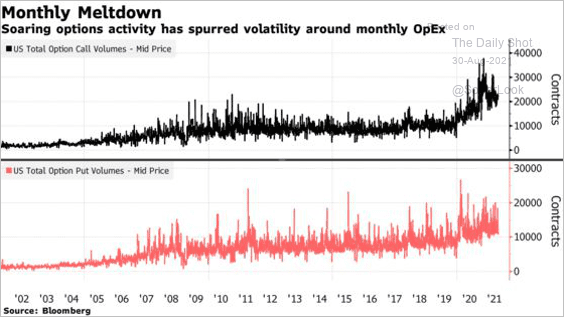
A much higher options volume means more volatility when options expire. S&P 500 dips have coincided with options expiries in recent months.
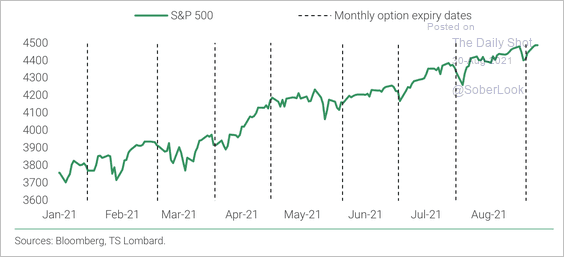 Source: TS Lombard
Back to Index
Rates
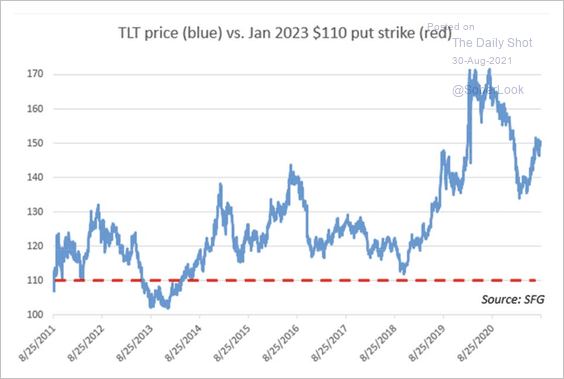
1. Last week, an investor sold 10K Jan. 2023 $110 puts in the iShares 20+ Year Treasury bond ETF (TLT). The last time TLT was trading below $110 was in 2014.
 Source: Chris Murphy
The investor may be betting that long-term Treasury yields will top out well below the highest levels from the financial crisis, or it could be a hedge against a short Treasury position, according to Chris Murphy at Susquehanna.
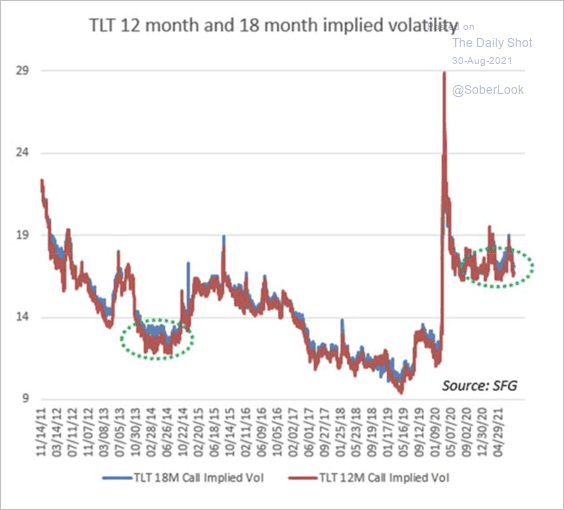
By the way, current TLT implied volatility for 12 and 18 months was significantly lower during the 2013-2014 taper-tantrum period.
 Source: Chris Murphy
——————–
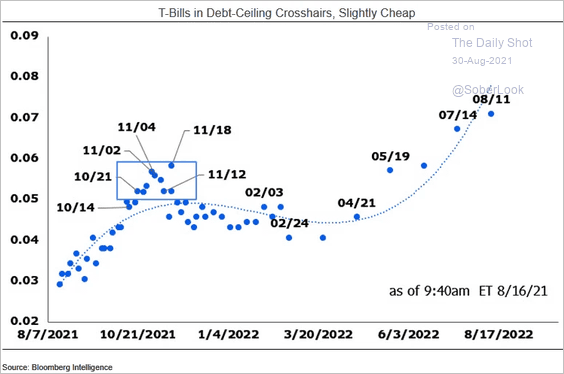
2. T-bills are pricing in the risk of a technical default if Congress fails to raise the debt ceiling.
 Source: Bloomberg Read full article
Here is the projection for US Treasury’s liquidity balances.
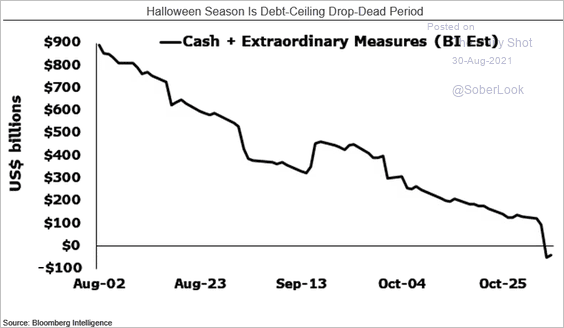 Source: Bloomberg Read full article
——————–
3. Treasury curve behavior has been very different from what we saw in 2013.
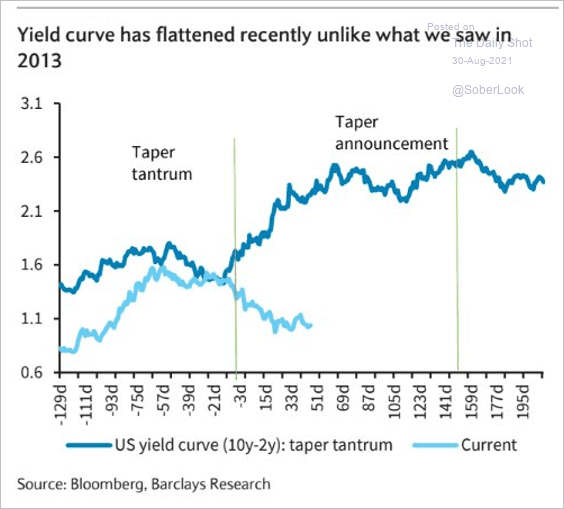 Source: Barclays Research
4. Hedge funds remain short Treasuries, according to JP Morgan (chart shows the 10yr equivalent exposure).
 Source: JP Morgan; @themarketear
Back to Index
Global Developments
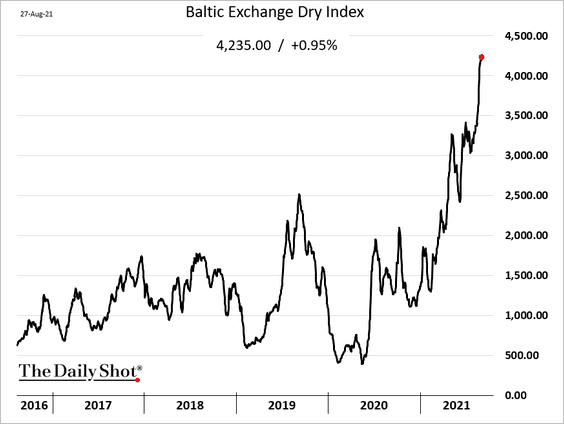
1. Dry bulk shipping costs keep climbing.
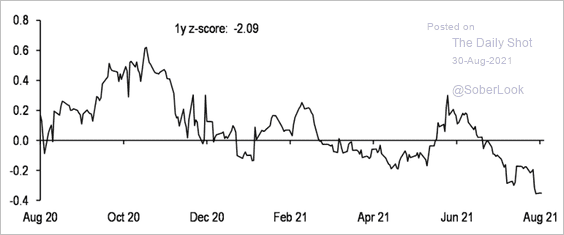
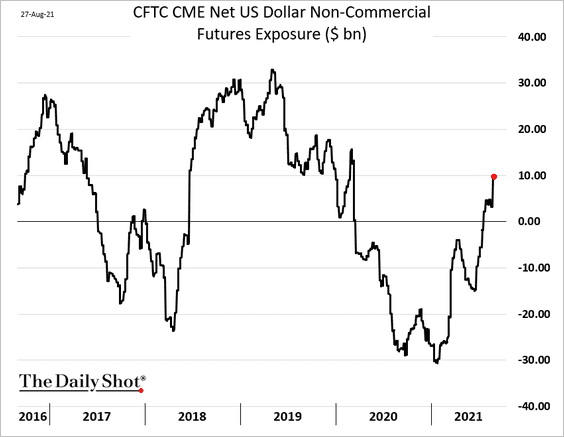
2. Speculative accounts have been boosting their net long US dollar exposure. Friday was a bad day.
3. F/X implied volatility has been trending lower.
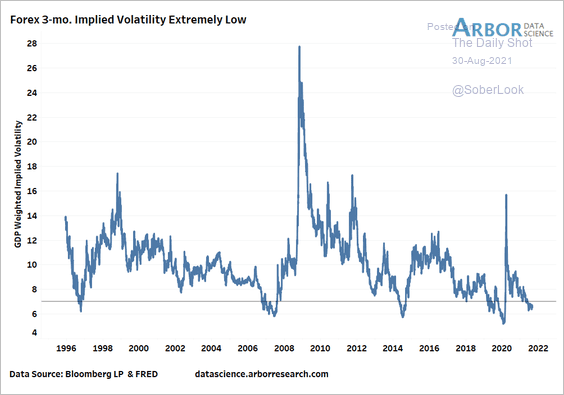 Source: Arbor Research & Trading
4. Cross-asset risk-adjusted return dispersion has collapsed.
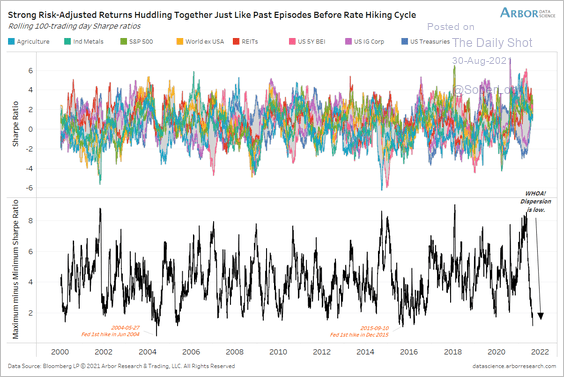 Source: Arbor Research & Trading
——————–
Food for Thought
1. Container shipping rates:
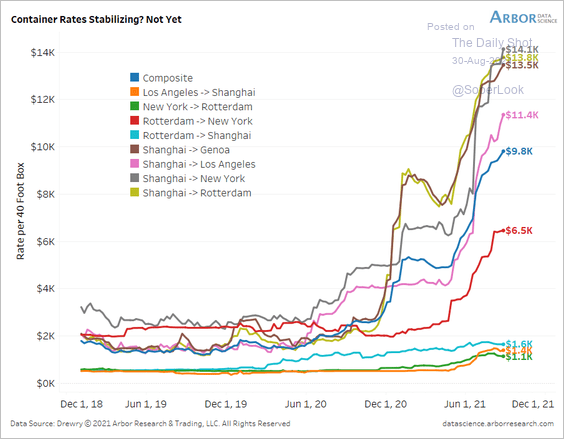 Source: @benbreitholtz
2. The global supply chain crisis illustrated with a box of fertilizer:
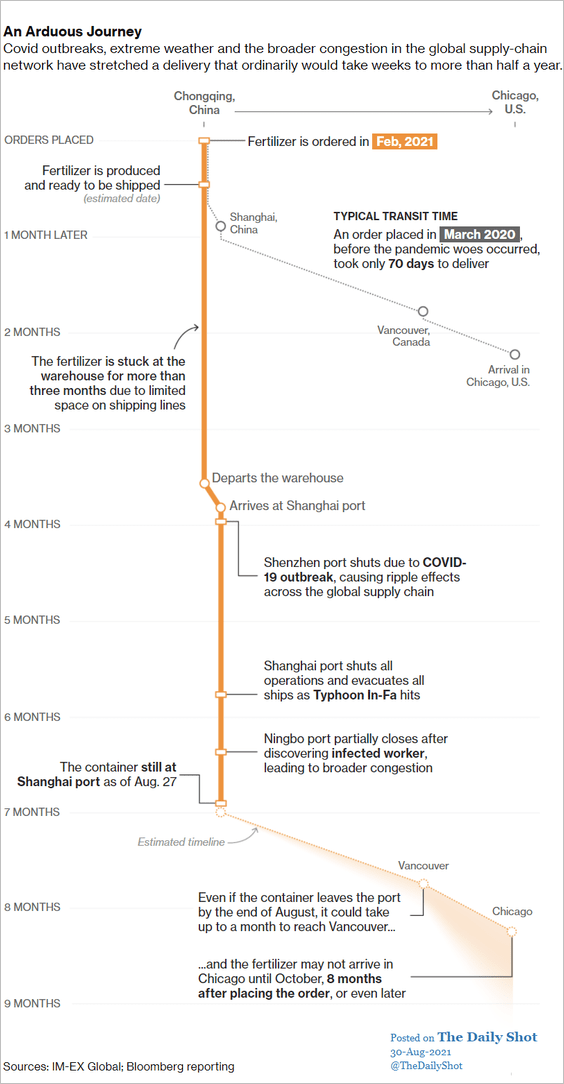 Source: @business Read full article
3. BNPL (buy now pay later) vs. credit card users:
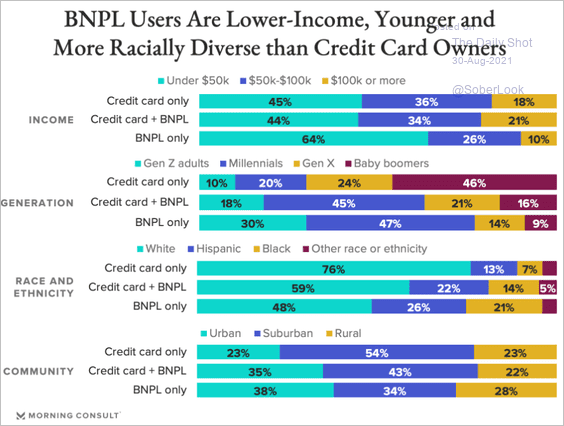 Source: Morning Consult Read full article
4. Buying counterfeit luxury goods:
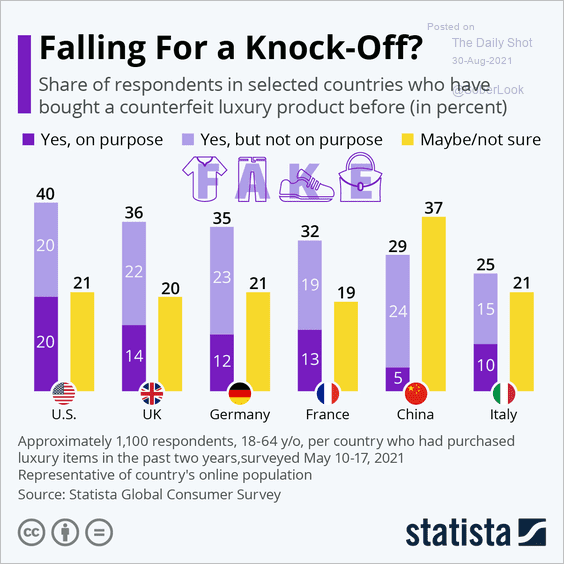 Source: Statista
5. Changes in superstore visits vs. 2019:
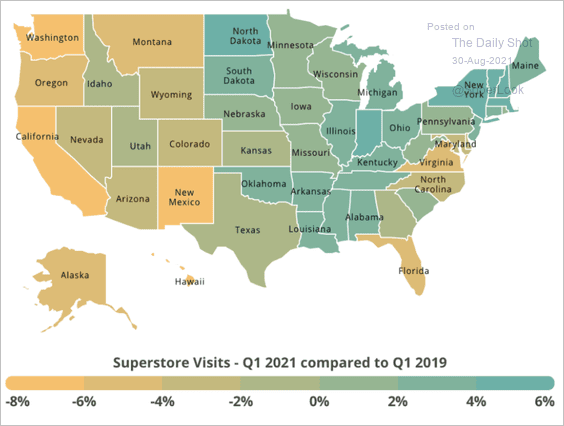 Source: Placer.ai Read full article
6. McDonald’s visits vs. 2019:
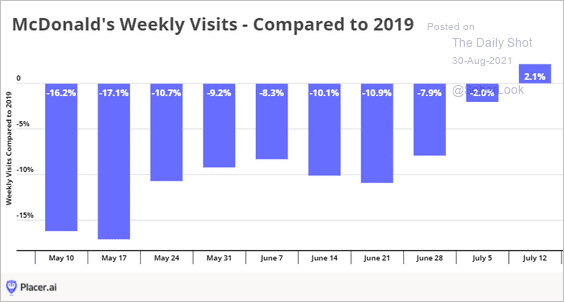 Source: Placer.ai
7. Costliest US hurricanes (Ida could cost as much as $40bn):
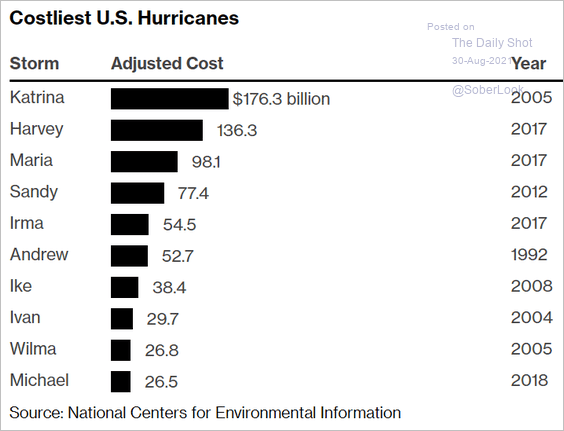 Source: Bloomberg Read full article
8. CO2 emissions by ship type:
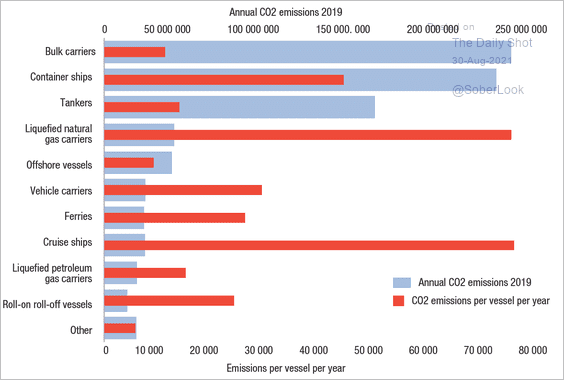 Source: UNCTAD Read full article
9. US foreign deployment of troops:
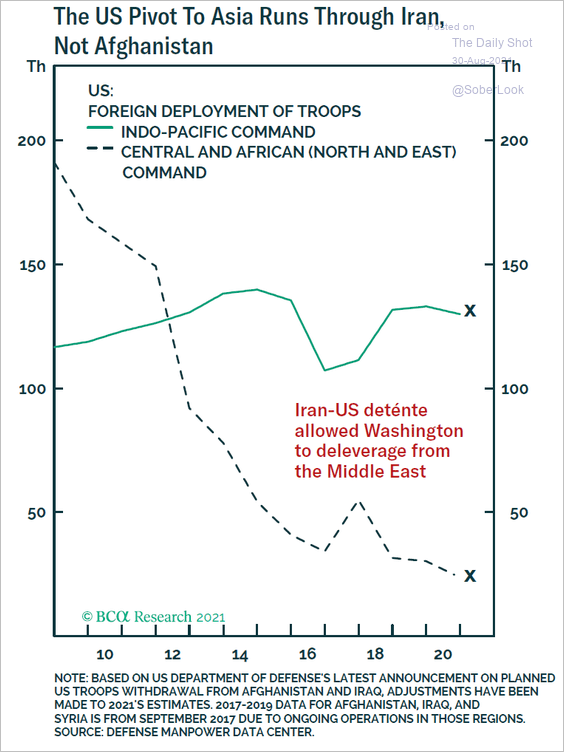 Source: BCA Research
10. A few heavy storms or pouring all the time?
 Source: @simongerman600, @erindataviz Read full article
——————–
Back to Index