
The Daily Shot: 15-Aug-22
• China
• Asia – Pacific
• Japan
• The Eurozone
• Europe
• The United Kingdom
• The United States
• Emerging Markets
• Commodities
• Energy
• Equities
• Credit
• Rates
• Global Developments
• Food for Thought
China
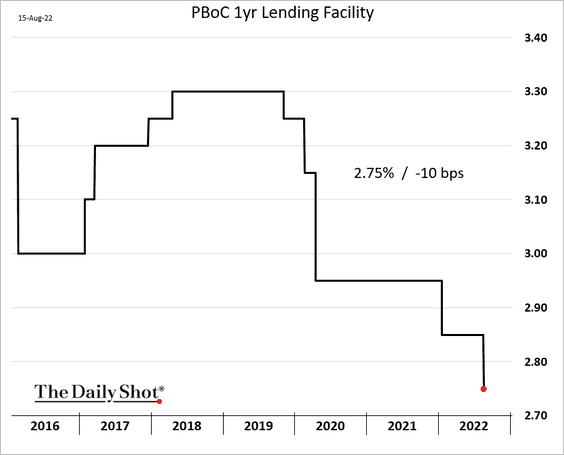
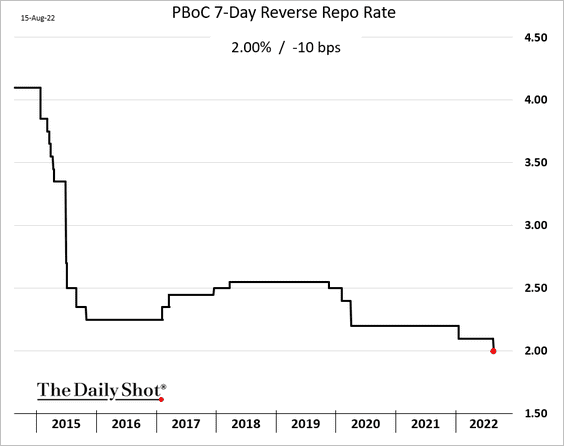
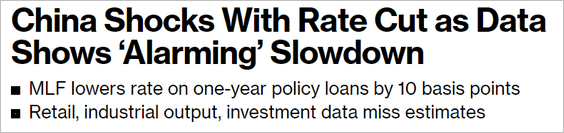
1. The PBoC unexpectedly cut two benchmark rates amid softer than expected economic activity.
• The 1-year rate:
• The 7-day repo rate:
 Source: Bloomberg Read full article*
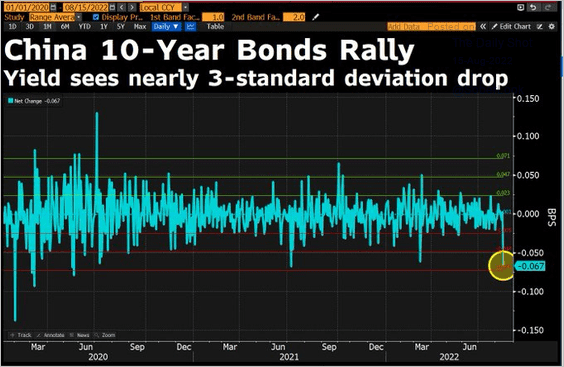
The central bank has already been “allowing” short-term rates to dip substantially (see chart), but this formal announcement was a surprise.
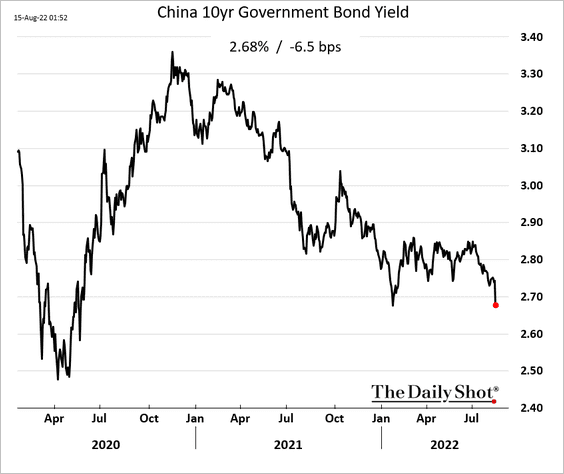
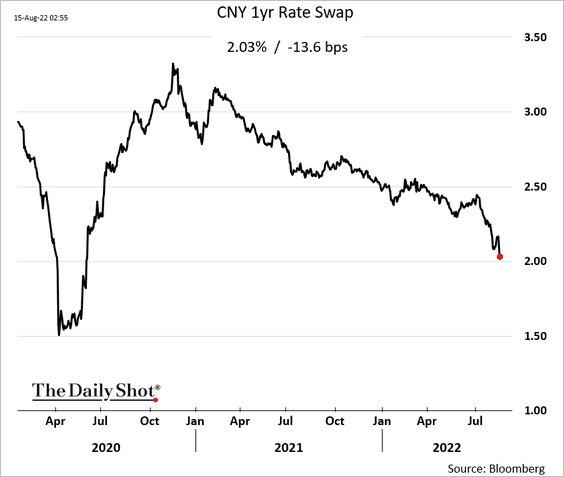
2. Market rates declined sharply.
• The 10yr yield:
 Source: @DavidInglesTV
• The 1yr swap rate:
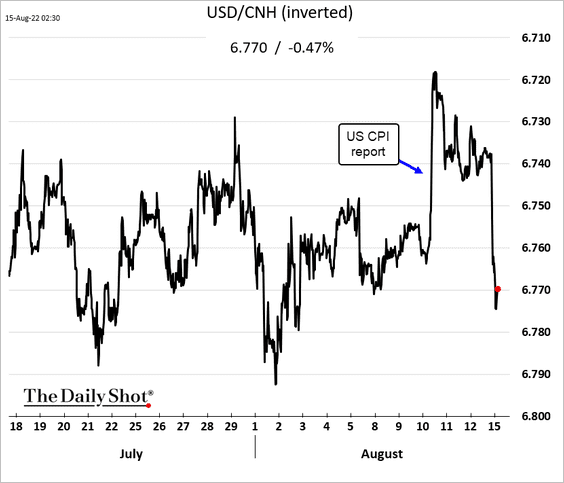
The renminbi dropped.
——————–
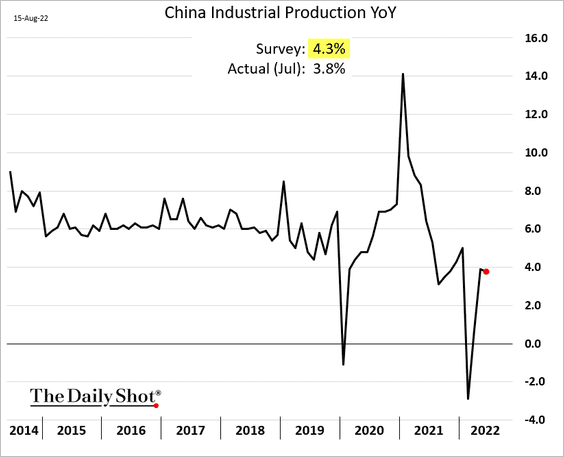
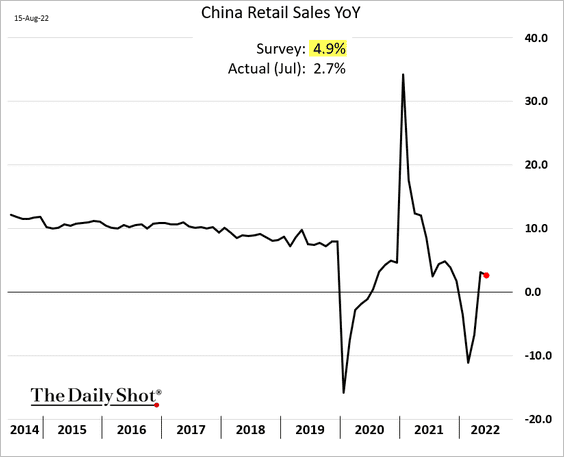
3. July economic indicators surprised to the downside.
• Industrial production:
• Retail sales:
——————–
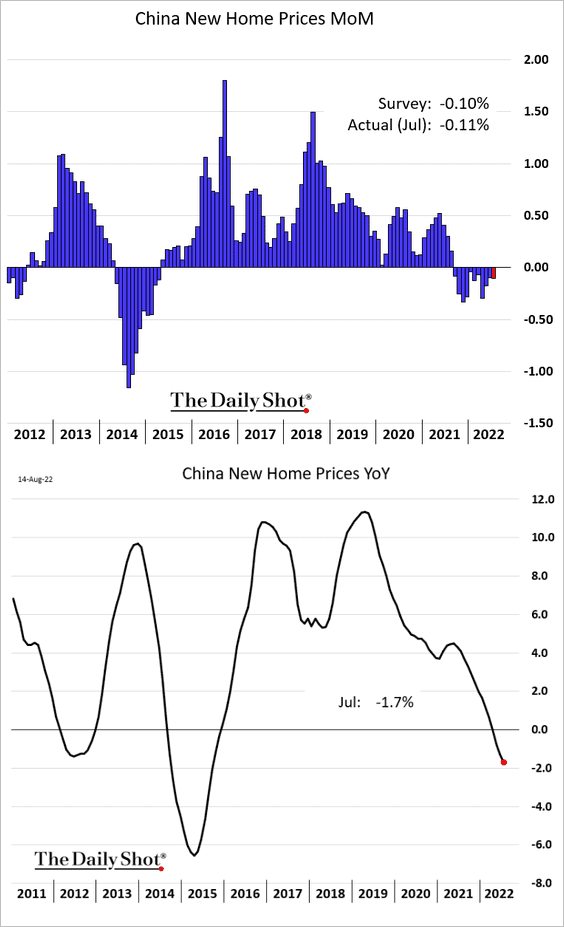
4. New home prices continue to decline.
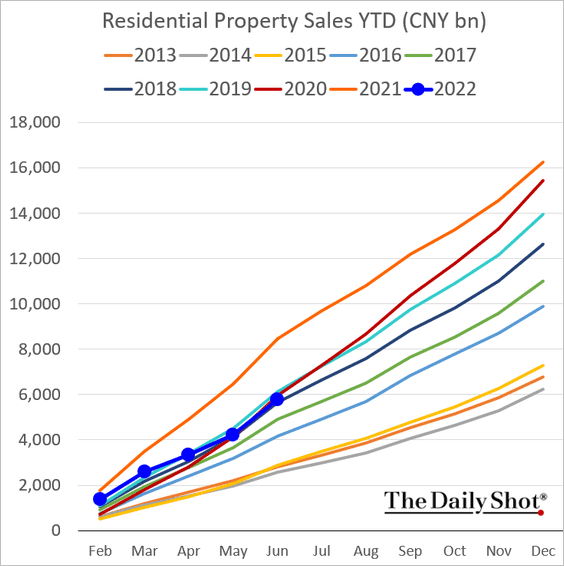
5. Residential property sales have been significantly weaker than last year.
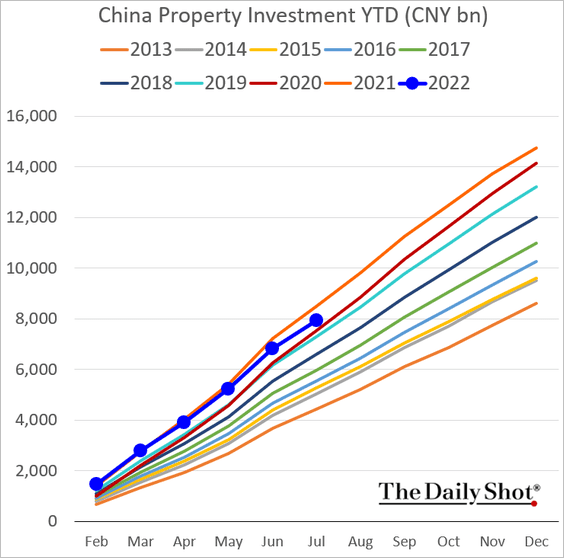
Property investment has been softening.
——————–
6. Money supply indicators have been rising at a faster pace (moving in the opposite direction from the US).
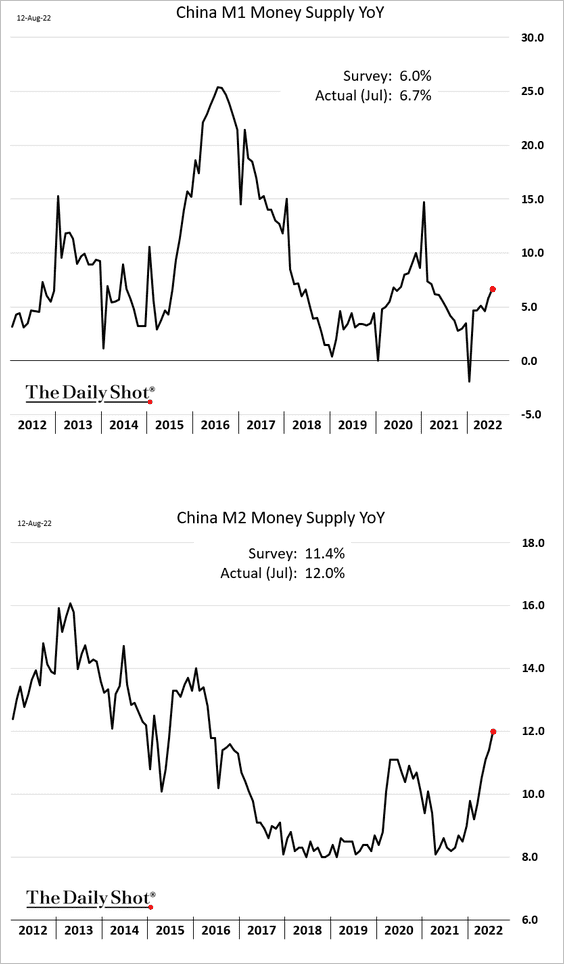
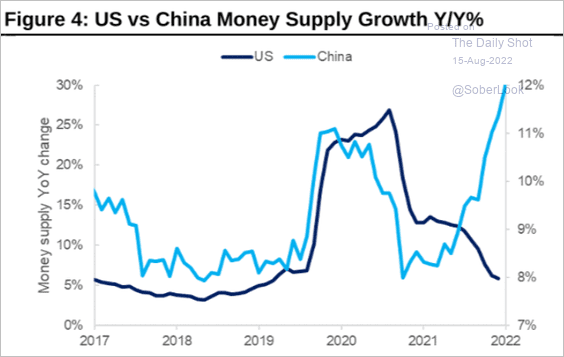 Source: Citi Private Bank
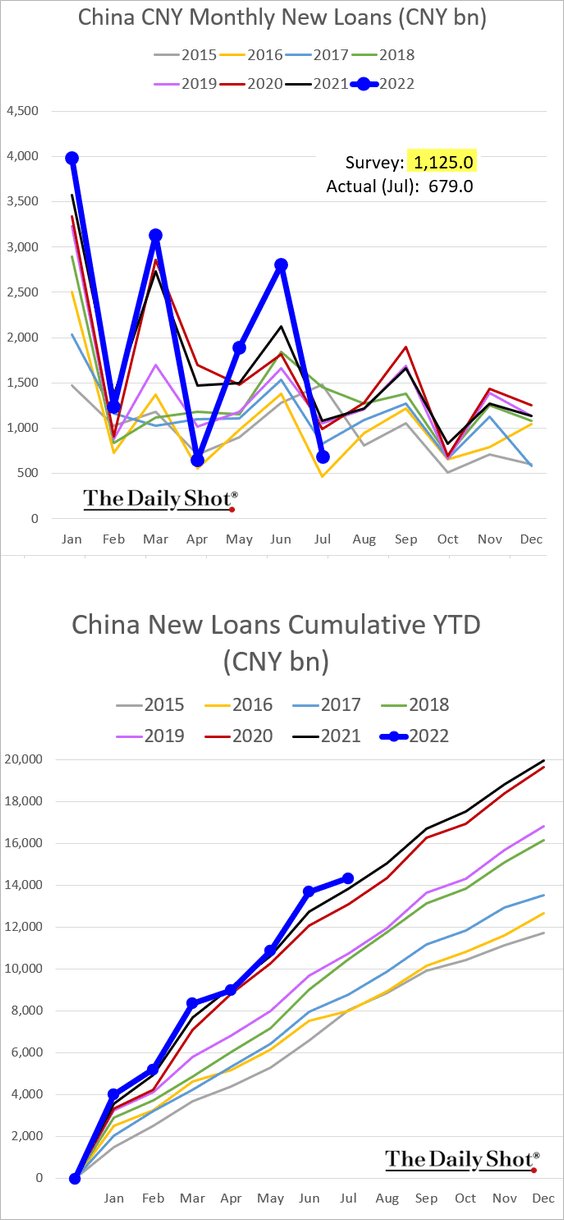
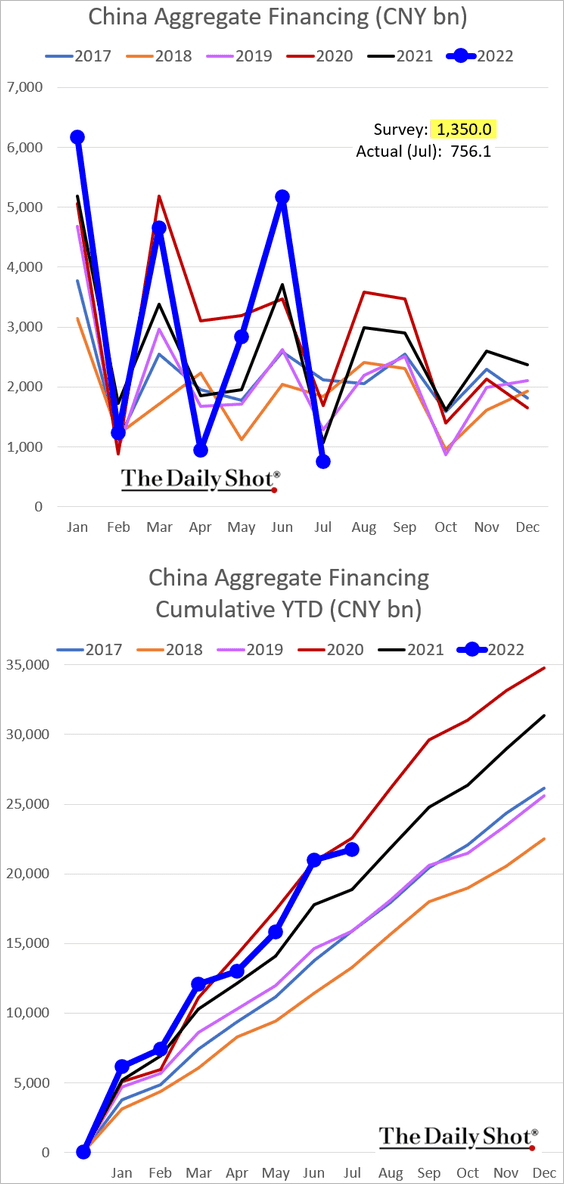
Credit expansion, which has been more volatile than usual, surprised to the downside.
——————–
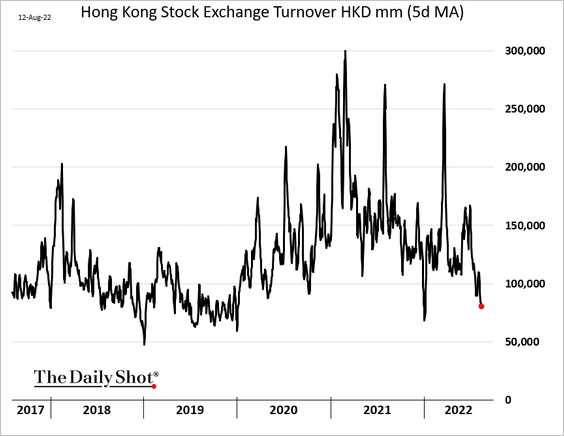
7. Hong Kong’s equity trading volume has been shrinking.
Back to Index
Asia – Pacific
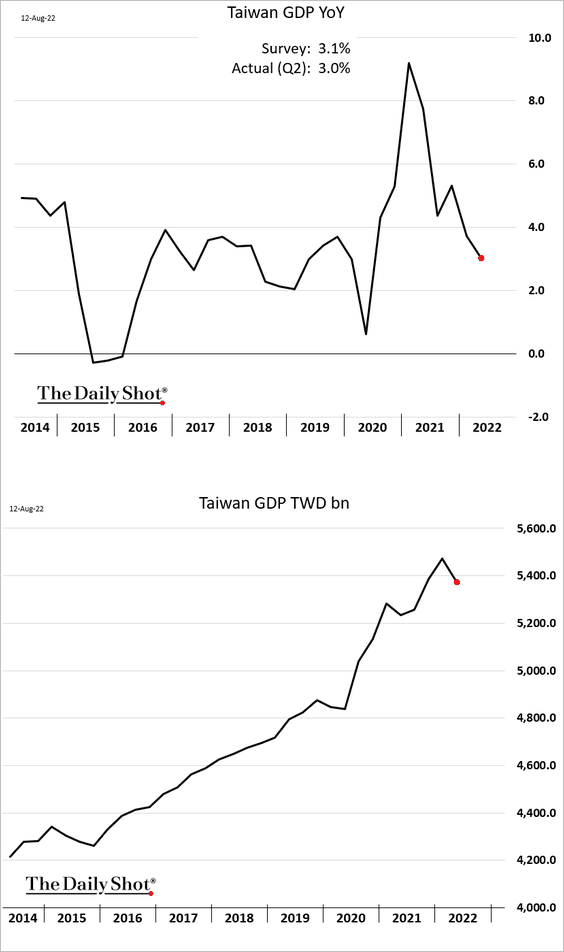
1. Taiwan’s GDP declined last quarter.
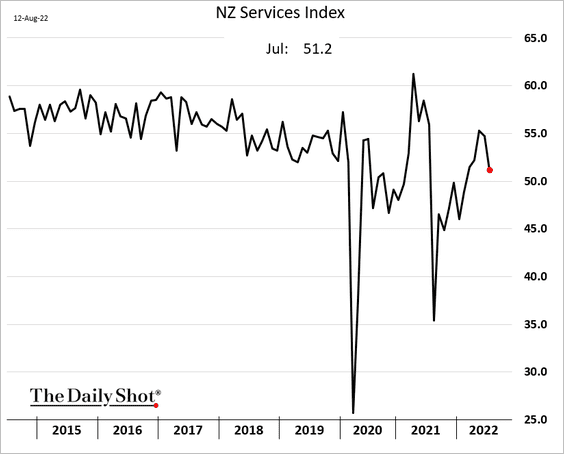
2. New Zealand’s service sector growth slowed sharply last month.
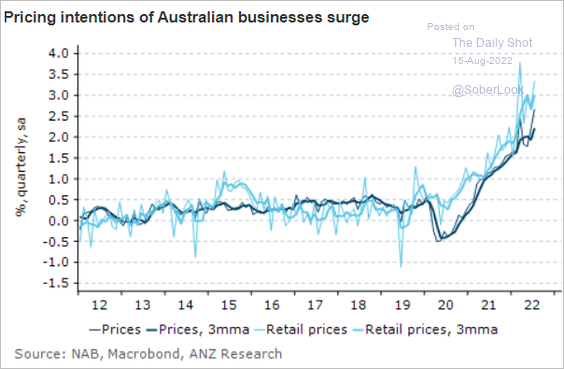
3. Australian businesses increasingly plan to boost prices.
 Source: @ANZ_Research
Back to Index
Japan
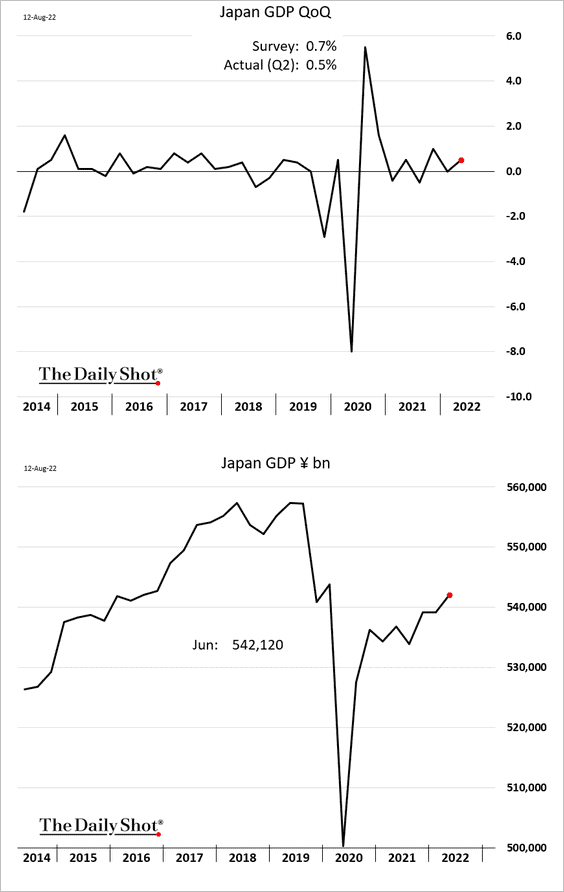
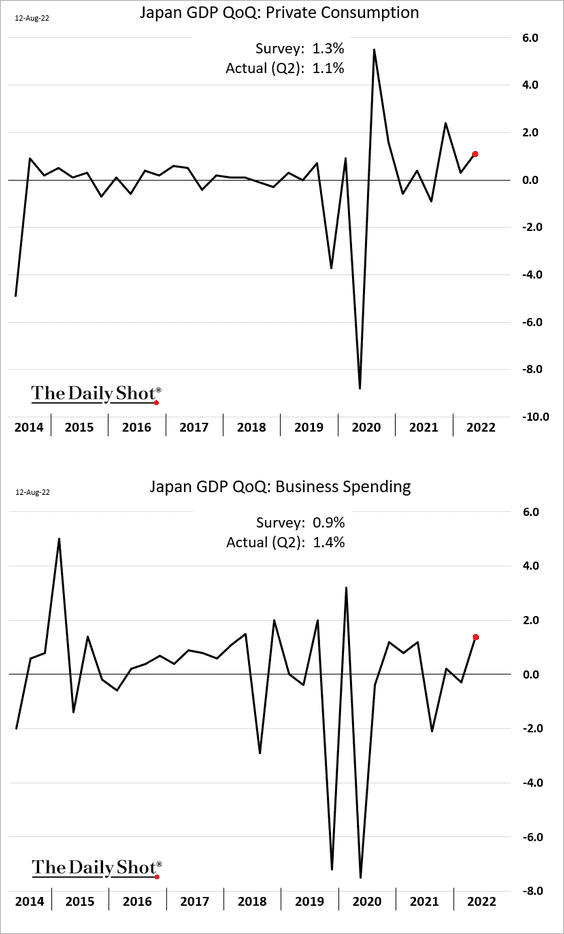
1. Japan’s Q2 GDP print was weaker than expected. The GDP remains well below pre-COVID levels.
Business investment (2nd panel) topped expectations.
——————–
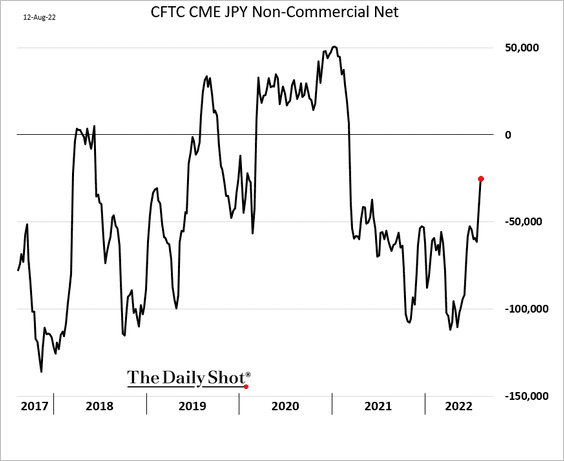
2. Traders are rapidly trimming their bets against the yen.
Back to Index
The Eurozone
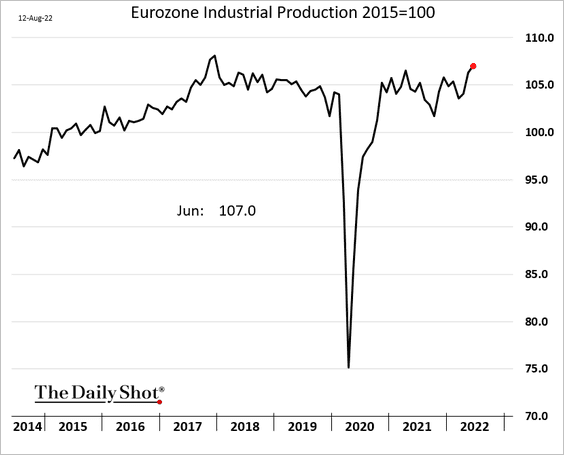
1. Euro-area industrial production (for June) topped expectations.
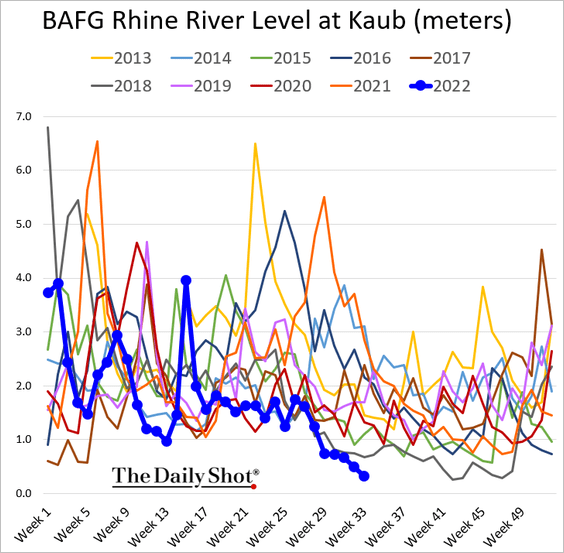
2. The Rhine River situation continues to deteriorate.
3. The French core CPI has been accelerating.
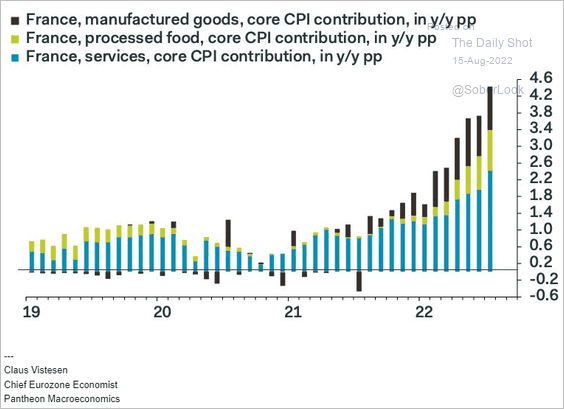 Source: Pantheon Macroeconomics
4. Euro-area CPI is yet to peak.
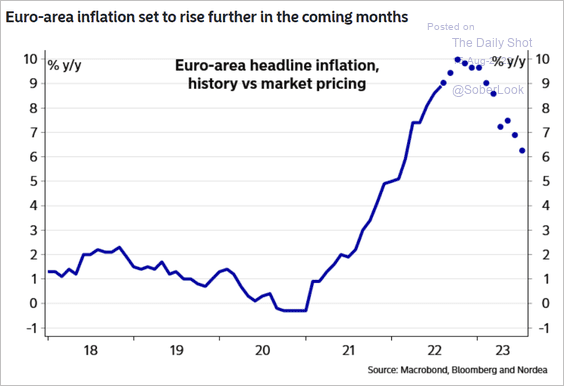 Source: Nordea Markets
Back to Index
Europe
1. Sweden’s inflation has been surging.
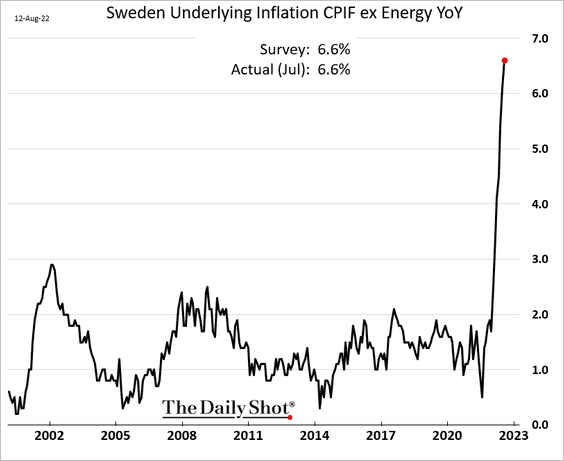
Are we near the peak?
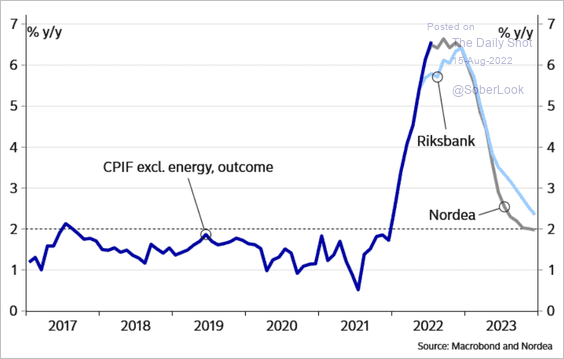 Source: Nordea Markets
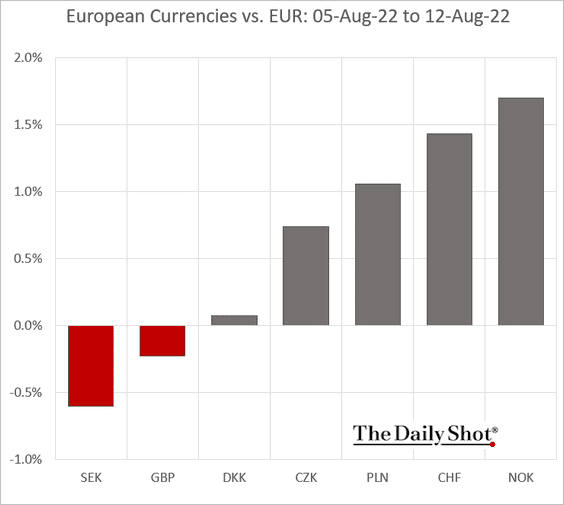
The Swedish krona has been underperforming other European currencies against the euro.
——————–
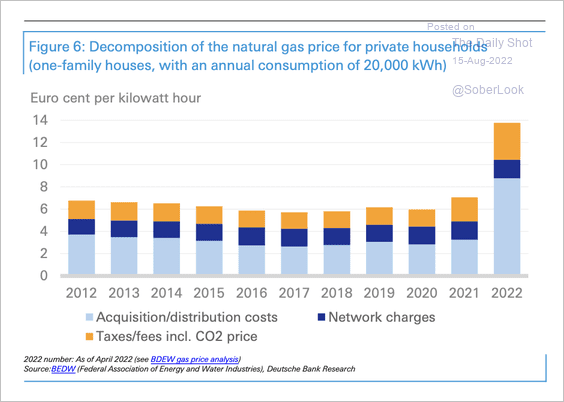
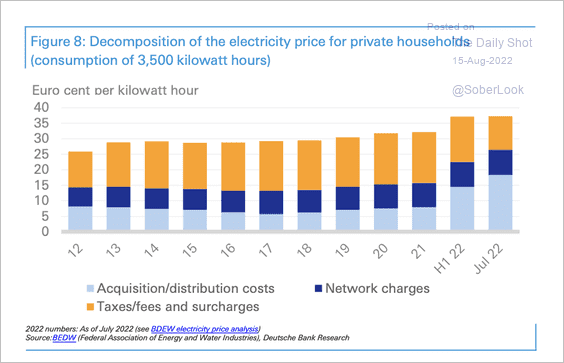
2. The following charts show the decomposition of energy prices. (2 charts)
 Source: Deutsche Bank Research
 Source: Deutsche Bank Research
——————–
3. Europe’s LNG imports remain elevated.
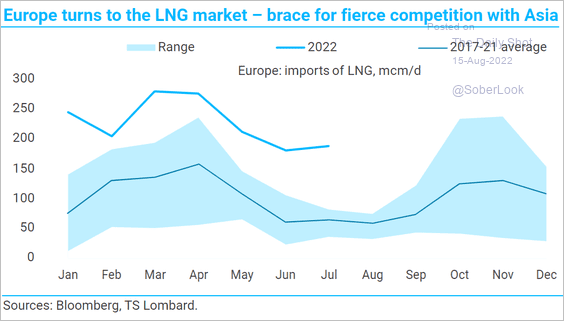 Source: TS Lombard
4. Which industries are most dependent on electricity, gas, and steam?
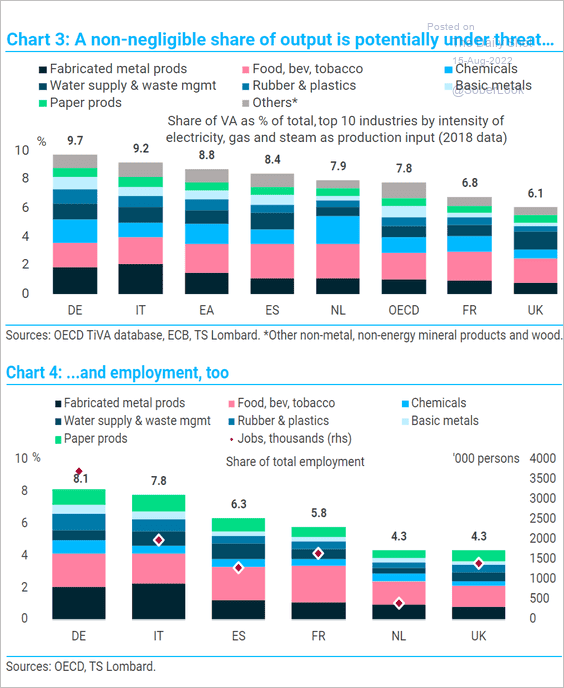 Source: TS Lombard
Back to Index
The United Kingdom
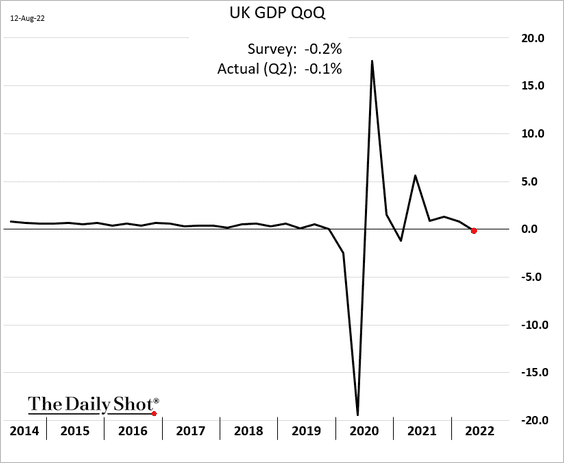
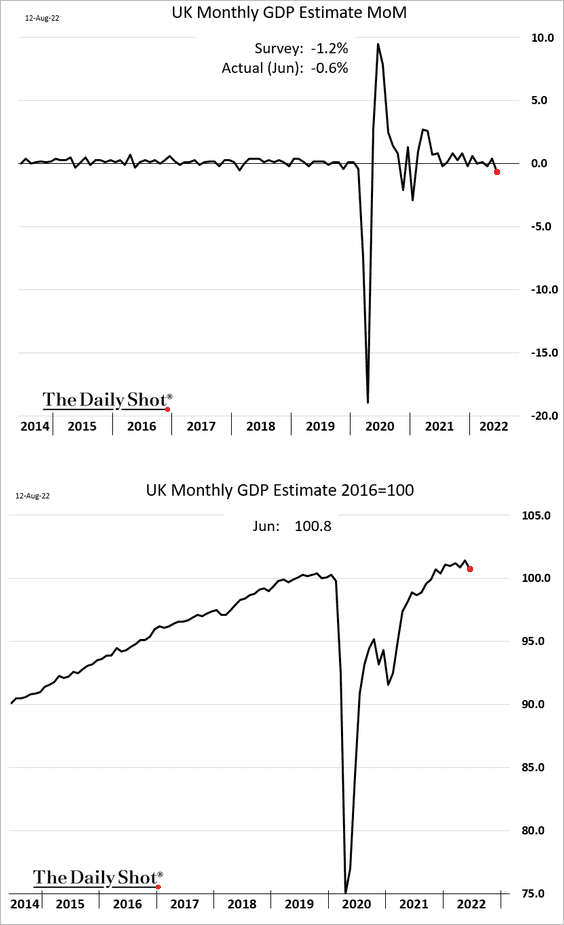
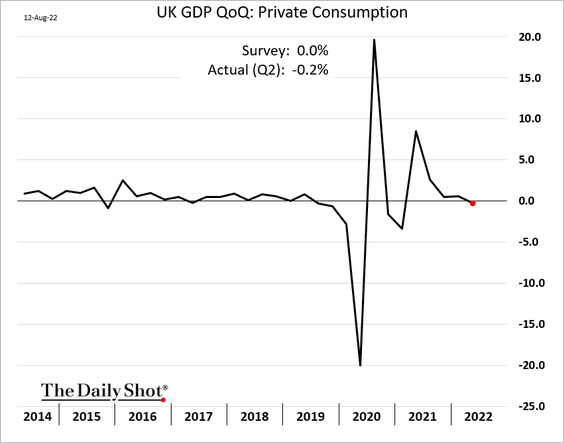
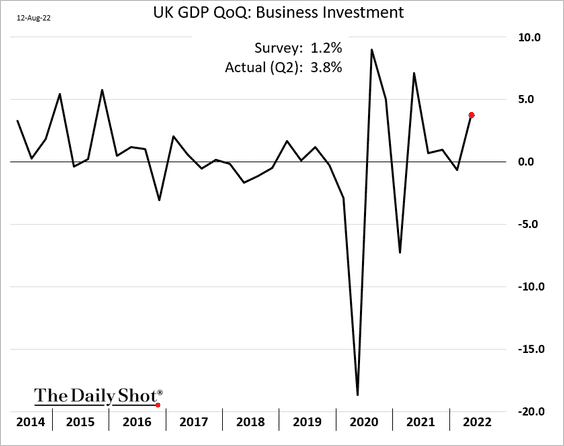
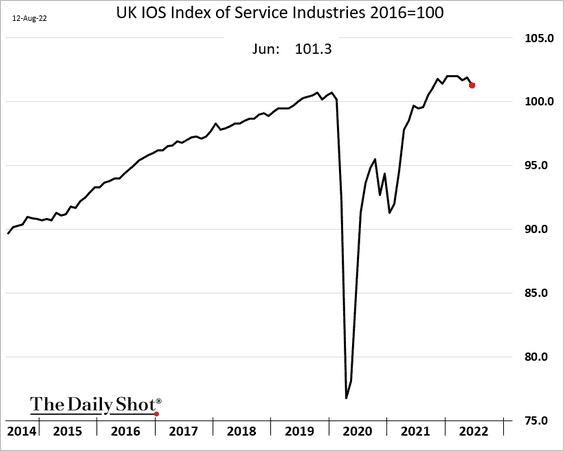
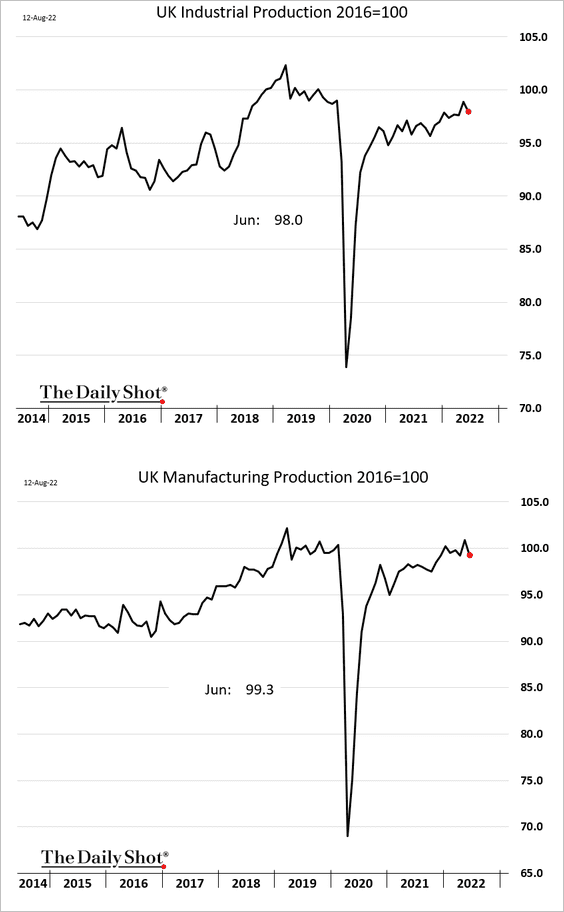
1. While economic activity shrank in June, the situation, on the whole, was a bit better than expected.
• The GDP (a slight contraction in Q2):
• Monthly GDP:
• Consumer spending (softer than expected):
• Business investment (a sharp rebound):
Here are the monthly indicators.
• Services (rolling over?):
• Industrial production:
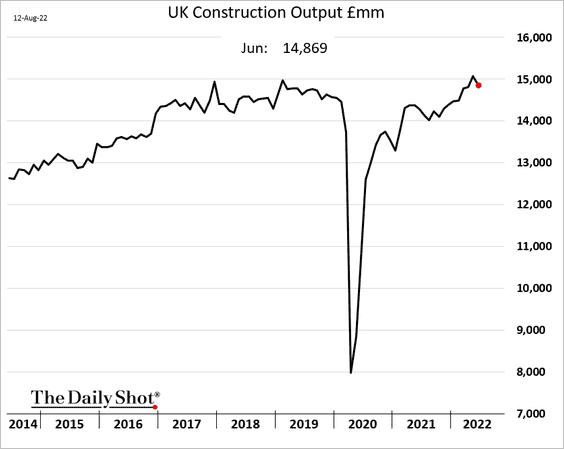
• Construction:
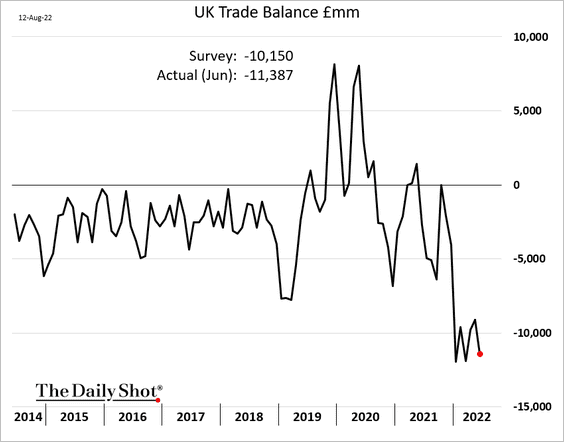
2. The trade deficit was wider than expected.
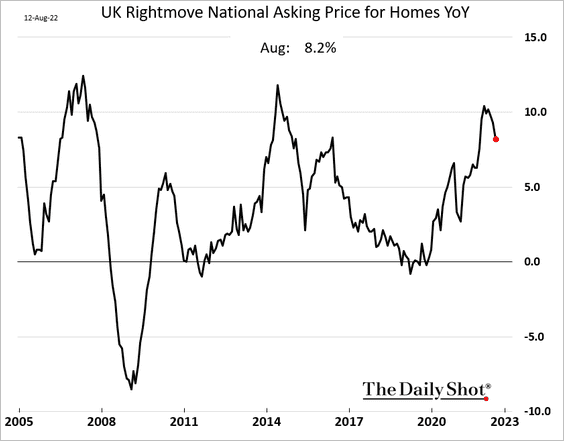
3. Home price appreciation is moderating.
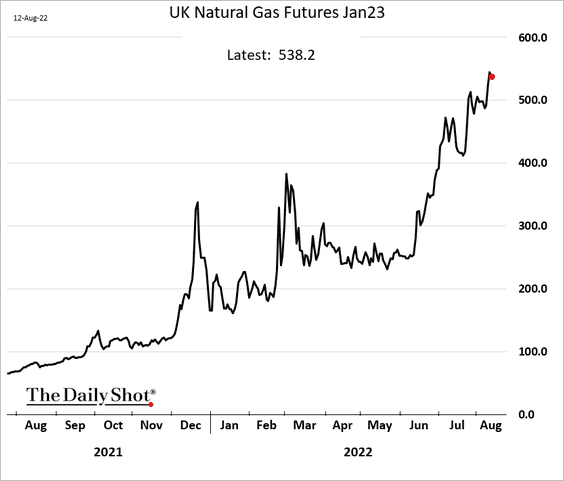
4. UK natural gas prices have been surging,
Back to Index
The United States
1. The U. Michigan consumer sentiment index topped expectations, boosted by lower gasoline prices. The current conditions indicator declined (2nd panel), but the expectations index was higher (3rd panel).
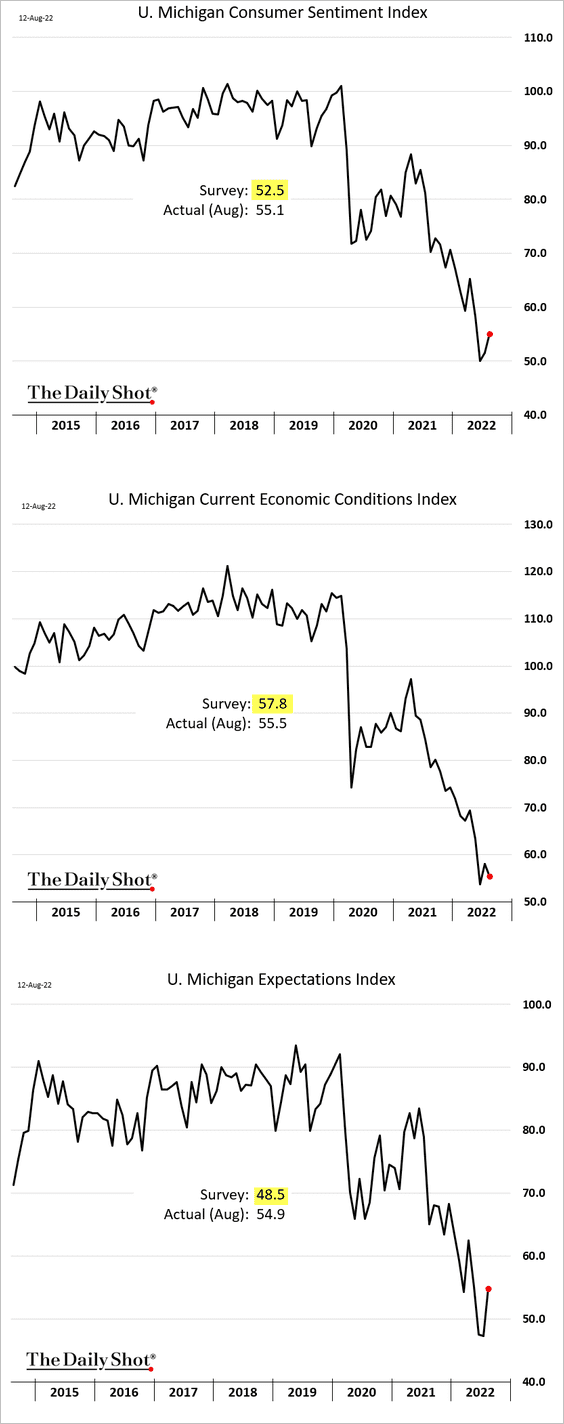
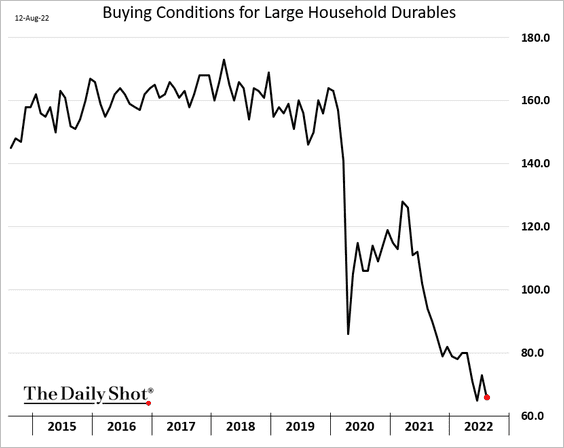
The current conditions index tends to be correlated to consumer spending (much more so than the expectations index). Here is the buying conditions index for household durables.
——————–
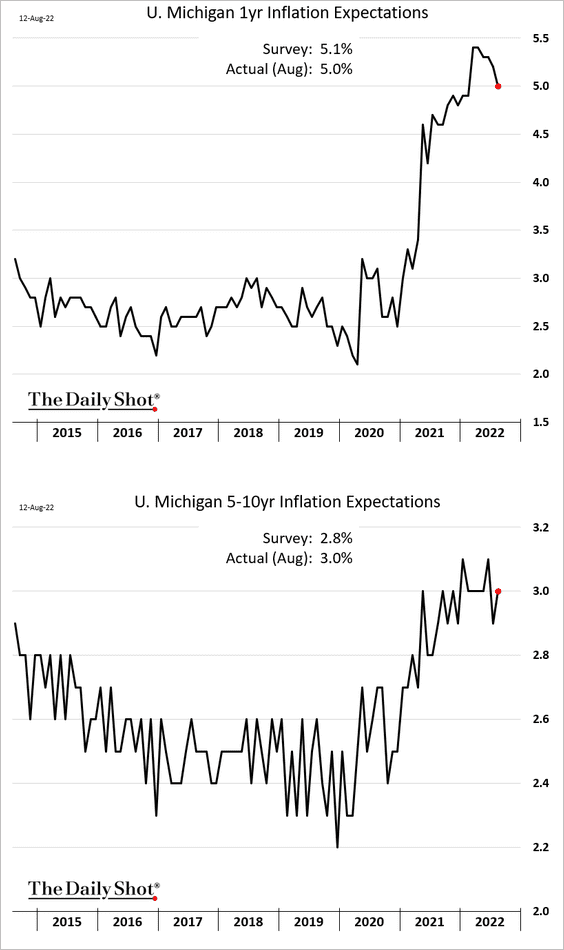
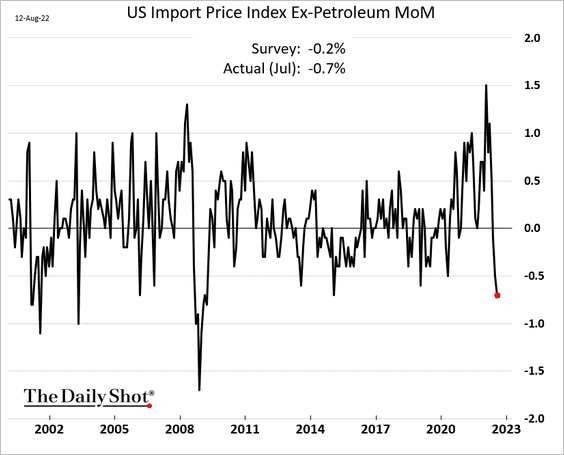
2. Next, we have some updates on inflation.
• The U. Michigan inflation expectations results were mixed.
• Import prices declined more than expected last month.
• Short-term market-based inflation expectations have been declining.
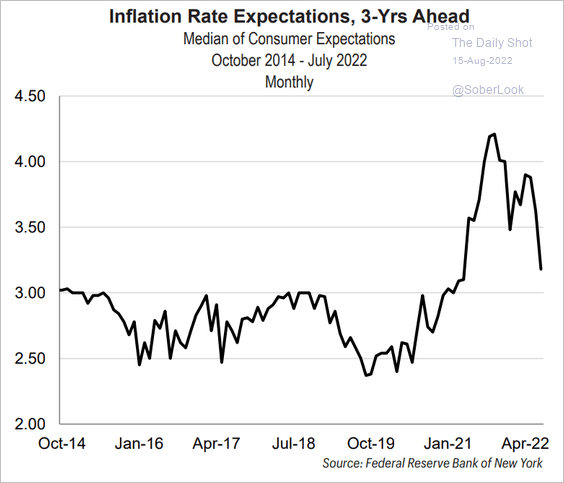 Source: FHN Financial
• How will the Fed respond to moderating inflation? Could inflation re-accelerate after we see the “all-clear” signal – as we did in the 1970s?
![]() Source: Simon White, Bloomberg Markets Live Blog
Source: Simon White, Bloomberg Markets Live Blog
• Inflation has been driven more by supply constraints.
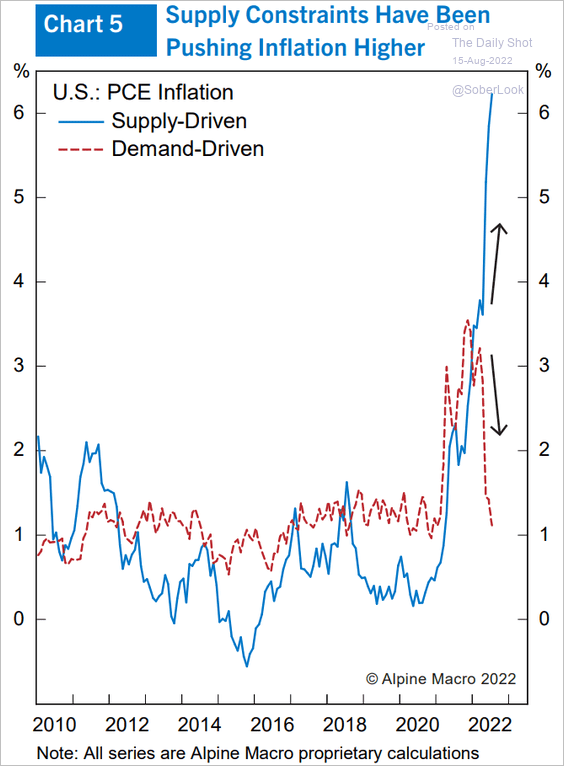 Source: Alpine Macro
• This analysis looks at inflation persistence. How correlated are recent price changes to earlier periods? (autocorrelation)
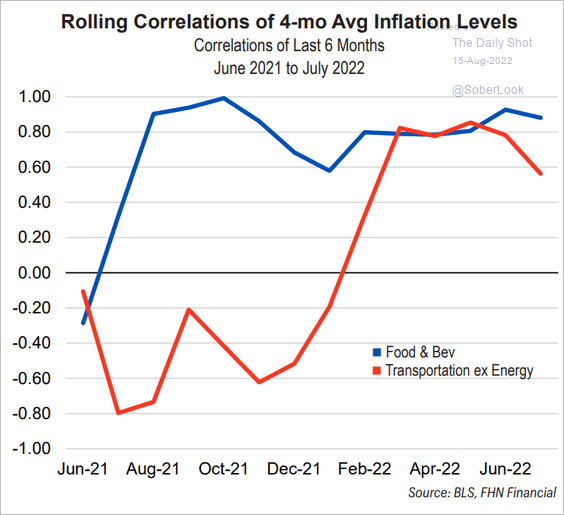 Source: FHN Financial
——————–
3. Job hopping hasn’t been this profitable in decades.
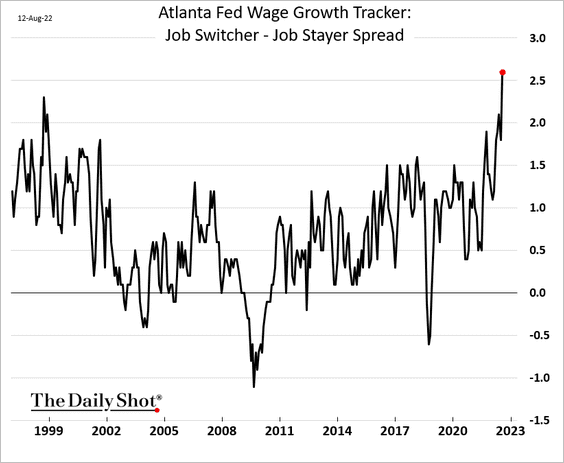 Source: Atlanta Fed
Back to Index
Emerging Markets
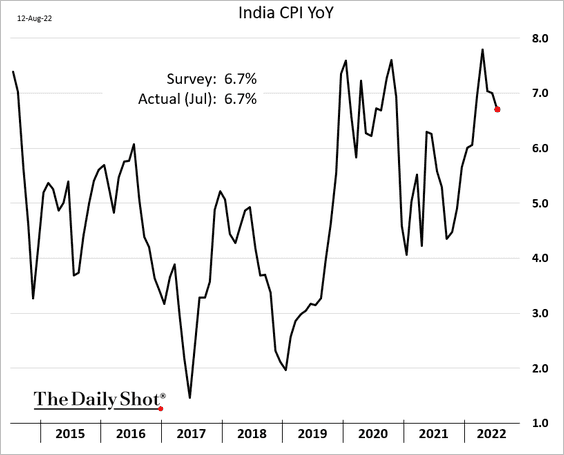
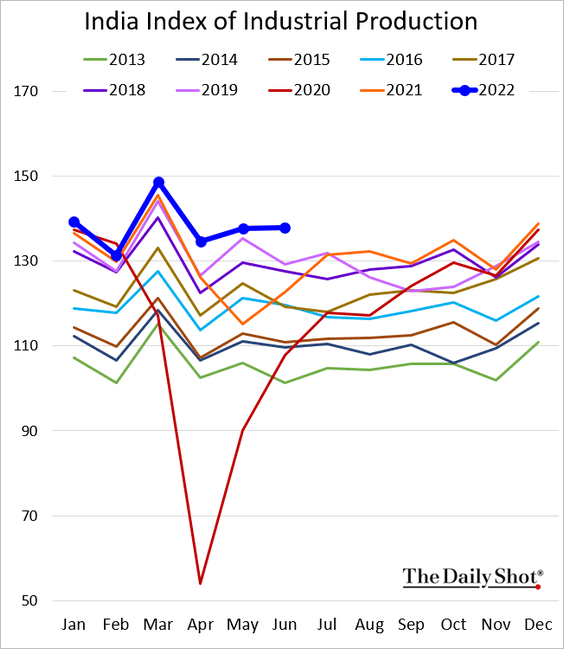
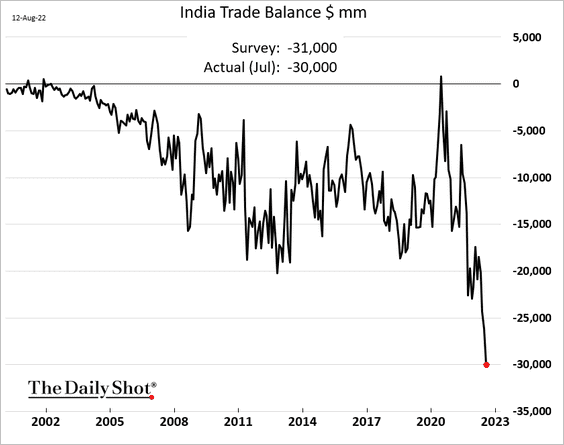
1. Let’s begin with India.
• Inflation is back below 7%.
• Industrial production has been strong.
• The trade deficit continues to widen.
——————–
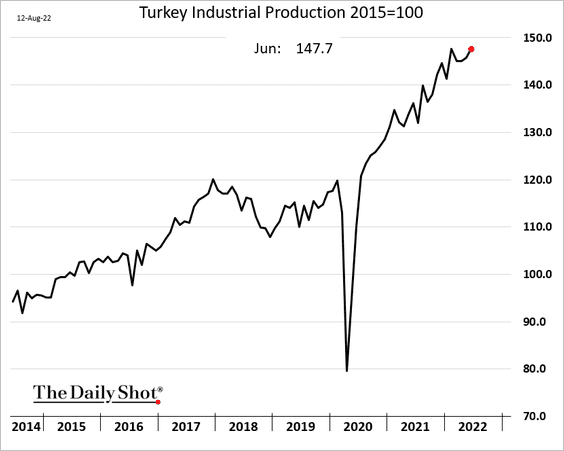
2. Turkey’s industrial production continues to climb.
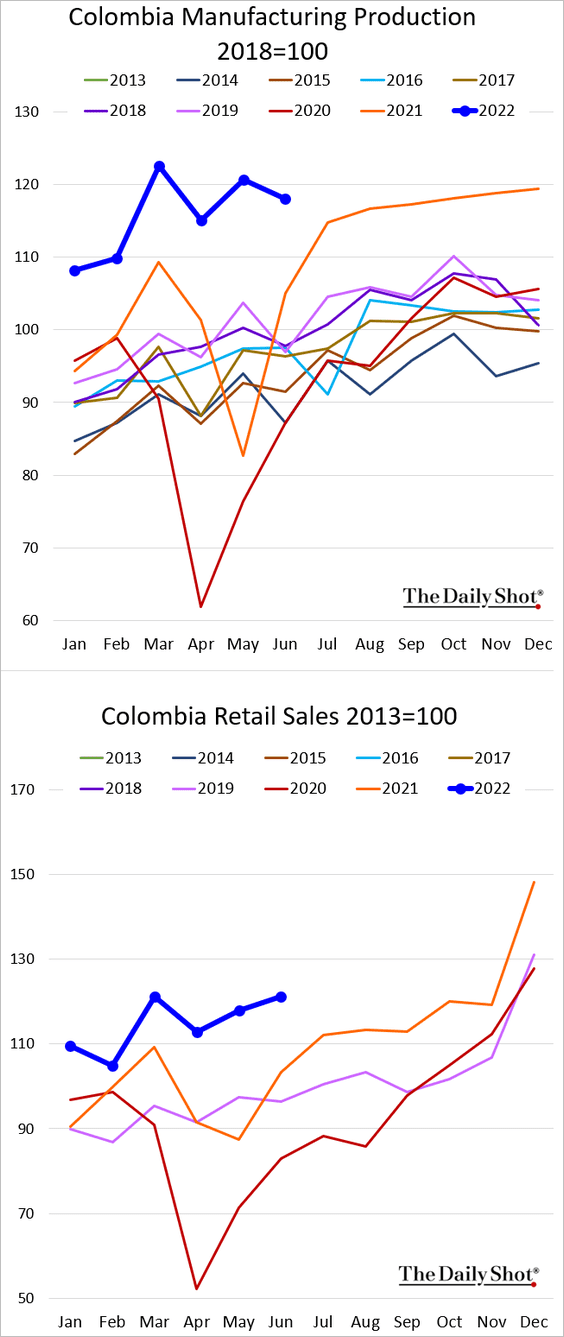
3. Colombia’s economic activity has been holding up well.
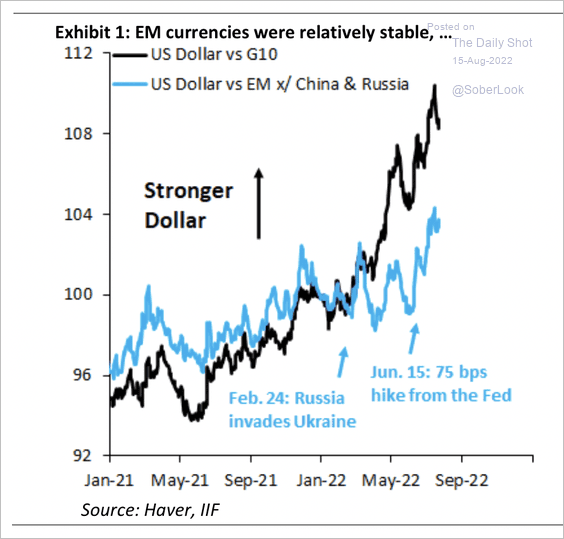
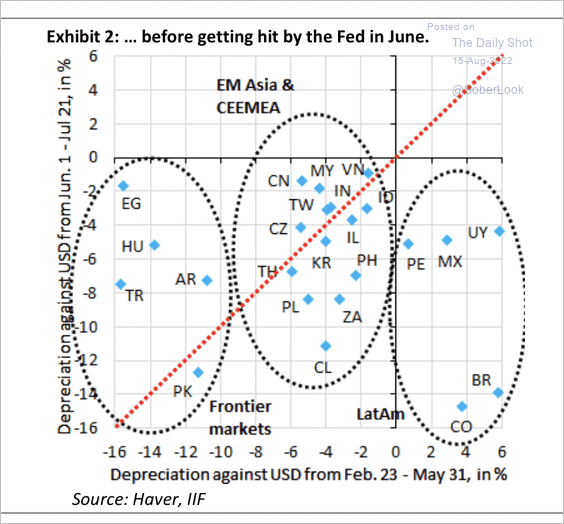
4. The dollar was relatively stable versus EM currencies during the first few months of the Russia/Ukraine war. That balance shifted in June, however, because of a hawkish shift by the Fed (2 charts).
 Source: IIF
 Source: IIF
——————–
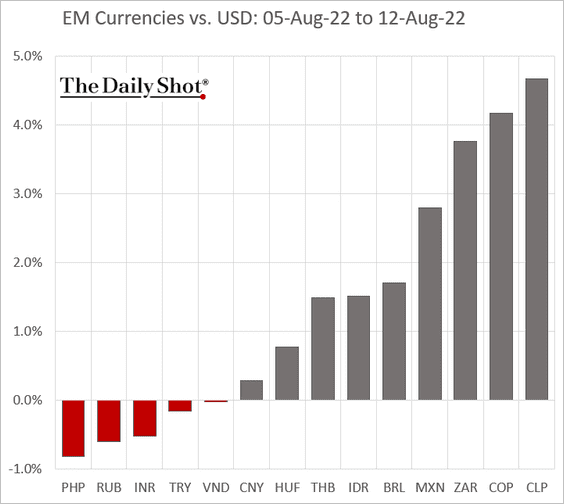
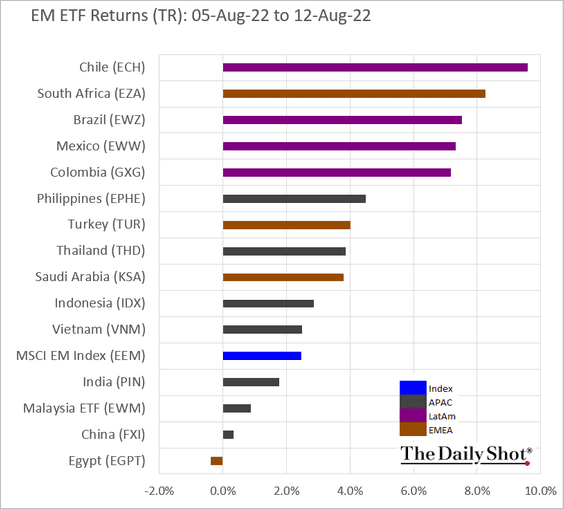
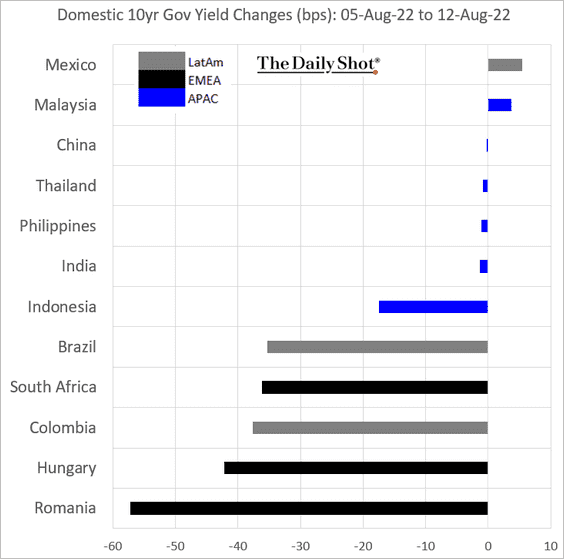
5. Next, we have some performance data from last week.
• Currencies:
By the way, here are LatAm currencies, year-to-date.
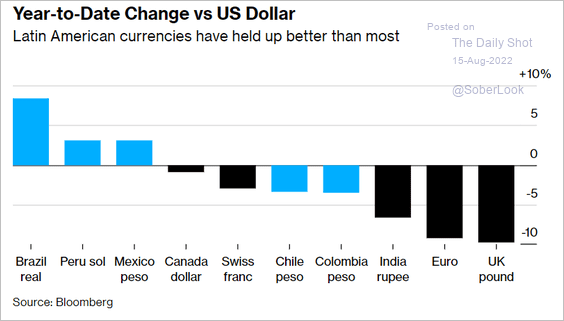 Source: @EloMdeo, @markets Read full article
• Equity ETFs:
• Local bond yields:
Back to Index
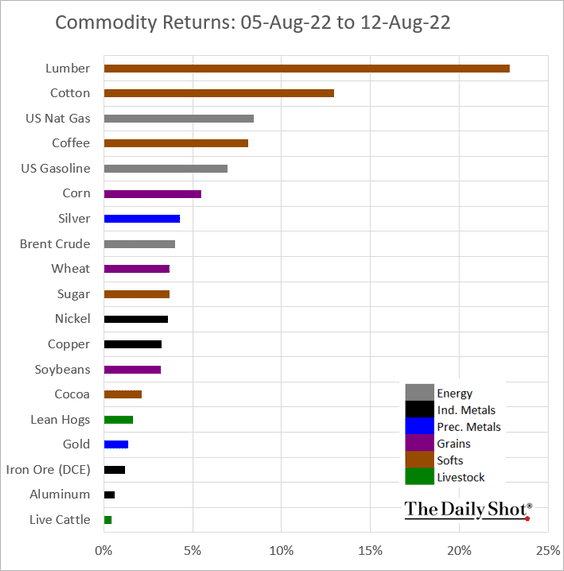
Commodities
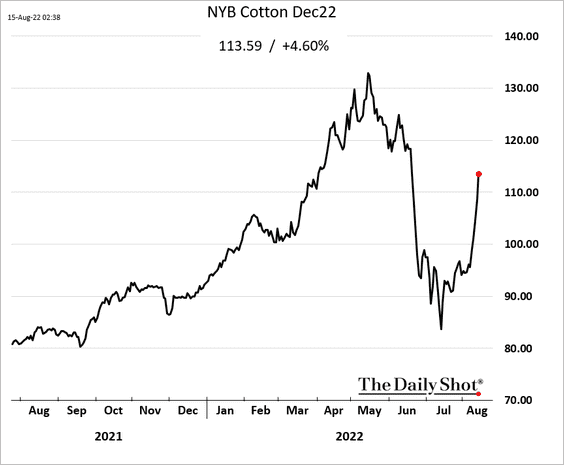
1. US cotton futures have been surging after the USDA announced that the domestic cotton crop will be the lowest in more than a decade.
2. Here is last week’s performance across key commodity markets.
Back to Index
Energy
1. Crude oil has been trending lower.
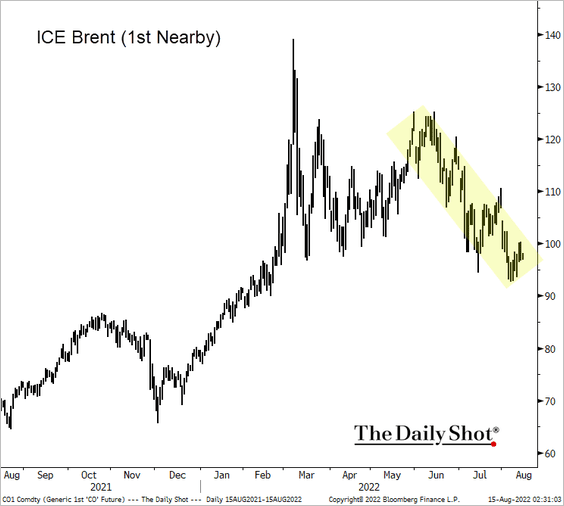 Source: @TheTerminal, Bloomberg Finance L.P.
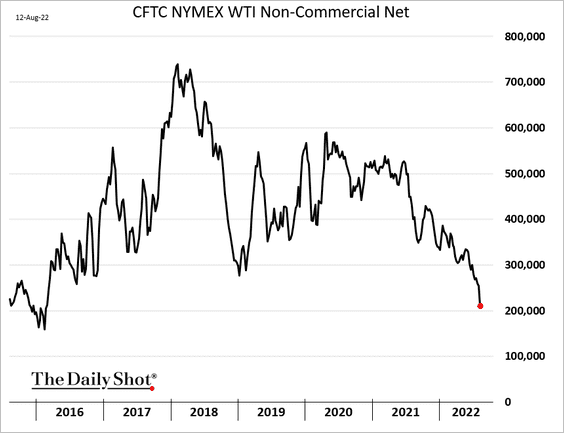
2. Speculative accounts are trimming their bets on oil.
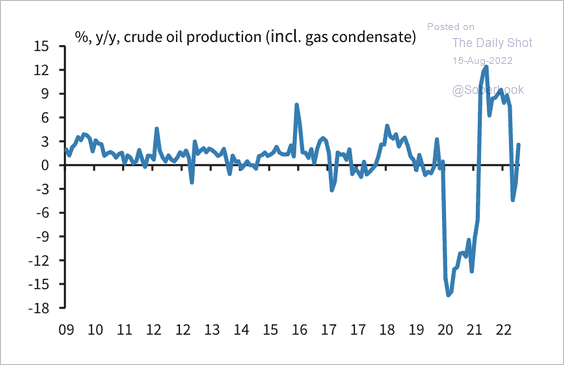
3. Russian crude oil production increased in June after declining in April and May.
 Source: Barclays Research
Back to Index
Equities
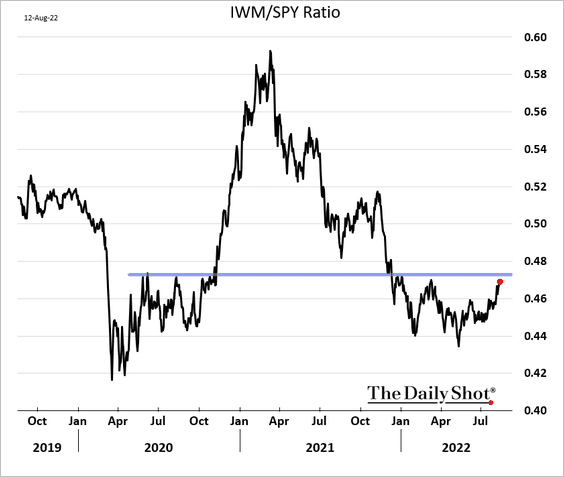
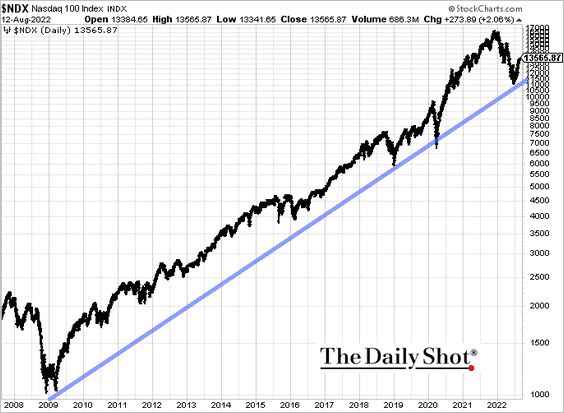
1. Technical indicators show the S&P 500 and the Russell 2000 as overbought as the indices test resistance at the 200-day moving average.
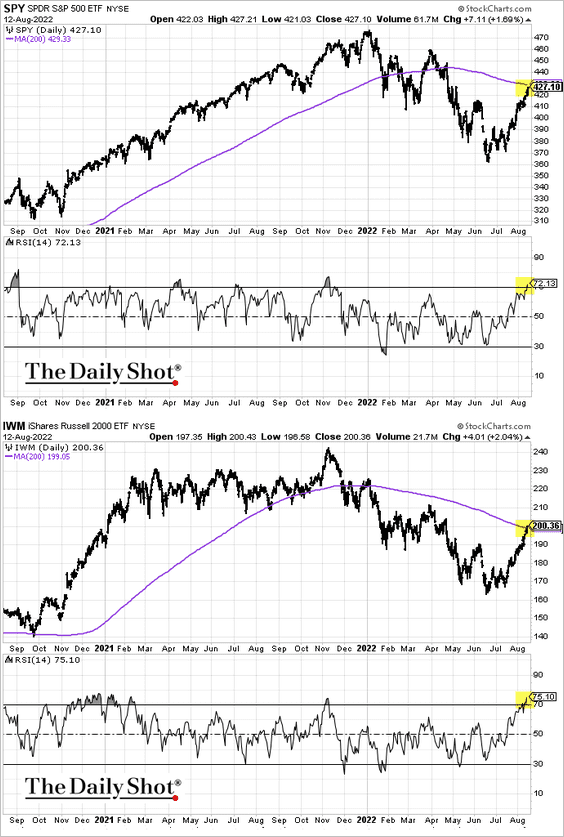
• The Russell 2000/S&P 500 ratio is nearing resistance.
• The Nasdaq 100 held long-term support.
 h/t @mikamsika
——————–
2. Stock performance skews positive around the pause/end of a rate hike cycle, but with a wide range of outcomes.
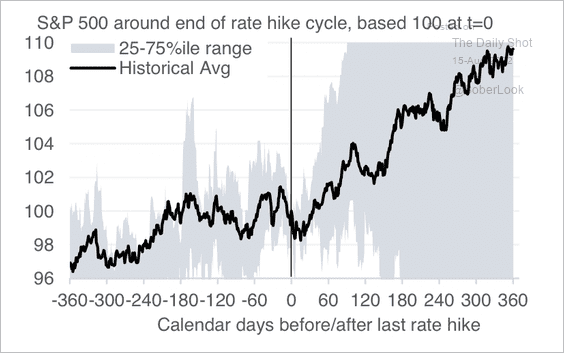 Source: Evercore ISI Research
3. Cyclical sector ETFs have seen significant outflows versus defensives.
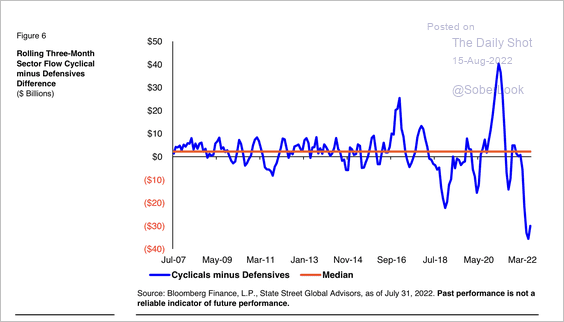 Source: SPDR Americas Research, @mattbartolini
4. Which sectors have the highest non-US exposures?
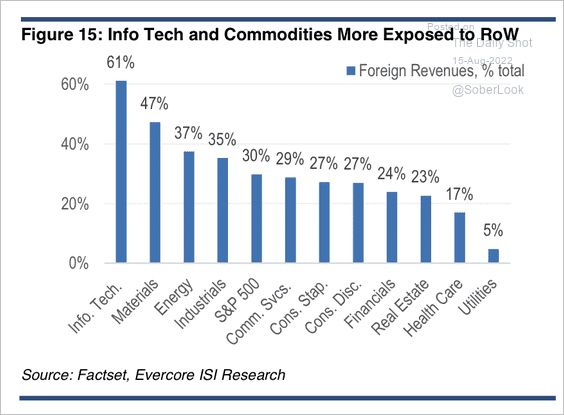 Source: Evercore ISI Research
5. Total equity issuance has slowed substantially this year, …
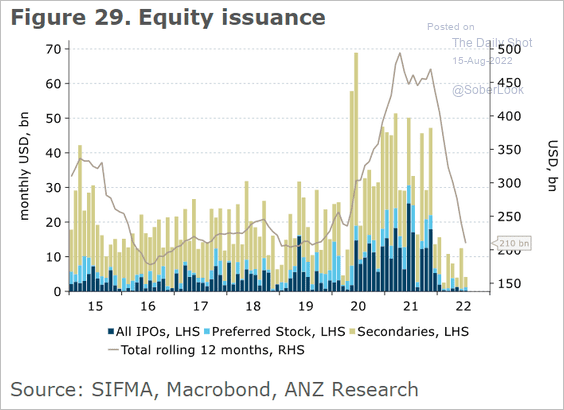 Source: @ANZ_Research
… while share buybacks and M&A have been very strong (2 charts).
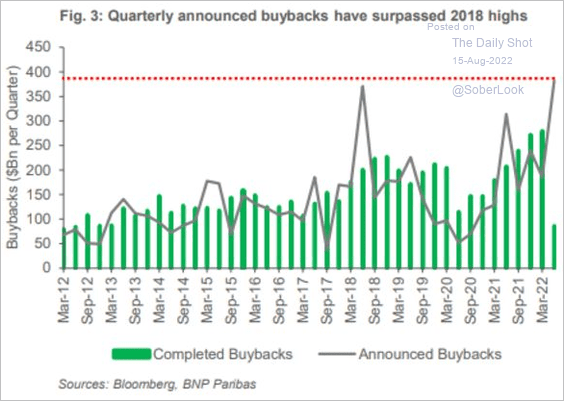 Source: BNP Paribas
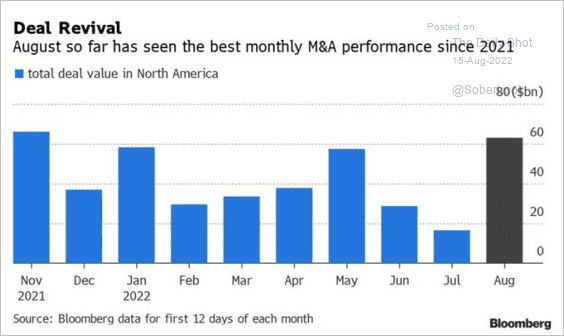 Source: Bloomberg Law Read full article
As a result, we had a substantial reduction in total shares outstanding, which has been supporting the rebound.
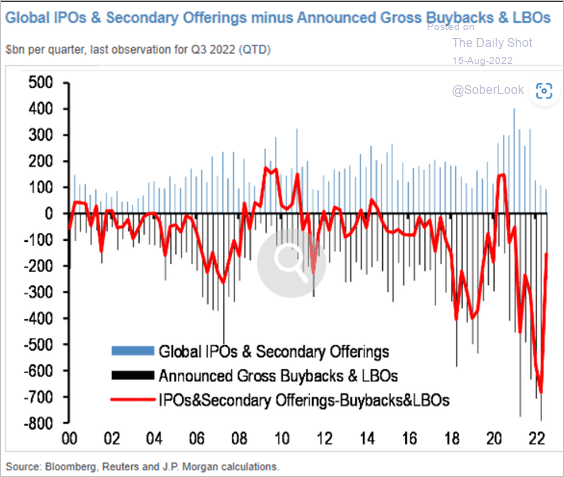 Source: JP Morgan Research; @markets Read full article
——————–
6. Summer rallies are typical before a September pullback.
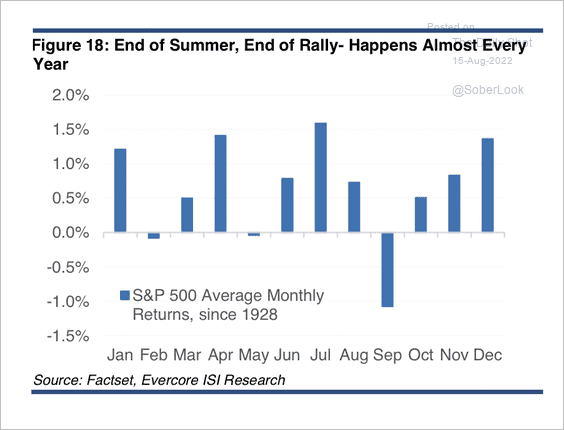 Source: Evercore ISI Research
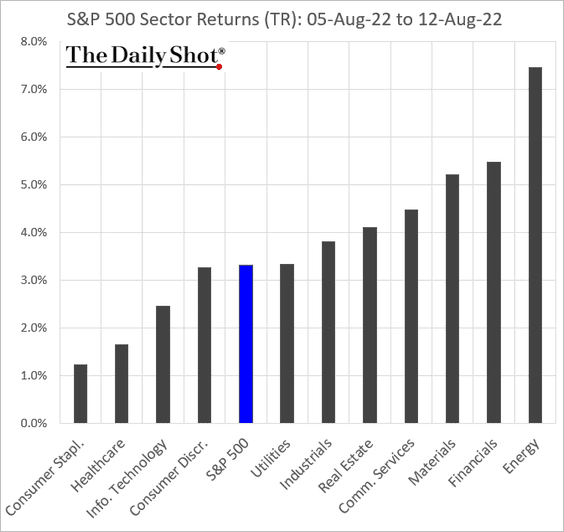
7. Next, we have some performance updates from last week.
• Sectors:
• Factors:
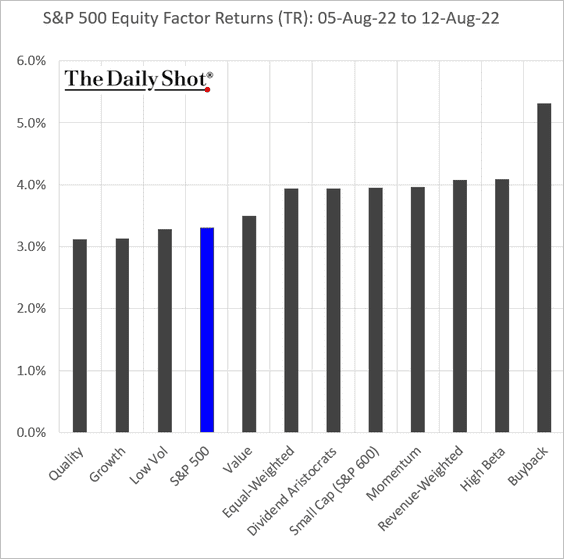
Here are a couple of related charts.
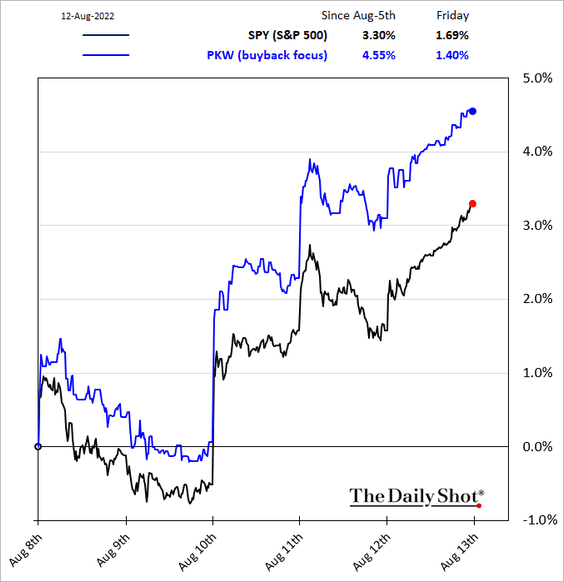
– Buyback-focused companies outperformed last week.
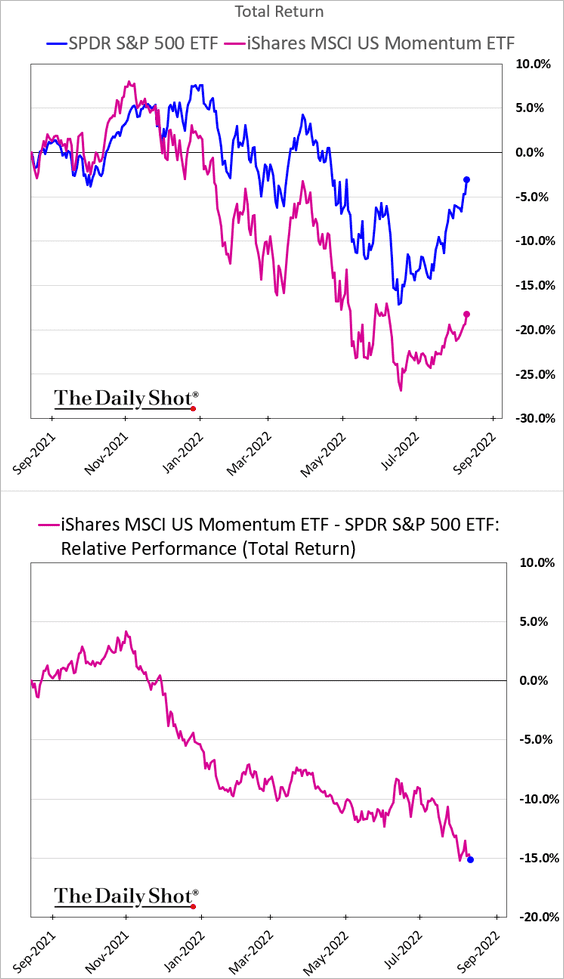
– The momentum factor continues to struggle.
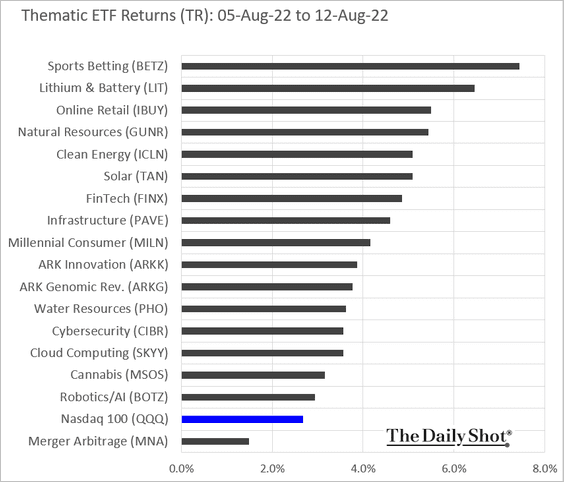
• Thematic ETFs:
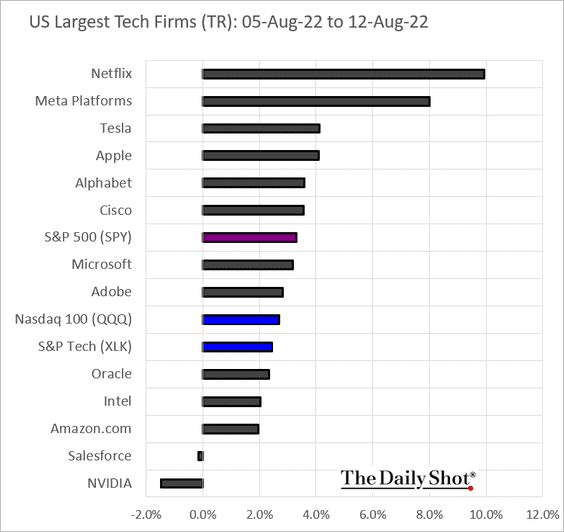
• Tech:
Back to Index
Credit
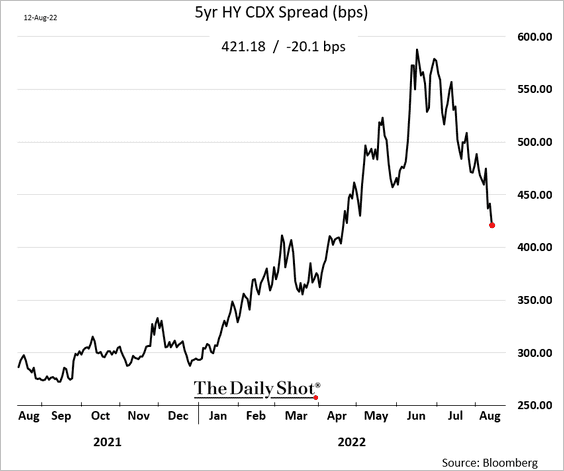
1. Credit spreads have been tightening rapidly.
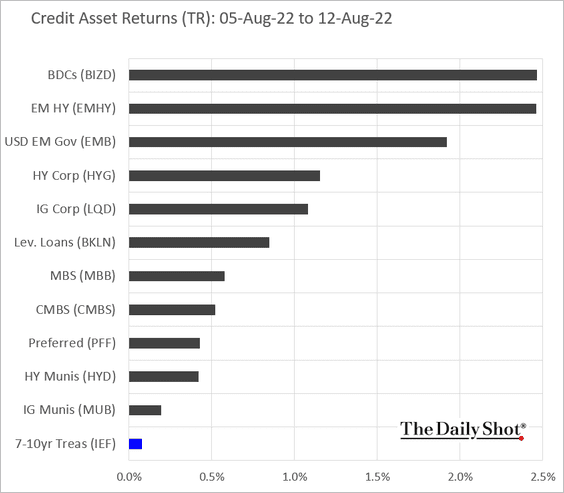
2. Here is last week’s performance across credit asset classes.
Back to Index
Rates
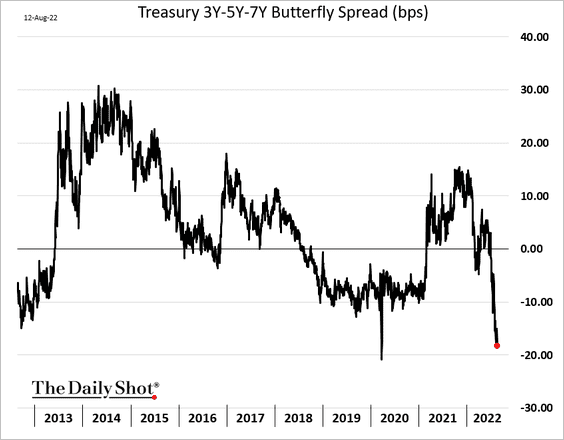
1. The Treasury curve inversion …
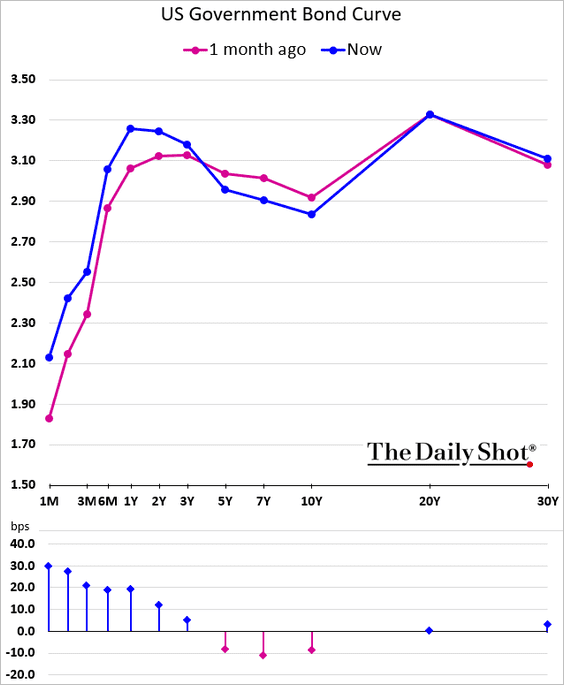
… has pushed the 3-5-7yr butterfly sharply lower.
——————–
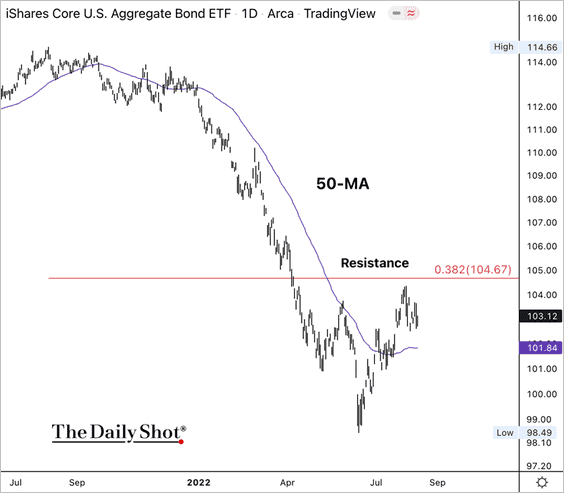
2. The iShares Aggregate Bond Index ETF (AGG) broke above its 50-day moving average but is fading from resistance.
Back to Index
Global Developments
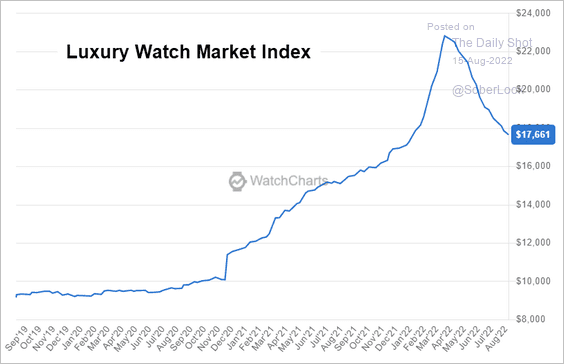
1. The luxury watch bubble has been deflating.
 Source: WatchCharts
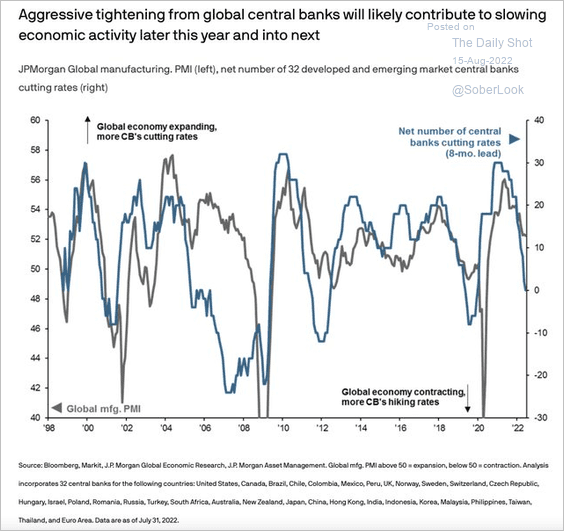
2. An economic slowdown is coming later this year (and into 2023).
 Source: @acemaxx, @JPMorganAM
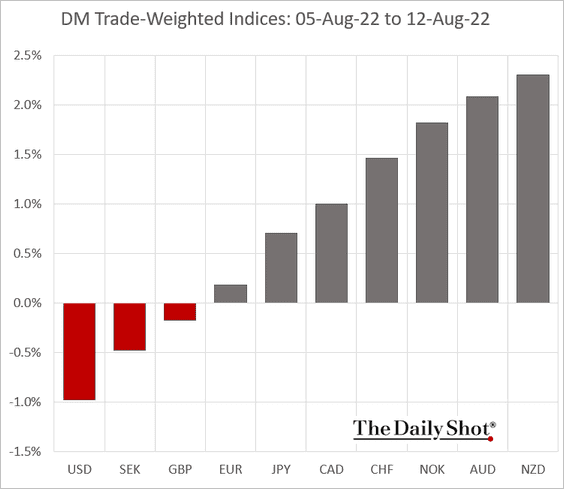
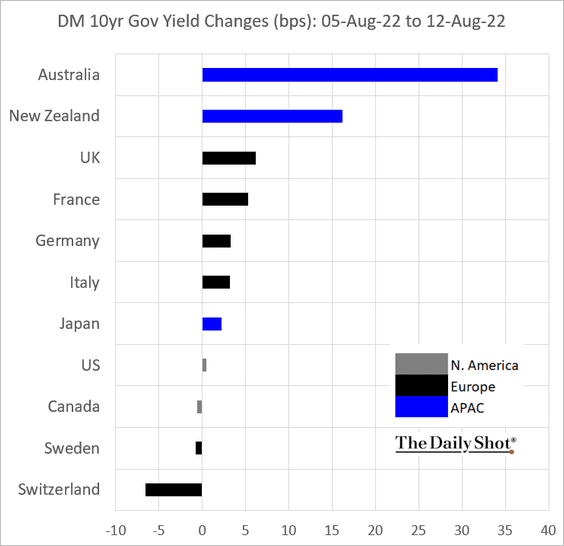
3. Next, we have some performance data from last week.
• Trade-weighted currency indices:
• Bond yields:
——————–
Food for Thought
1. Spending on back-to-school items:
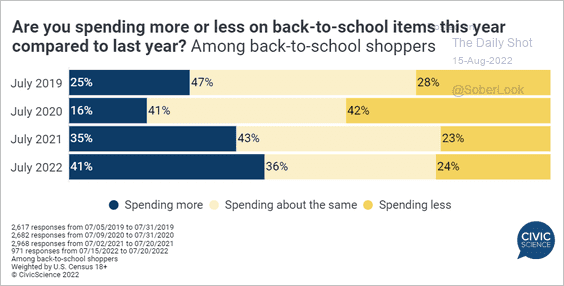 Source: @CivicScience Read full article
2. US new car prices relative to used car prices:
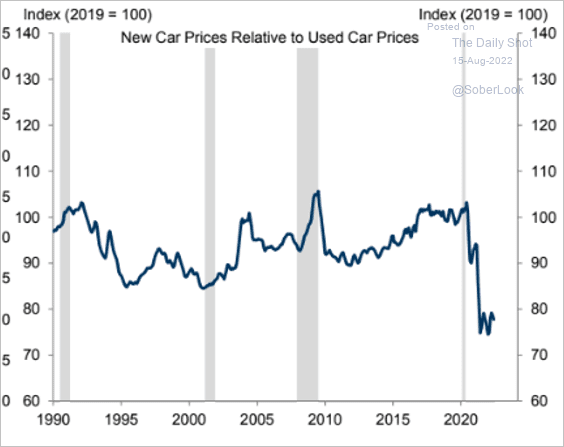 Source: Goldman Sachs; @MikeZaccardi
3. City liveability index:
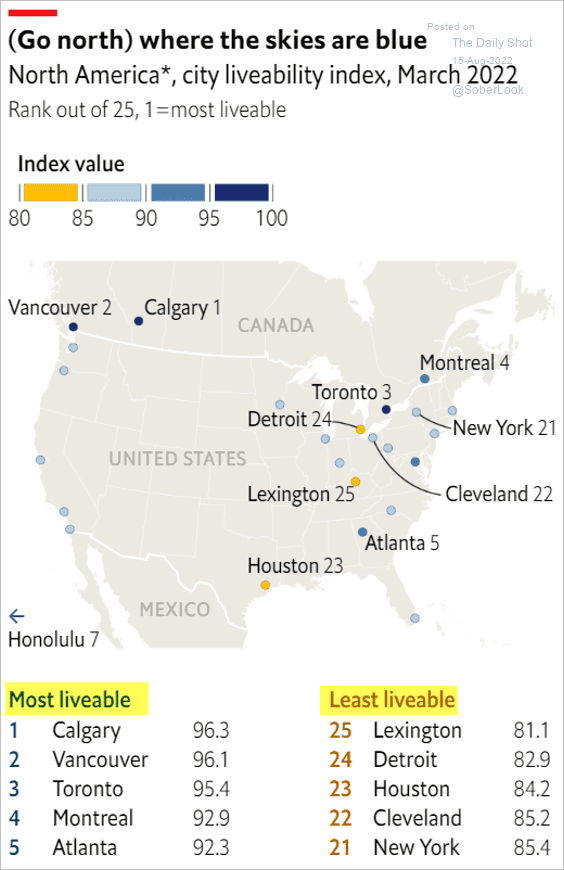 Source: The Economist Read full article
4. Response to higher tuition costs:
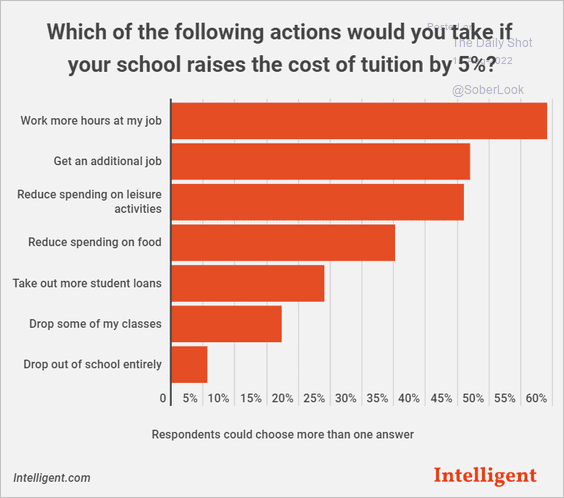 Source: Intelligent.com Read full article
5. Beijing’s diplomatic assault on Taiwan:
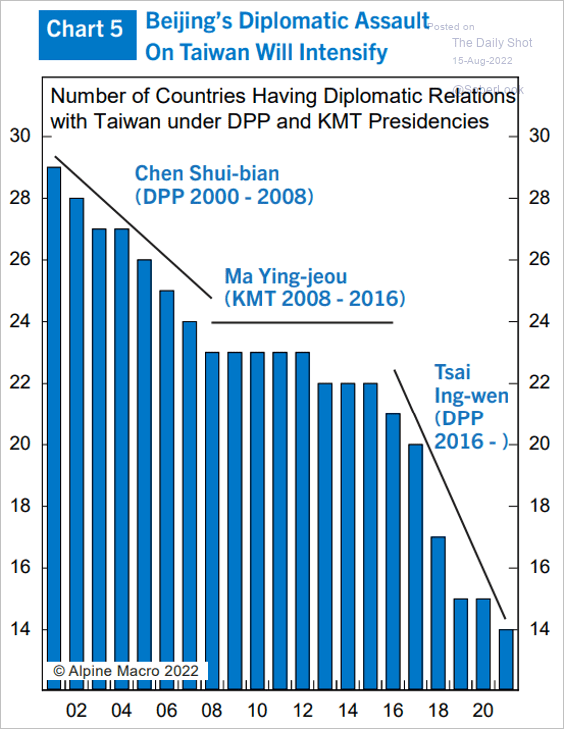 Source: Alpine Macro
6. Motivation for moving to another state:
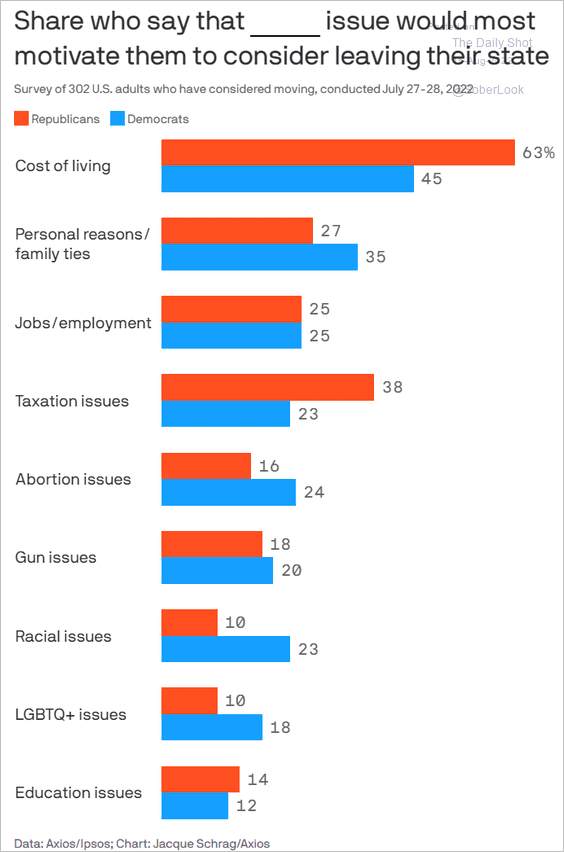 Source: @axios Read full article
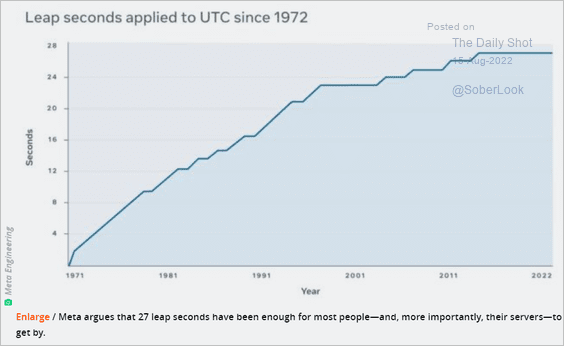
7. Leap seconds applied since 1972:
 Source: Ars Technica Read full article
——————–
Back to Index