
The Daily Shot: 03-Apr-23
• The United States
• Canada
• The United Kingdom
• The Eurozone
• Japan
• Asia – Pacific
• China
• Emerging Markets
• Cryptocurrency
• Commodities
• Energy
• Equities
• Credit
• Rates
• Global Developments
• Food for Thought
The United States
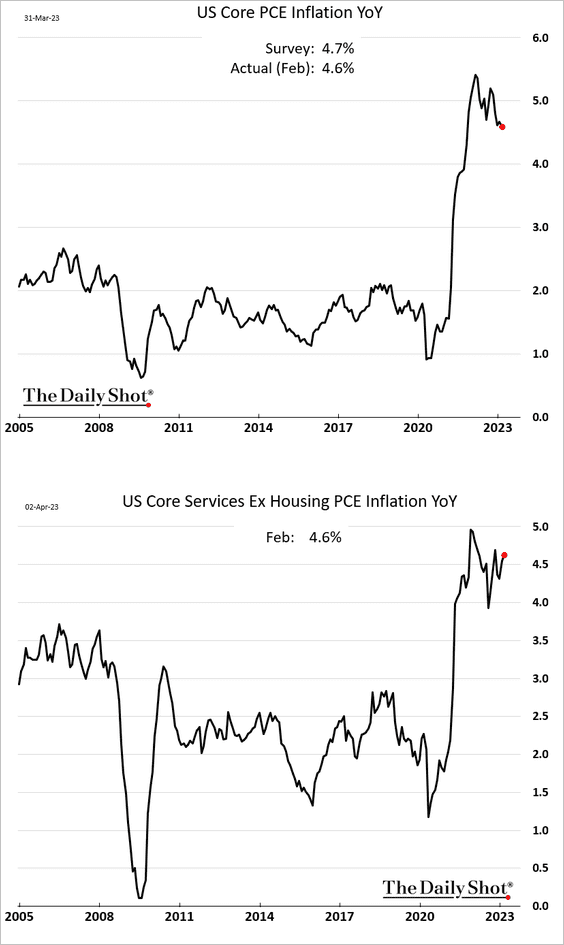
1. The February core PCE inflation came in slightly below forecasts (charts show month-over-month changes). The third panel shows the “supercore” index, which is closely tracked by the Fed.

Supercore inflation remains elevated on a year-over-year basis (2nd panel).
Here are the drivers of the supercore index.
 Source: BCA Research
2. The terminal rate is grinding toward 5% again, with a May rate hike back on the table.

3. Real consumer spending declined slightly in February.

• US real disposable personal income edged higher.

This chart shows US personal income excluding government payments.

• Here is personal saving as a share of disposable income.

——————–
4. The most recent U. Michigan Consumer Sentiment Index showed a decrease compared to the report from early March.

This chart shows households’ perception of their current financial situation relative to five years ago.

• Inflation expectations have been easing. But this trend could reverse if oil prices rise sharply (see the Energy section).

——————–
5. The MNI Chicago PMI edged higher in March but still points to softer national manufacturing activity (ISM) last month.
 Source: @TheTerminal, Bloomberg Finance L.P.
Regional Fed indicators also signal ISM weakness ahead.
 Source: Yardeni Research
——————–
6. Tax refunds are running well below last year’s levels.
 Source: Oxford Economics
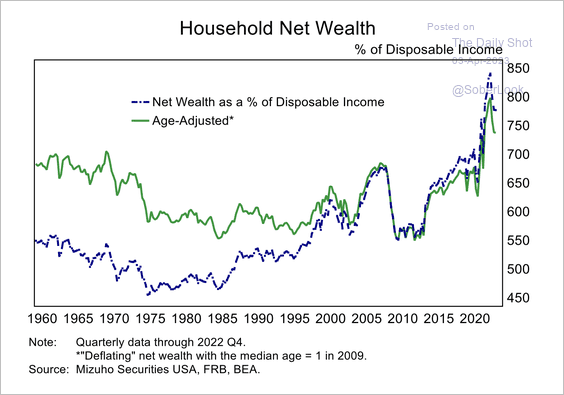
7. Household net wealth remains elevated, due to historically low debt levels, high cash, and relatively strong asset prices. (2 charts)
 Source: Mizuho Securities USA
 Source: Mizuho Securities USA
Back to Index
Canada
1. The GDP bounced in January.

The economy is tracking 2.8% growth in Q1.
 Source: @rtkwrites, @economics Read full article
 Source: @rtkwrites, @economics Read full article
——————–
2. Speculative accounts continue to bet against the loonie.

Back to Index
The United Kingdom
1. Home prices declined further on a year-over-year basis in March.

 Source: Reuters Read full article
——————–
2. The Lloyds business sentiment index improved last month.

3. UK financials outperformed US peers, boosting the pound.
 Source: Capital Economics
4. The UK is currently experiencing some of the most contentious labor disputes since 1989.
 Source: @WillWilkesNews, @tomelleryrees, @eckldorna, @bpolitics Read full article
5. Immigration kept the workforce from shrinking last year.
 Source: Pantheon Macroeconomics
Back to Index
The Eurozone
1. Headline inflation indicators eased in March.
• Italy:

• France (still running hot):

• The Netherlands:

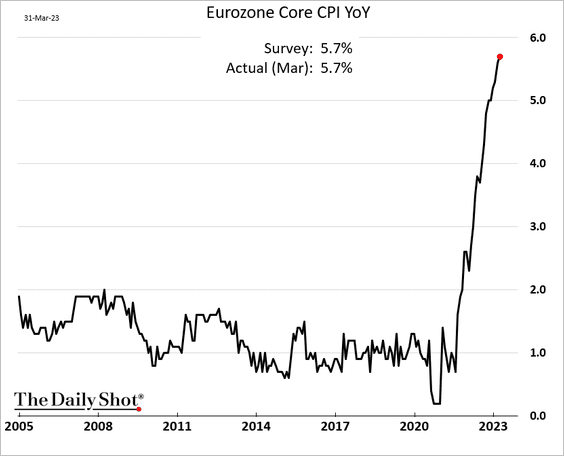
• The Eurozone:

However, core inflation continues to surge.
 Source: Reuters Read full article
——————–
2. German import prices are headed toward deflation (due to lower energy prices).

3. French household consumption of goods remains on a downward trajectory.

4. Germany’s unemployment rate increased in March.

Unemployment held steady at the Eurozone level.

Back to Index
Japan
1. The Tankan report showed soft manufacturing sentiment in Q1.

 Source: Reuters Read full article
• The non-manufacturing index is back at pre-COVID levels.

• Manufacturing output prices signal a peak in Japan’s consumer inflation.
 Source: Capital Economics
——————–
2. Non-bank financial institutions own a lot of foreign assets.
 Source: Gavekal Research
Back to Index
Asia – Pacific
1. South Korea’s exports remain well below last year’s levels.

Imports are also down on a year-over-year basis.
 Source: ING
South Korea’s manufacturing activity contracted at a faster pace in March.
 Source: S&P Global PMI
——————–
2. Australia’s residential building approvals are at multi-year lows.

Home prices jumped last month.

 Source: @WSJ Read full article
Back to Index
China
1. The manufacturing PMI report from S&P Global was softer than expected, suggesting that the rebound has stalled.

 Source: Reuters Read full article
——————–
2. Onshore stocks continue to hold support relative to global equities.
 Source: BCA Research
A sustained economic recovery could support equity market outperformance.
 Source: BCA Research
——————–
3. Banks’ interest margins have been shrinking in recent years.
 Source: Marco Polo Read full article
Back to Index
Emerging Markets
1. Let’s run through Asian manufacturing PMI indices.
• ASEAN (slower growth):
 Source: S&P Global PMI
• Thailand (growth continues):
 Source: S&P Global PMI
• Indonesia (faster expansion):
 Source: S&P Global PMI
• Malaysia (contraction):
 Source: S&P Global PMI
• The Philippines (robust):
 Source: S&P Global PMI
• Vietnam (back in contraction):
 Source: S&P Global PMI
• India (very strong):
 Source: S&P Global PMI
——————–
2. India’s key industries’ output remains robust.

 Source: Economic Times Read full article
——————–
3. Pakistan’s inflation continues to surge (after currency devaluation).

4. South Africa’s trade balance unexpectedly swung into surplus.

5. Mexico’s unemployment rate hit a multi-year low.

6. Next, we have some performance data for March.
• Currencies:

• Bond yields:

• Equity ETFs:

Back to Index
Cryptocurrency
1. Crypto liquidity deteriorated in March.
 Source: @isabelletanlee, @technology Read full article
2. Here is last month’s performance for select cryptos.

Back to Index
Commodities
This chart displays the March performance of major commodity markets.

Back to Index
Energy
1. OPEC unexpectedly announced a large cut in production, …
 Source: Reuters Read full article
… sending crude prices sharply higher.

Positioning has been bearish, which could support further gains.
 Source: Deutsche Bank Research
——————–
2. This chart shows US natural gas pipeline exports to Mexico.
 Source: @EIAgov
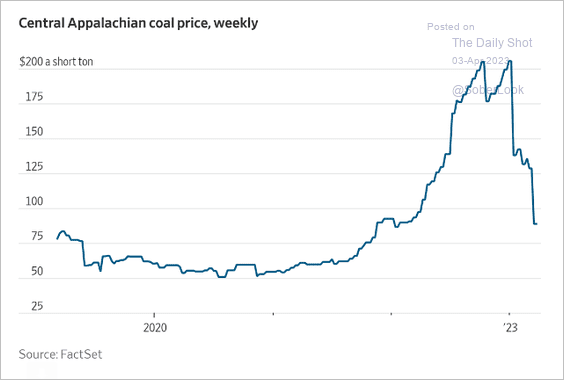
3. Weak natural gas prices have been pressuring coal.
 Source: @WSJ Read full article
Back to Index
Equities
1. Let’s start with the quarterly attribution for the S&P 500 and the S&P 600.


——————–
2. Top three stocks have been driving recent gains in the S&P 500.
 Source: Simon White, Bloomberg Markets Live Blog
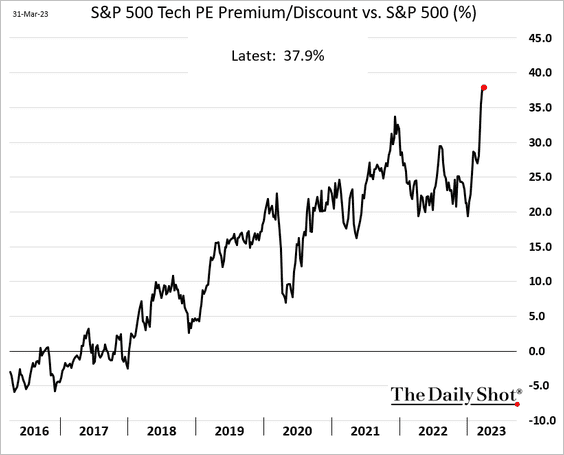
3. Tech shares are trading at a substantial premium to the S&P 500.
4. Hedge funds have rotated from cyclicals to defensives.
 Source: JP Morgan Research; @luwangnyc, @markets Read full article
5. Fund flows show rotation from value to secular growth (from financials to tech).
 Source: Deutsche Bank Research
6. So far, S&P 500 sector returns have been underwhelming compared to prior bear market lows.
 Source: @scottcharts
7. Deutsche Bank’s “early cycle” basket has sharply underperformed “end of cycle” stocks.
 Source: Deutsche Bank Research
8. Options activity is down sharply from the recent peak.
 Source: Deutsche Bank Research
• The Nasdaq 100 VIX-equivalent index hit its lowest level since January 2022.

——————–
9. Finally, we have some performance data for March.
• Sectors:

• Equity factors:

• Macro basket pairs:

– Stocks that benefit from higher prices underperformed.

• Thematic ETFs:

• Largest US tech firms:

Back to Index
Credit
1. Small banks saw a tiny portion of lost deposits return last week.

Total US bank deposits continue to fall.
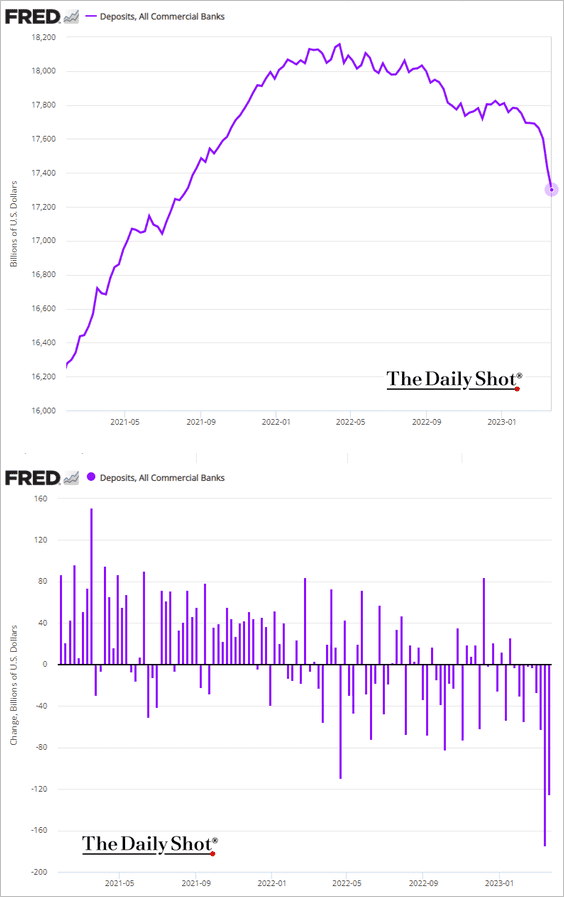
What’s driving the declines? Deposits have been flowing into the Fed’s RRP facility …

… via retail money market funds. We should see some deposits return to the banking system, now that we are past the quarter-end.

——————–
2. Weaker banks continue to pay a premium to borrow in the fed funds market.

3. Bank credit default swap spreads remain low relative to previous spikes.
 Source: MRB Partners
4. CMBS spreads continue to widen.

5. Next, we have some performance data for March.

Back to Index
Rates
Here are the Treasury yield change attributions.
• March:

• Q1:

Back to Index
Global Developments
1. So far, this has been the year of reversals.
 Source: @LizYoungStrat
2. Next, we have some DM performance data for March.
• Currency indices:

• Yields:

• Large-cap equity indices:

——————–
Food for Thought
1. Global app revenues:
 Source: Statista
2. Changes in poverty rates:
 Source: US Census Bureau
3. Deadliest natural disasters:
 Source: @genuine_impact
4. Iran’s stockpile of enriched uranium:
 Source: @ethanbronner, @bpolitics Read full article
5. GOP 2024 nomination poll:
 Source: @MorningConsult Read full article
6. Better to be born rich than gifted:
 Source: Papageorge and Thom Read full article
——————–
Back to Index