
The Daily Shot: 31-Jul-23
• The United States
• Canada
• The United Kingdom
• The Eurozone
• Europe
• Japan
• China
• Emerging Markets
• Cryptocurrency
• Commodities
• Equities
• Credit
• Global Developments
• Food for Thought
The United States
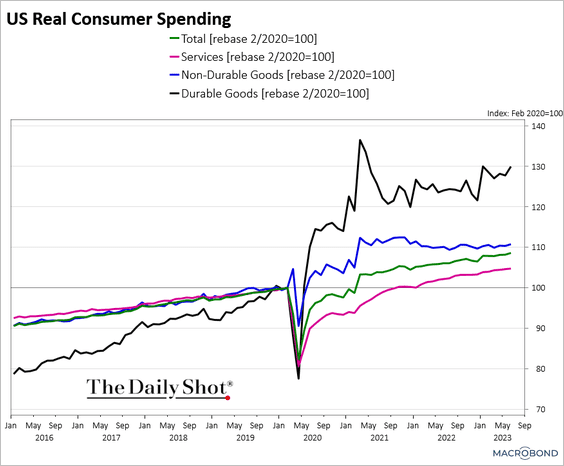
1. Consumer spending increased in June, …
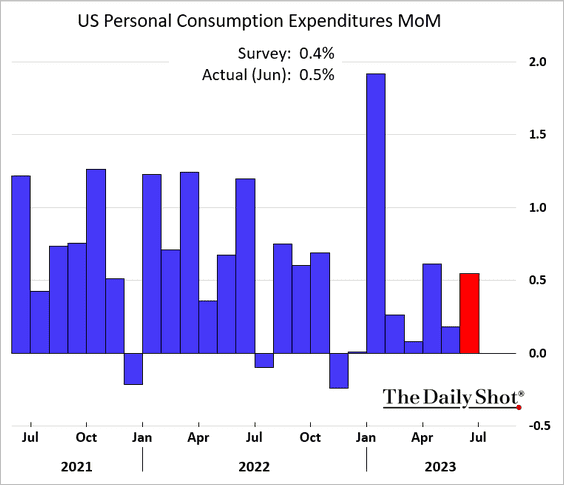
… with gains across goods and services.
 Source: Chart and data provided by Macrobond
 Source: MarketWatch Read full article
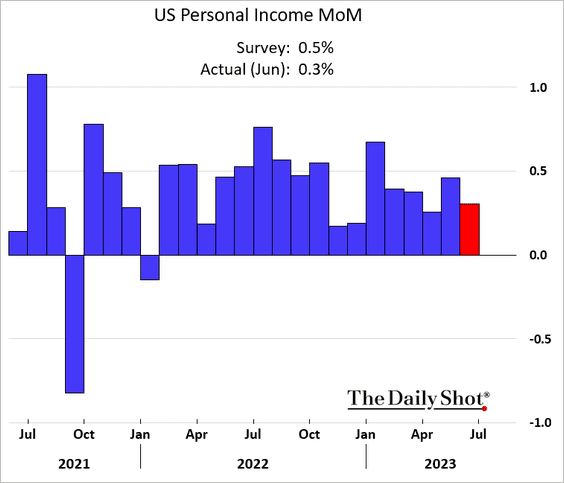
• Personal income increased less than expected.
– This chart shows real personal income, excluding government payments (level).
![]()
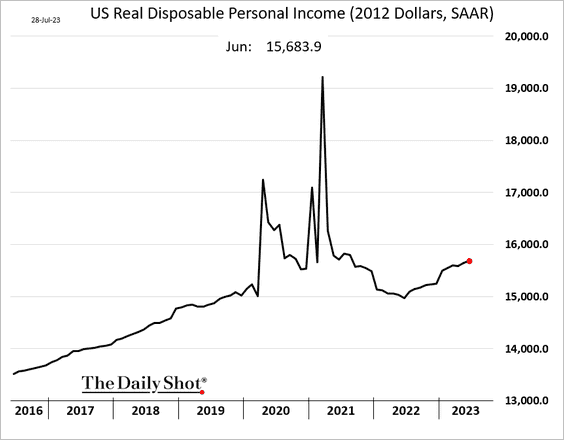
– And here is real disposable income.
• The savings rate declined in June.
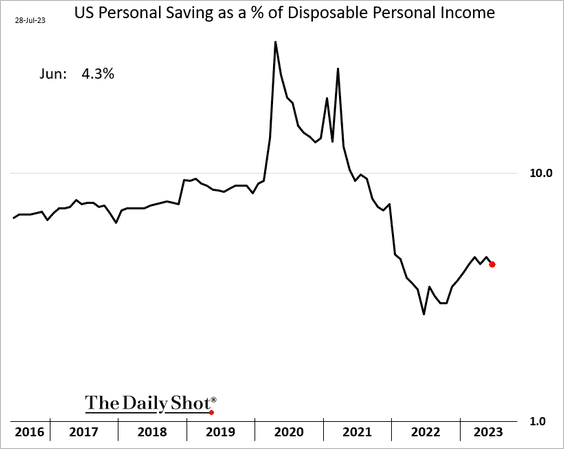
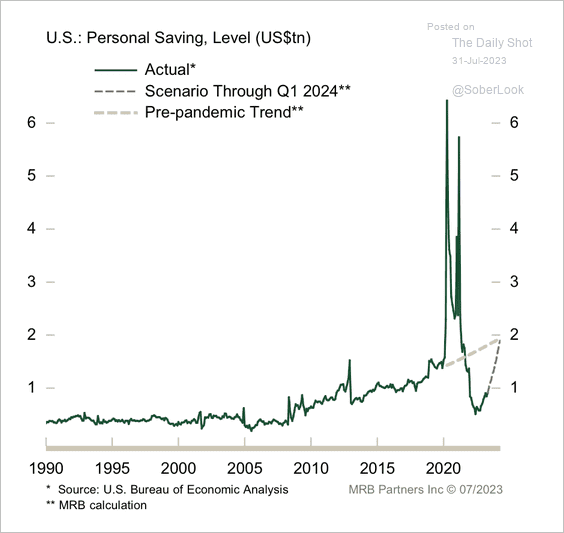
Estimates vary on the level of excess savings, but they continue to trend lower.
– Scotia Capital:
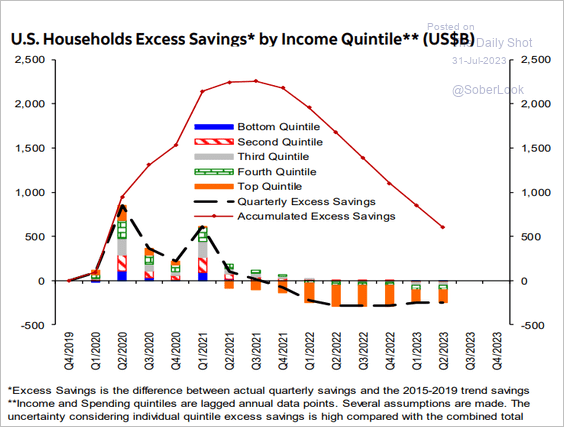 Source: Hugo Ste-Marie, Portfolio & Quantitative Strategy Global Equity Research, Scotia Capital
– Wells Fargo:
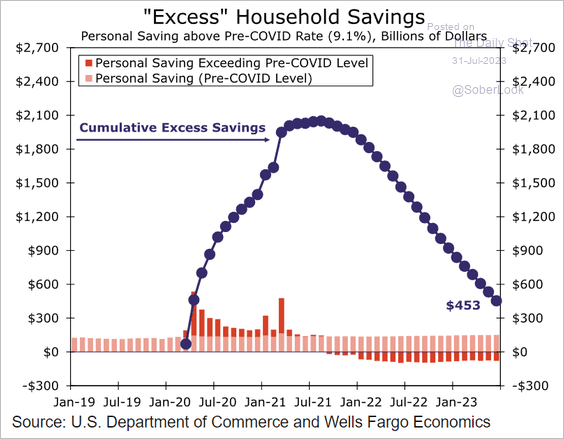 Source: Wells Fargo Securities
– MRB Partners expects a complete drawdown of excess savings by Q1 2024.
 Source: MRB Partners
——————–
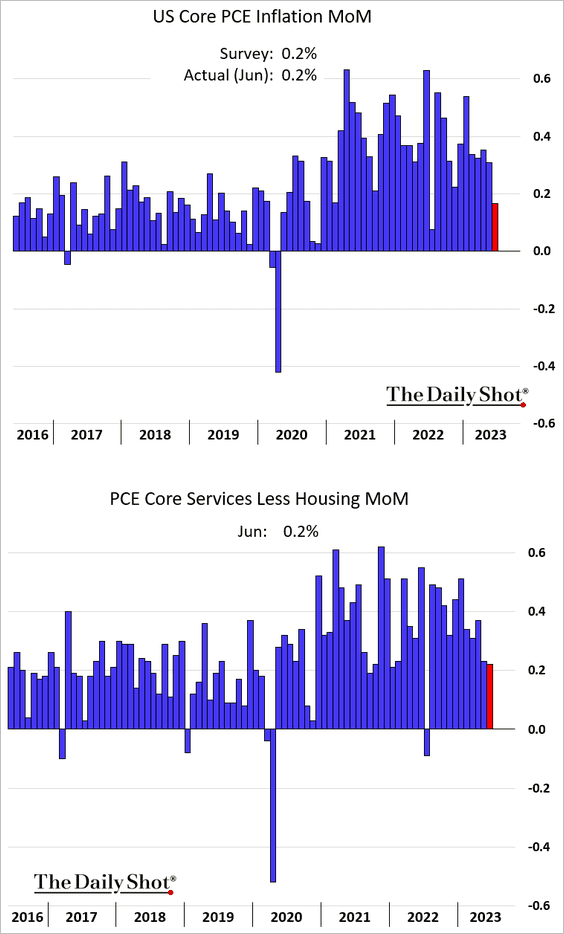
2. Core inflation eased in June. The second panel shows the “supercore” PCE inflation.
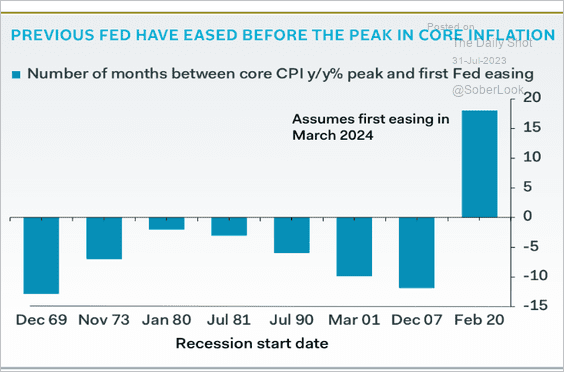
In this cycle, the peak in core inflation came long before the (expected) first Fed rate cut.
 Source: Pantheon Macroeconomics
——————–
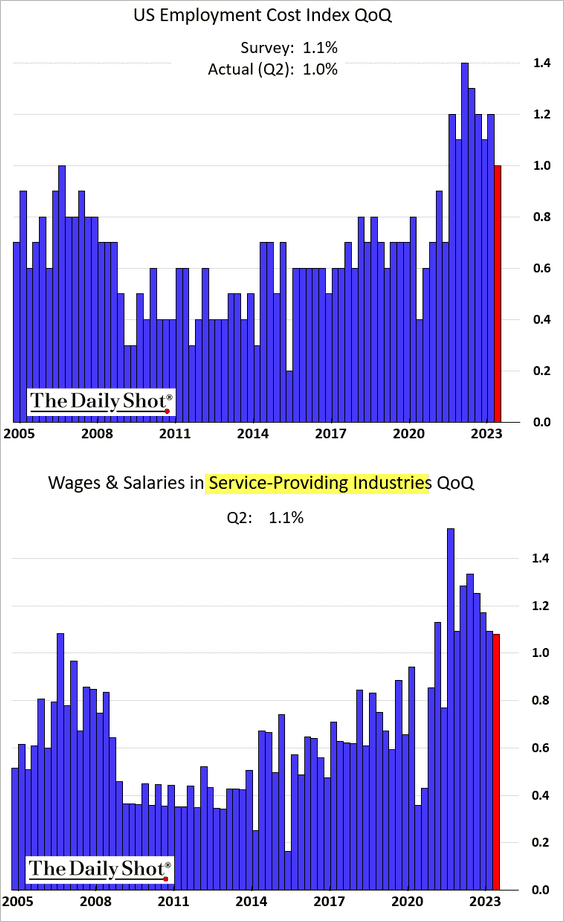
3. Gains in employment costs slowed in Q2 but remain elevated.
 Source: Reuters Read full article
——————–
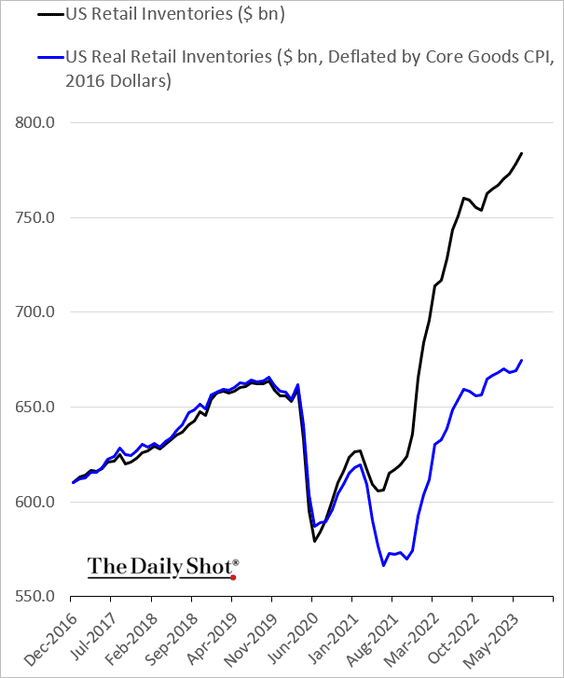
4. Retail inventories keep climbing.
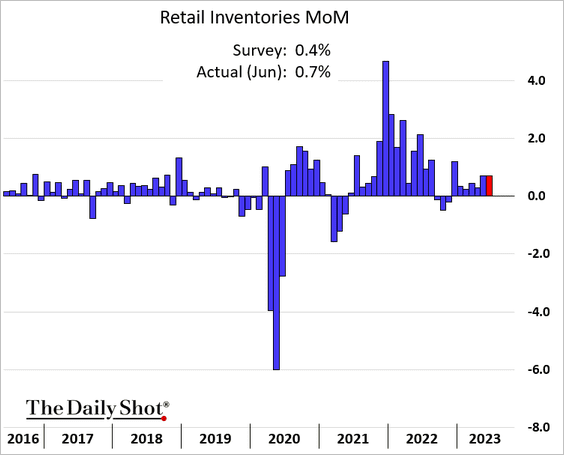
The blue line below shows real retail inventories.
——————–
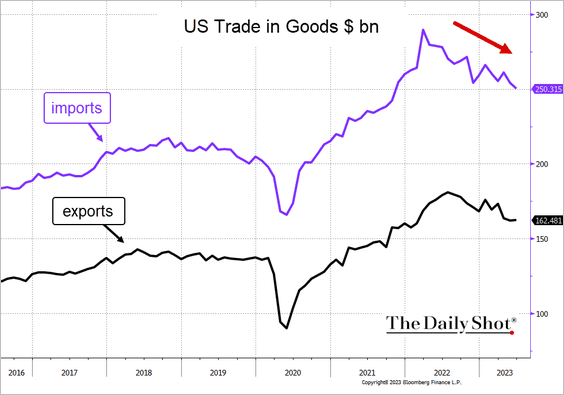
5. The trade deficit in goods narrowed in June, …
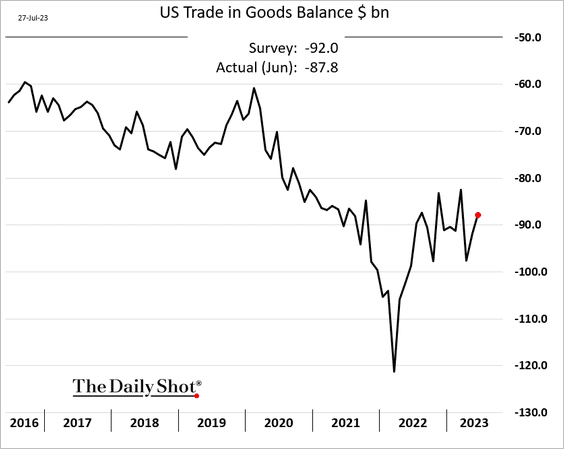
… as imports slowed.
 Source: @TheTerminal, Bloomberg Finance L.P.
——————–
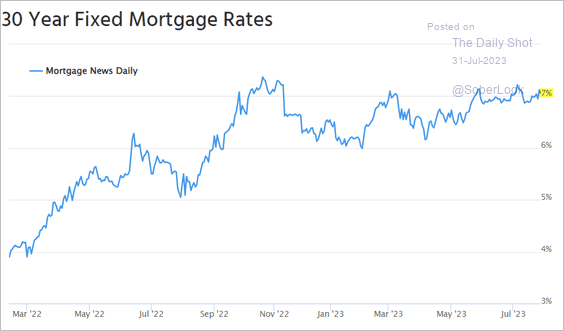
6. Mortgage rates are holding near 7%.
 Source: Mortgage News Daily
7. The US Citi Economic Surprise Index has massively outperformed economic data globally.
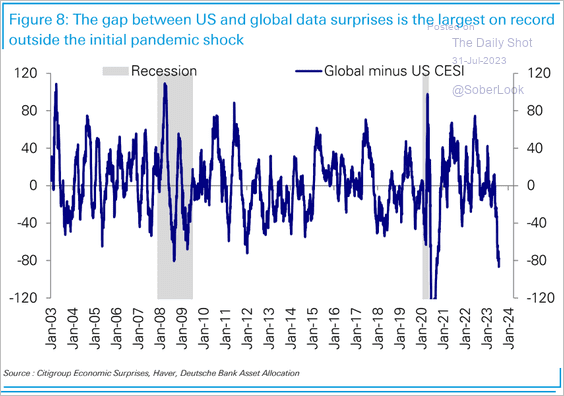 Source: Deutsche Bank Research
Back to Index
Canada
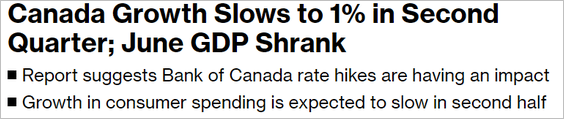
1. Canada’s economy contracted in June.
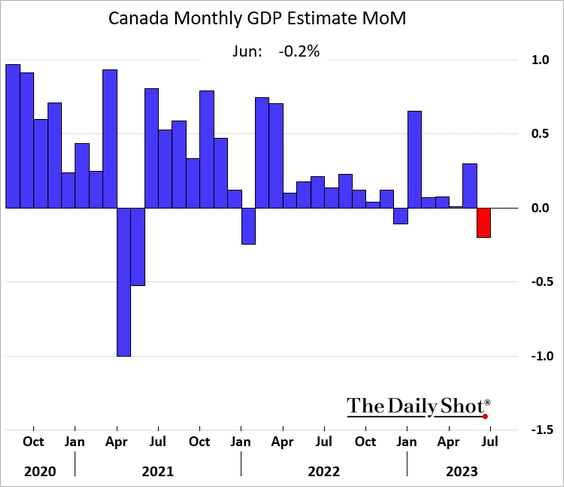
Forest fire depressed the Q2 GDP growth.
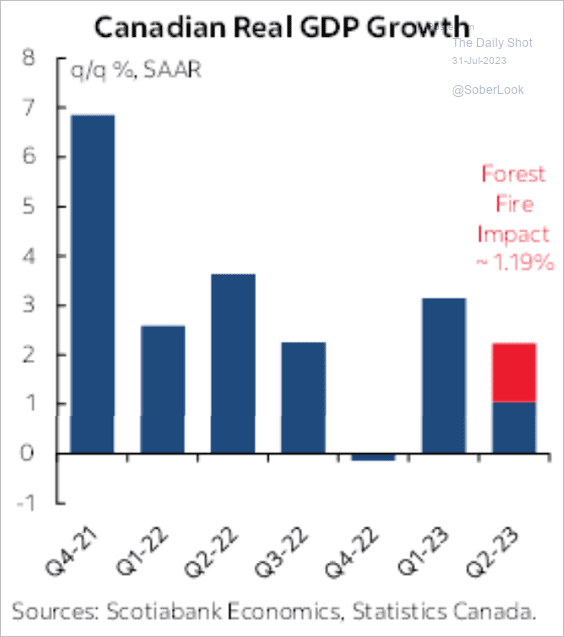 Source: Scotiabank Economics
 Source: @economics Read full article
——————–
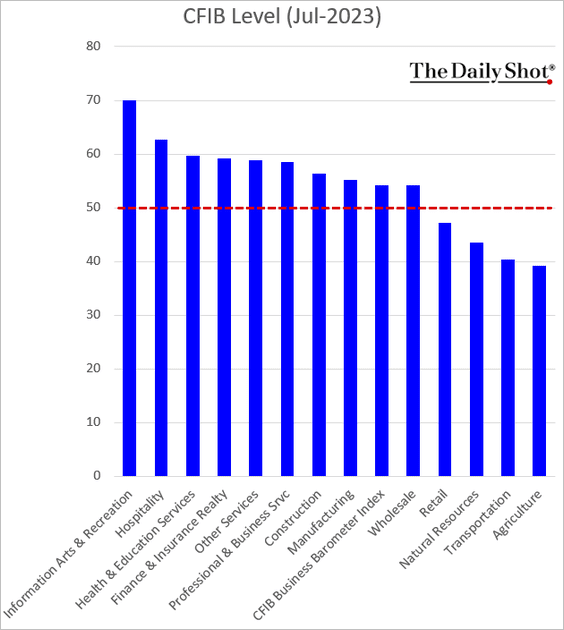
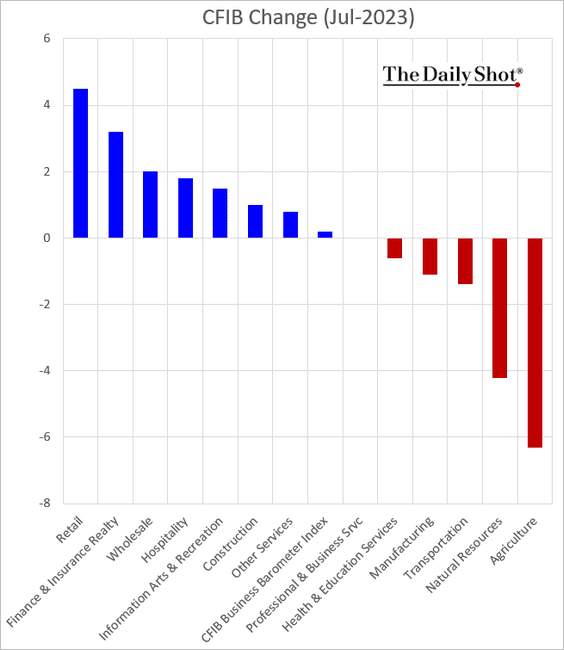
2. The CFIB small business index edged higher this month.
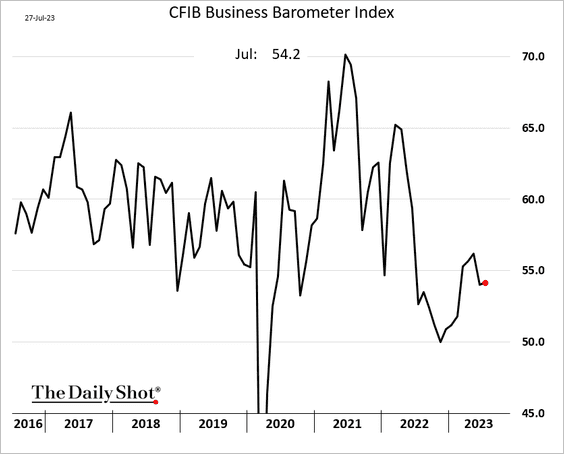
The charts below show the CFIB level and July changes by sector.
——————–
3. Unit labor costs have been rising quickly.
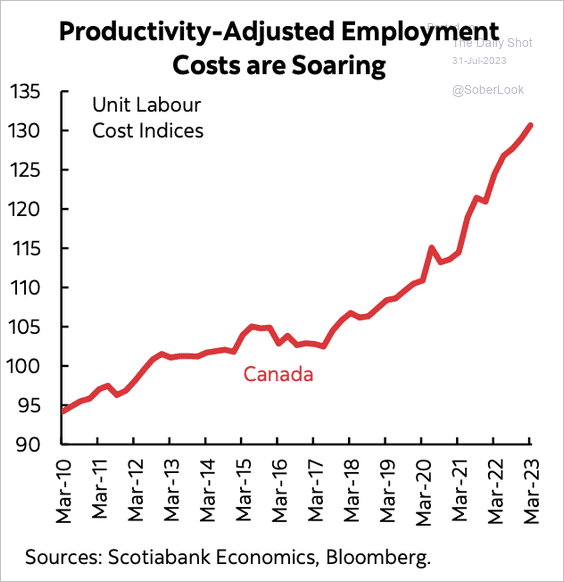 Source: Scotiabank Economics
Back to Index
The United Kingdom
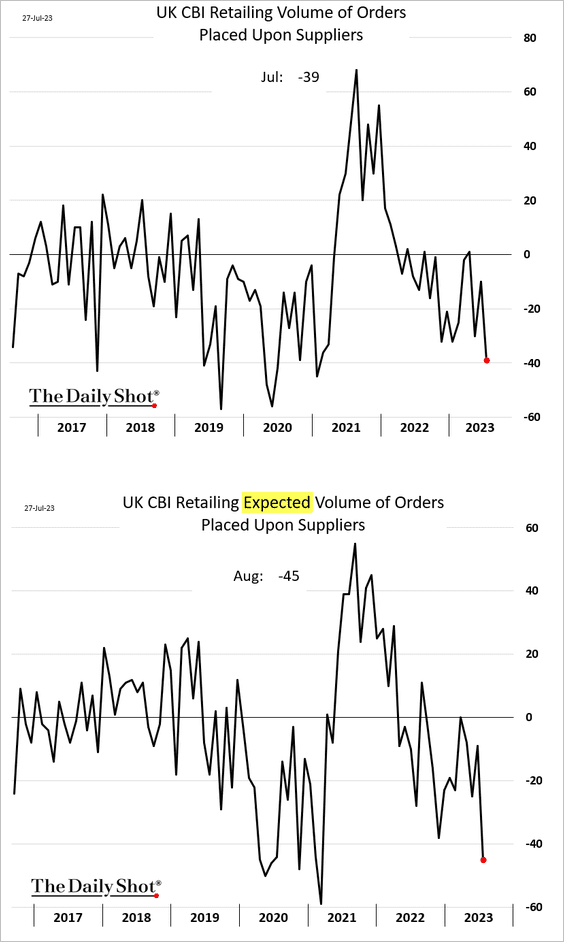
1. The CBI report showed a sharp pullback in retail sales this month.
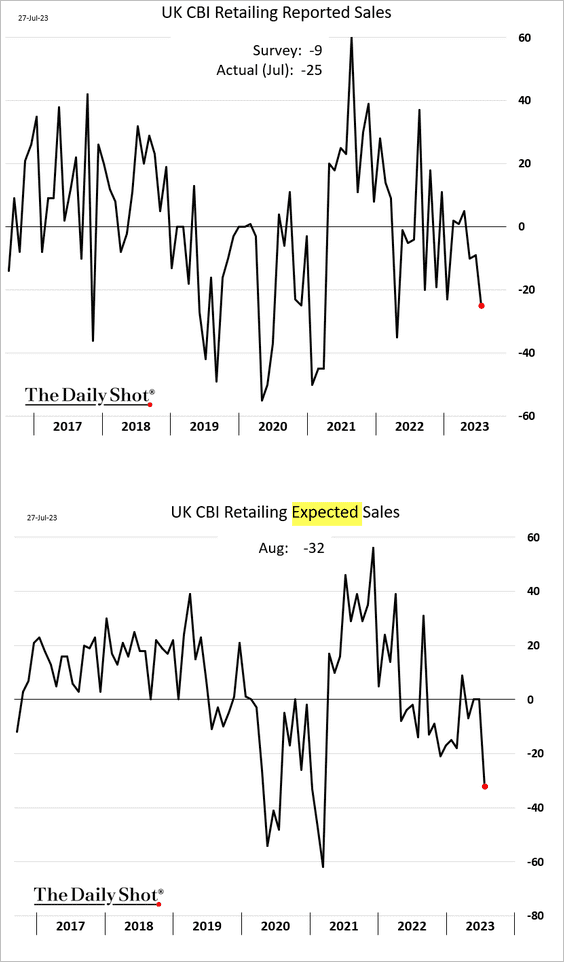
 Source: Reuters Read full article
Retailers are reducing their orders placed with suppliers due to changing market conditions.
——————–
2. A large number of Britons are not working due to long-term sickness.
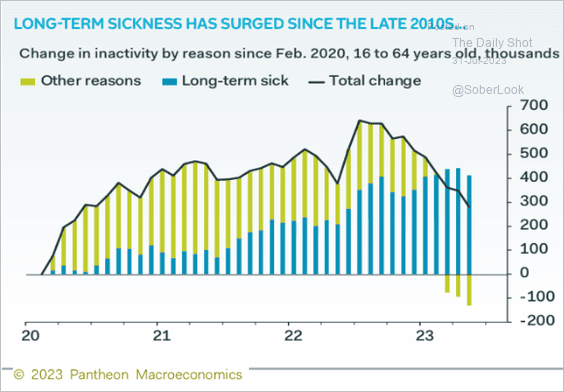 Source: Pantheon Macroeconomics
Back to Index
The Eurozone
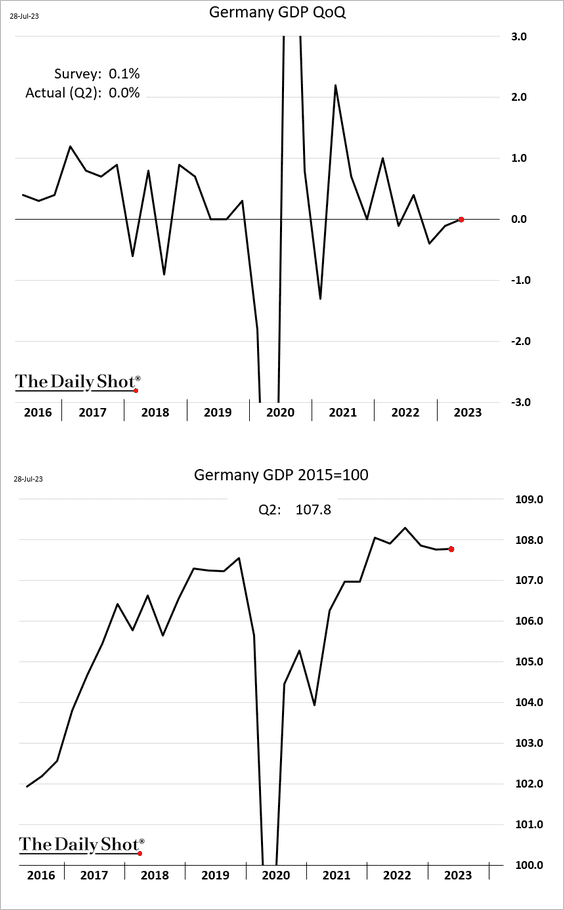
1. Let’s begin with the GDP reports.
• Germany’s GDP was flat in Q2.
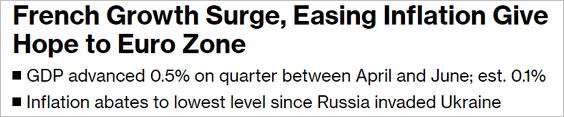
• French GDP growth surprised to the upside …
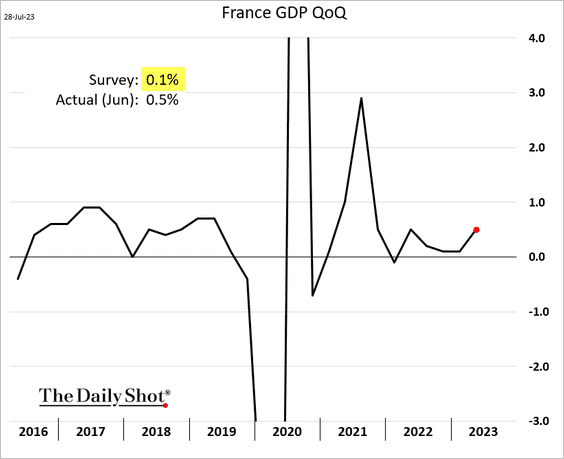
 Source: @economics Read full article
… driven by exports.
 Source: Pantheon Macroeconomics
——————–
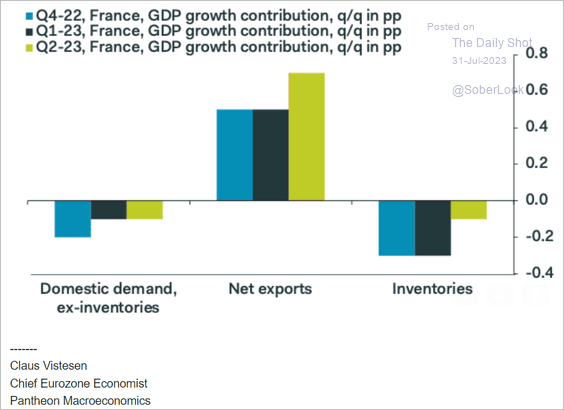
• Spain’s GDP growth remains robust.
• Forecasters (ECB’s Survey of Professional Forecasters) downgraded their estimates for the euro-area GDP growth over the next few years.
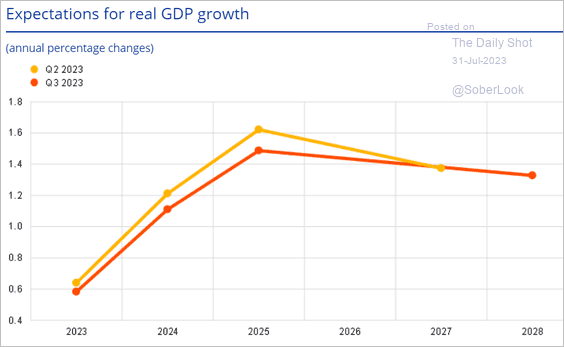 Source: ECB
——————–
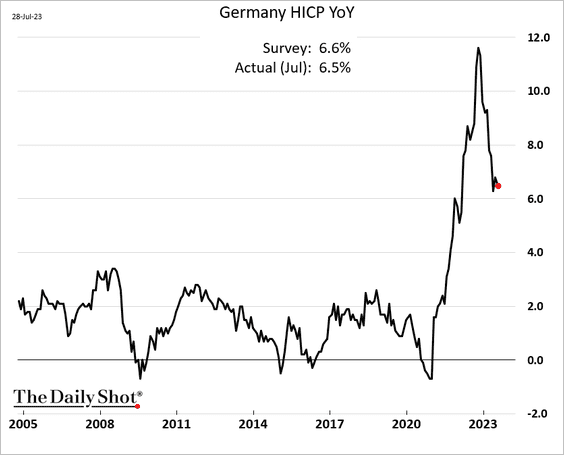
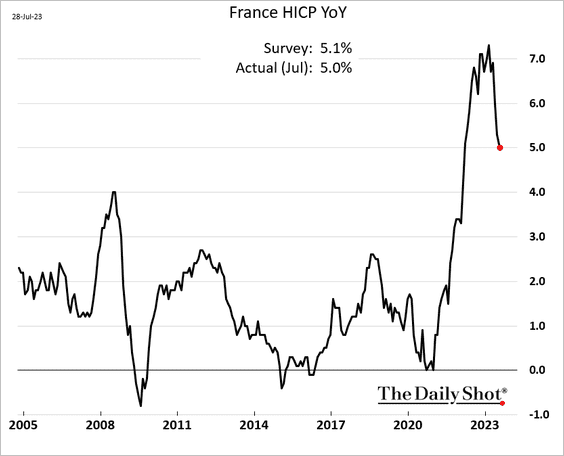
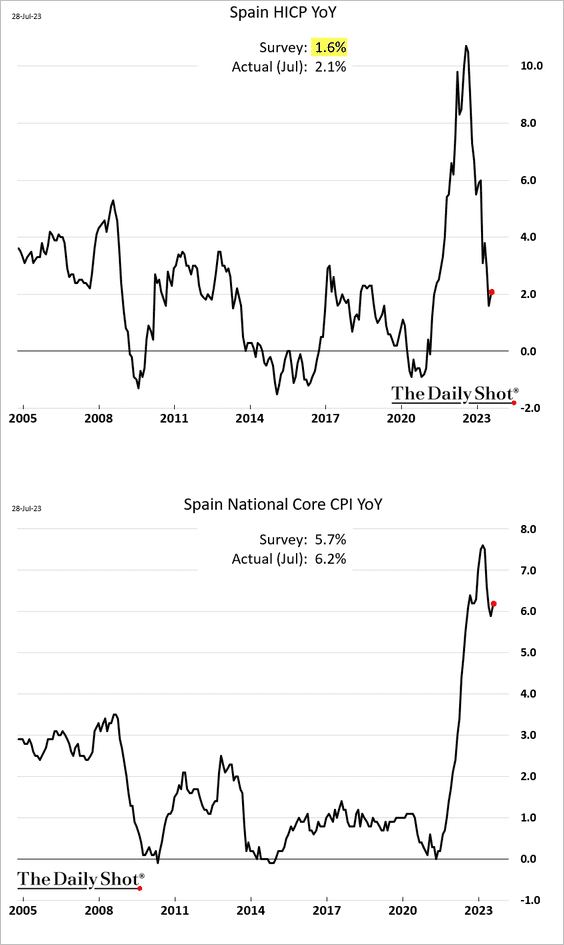
2. Next, let’s take a look at inflation reports.
• Germany (easing):
• France (easing):
• Spain (a rebound):
• Forecasters boosted their projections for euro-area core inflation.
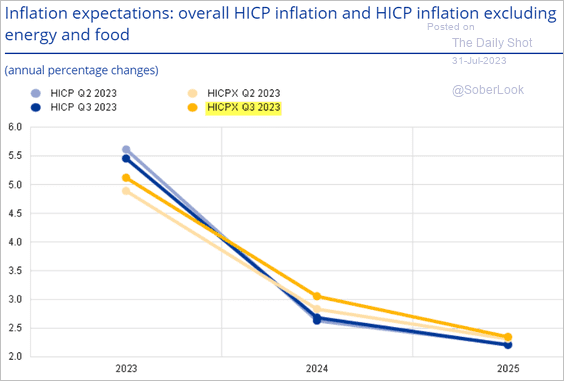 Source: ECB
——————–
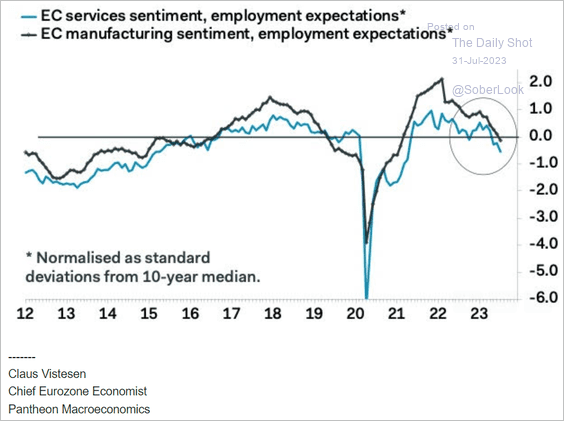
3. Sentiment among service companies held up well this month, topping expectations.
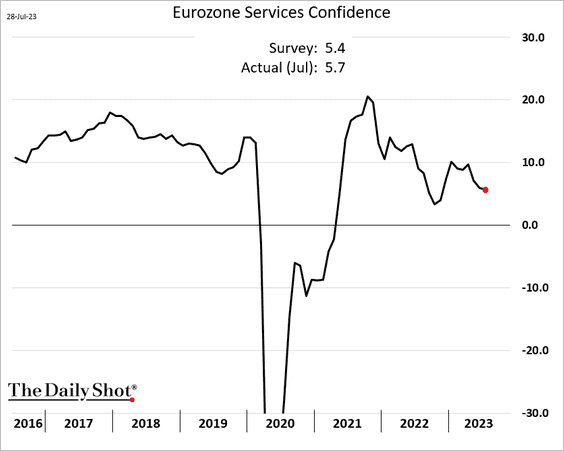
But manufacturing confidence is crashing.
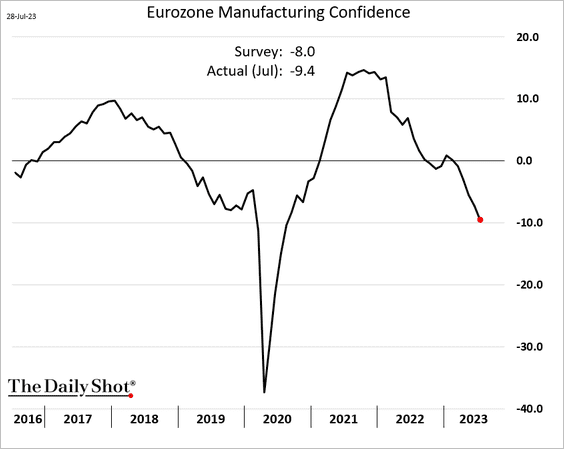
This chart shows the aggregate economic sentiment (business and consumer confidence).
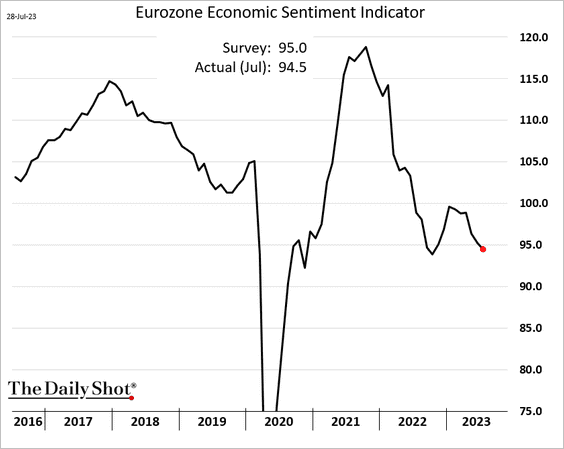
Employment expectations are deteriorating, according to Pantheon Macroeconomics.
 Source: Pantheon Macroeconomics
——————–
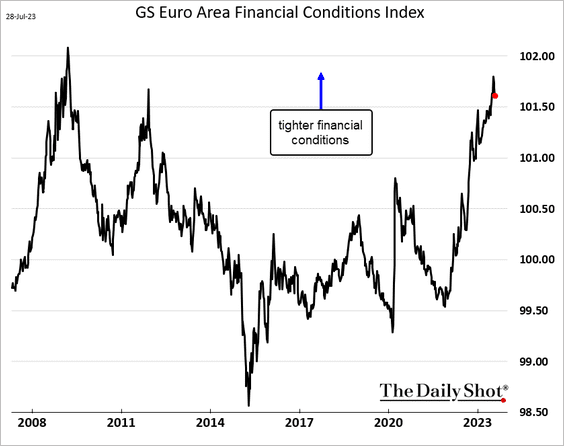
4. Euro-area financial conditions are near the tightest levels since the GFC.
Back to Index
Europe
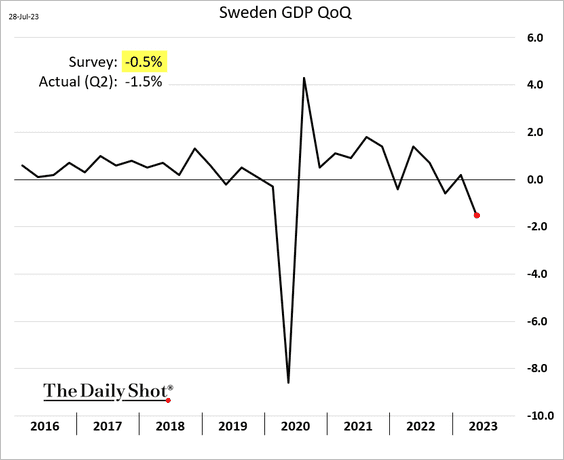
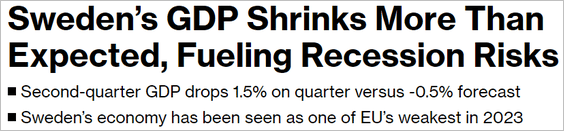
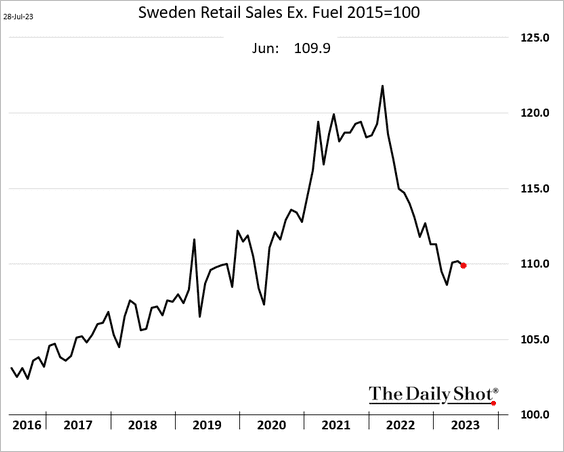
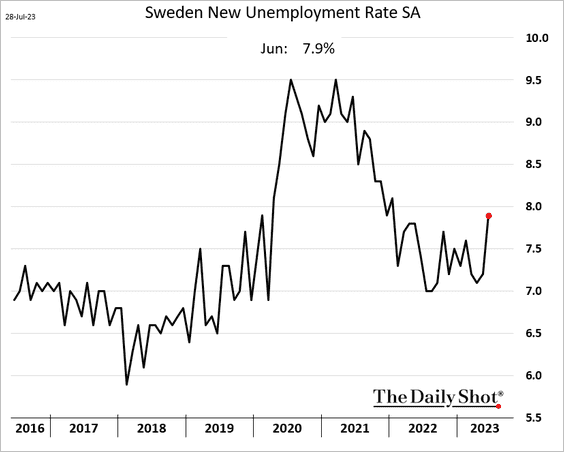
1. Let’s begin with Sweden.
• The economy contracted sharply last quarter.
 Source: @economics Read full article
• Retail sales edged lower in June.
• The unemployment rate jumped.
——————–
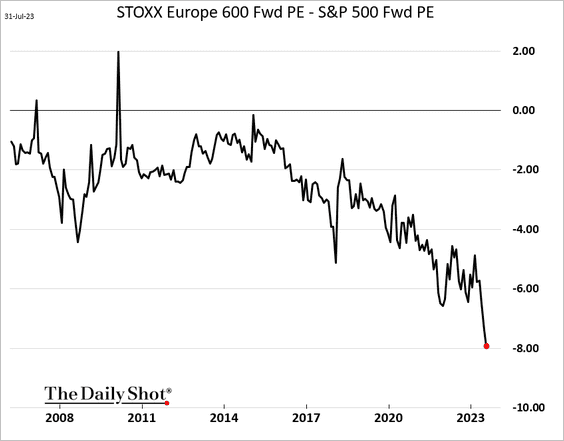
2. European companies are trading at a massive discount to US peers.
3. Here is a look at summer fruit production in the EU.
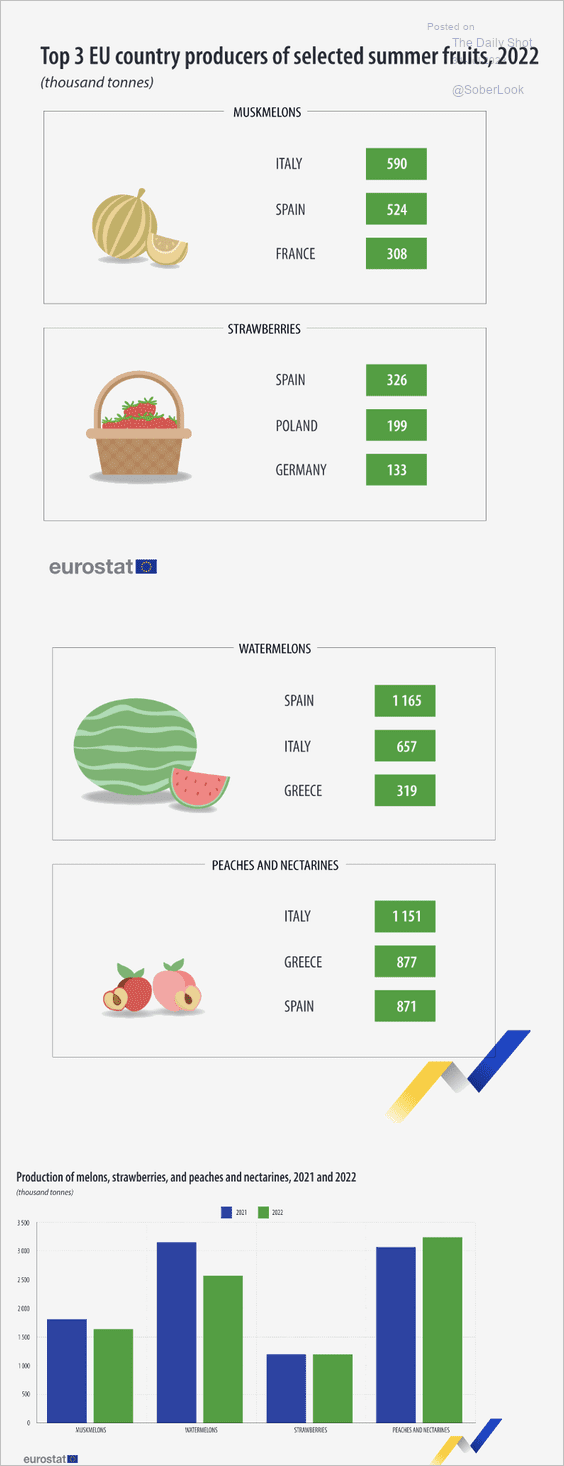 Source: Eurostat Read full article
Back to Index
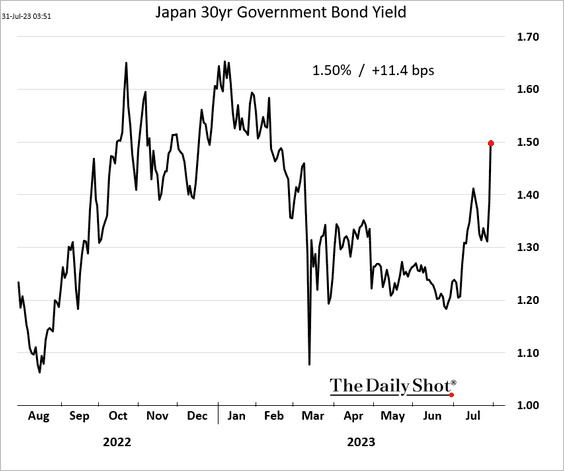
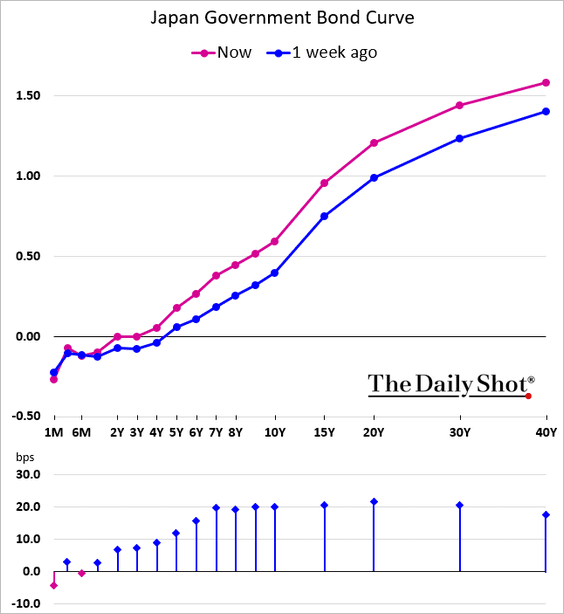
Japan
1. JGB yields surged to multi-year highs …
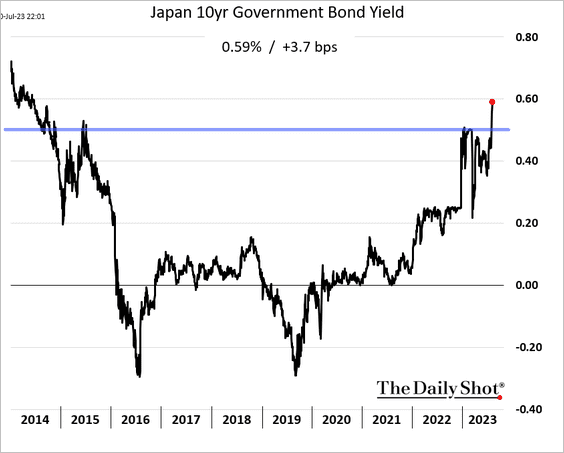
… as the BoJ adjusts the yield control policy.
 Source: Reuters Read full article
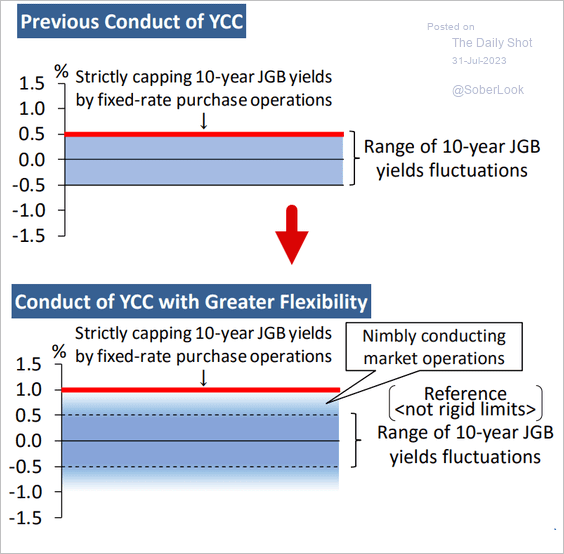 Source: BoJ
But the central bank stepped in to buy JGBs today to arrest the selloff.
 Source: forexlive Read full article
• Yields rose across the curve.
• The yen has been selling off.
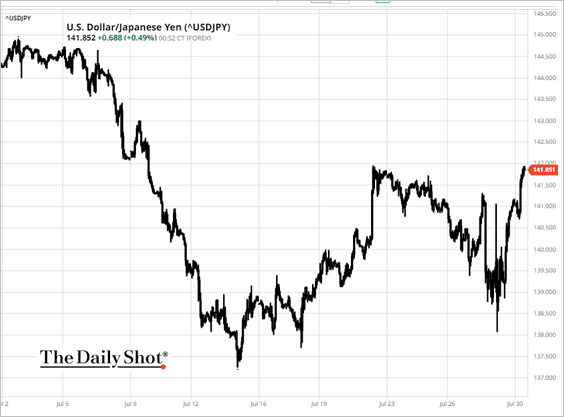 Source: barchart.com
——————–
2. Treasuries hedged into yen look extremely unattractive.
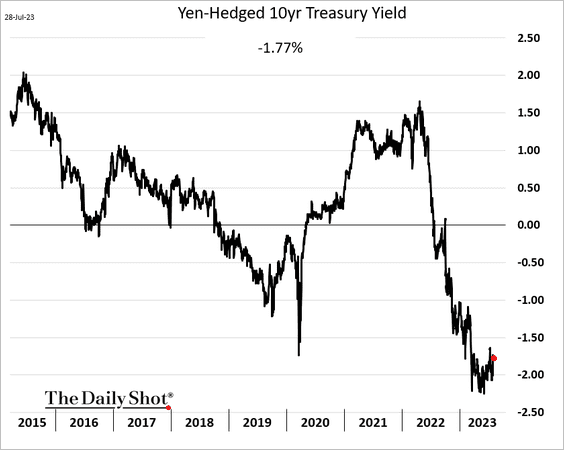
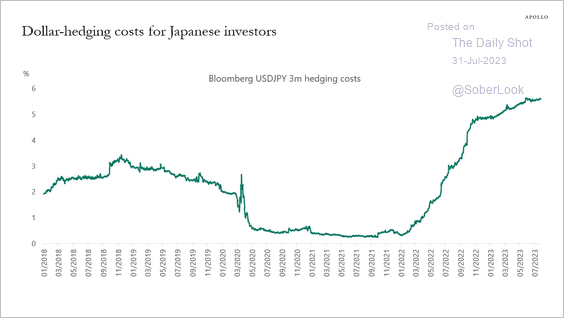 Source: Torsten Slok, Apollo
Back to Index
China
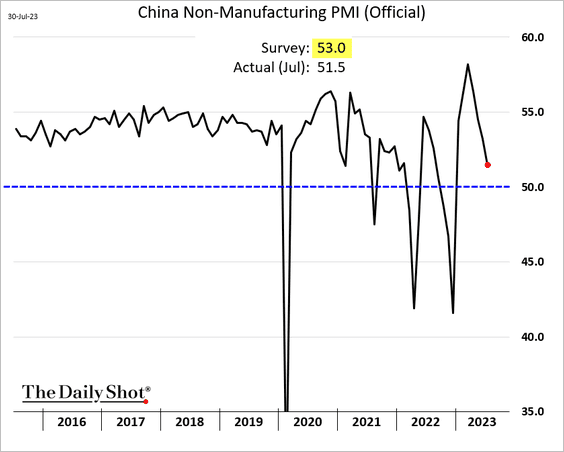
1. Manufacturing continues to contract, but at a slower pace, according to the official PMI report.
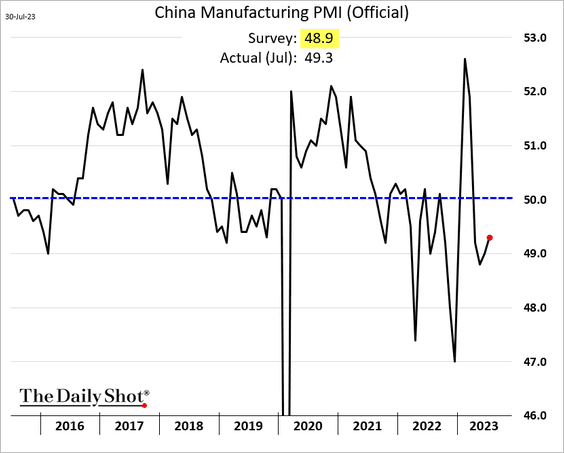
The expansion in services is slowing rapidly,
——————–
2. Chinese stocks remain unloved by US investors.
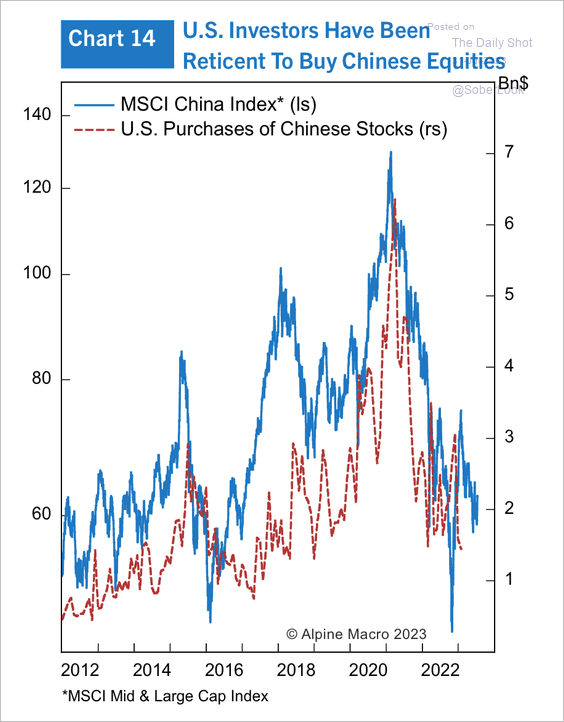 Source: Alpine Macro
Developed-market stocks with Chinese exposure have significantly outperformed Chinese equities in recent years.
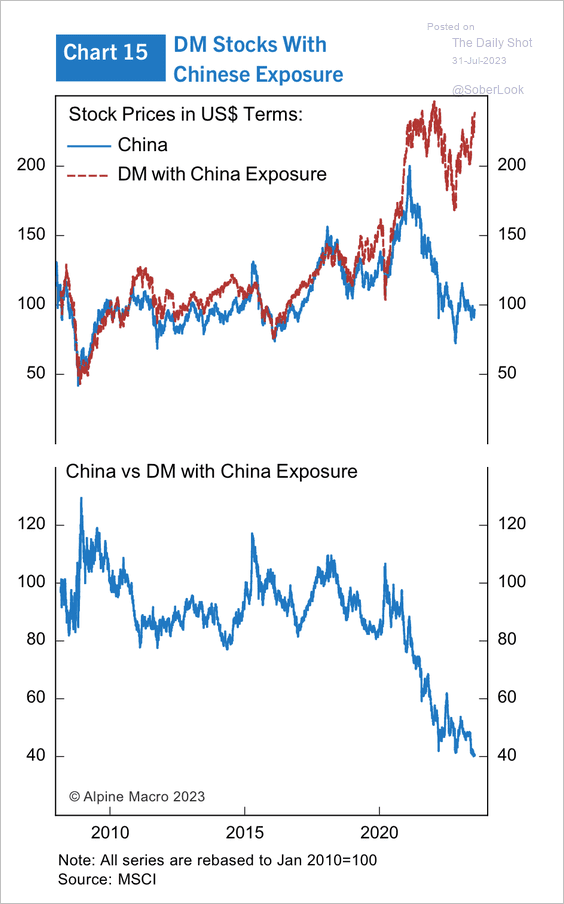 Source: Alpine Macro
——————–
3. Local governments have front-loaded bond issuance.
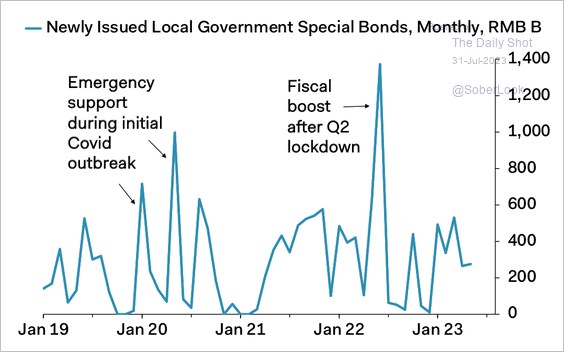 Source: Pantheon Macroeconomics
Back to Index
Emerging Markets
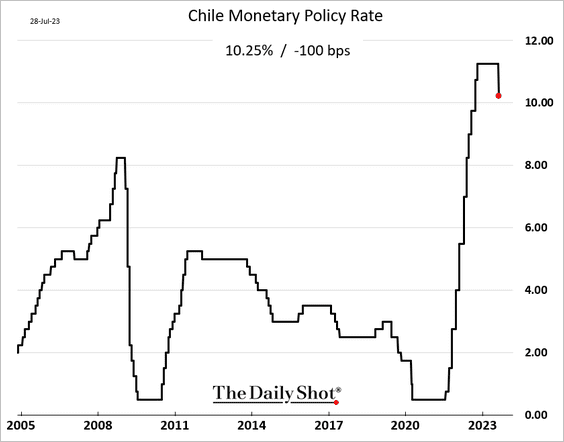
1. LatAm rate cuts have started, with Chile reducing rates by 100 bps (the market expected 75 bps).
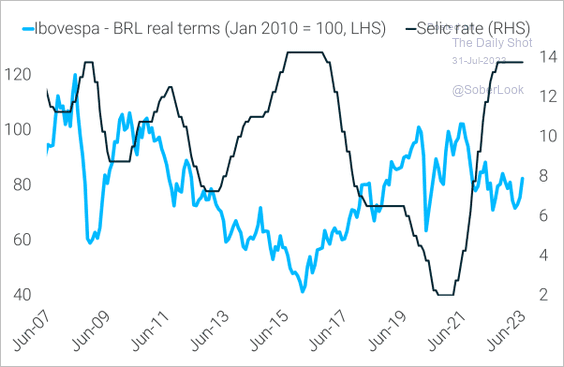
2. Brazil is next, which is a tailwind for stocks.
 Source: TS Lombard
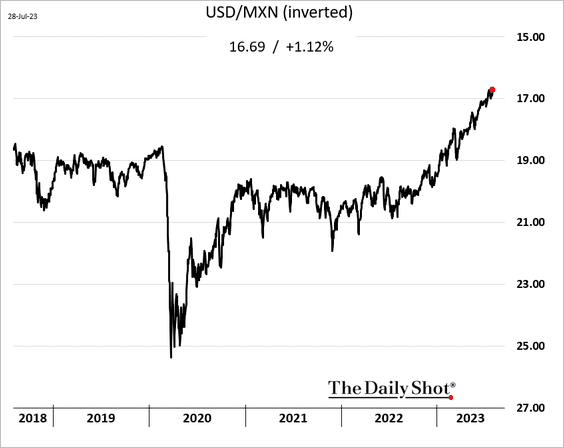
3. The Mexican peso continues to surge.
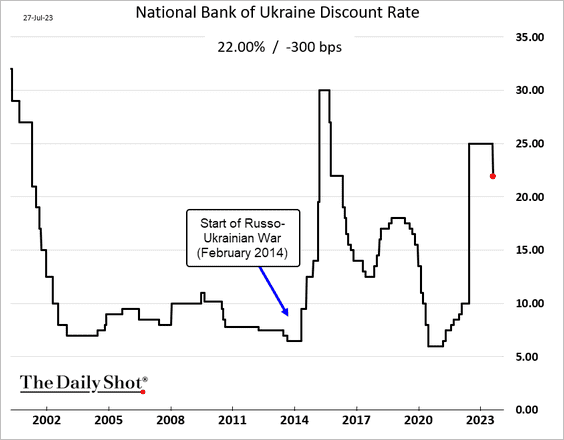
4. Ukraine’s central bank cut rates.
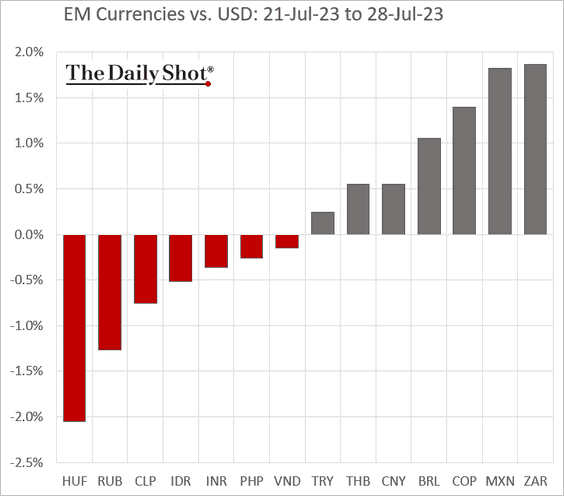
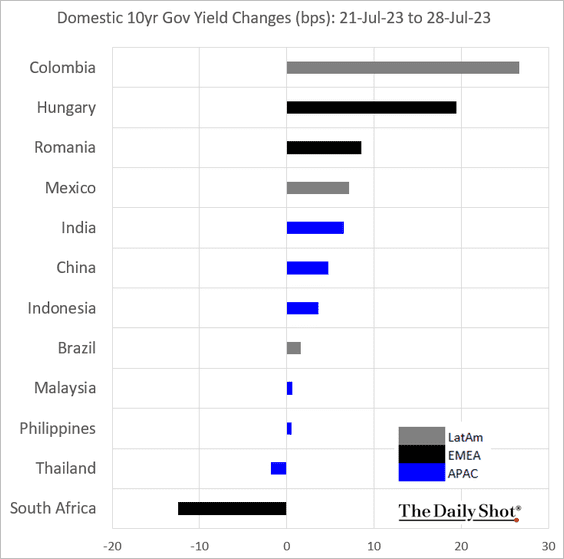
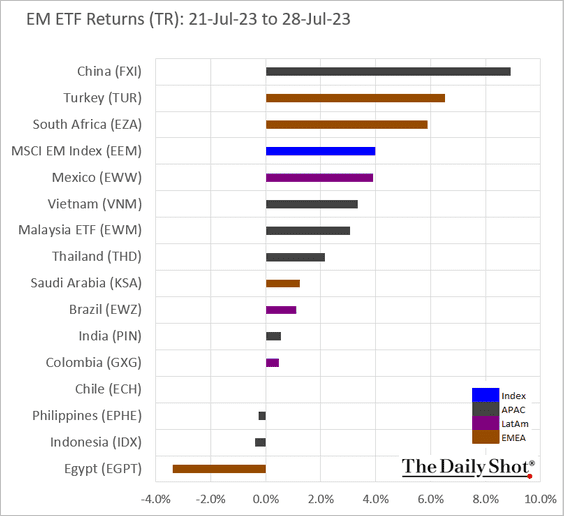
5. Next, we have some performance data from last week.
• Currencies:
• Bond yields:
• Equity ETFs:
Back to Index
Cryptocurrency
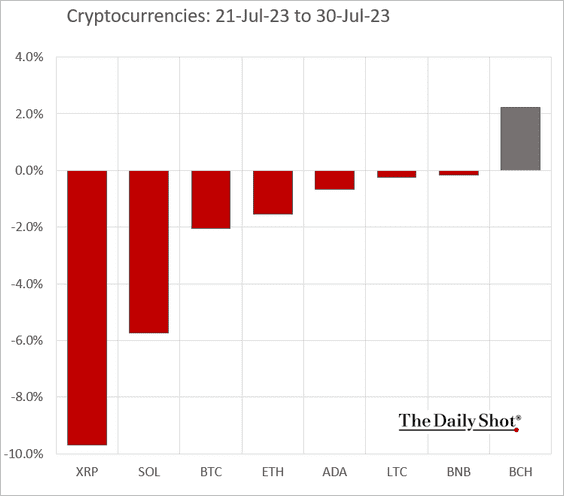
1. Let’s start with last week’s performance.
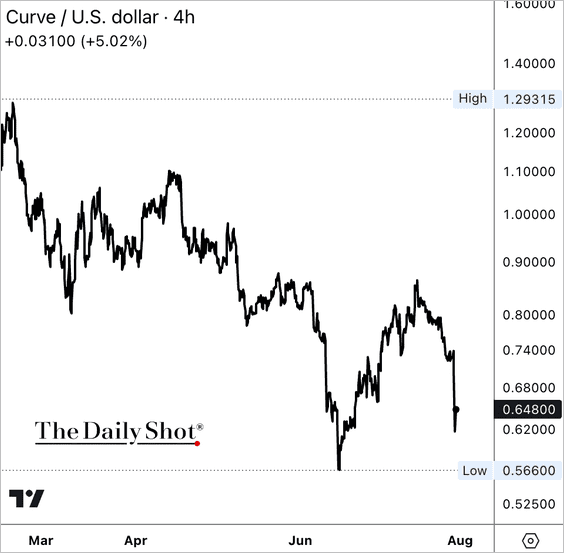
2. Curve Finance, a major stablecoin exchange, fell victim to an exploit.
 Source: CoinDesk Read full article
——————–
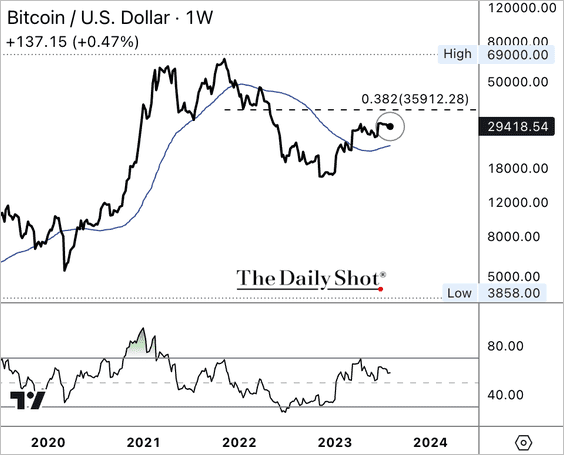
3. Bitcoin continues to stall below resistance.
Back to Index
Commodities
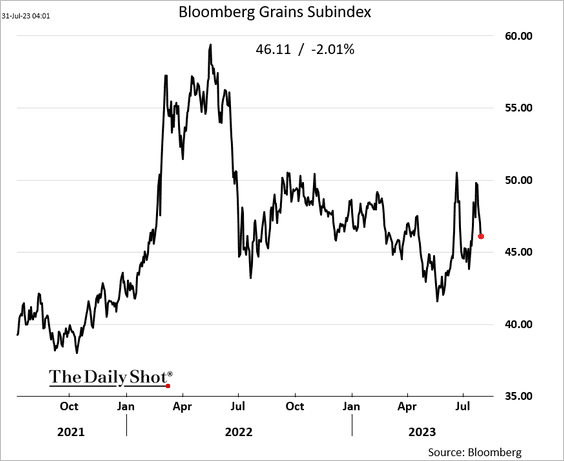
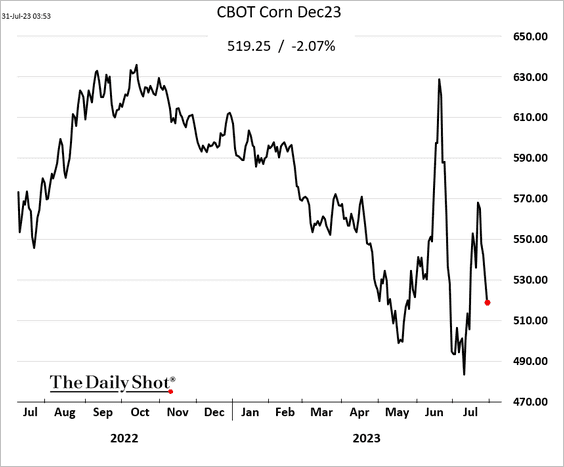
1. The recent bounce in grain prices is reversing.
——————–
2. Below is a look at lithium demand and miners’ CapEx.
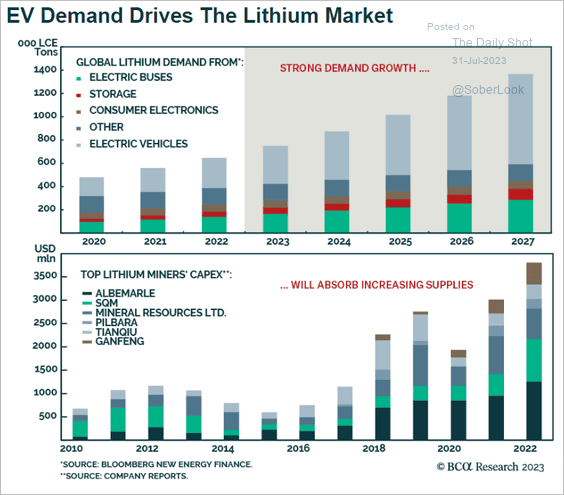 Source: BCA Research
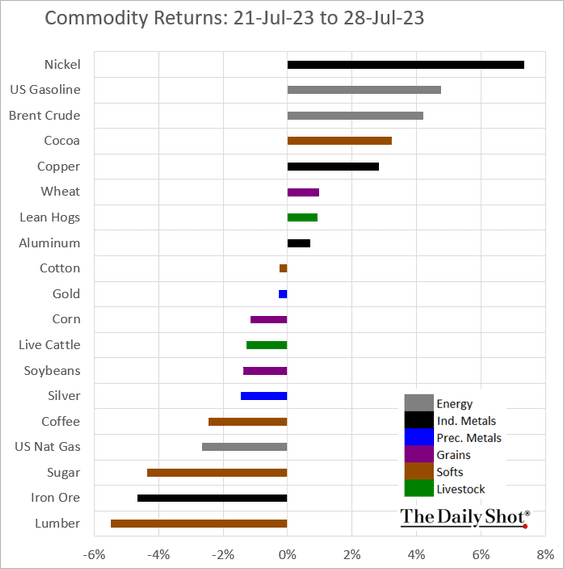
3. Here is last week’s performance across key commodity markets.
Back to Index
Equities
1. It has been a while since the S&P 500 experienced a 1%+ drop. According to SentimenTrader, this type of dynamic is almost exclusively witnessed during bull markets.
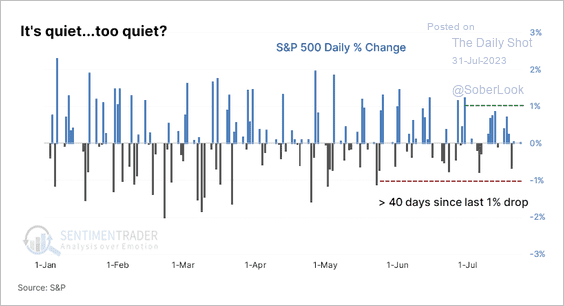 Source: SentimenTrader
Five consecutive up months for the S&P 500 are rare and typically bullish.
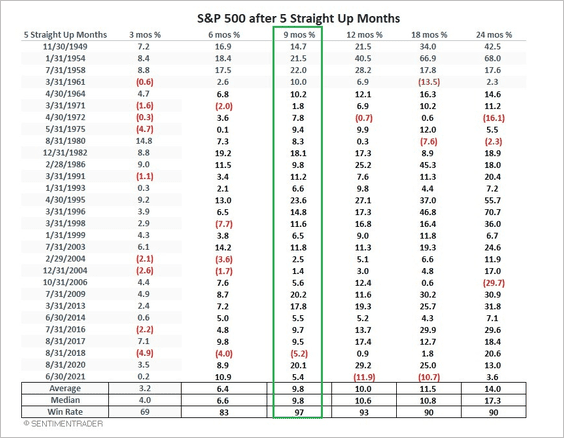 Source: SentimenTrader
——————–
2. This chart shows the deviation of the S&P 500 from its 200-day moving average
 Source: Yardeni Research
3. The S&P 500 is entering a seasonally weak period.
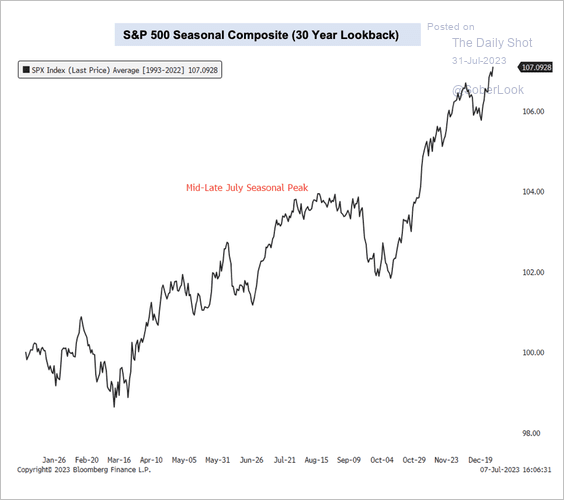 Source: Aazan Habib, Paradigm Capital
4. The underlying S&P 500 earnings hit a new high in Q2.
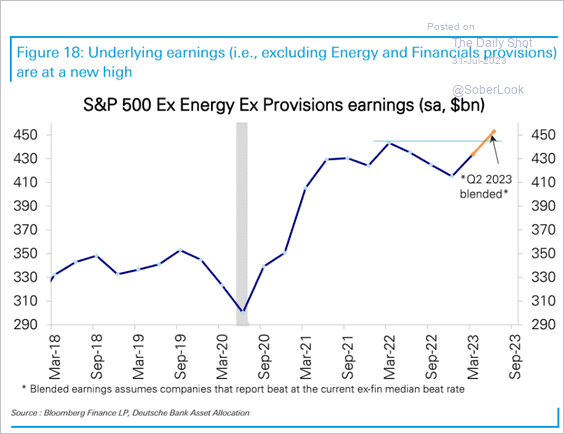 Source: Deutsche Bank Research
This chart shows the year-over-year EPS growth.
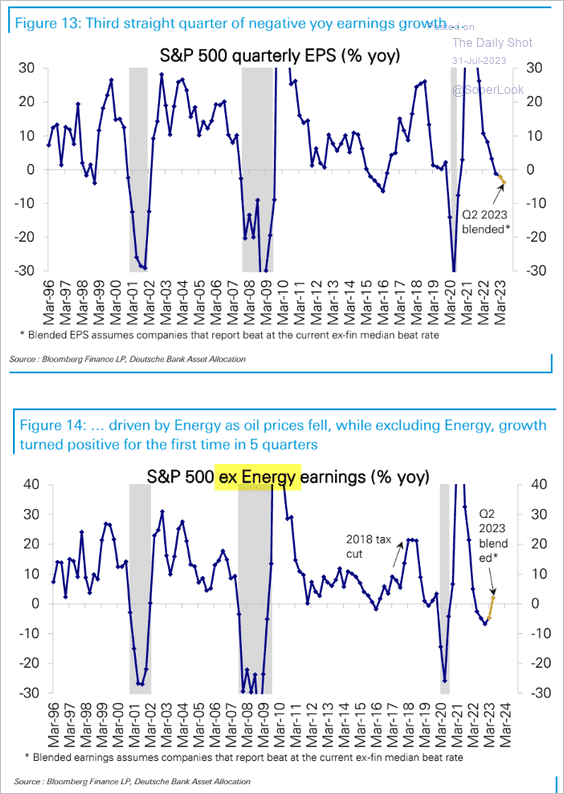 Source: Deutsche Bank Research
——————–
5. Fund flows remain robust.
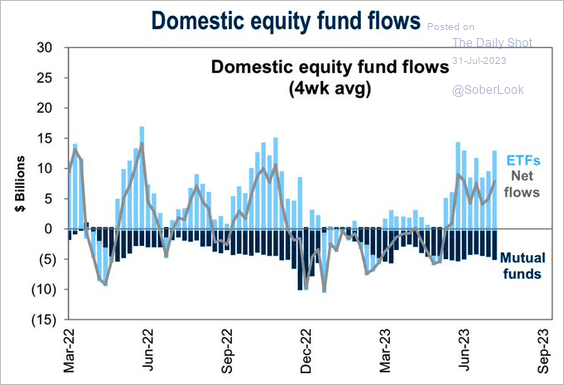 Source: Goldman Sachs; @WallStJesus
6. Hedge funds have been buying tech.
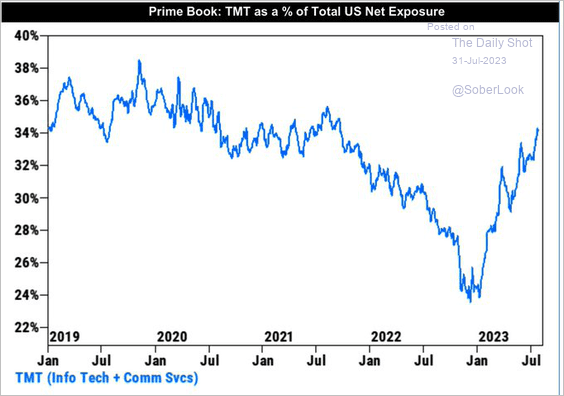 Source: Goldman Sachs; @WallStJesus
7. Demand for call options remains elevated.
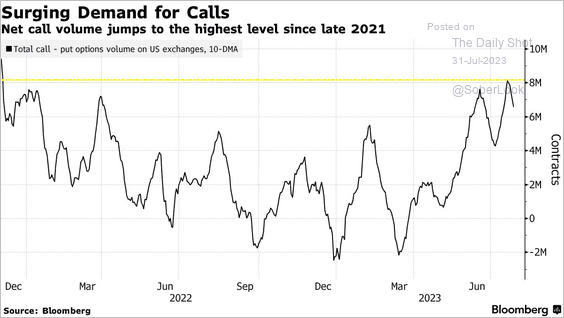 Source: @markets Read full article
Put options are very cheap.
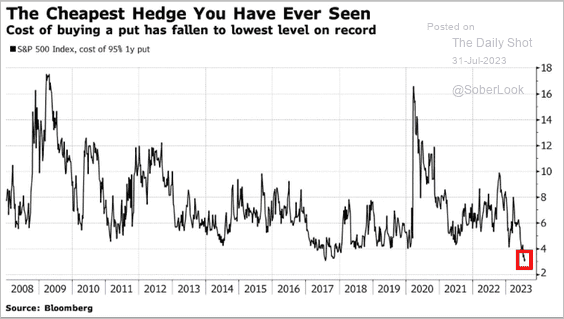 Source: Francois Trahan
——————–
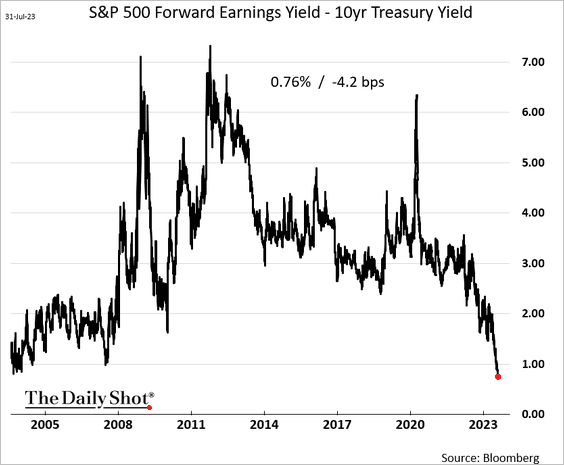
8. The S&P 500 equity risk premium continues to collapse.
9. Insiders are very bearish.
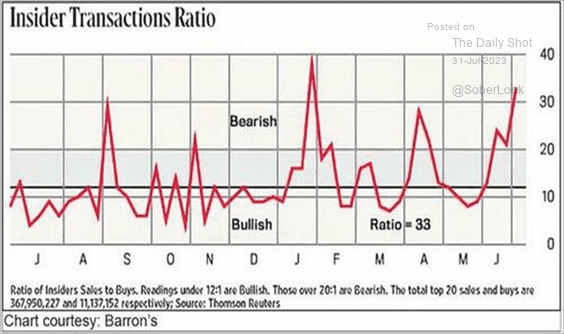 Source: Barron’s
10. Retail investors have reduced their share purchases, …
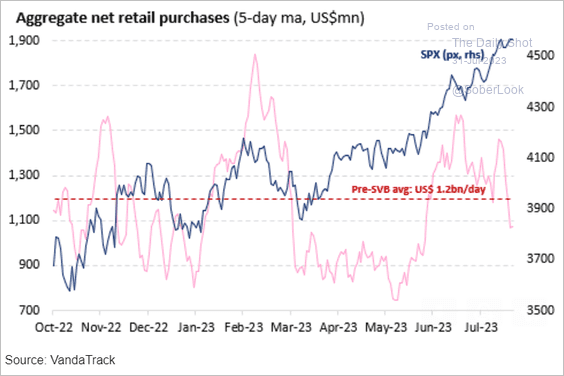 Source: Vanda Research
… which typically happens in July.
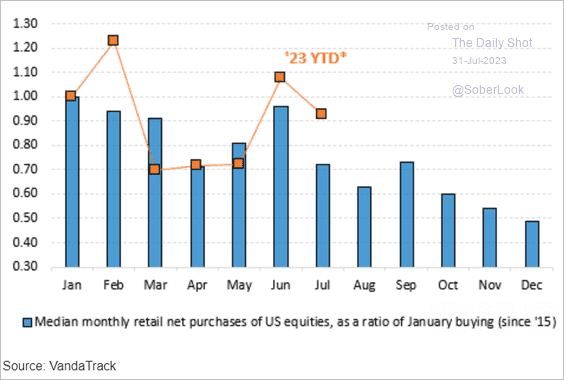 Source: Vanda Research
——————–
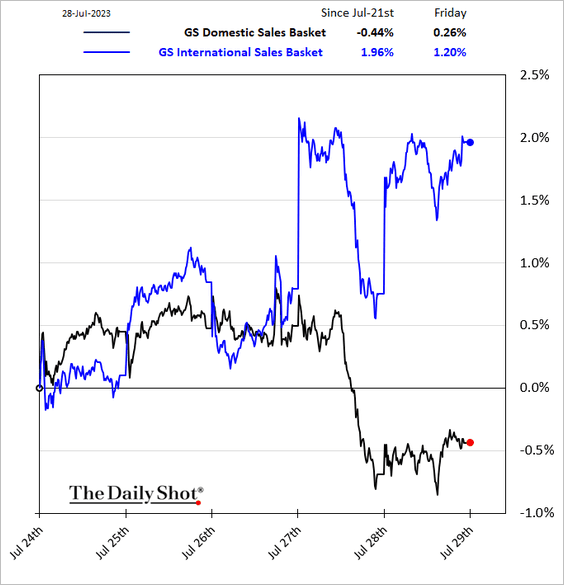
11. Here is the impact of currency fluctuations on international stock returns for US investors (year-to-date).
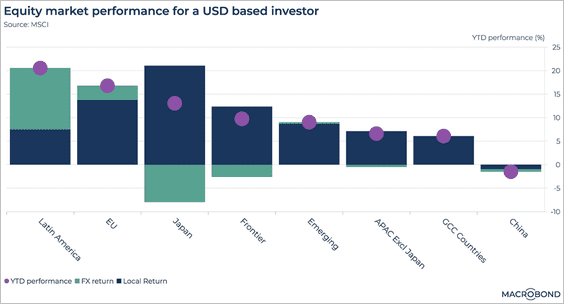 Source: Macrobond
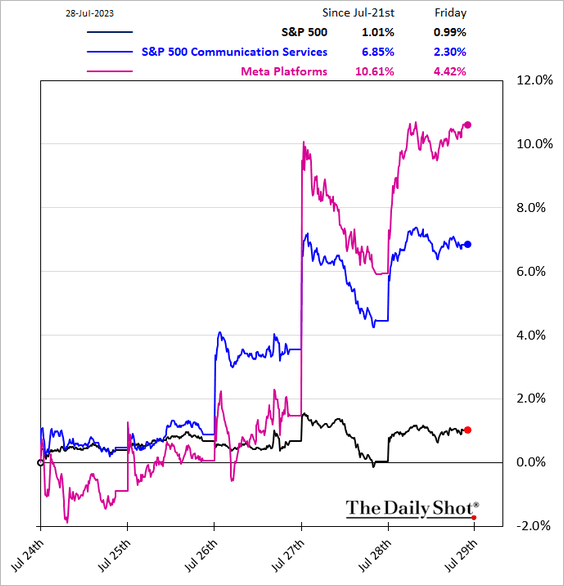
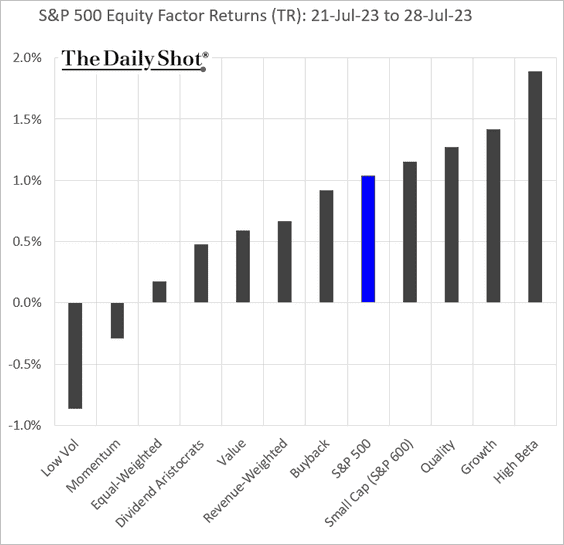
12. Next, we have some performance data from last week.
• Sectors:
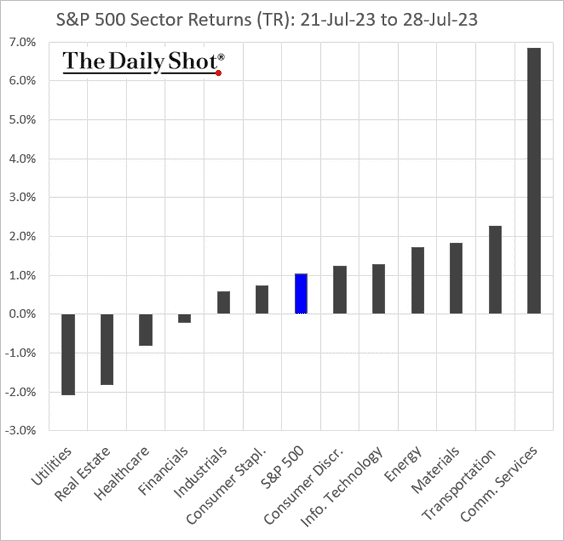
– Communication Services:
• Equity factors:
• Macro baskets’ relative performance:
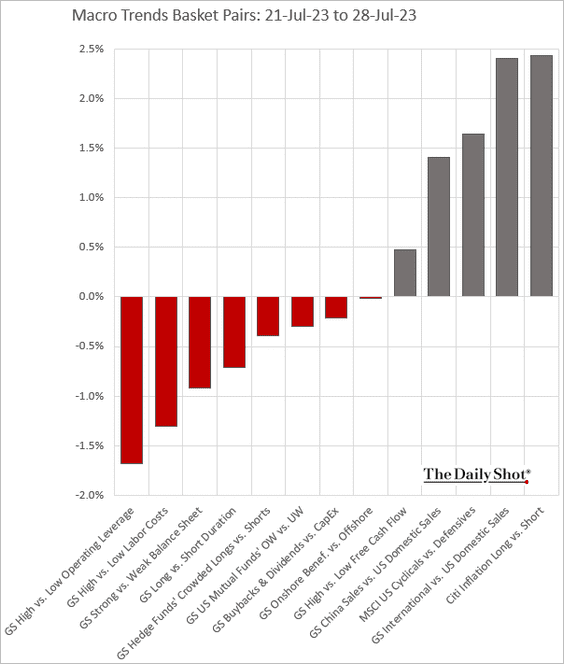
– Companies with significant international sales outperformed last week.
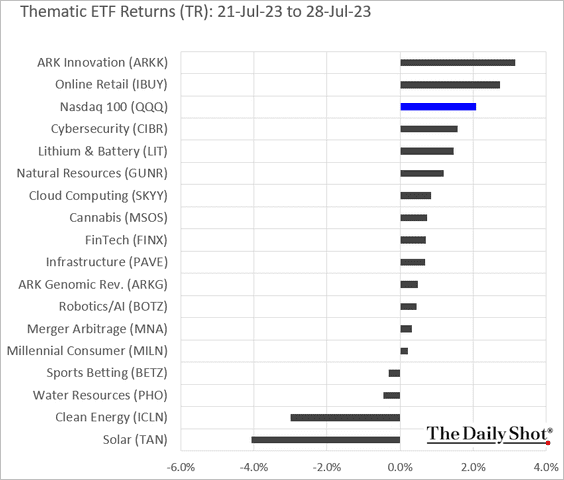
• Thematic ETFs:
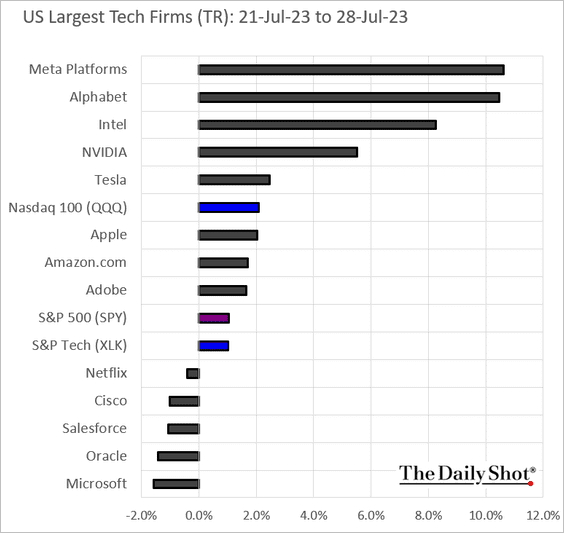
• Largest US tech firms:
Back to Index
Credit
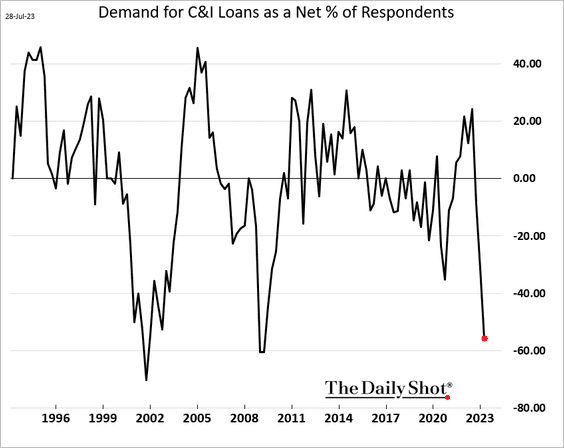
1. US business loan demand is crashing.
 Further reading
2. Short interest in HY ETFs has risen sharply.
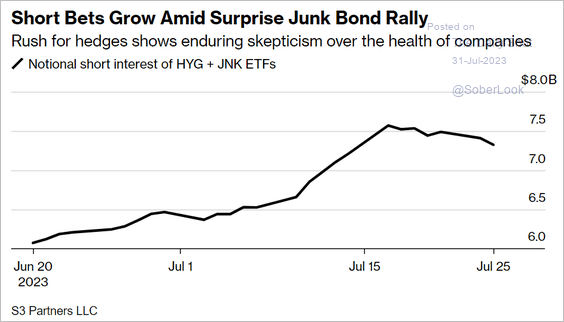 Source: @markets Read full article
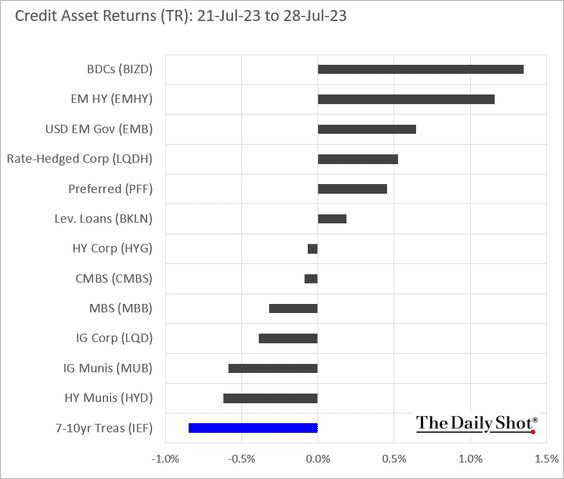
3. Here is last week’s performance across credit asset classes.
Back to Index
Global Developments
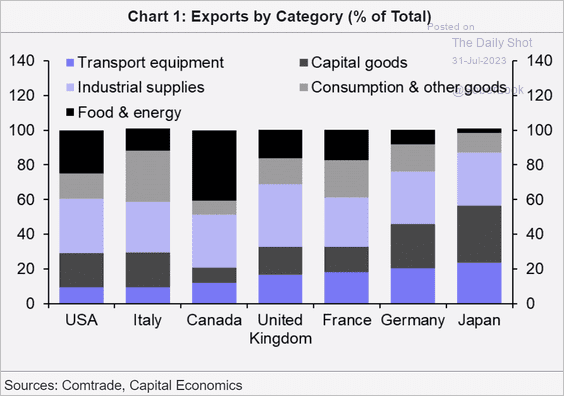
1. This chart shows the composition of exports in select economies.
 Source: Capital Economics
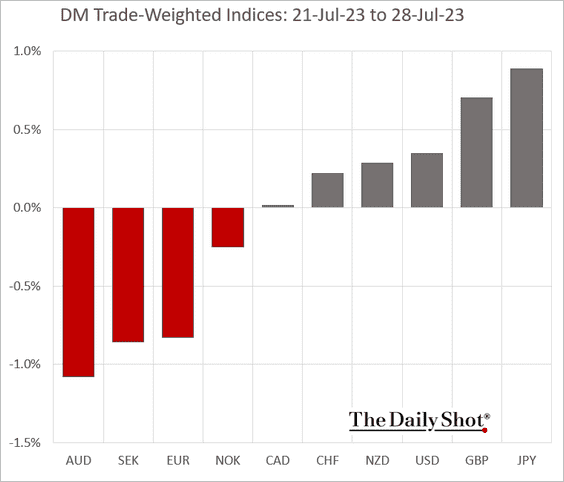
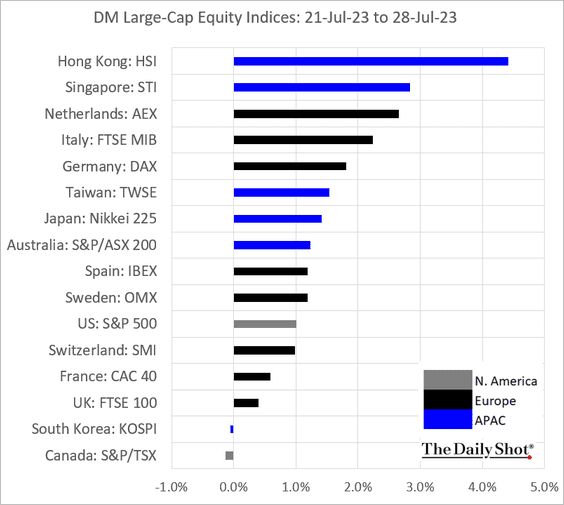
2. Here is a look at last week’s performance data for advanced economies.
• Currencies:
• Bond yields:
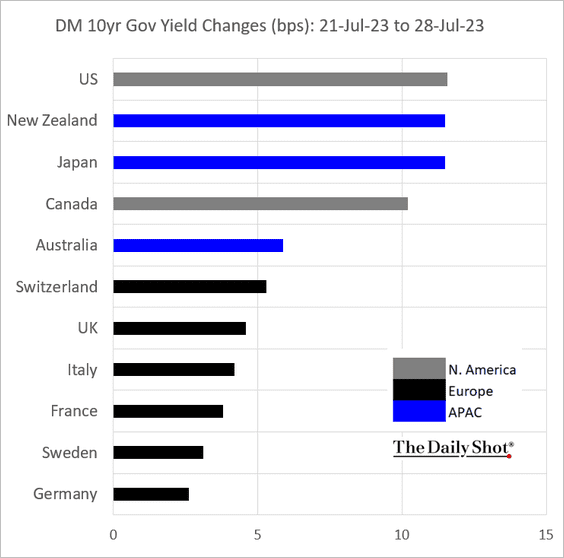
• Equities:
——————–
Food for Thought
1. US trust funds are headed toward insolvency:
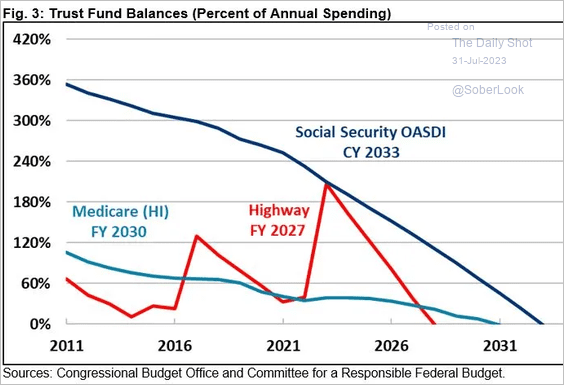 Source: Committee for a Responsible Federal Budget
2. Low-income consumers using food stamps:
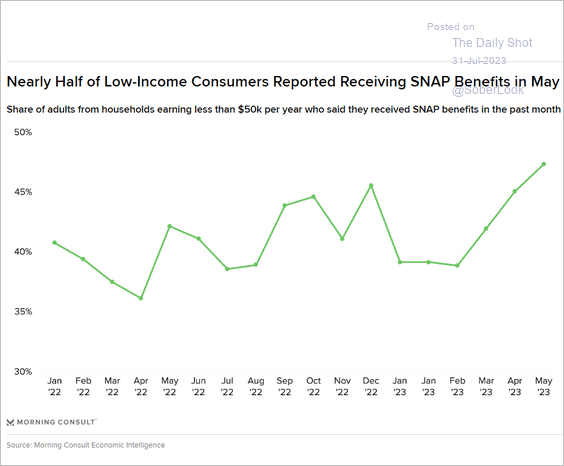 Source: Morning Consult Read full article
3. Share of global manufacturing output:
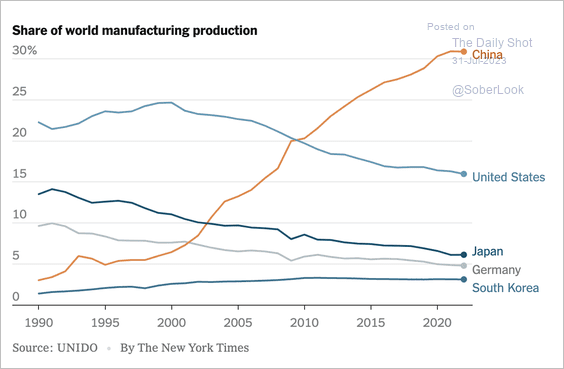 Source: The New York Times Read full article
4. China’s vehicle imports and exports:
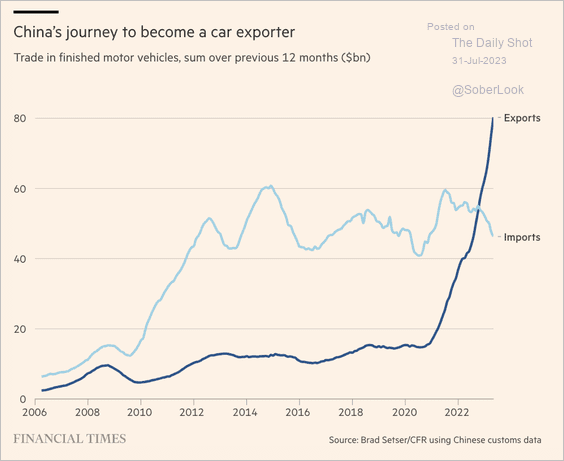 Source: @financialtimes Read full article
5. Percentage of women tested for various diseases:
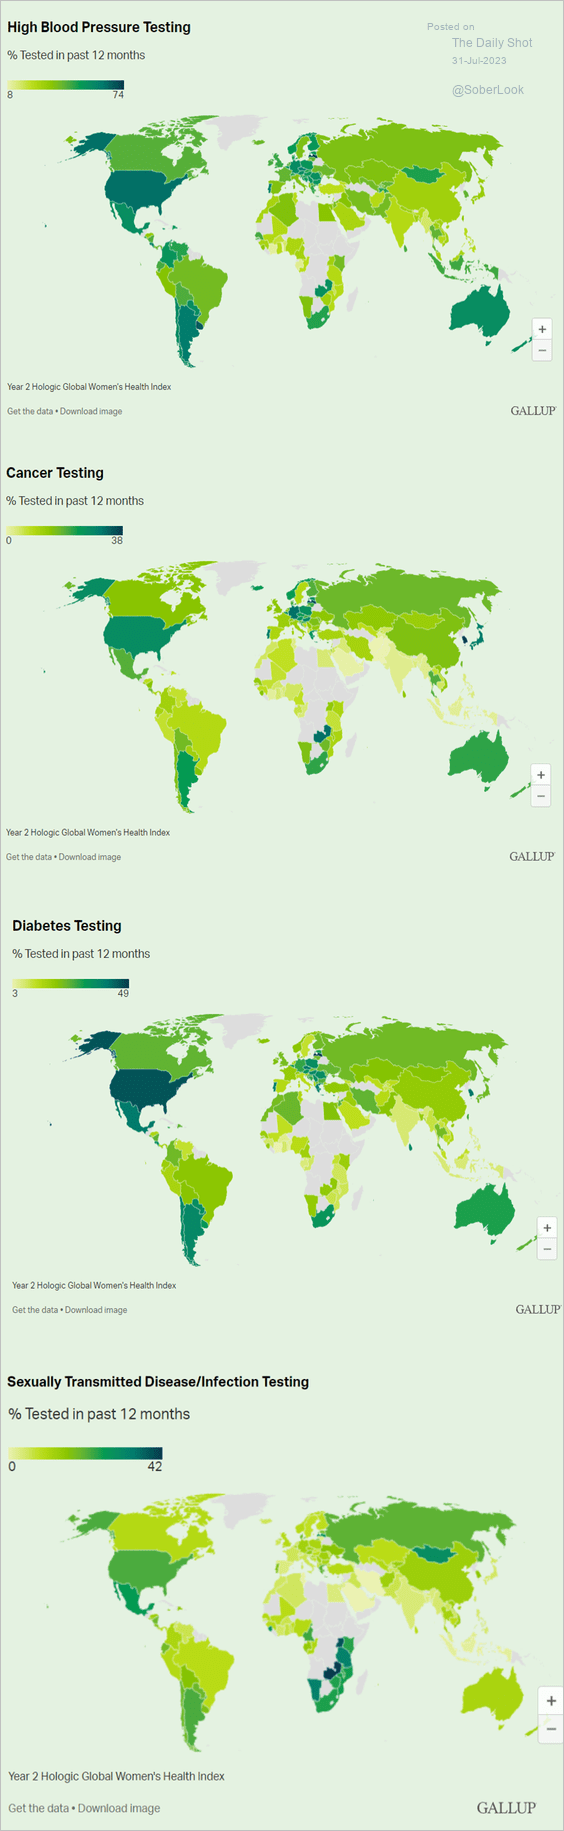 Source: Gallup Read full article
6. Survival rates by cancer staging:
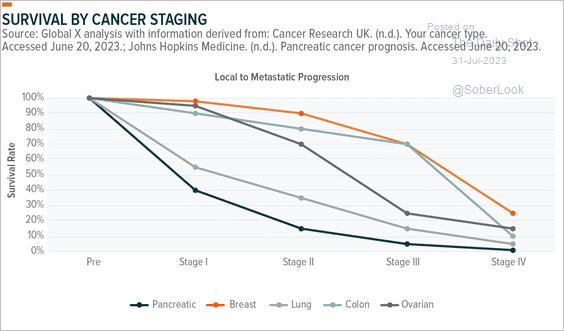 Source: Global X ETFs Read full article
7. Intensity of extreme rainfall:
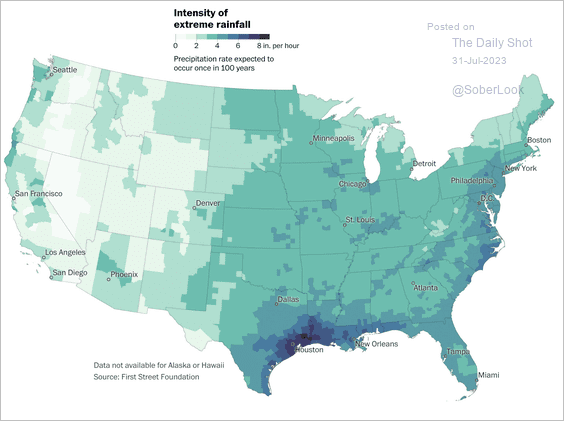 Source: The Washington Post Read full article
8. Most common baby names over time:
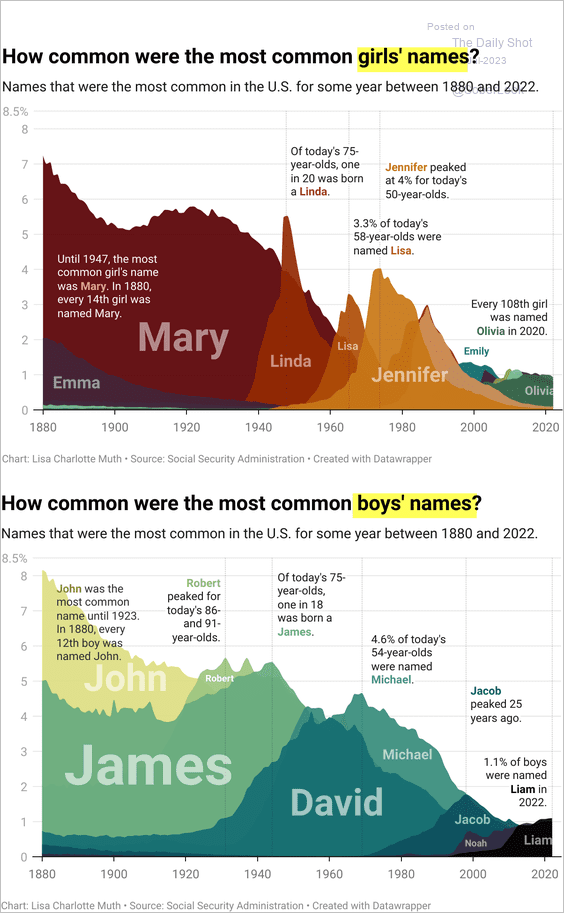 Source: @Datawrapper
——————–
Back to Index