
The Daily Shot: 01-Aug-23
• The United States
• The United Kingdom
• The Eurozone
• Japan
• Asia-Pacific
• China
• Emerging Markets
• Cryptocurrency
• Commodities
• Energy
• Equities
• Credit
• Rates
• Global Developments
• Food for Thought
The United States
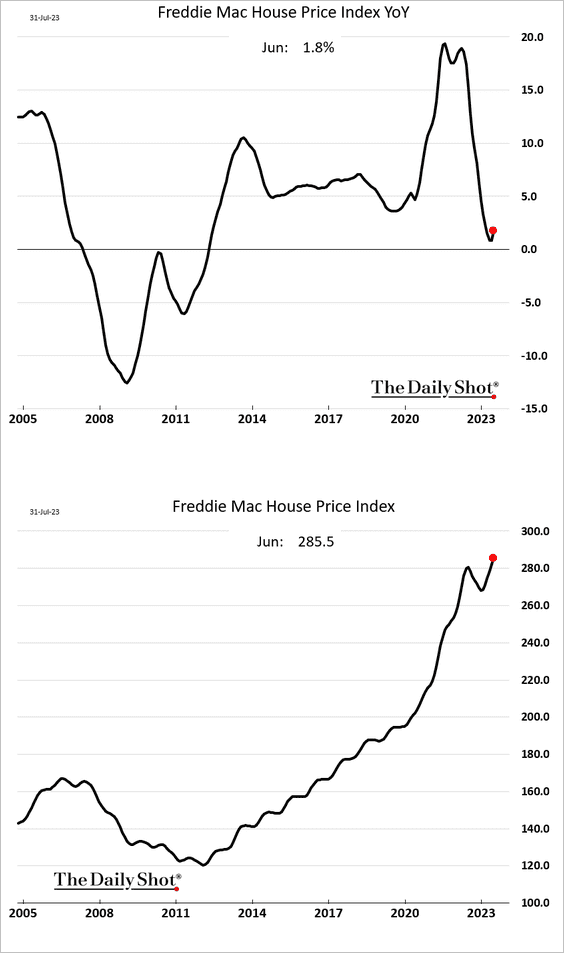
1. Let’s begin with the housing market.
• Freddie Mac’s house price index was up in June on a year-over-year basis. Note that the index didn’t cross the zero mark in this cycle.
• The median sale price is now above last year’s level, …
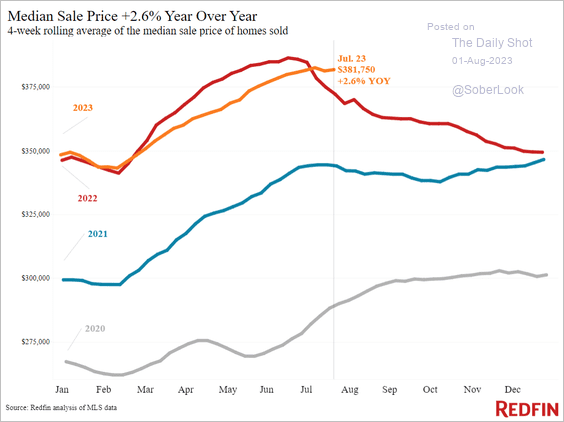 Source: Redfin
… as inventories tighten.
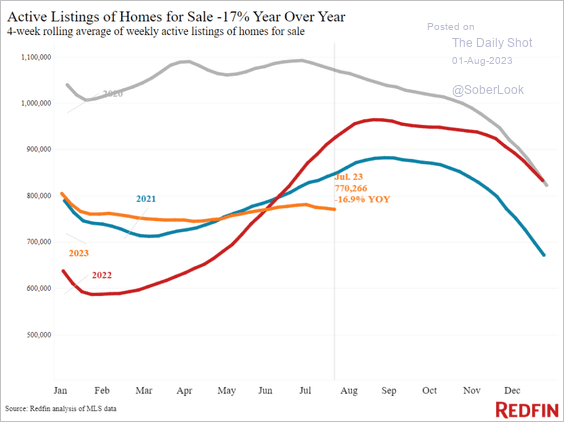 Source: Redfin
• Inventories are expected to improve when mortgage rates move lower (as more sellers enter the market).
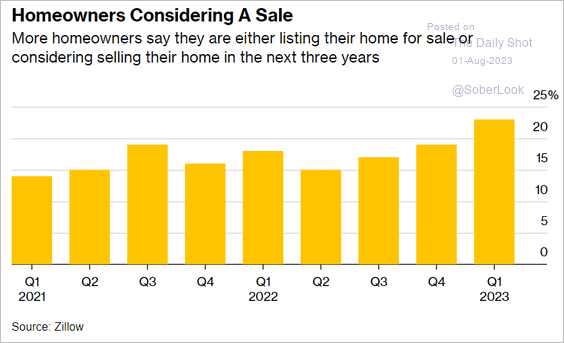 Source: @economics Read full article
• Mortgage delinquencies remain low.
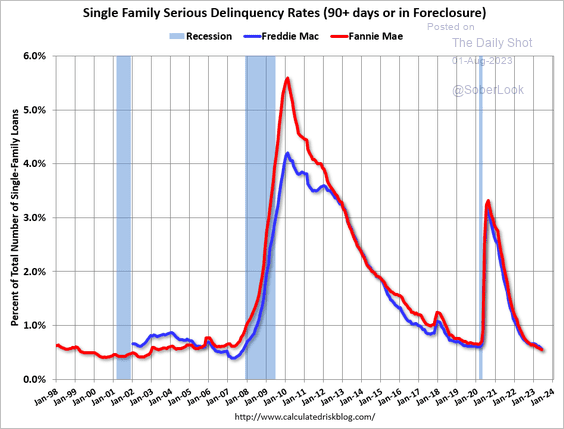 Source: Calculated Risk
——————–
2. The Apartment List rental index is now down on a year-over-year basis.
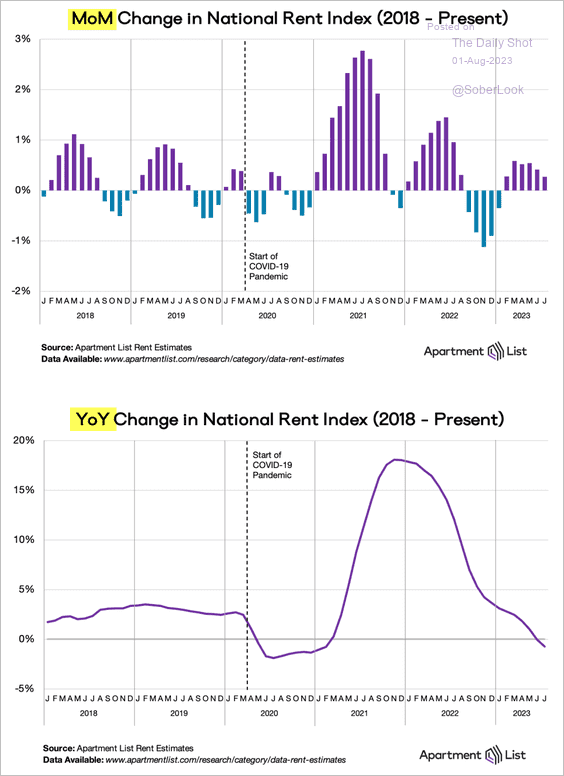 Source: Apartment List
This chart shows the percentage of metro areas with negative rent growth.
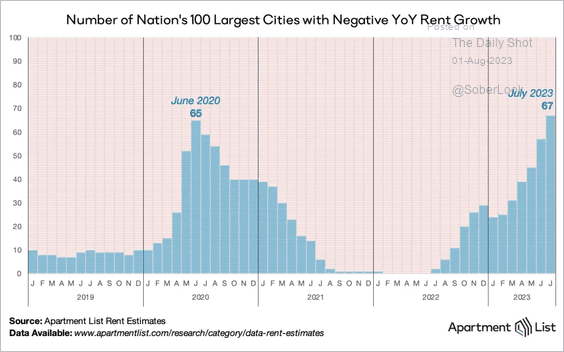 Source: Apartment List
Vacancies are rising.
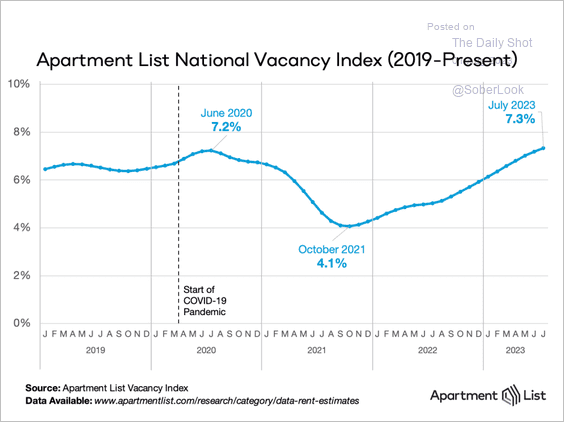 Source: Apartment List
——————–
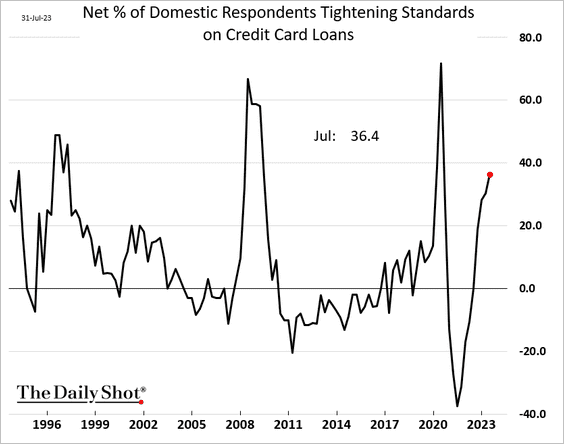
3. Banks continue to tighten lending standards on credit cards.
4. Slowing individual income tax receipts point to a looser labor market.
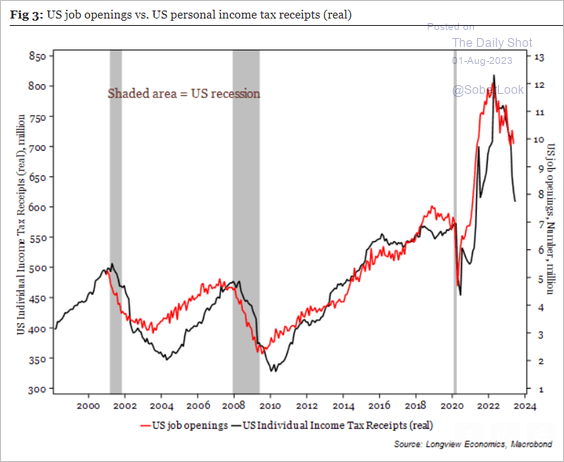 Source: Longview Economics
• The age-adjusted labor force participation is nearing peak levels.
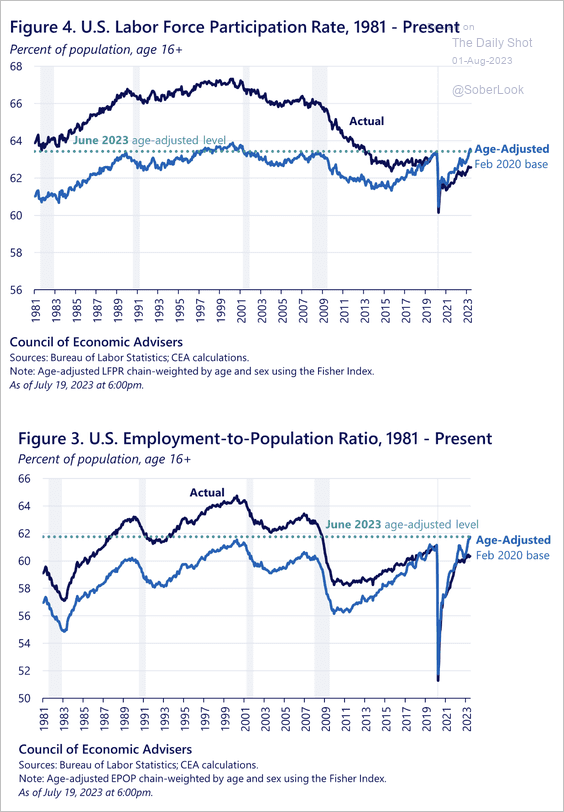 Source: The White House Read full article
——————–
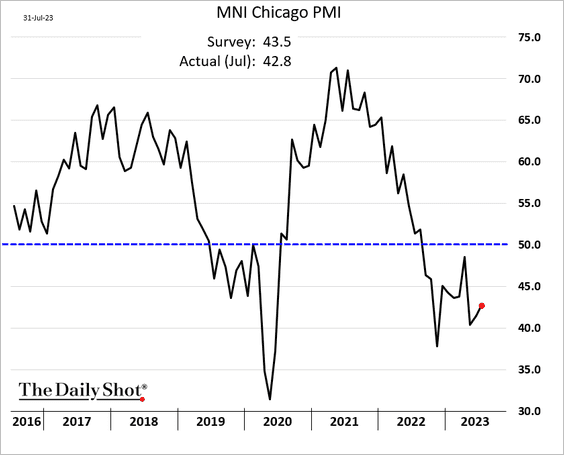
5. The Chicago PMI remains in contraction territory.
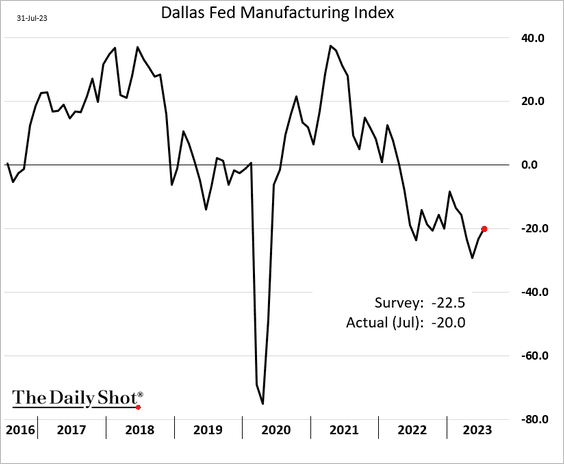
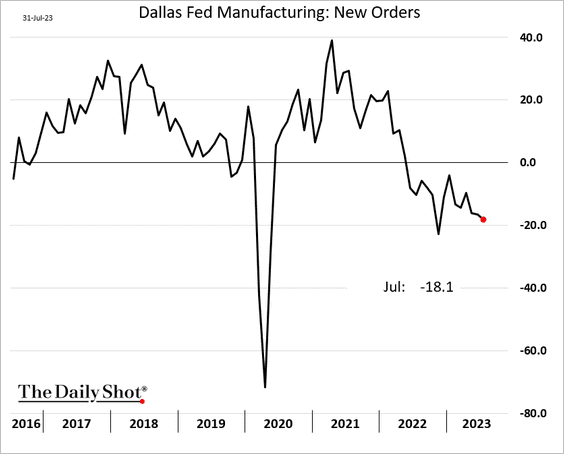
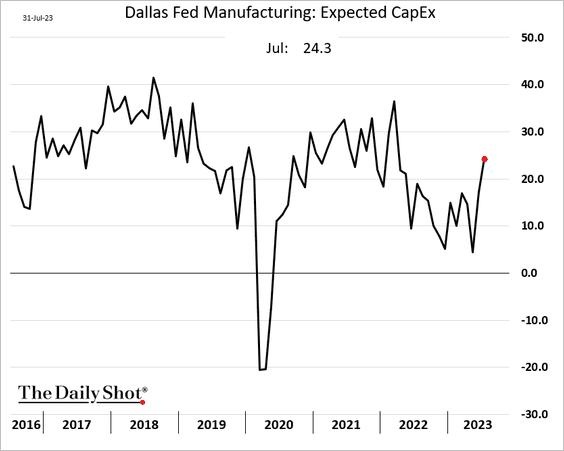
6. The Texas-area regional factory activity is still depressed as demand deteriorates.
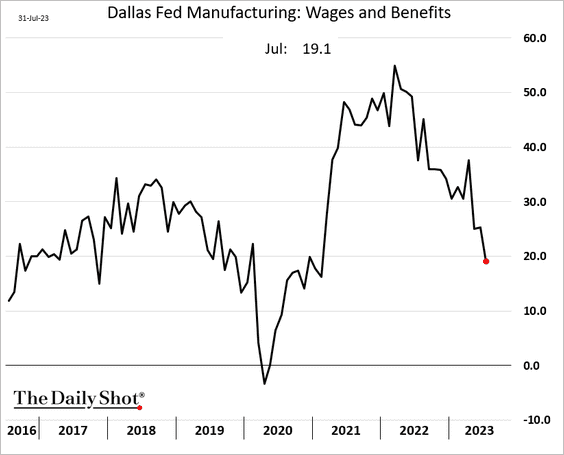
• Wage increases are slowing.
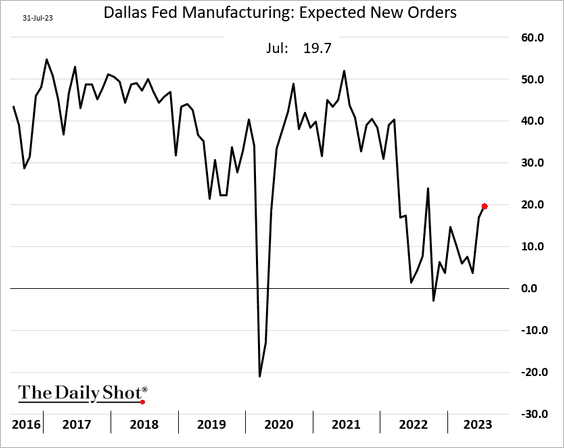
• Forward-looking indicators improved further in July.
– Expected orders:
– CapEx plans:
——————–
7. Fed rate hikes have yet to kick in. The Fed-sensitive (cyclical) CPI component is still near the highs.
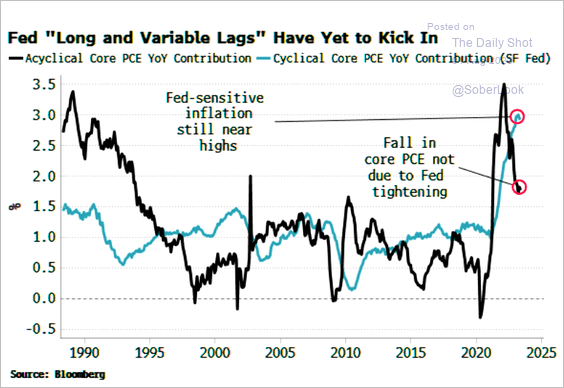 Source: Simon White, Bloomberg Markets Live Blog
Back to Index
The United Kingdom
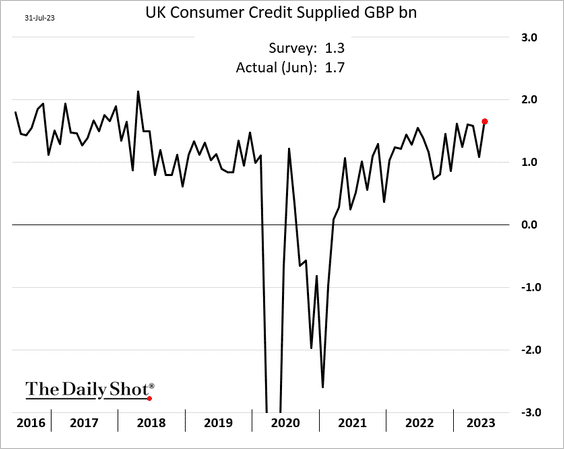
1. Consumer credit strengthened in June.
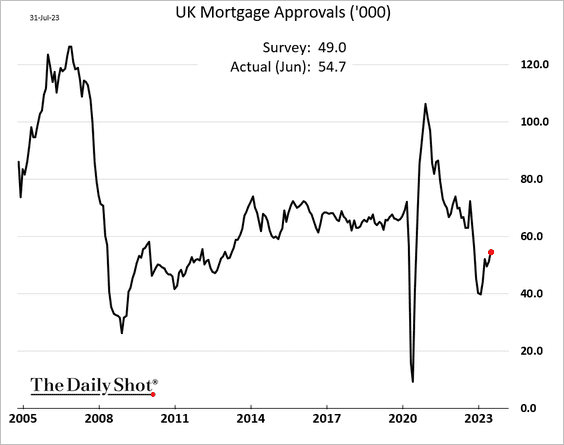
And mortgage approvals topped expectations.
——————–
2. Overnight retail deposits are now down on a year-over-year basis, …
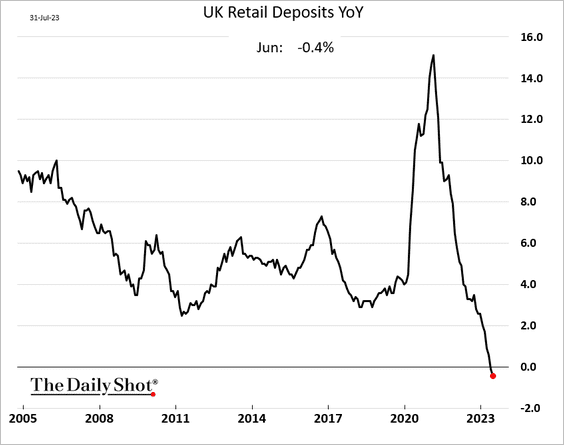
… with some households shifting to time deposits which offer higher rates.
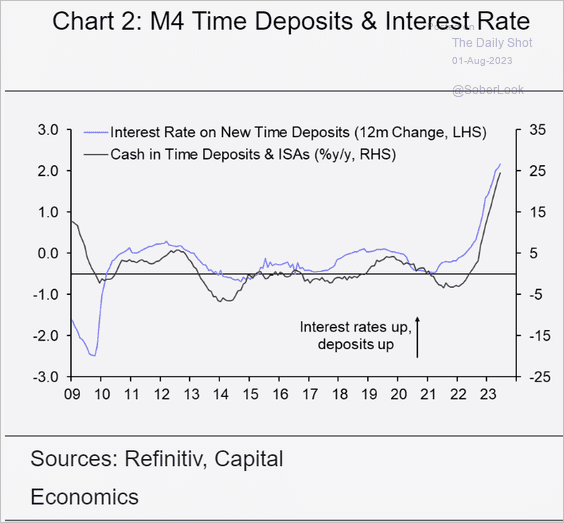 Source: Capital Economics
3. In real terms, excess savings have been drawn down.
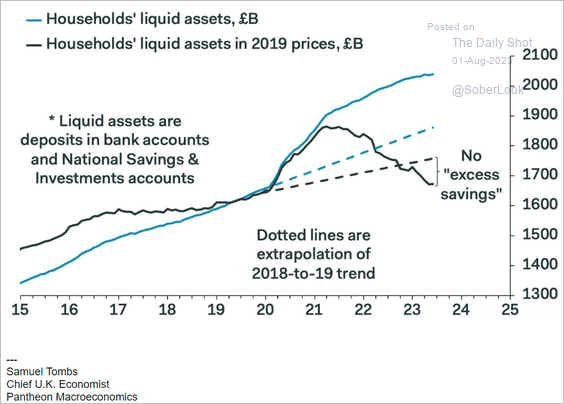 Source: Pantheon Macroeconomics
Back to Index
The Eurozone
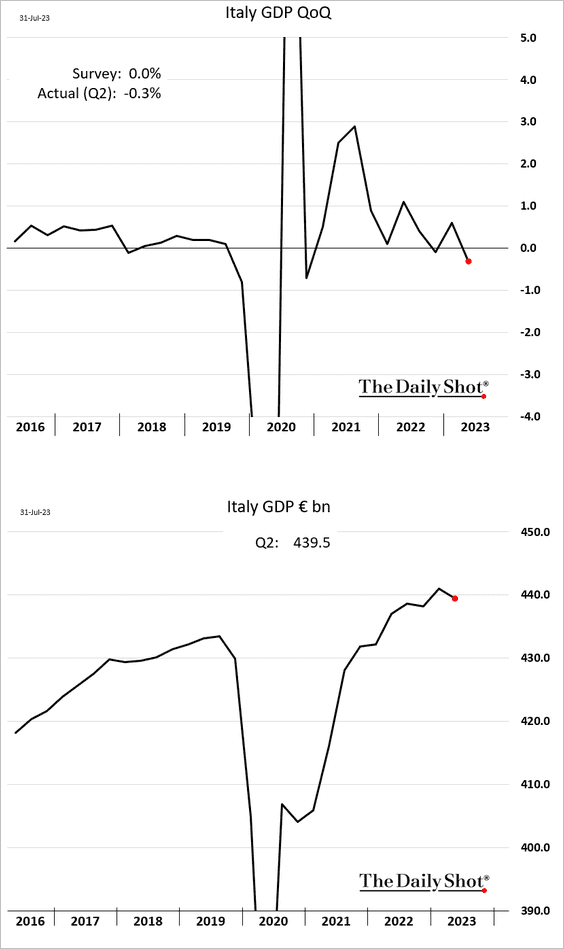
1. Italian GDP unexpectedly contracted in Q2.
 Source: Reuters Read full article
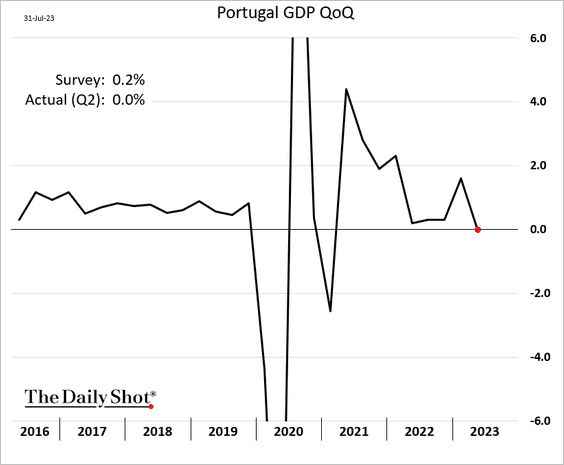
• Portugal’s GDP was flat.
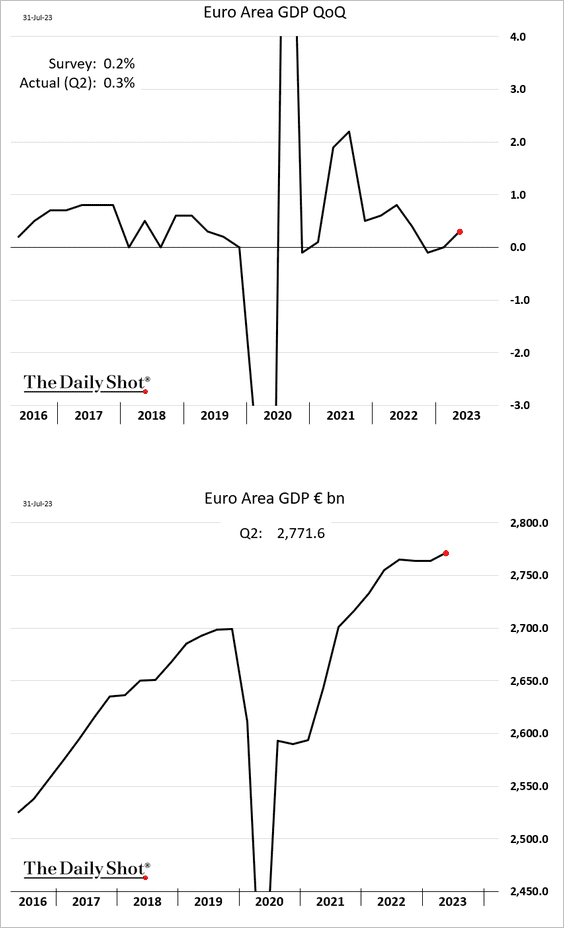
• At the Eurozone level, growth topped expectations.
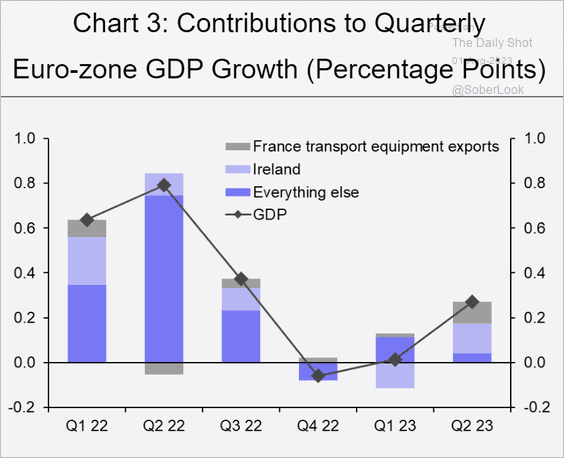
However, the factors propelling this surge in the Euro-area’s Q2 GDP are unlikely to be sustainable. The lion’s share of these gains can be attributed to the notoriously volatile Irish GDP, which is often subject to significant revisions, and the exports of transport equipment in France, predominantly from a single cruise boat.
 Source: Capital Economics
The PMI index signals trouble ahead.
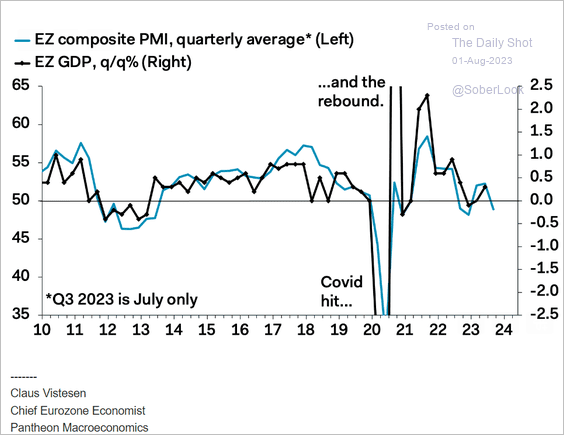 Source: Pantheon Macroeconomics
——————–
2. The Italian CPI continues to ease, …
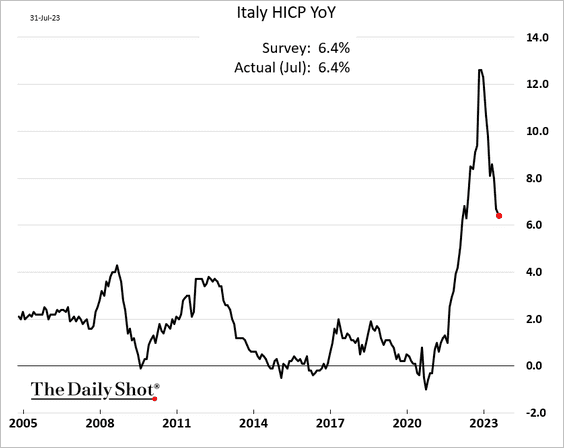
… as the PPI contracts by most since the GFC.
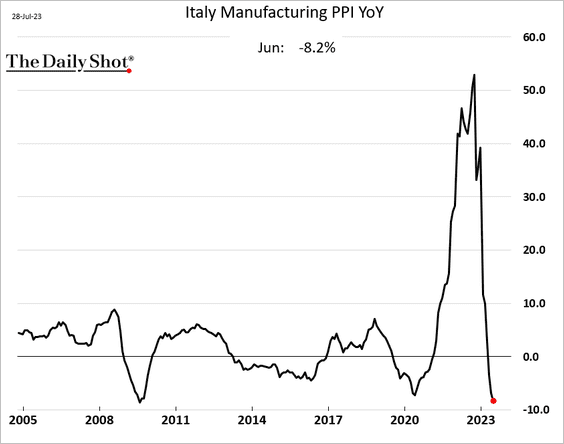
However, Italian wage growth has been surging.
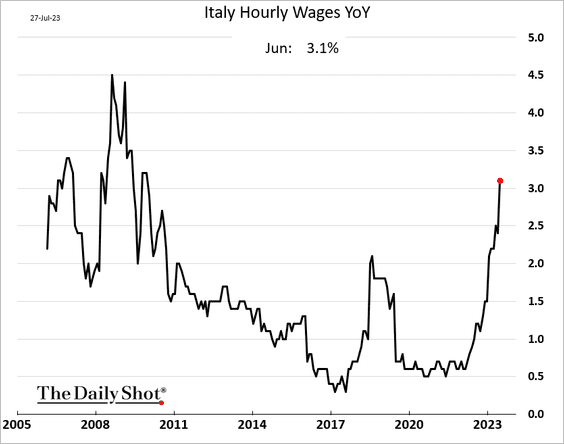
• Dutch inflation is also moderating.
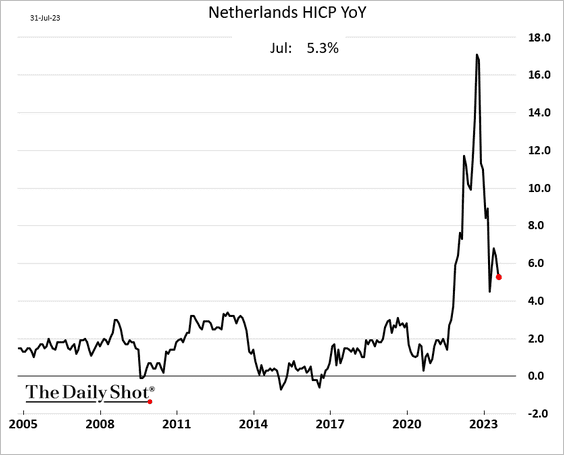
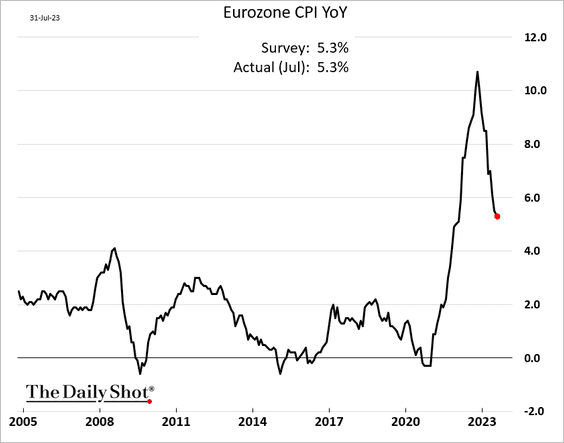
• At the Eurozone level, inflation is slowing.
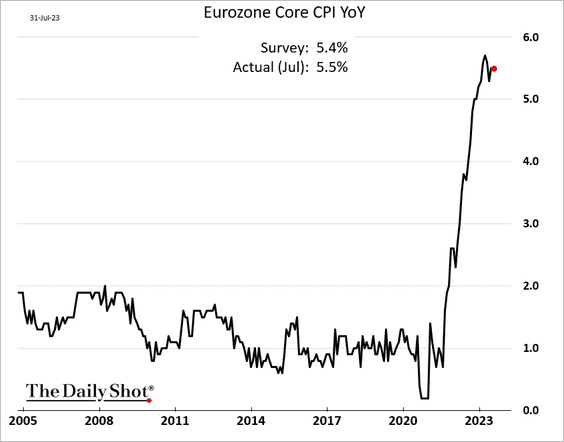
But core inflation remains stubbornly high, topping expectations.
Services inflation has been especially strong.
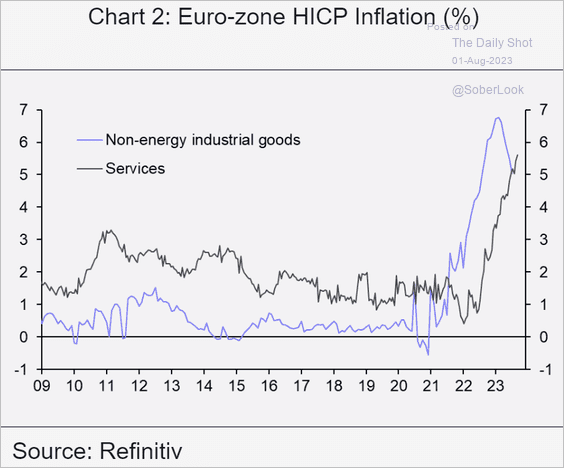 Source: Capital Economics
——————–
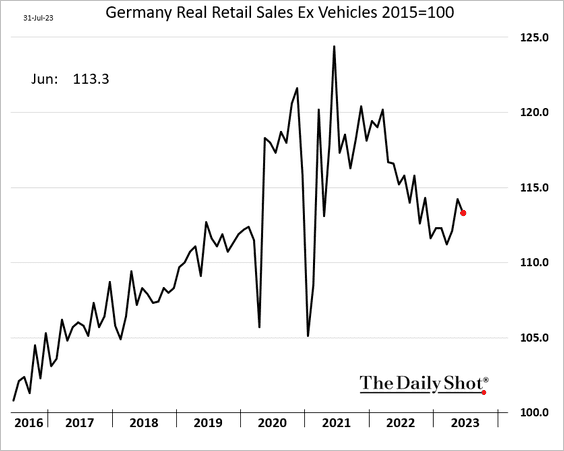
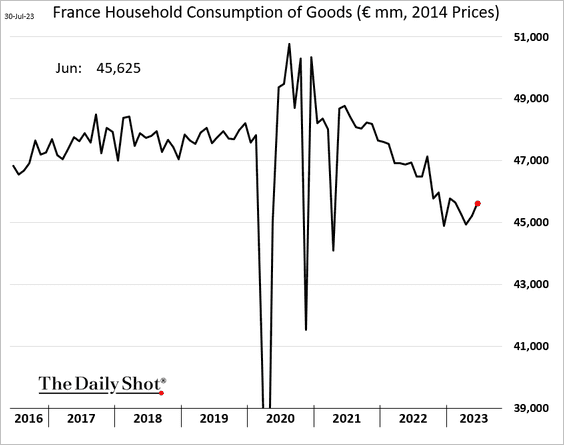
3. German retail sales declined in June.
• But French consumption of goods showed an improvement.
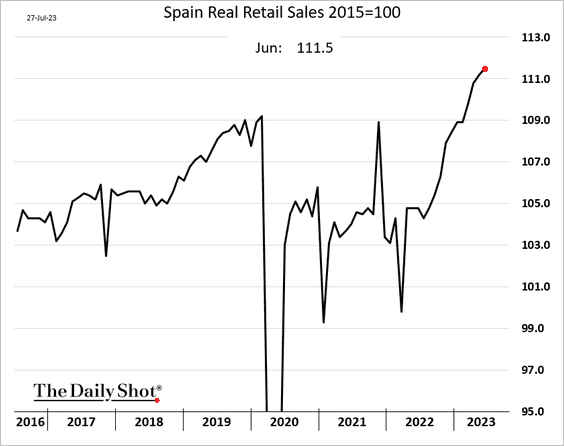
• Spain’s retail sales keep climbing.
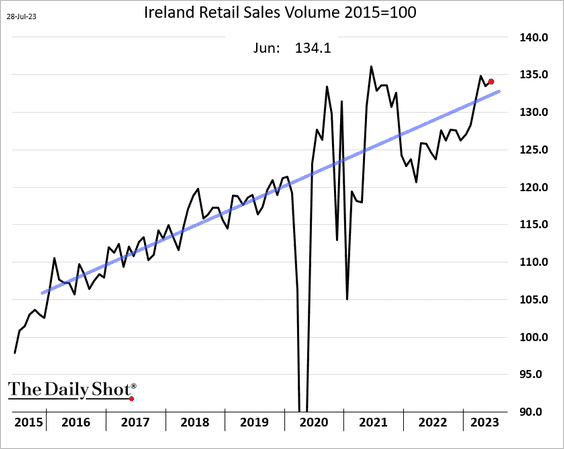
• Irish retail sales are above the pre-COVID trend.
——————–
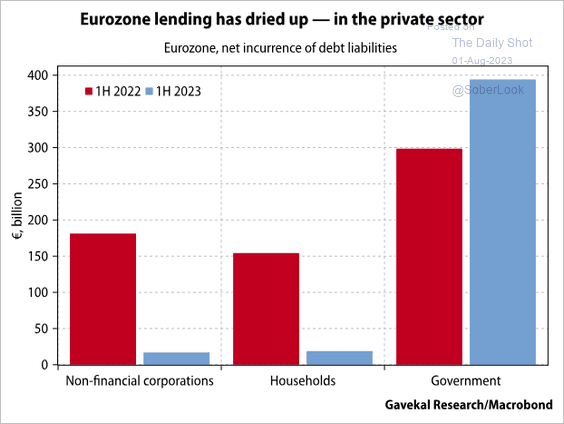
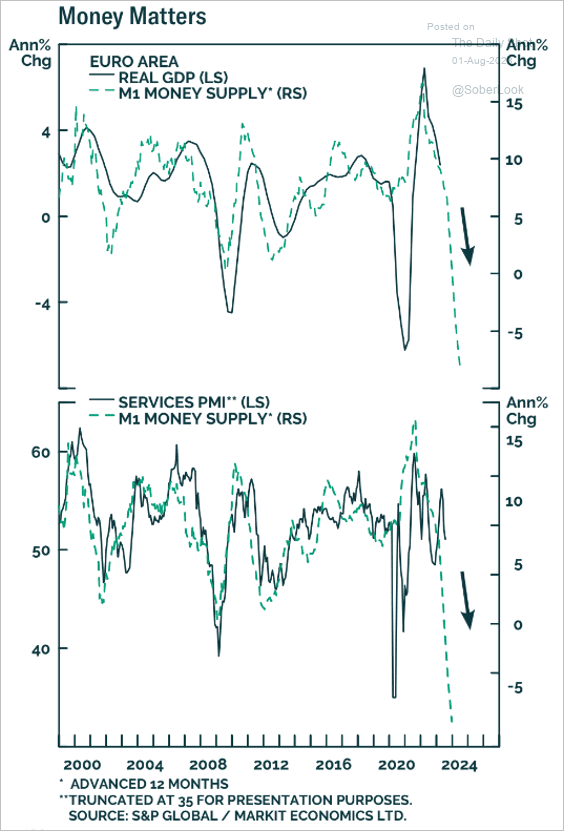
4. Euro-area credit growth has stalled.
 Source: Gavekal Research
The money supply contraction signals slower economic activity ahead.
 Source: BCA Research
——————–
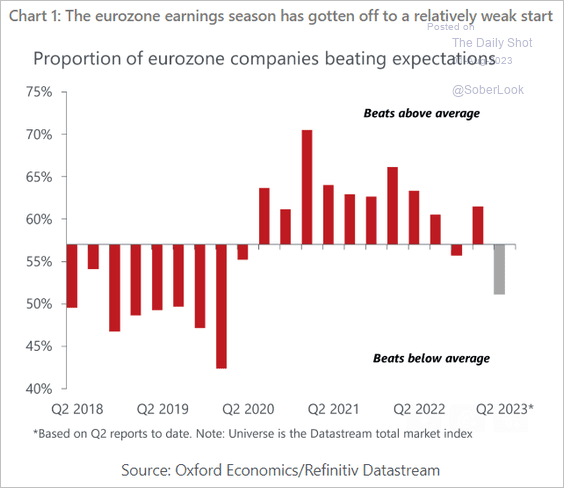
5. Corporate earnings disappointed in Q2.
 Source: Oxford Economics
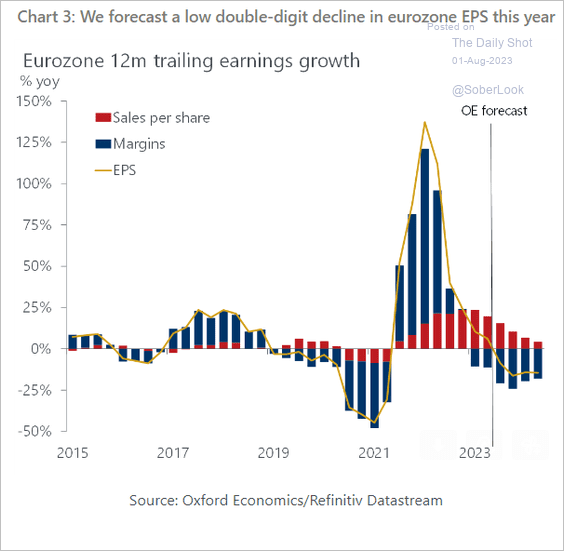
Oxford Economics sees slowing sales growth and tightening margins putting pressure on earnings.
 Source: Oxford Economics
Back to Index
Japan
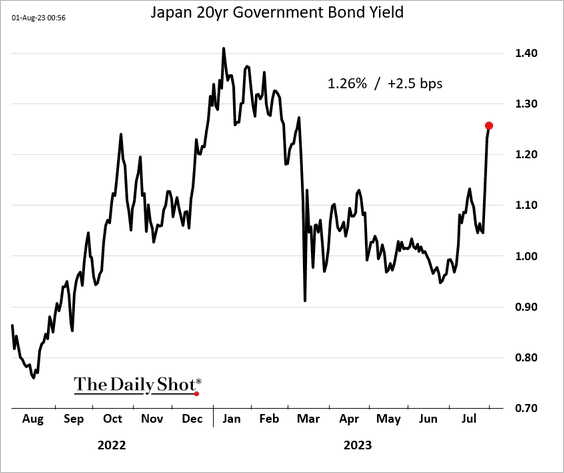
1. JGB yields continue to climb.
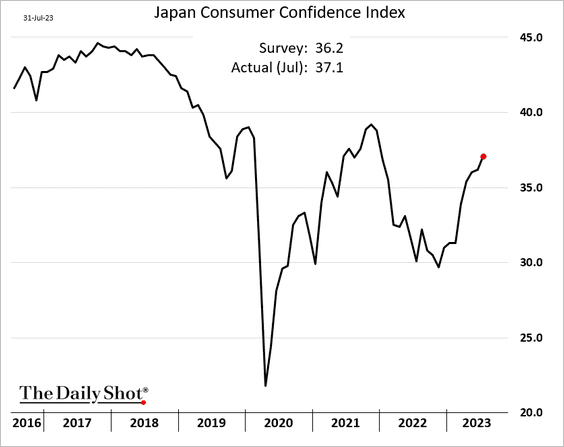
2. Consumer confidence improved more than expected in July.
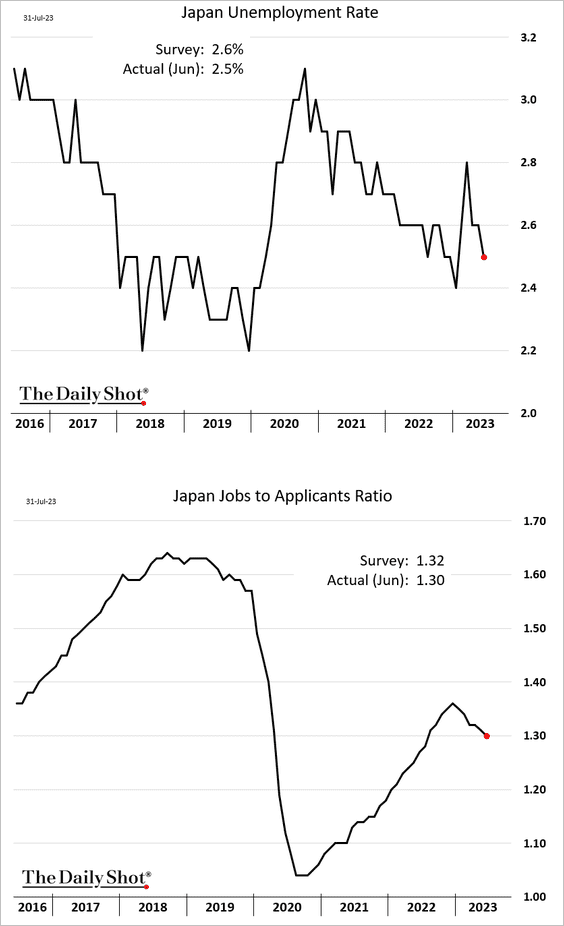
3. The unemployment rate declined in June, but the jobs-to-applicants ratio also moved lower.
4. Real disposable income has been falling.
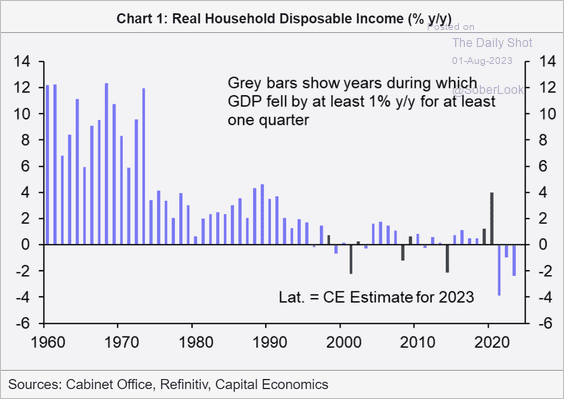 Source: Capital Economics
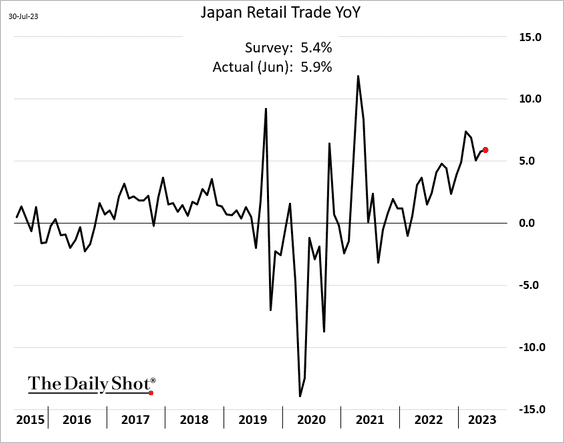
5. Retail sales continue to strengthen.
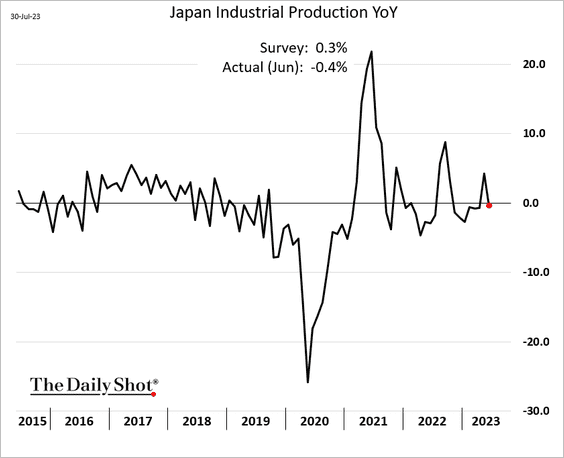
6. Industrial production disappointed.
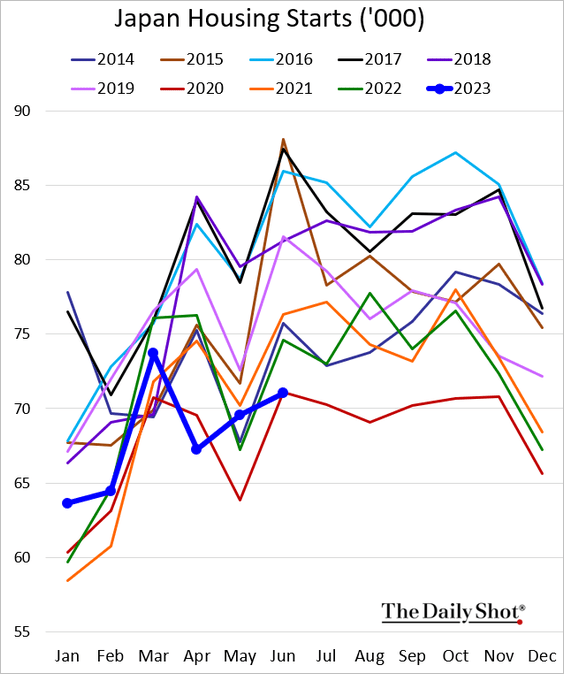
7. Housing starts have been soft.
8. Japan-focused funds finally saw outflows last week.
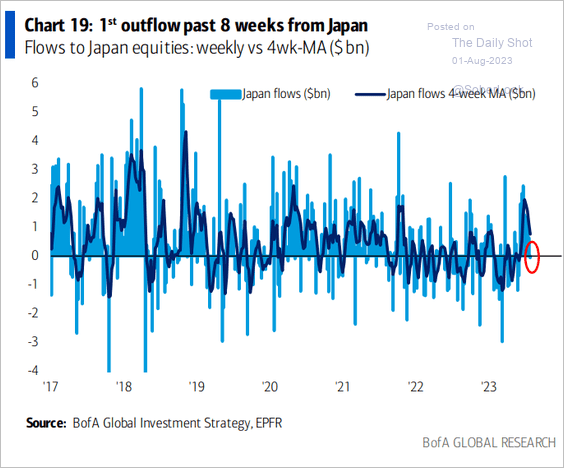 Source: BofA Global Research
Back to Index
Asia-Pacific
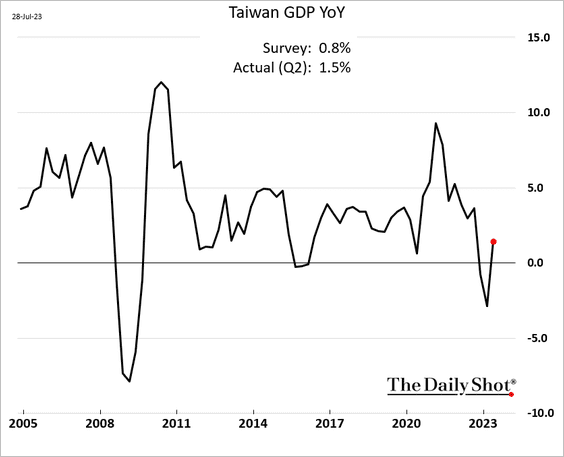
1. Let’s begin with Taiwan.
• The GDP growth improved last quarter.
 Source: Reuters Read full article
• But manufacturing activity continues to contract, according to the PMI report.
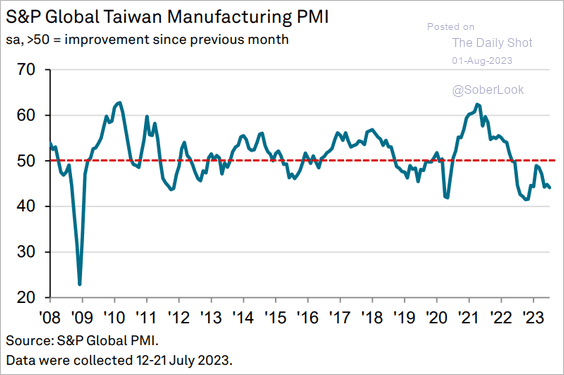 Source: S&P Global PMI
• Taiwan’s election outcome is uncertain, although Vice President Lai of the ruling Democratic Progressive Party (DPP) is the front-runner.
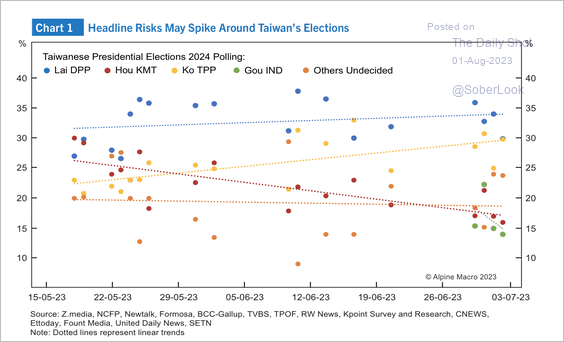 Source: Alpine Macro
 Source: @bpolitics Read full article
 Source: Nikkei Asia Read full article
——————–
2. South Korea’s manufacturing activity is stabilizing.
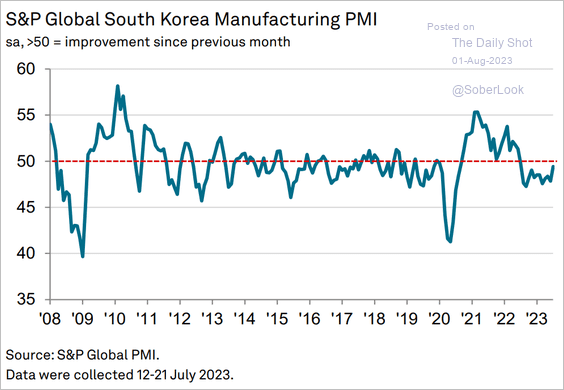 Source: S&P Global PMI
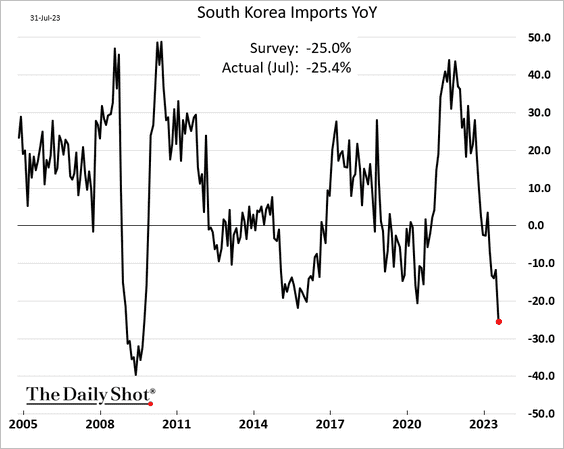
Imports have been crashing.
——————–
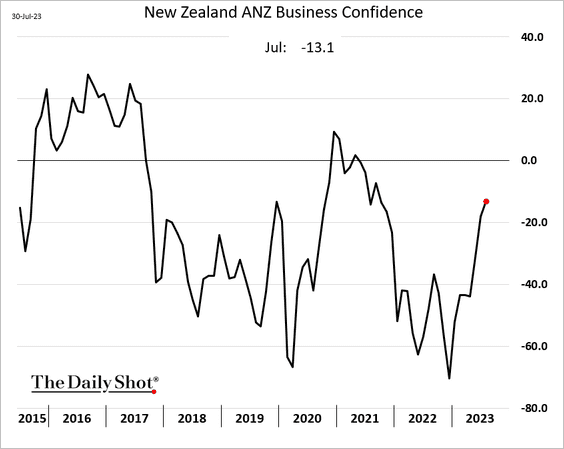
3. New Zealand’s business confidence is improving.
4. Australia’s credit growth continues to slow.
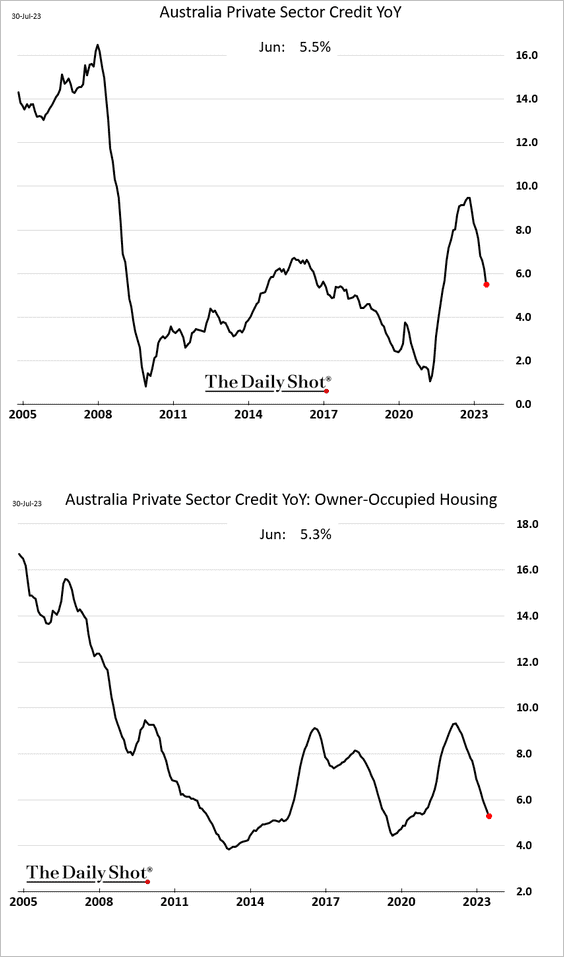
• Inflation is off the highs but still elevated.
![]()
Rent inflation has been surging.
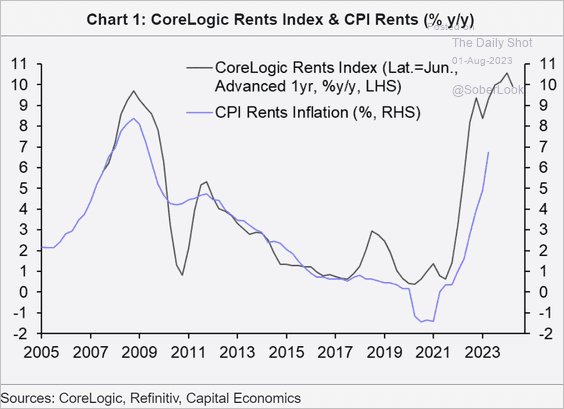 Source: Capital Economics
Back to Index
China
1. The manufacturing PMI from S&P Global showed an unexpected contraction as demand slows.
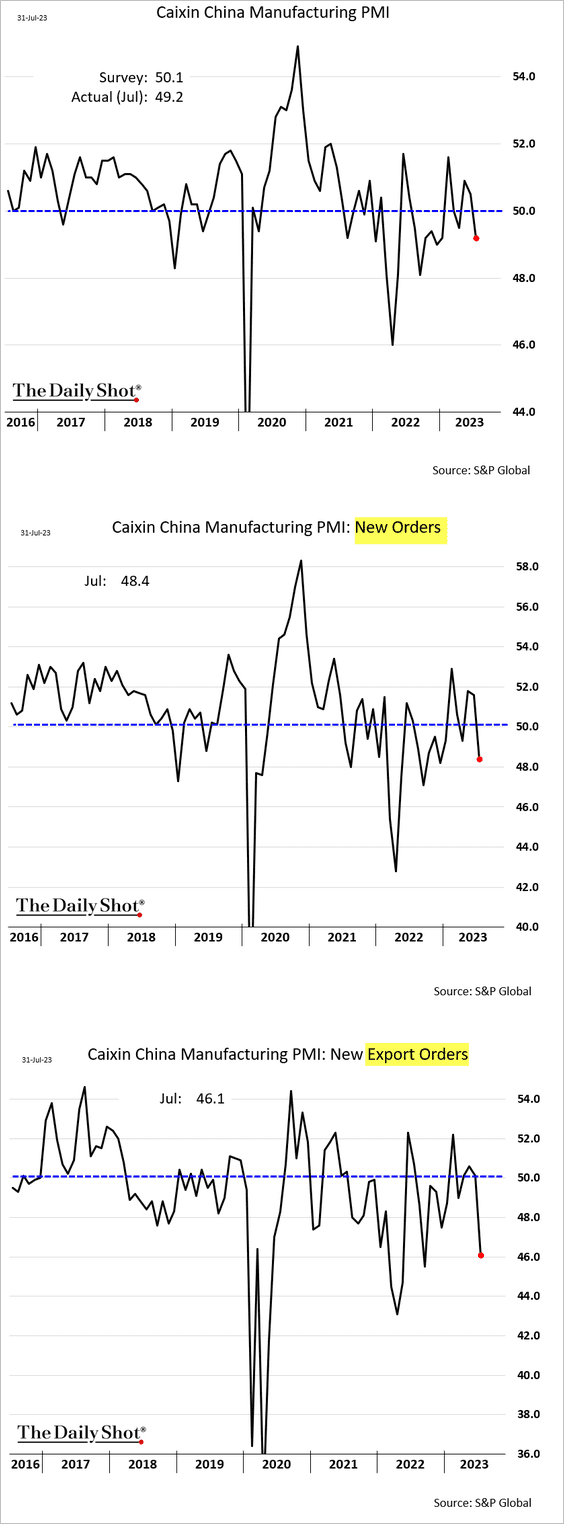
 Source: Reuters Read full article
• Inventories are elevated.
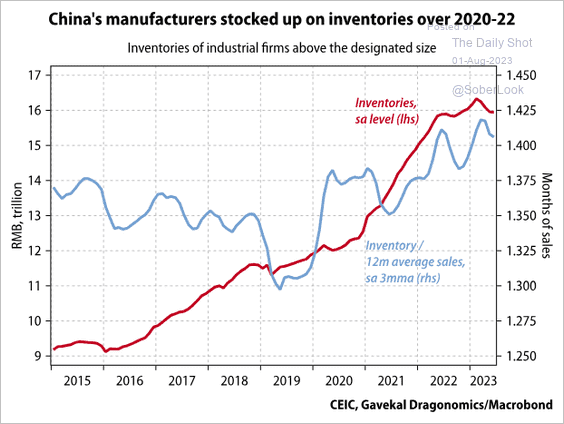 Source: Gavekal Research
——————–
2. Developers are struggling to obtain sufficient funding.
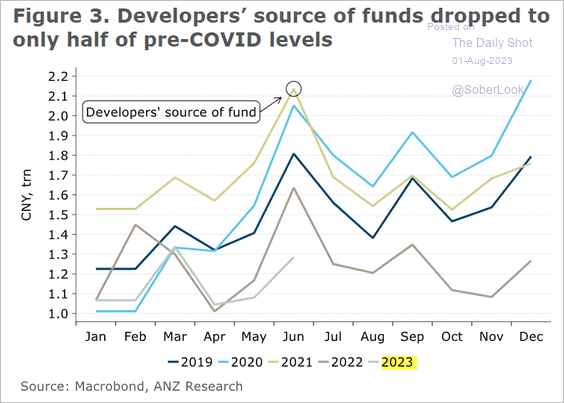 Source: @ANZ_Research
3. This chart shows exports of semiconductors to China.
 Source: Oxford Economics
4. The aggregate debt-to-GDP ratio is now above that of the US.
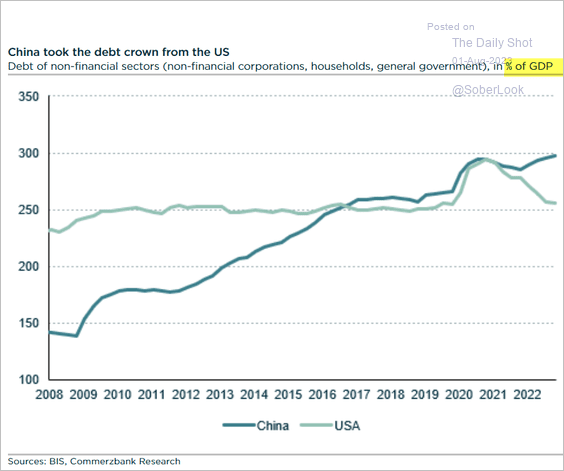 Source: Commerzbank Research
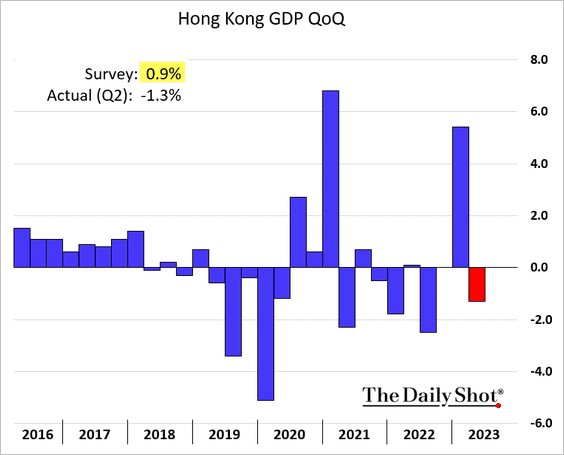
5. Hong Kong’s economy unexpectedly contracted in Q2.
Back to Index
Emerging Markets
1. Let’s run through Asian manufacturing PMI reports.
• India (still very strong):
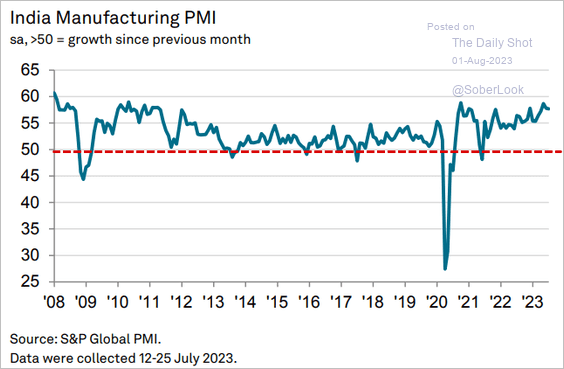 Source: S&P Global PMI
• Indonesia (robust growth):
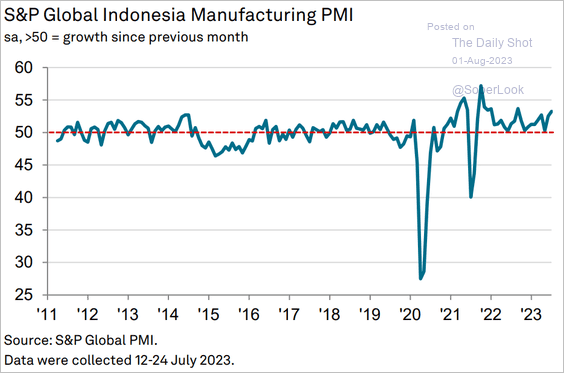 Source: S&P Global PMI
• Vietnam (stabilizing):
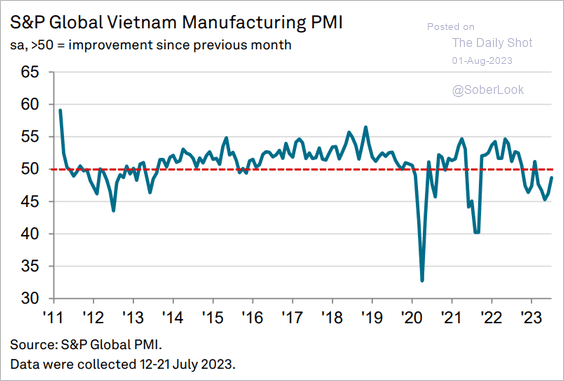 Source: S&P Global PMI
• Malaysia (ongoing contraction):
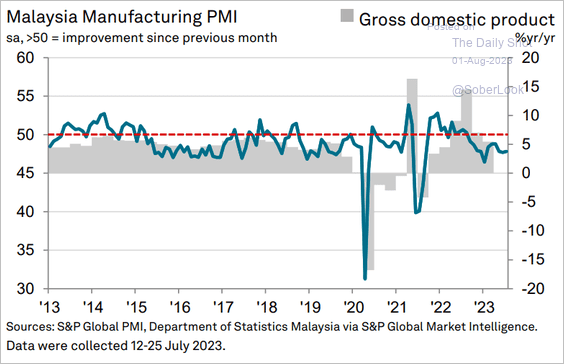 Source: S&P Global PMI
• The Philippines (stronger growth):
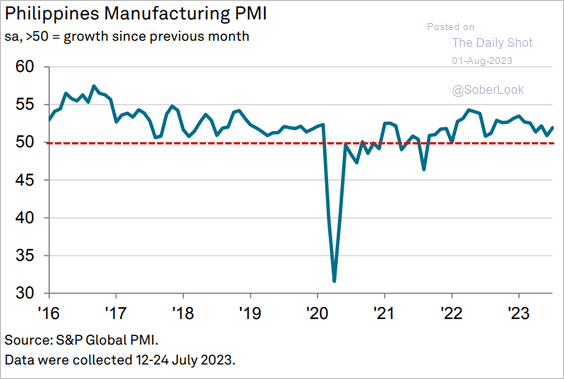 Source: S&P Global PMI
——————–
2. India’s industrial activity remains robust.
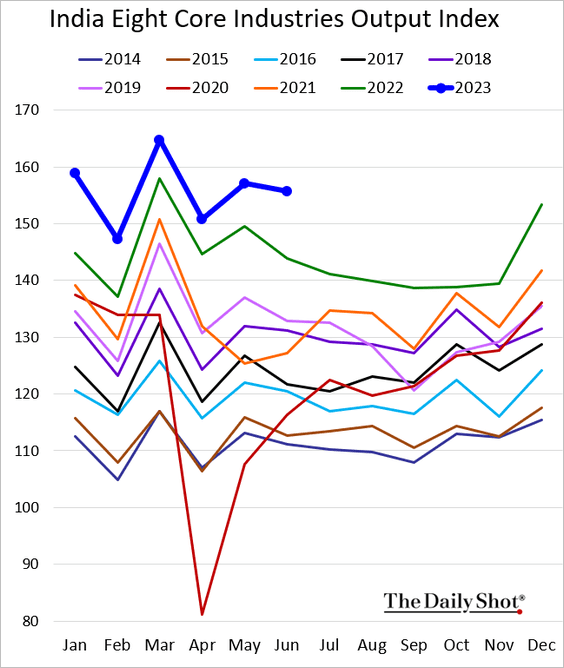
 Source: The Economic Times Read full article
• India’s economy held up well in Q1 as output rose above pre-pandemic levels.
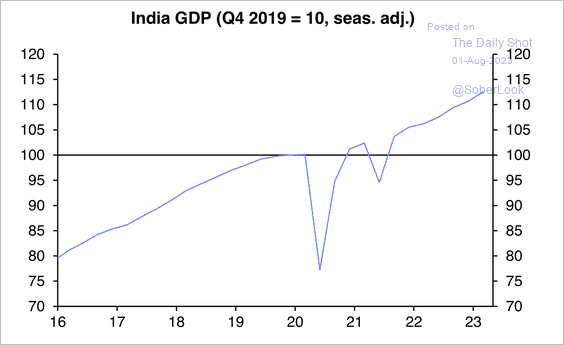 Source: Capital Economics
However, Indian firms are becoming less optimistic on hiring intentions and profits.
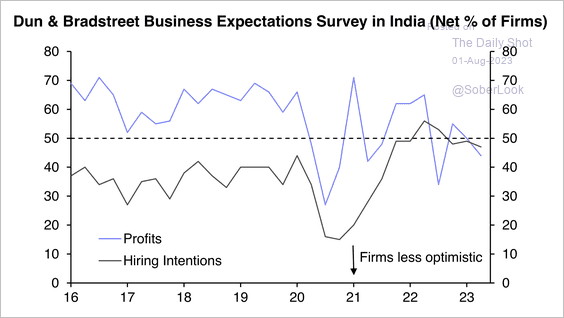 Source: Capital Economics
• India’s credit growth continues to moderate amid higher interest rates.
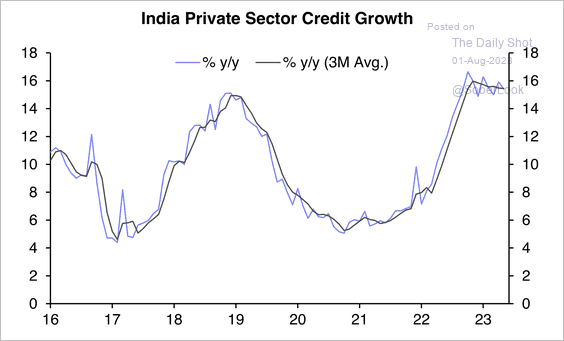 Source: Capital Economics
——————–
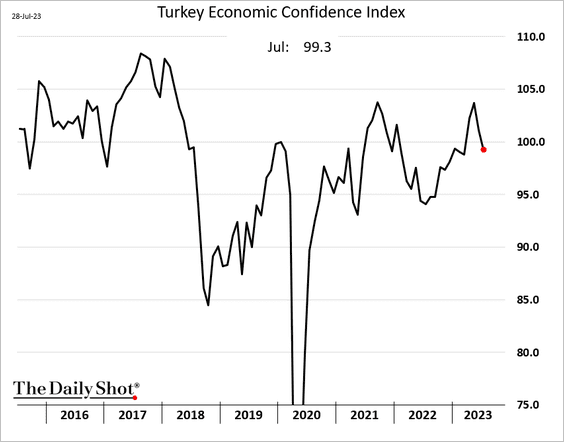
3. Turkey’s economic confidence declined again in July.
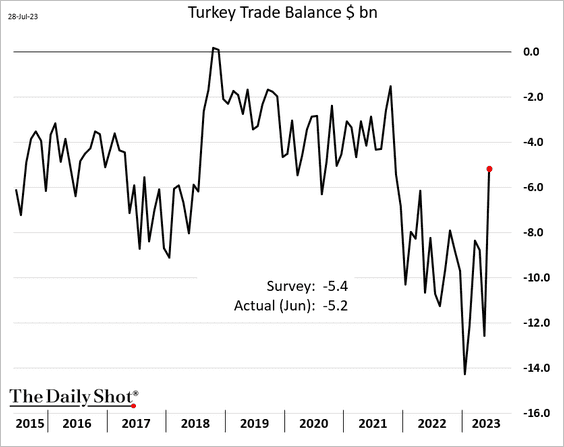
The trade deficit is narrowing.
——————–
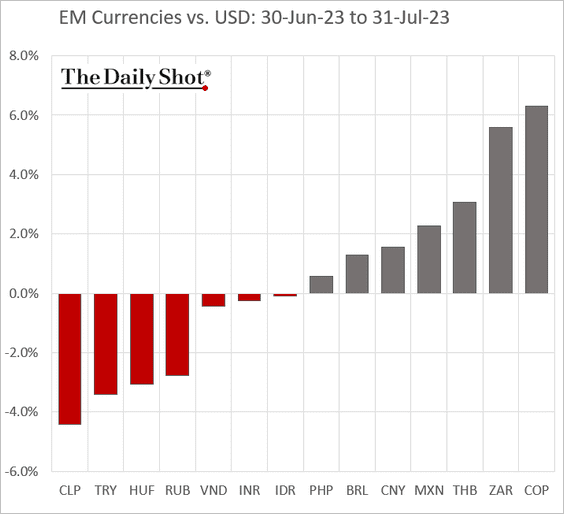
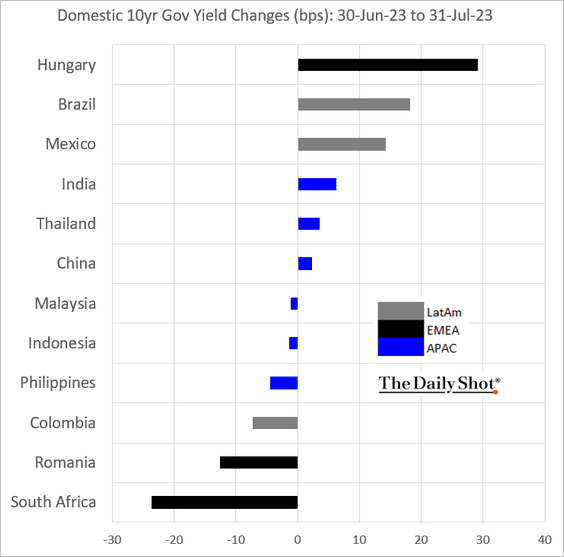
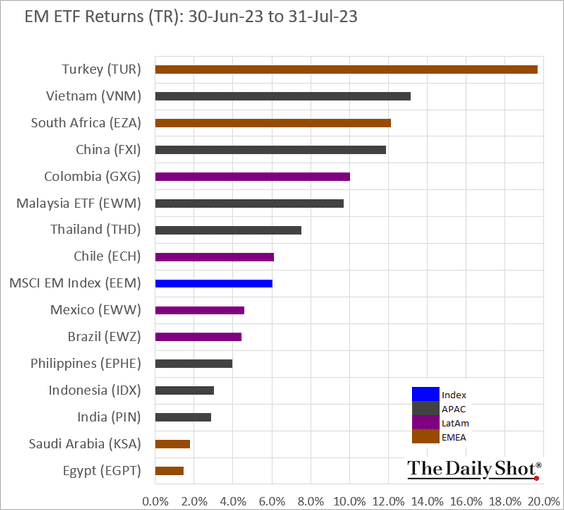
4. Next, we have some performance data for July.
• Currencies:
• Bond yields:
• Equity ETFs:
Back to Index
Cryptocurrency
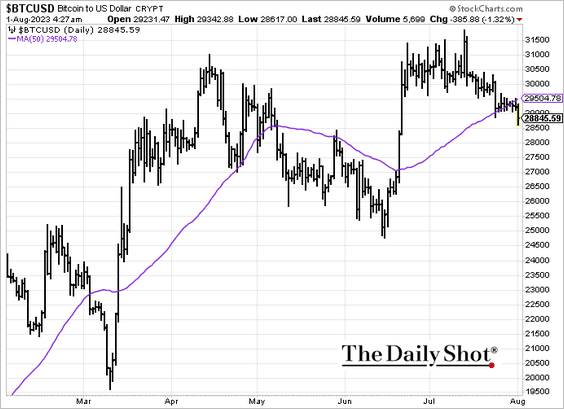
1. Bitcoin dipped below its 50-day moving average.
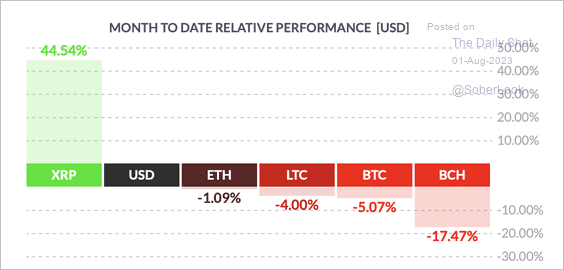
2. XRP outperformed other top cryptos in July, which bitcoin cash’s (BCH) earlier rally was short-lived.
 Source: FinViz
3. 75% of the top altcoins outperformed BTC over the past month – the most since September 2022.
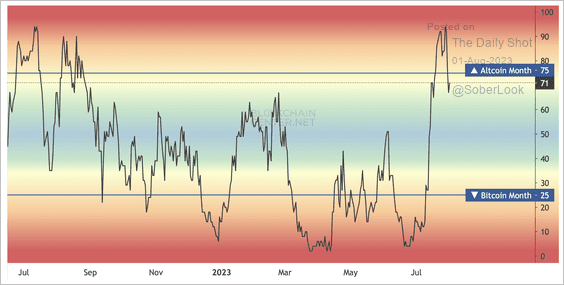 Source: Blockchain Center
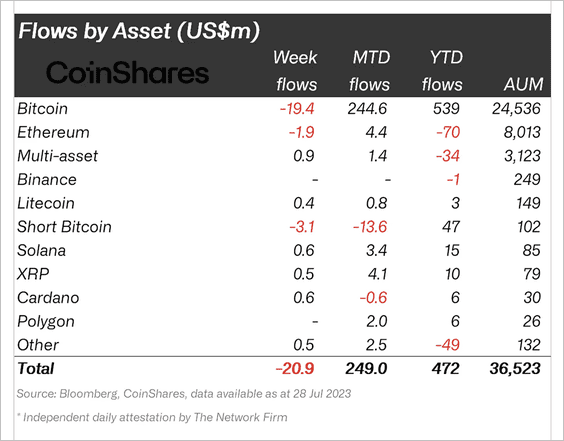
4. Crypto funds saw outflows last week, mostly in bitcoin products. (2 charts)
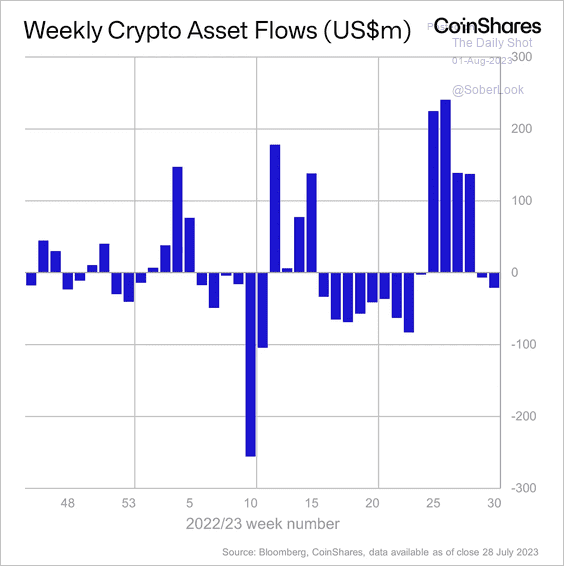 Source: CoinShares Read full article
 Source: CoinShares Read full article
Back to Index
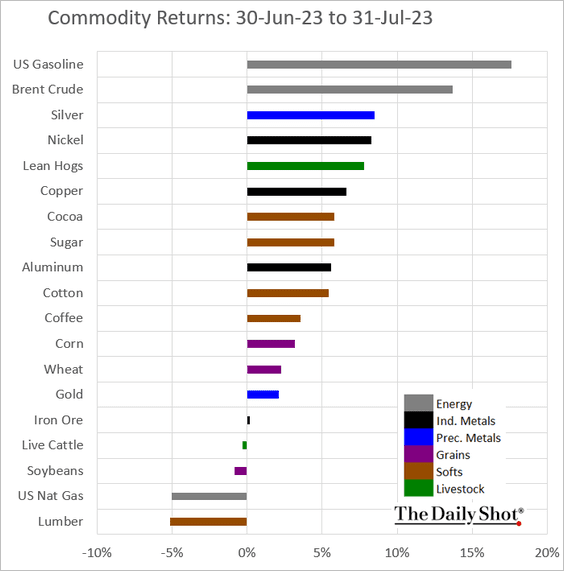
Commodities
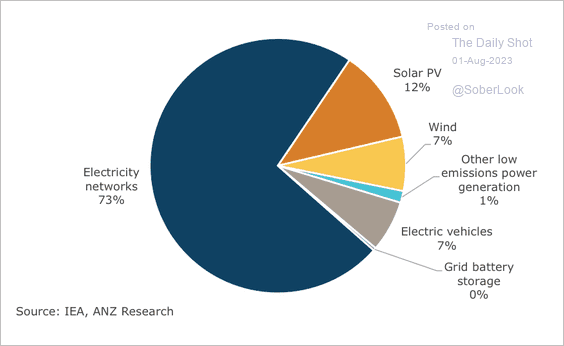
1. Here is a look at copper demand by end-use, …
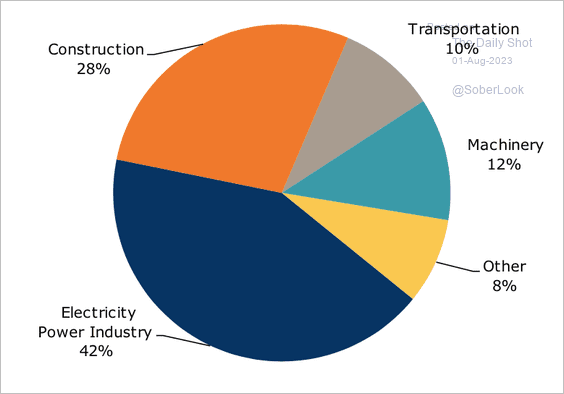 Source: @ANZ_Research
…. and by clean-tech sectors.
 Source: @ANZ_Research
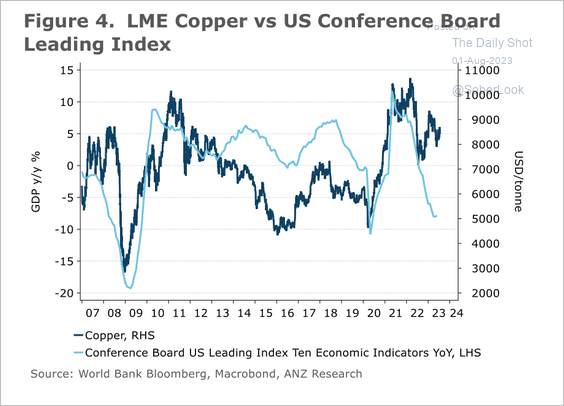
Copper prices have been elevated despite the sharp drop in US leading indicators.
 Source: @ANZ_Research
——————–
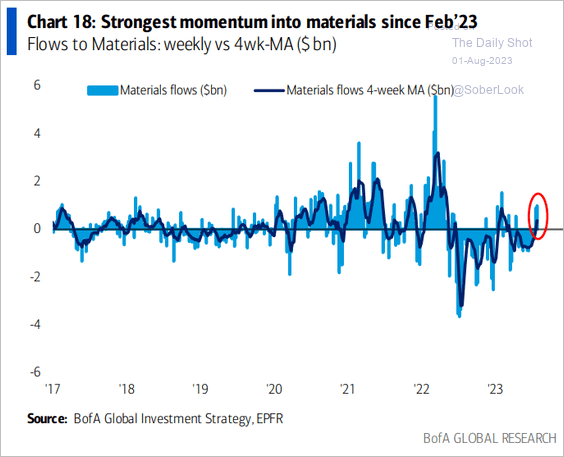
2. Funds focused on materials companies saw some inflows last week.
 Source: BofA Global Research
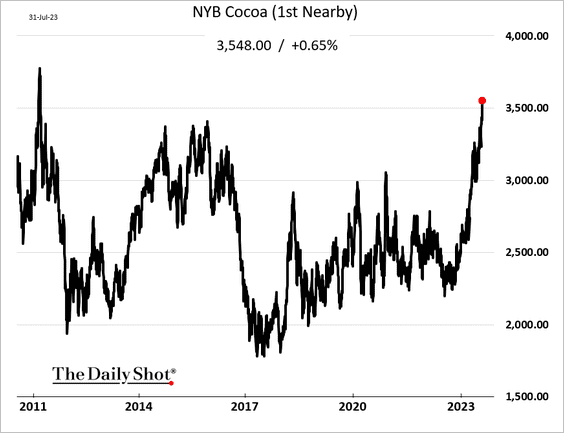
3. Cocoa futures are hitting multi-year highs on supply concerns.
4. Next, we have some performance data for July.
Back to Index
Energy
1. It’s been a good run for crude oil.
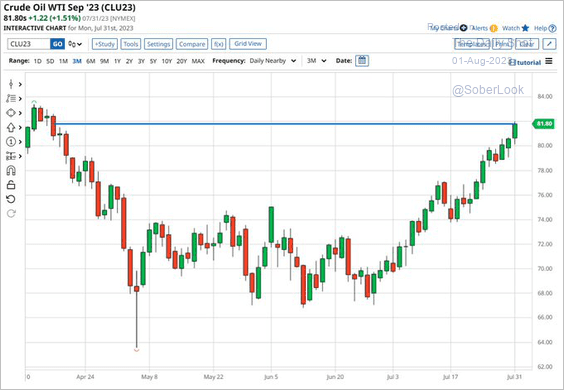 Source: @Barchart
2. OPEC’s output declined in July.
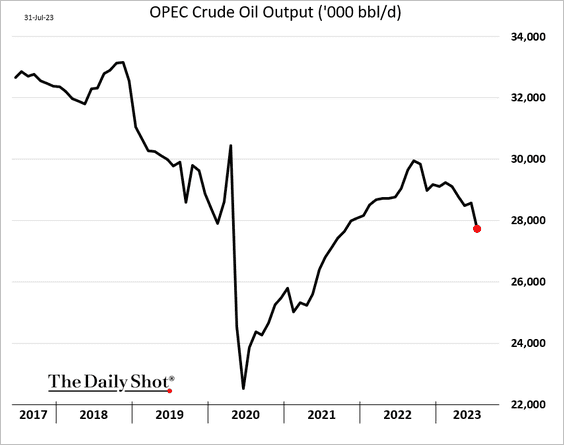
 Source: Reuters Read full article
——————–
3. Traders have been boosting bets on US gasoline futures.
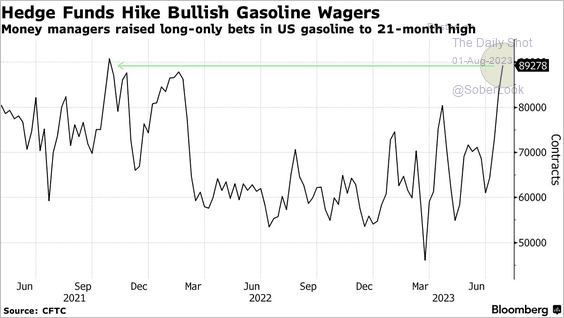 Source: @markets Read full article
Back to Index
Equities
1. The S&P 500 held long-term support with improving momentum and breadth.
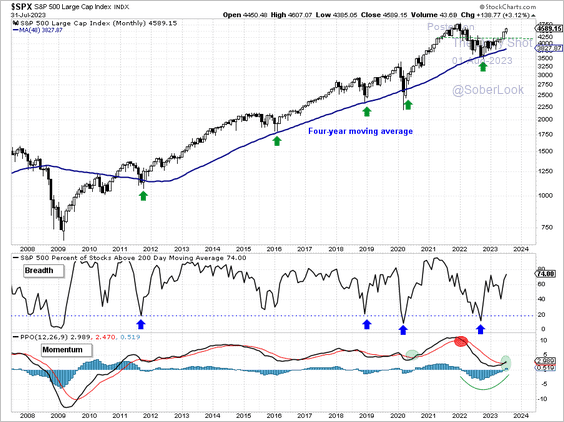 Source: Aazan Habib, Paradigm Capital
2. Goldman’s positioning indicator remains in “stretched” territory.
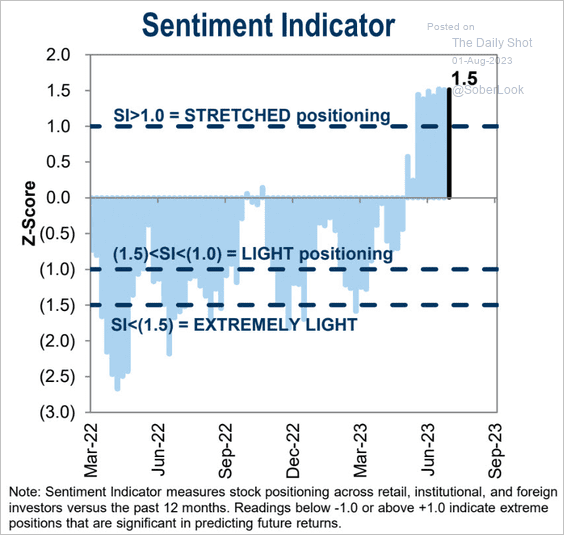 Source: Goldman Sachs; h/t @dailychartbook
3. Next, let’s take a look at the breadth of Q2 beats.
• Earnings:
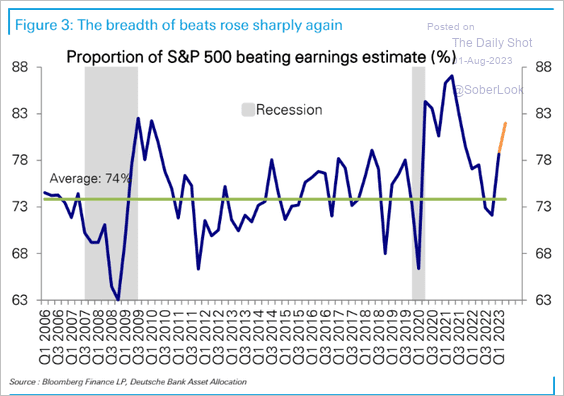 Source: Deutsche Bank Research
• Sales (2 charts):
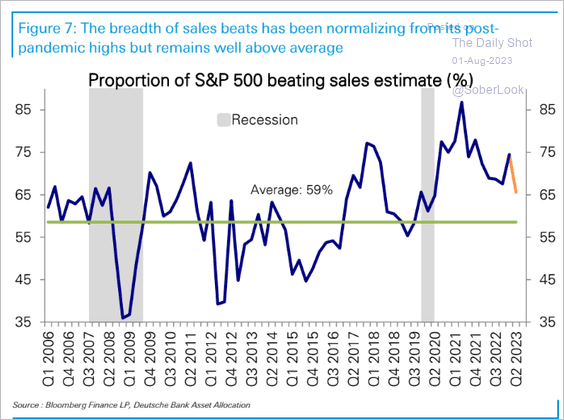 Source: Deutsche Bank Research
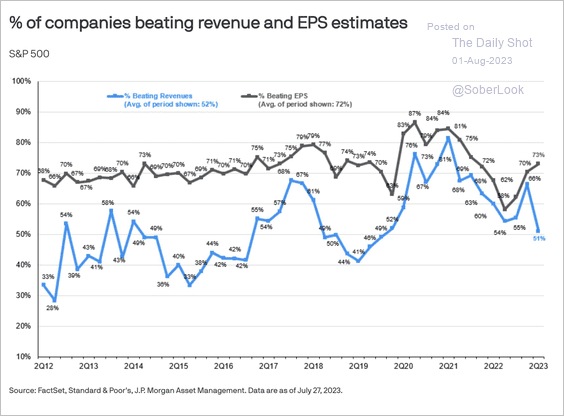 Source: J.P. Morgan Asset Management
• Margins:
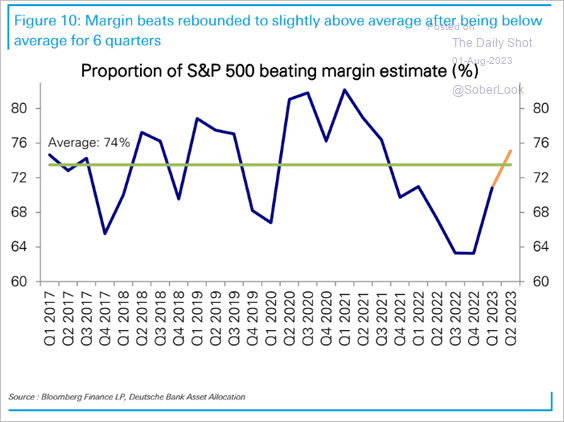 Source: Deutsche Bank Research
——————–
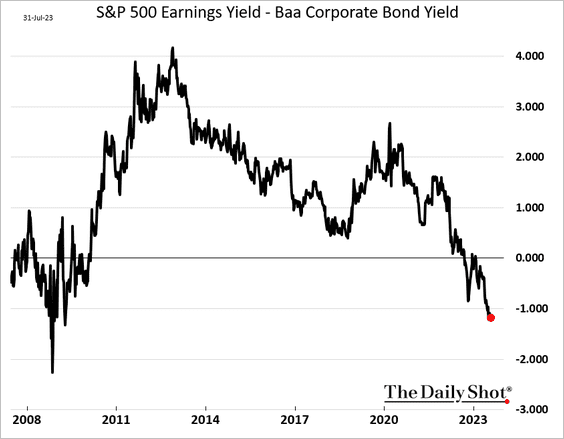
4. Stocks are increasingly unattractive relative to corporate bonds.
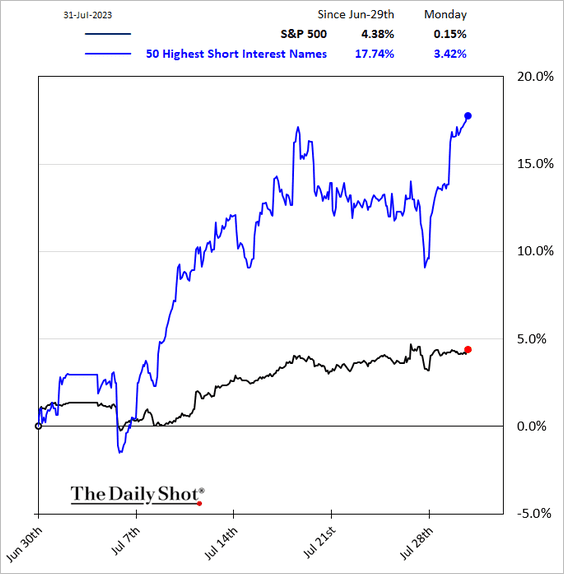
5. Hedge funds’ short-covering this summer hasn’t been this aggressive since 2016.
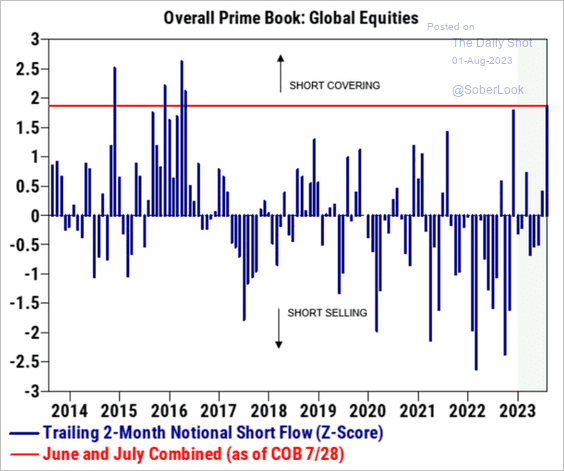 Source: Goldman Sachs
 Source: @markets Read full article
The most shorted names have been surging.
——————–
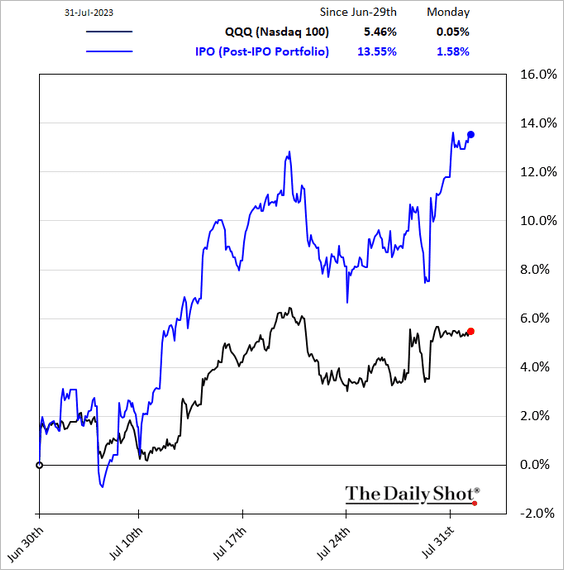
6. Post-IPO stocks continue to outperform.
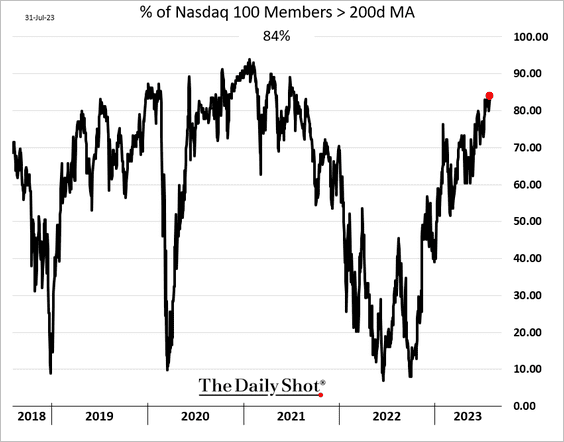
7. 84 of the Nasdaq 100 members are above their 200-day moving average.
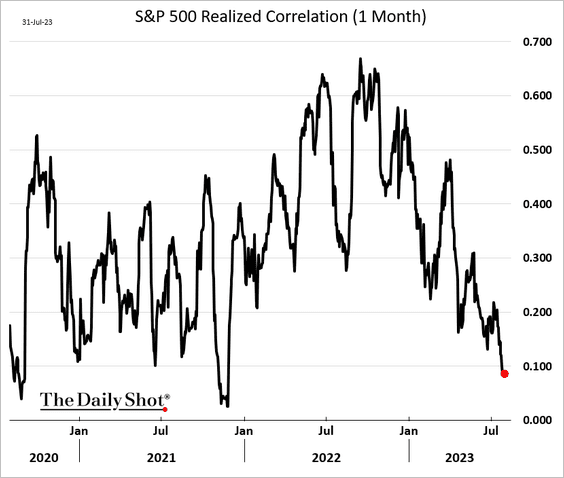
8. S&P 500 correlations continue to decline.
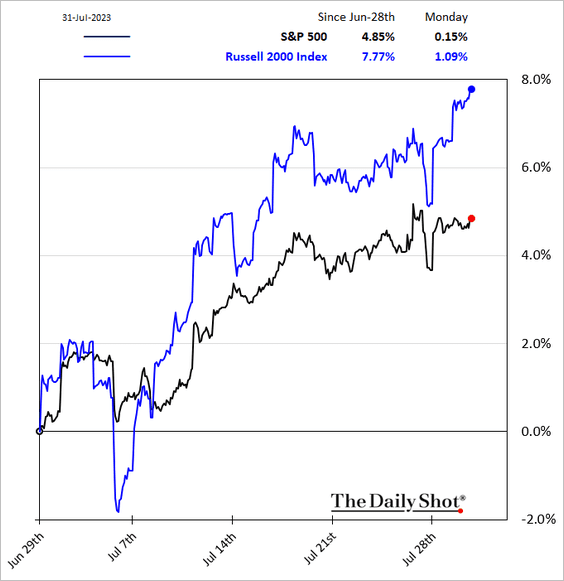
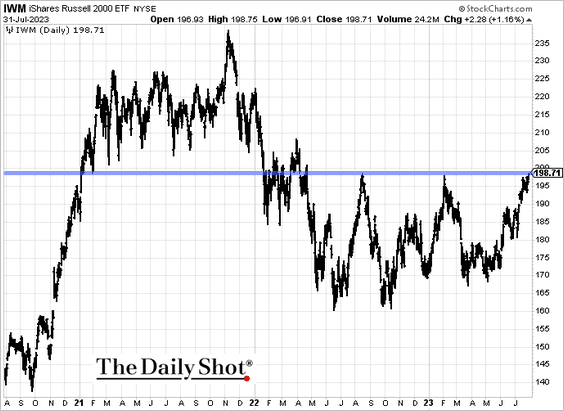
9. Small caps have been outperforming.
IWM (Russell 2000 ETF) is at resistance.
——————–
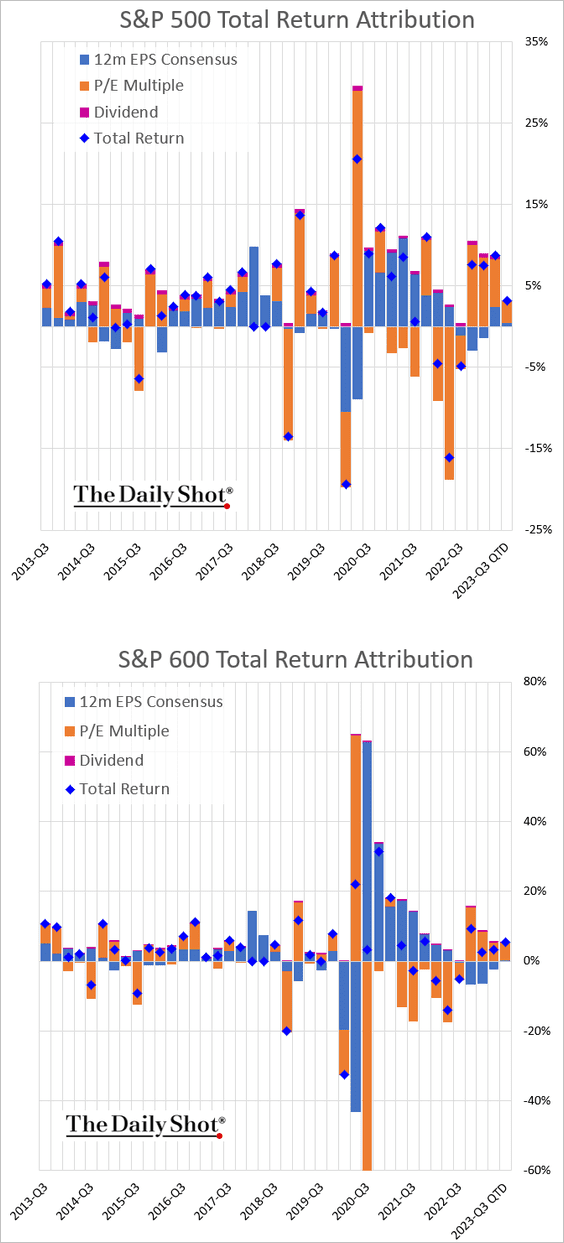
10. Here is a look at quarter-to-date performance attribution.
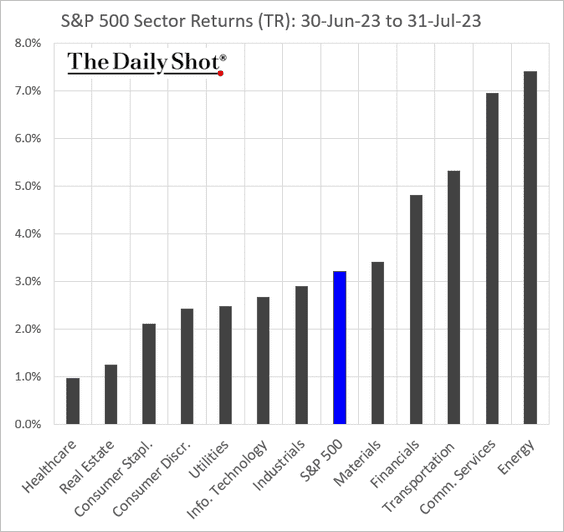
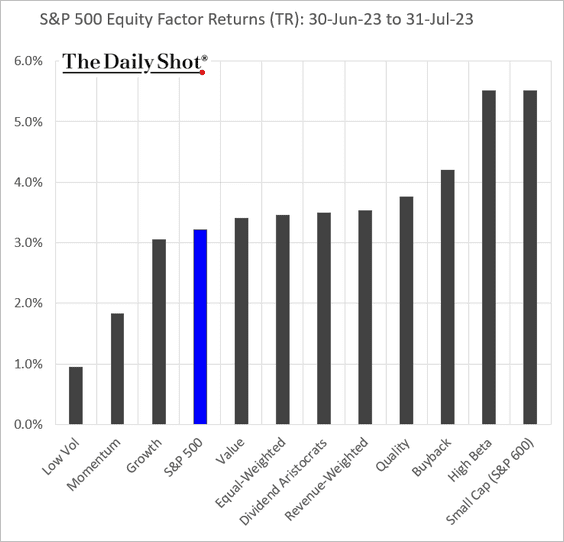
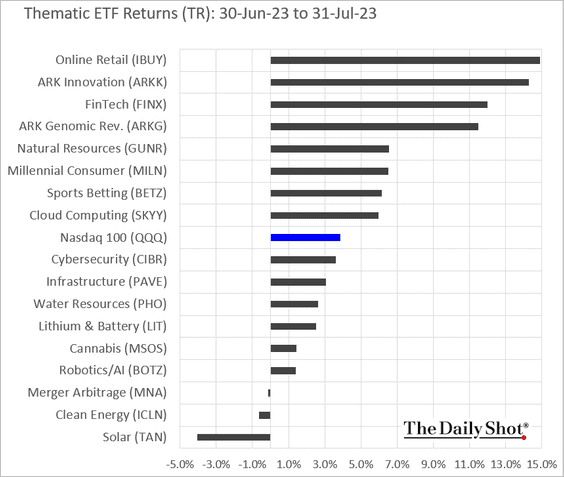
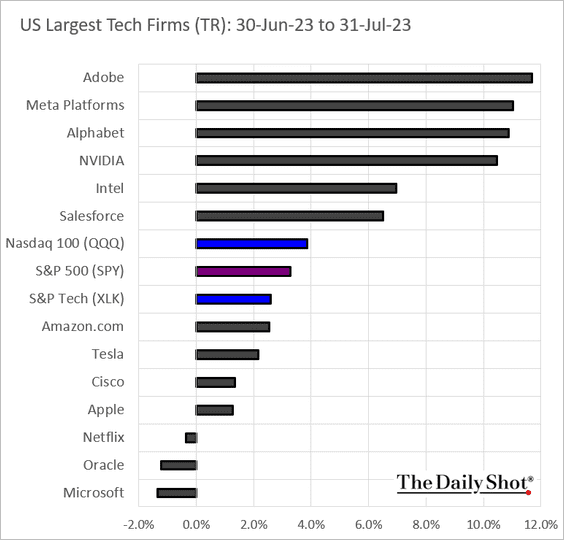
11. Finally, we have some performance data for July.
• Sectors:
• Equity factors:
• Macro basket pairs’ relative performance:
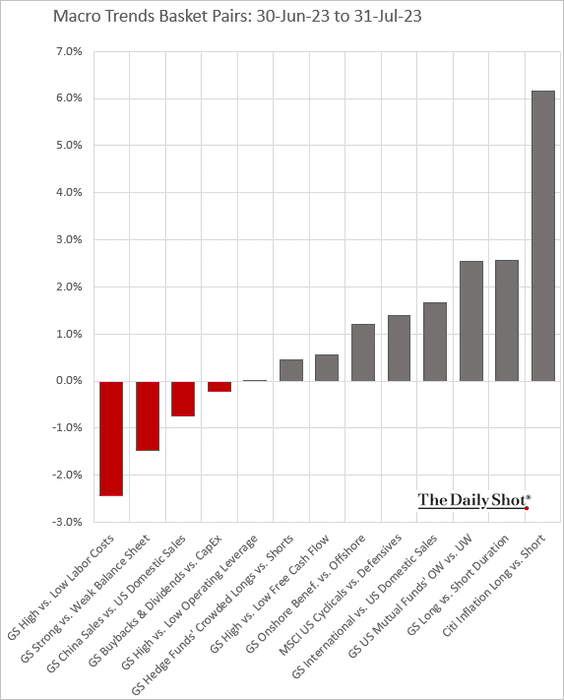
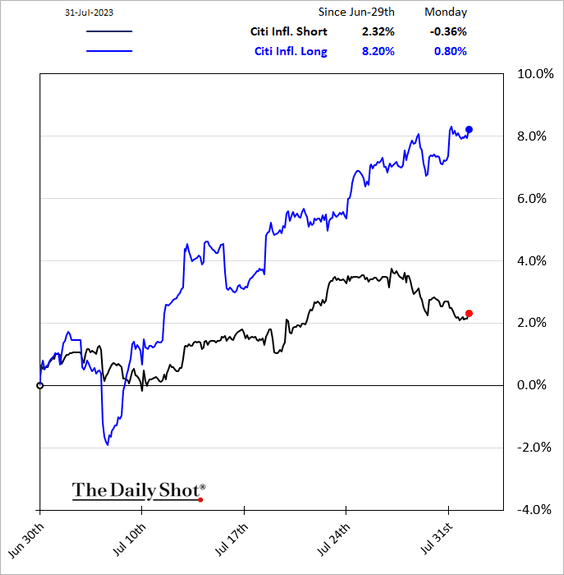
– Inflation-sensitive stocks have been outperforming.
• Thematic ETFs:
• Largest US tech firms:
Back to Index
Credit
1. Credit standards for business loans tightened further in recent months, …
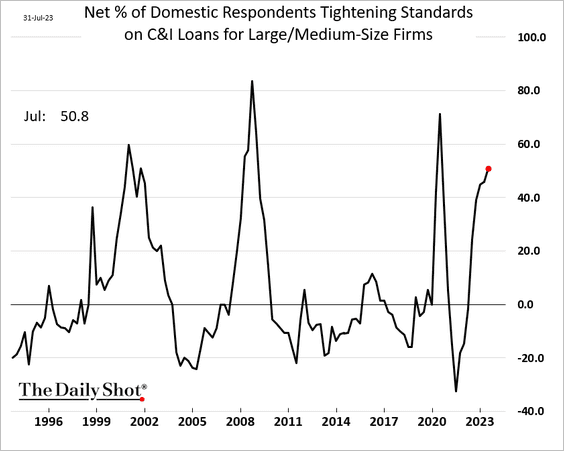
… pointing to stagnating loan growth.
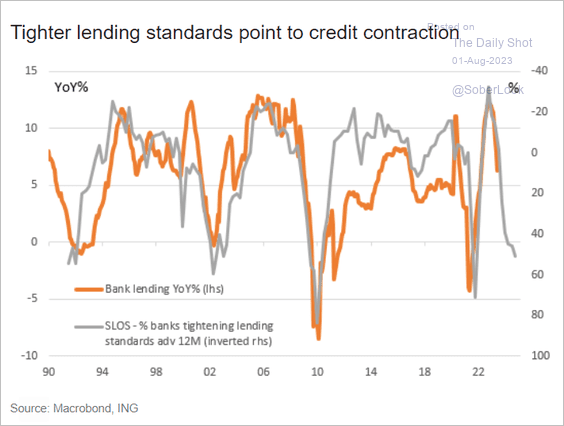 Source: ING
——————–
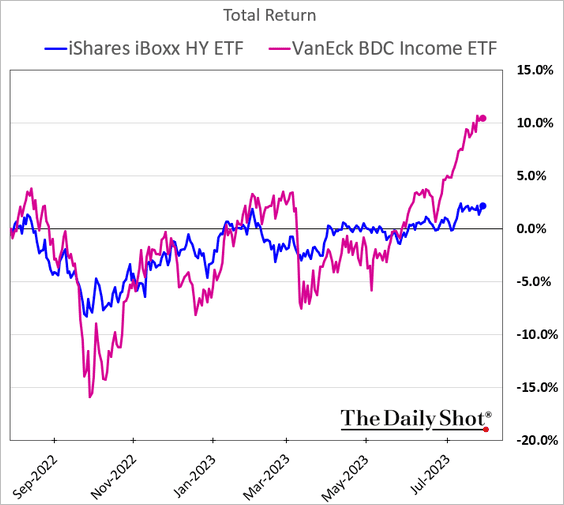
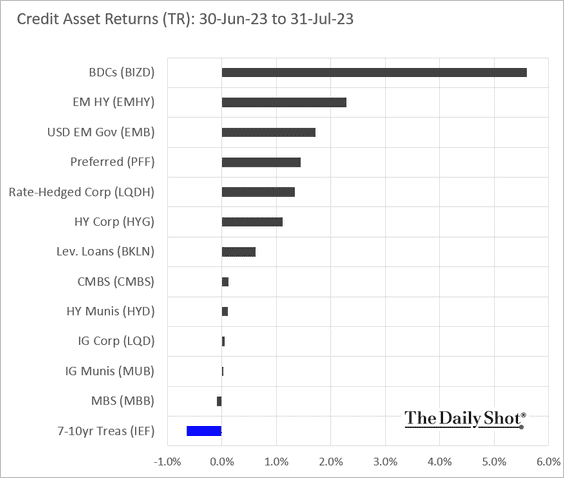
2. BDCs have been outperforming.
3. Multi-family housing delinquencies continue to climb.
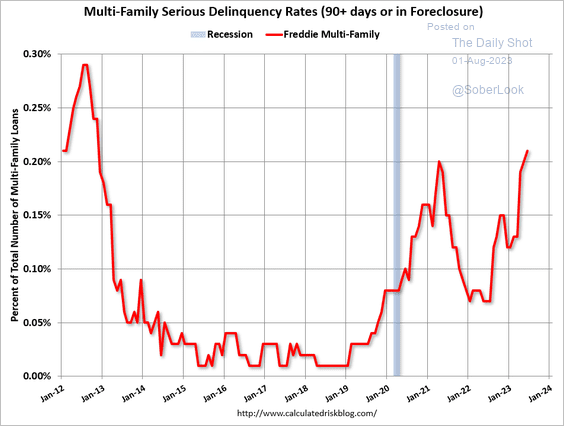 Source: Calculated Risk
4. Next, we have some performance data for July.
Back to Index
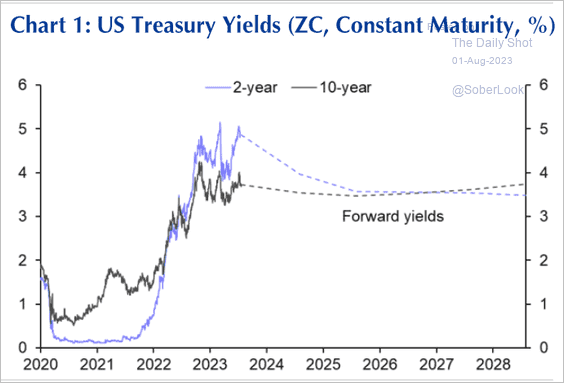
Rates
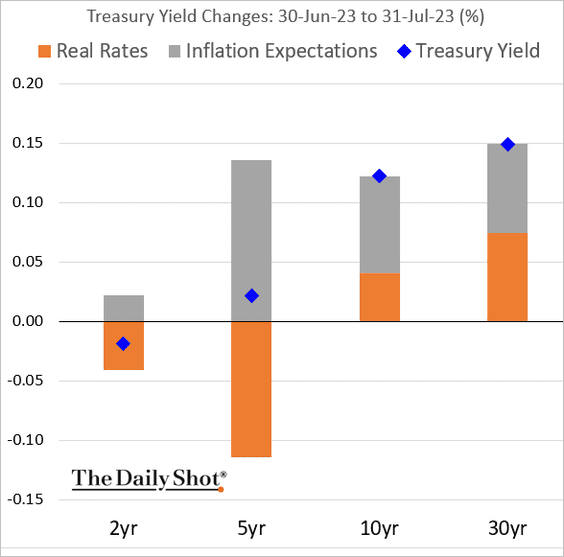
1. Here is the attribution of Treasury yield changes in July.
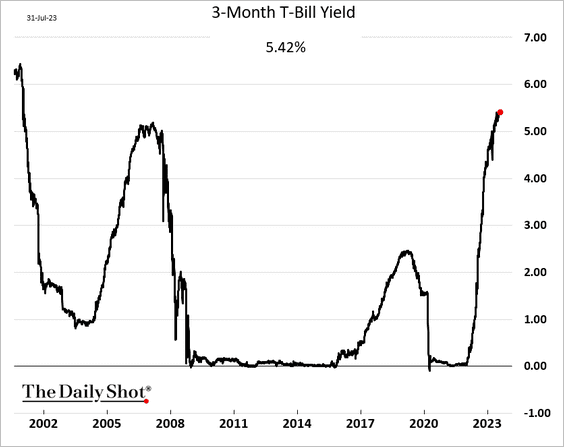
2. T-bill yields are at the highest levels in over two decades.
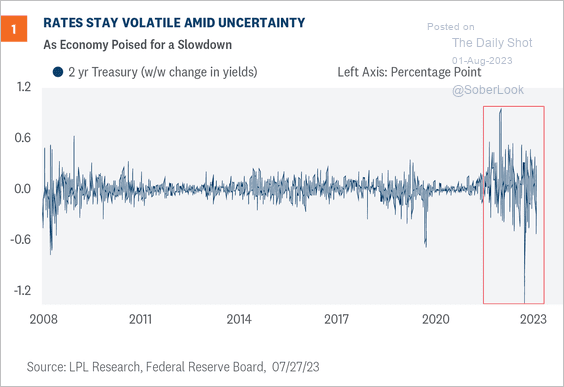
3. The 2-year Treasury volatility has been extreme.
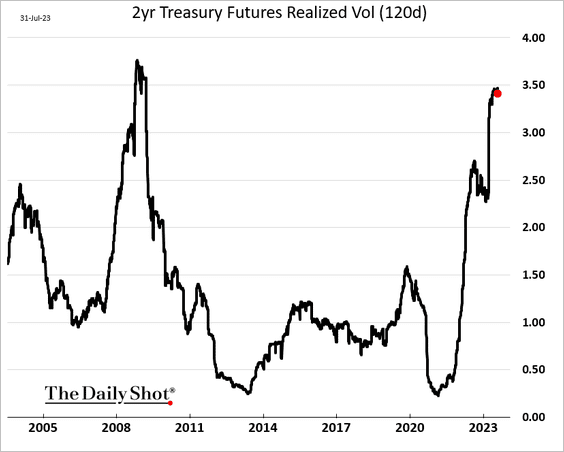
 Source: LPL Research
——————–
4. The magnitude of the current Treasury yield curve inversion is unprecedented. According to Research Affiliates, this could increase the likelihood of a hard landing.
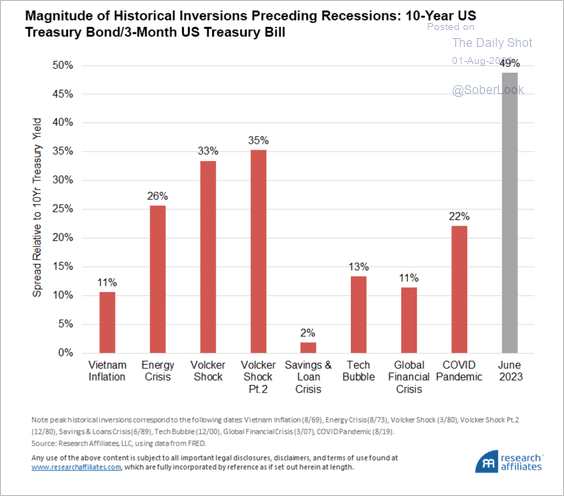 Source: Research Affiliates Read full article
• How long will the yield curve stay inverted? (2 charts)
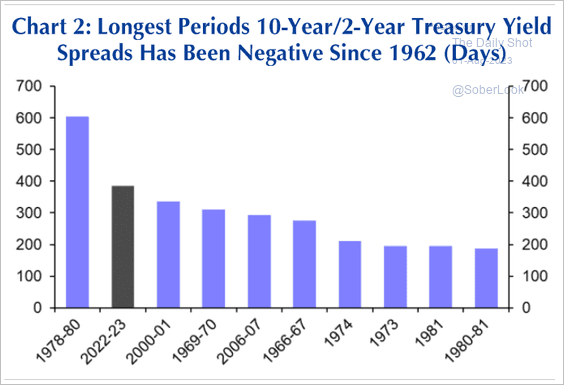 Source: Capital Economics
 Source: Capital Economics
• Improving momentum points to a steepening 10s/2s Treasury curve.
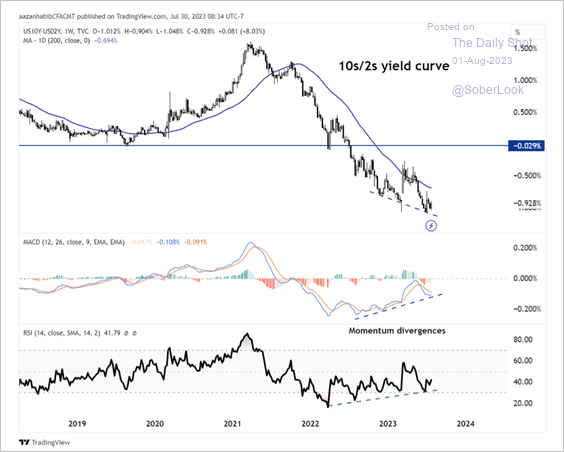 Source: Aazan Habib, Paradigm Capital
——————–
4. The iShares 20+ Year Treasury Bond ETF (TLT) is entering a seasonally strong month.
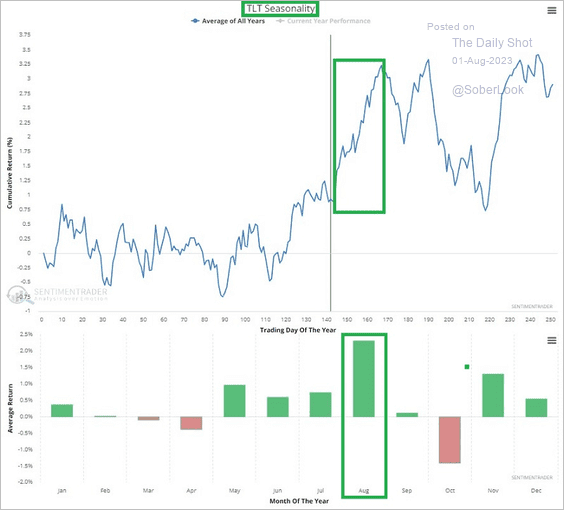 Source: @jaykaeppel
5. TIPS flows finally turned positive last week.
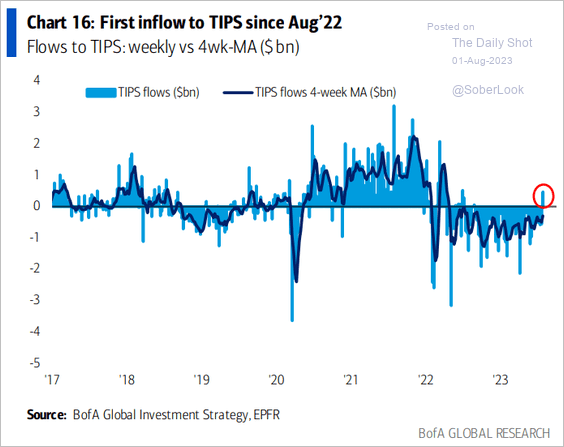 Source: BofA Global Research
Back to Index
Global Developments
1. China has been exporting disinflation (2 charts).
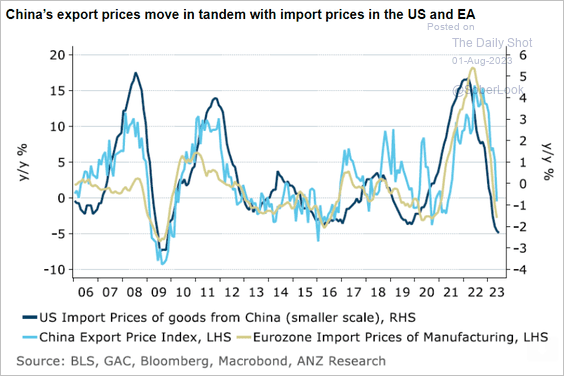 Source: @ANZ_Research
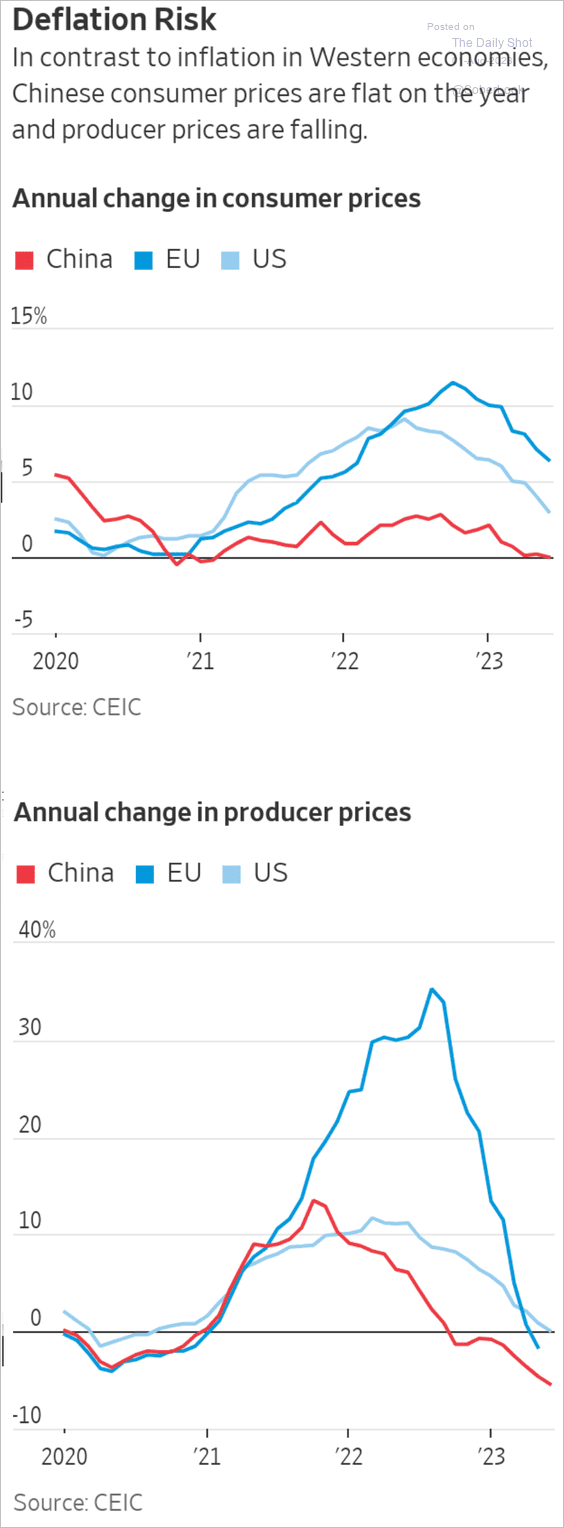 Source: @WSJ Read full article
——————–
2. Speculators are boosting their bets against the US dollar.
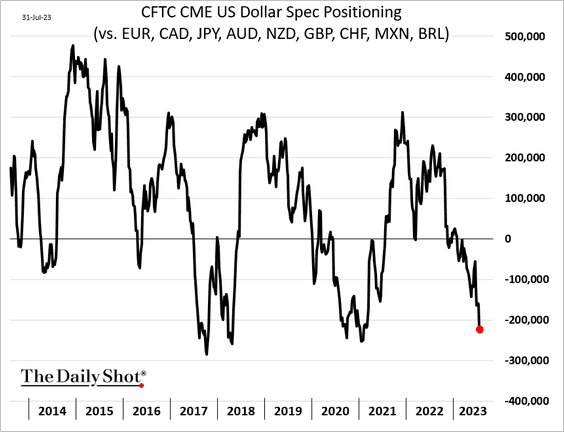
• BCA Research sees the US dollar as overvalued.
 Source: BCA Research
——————–
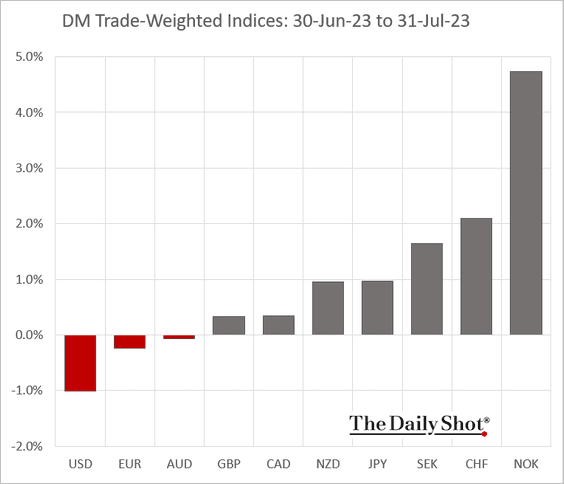
3. Next, we have some DM performance data for July.
• Currency indices:
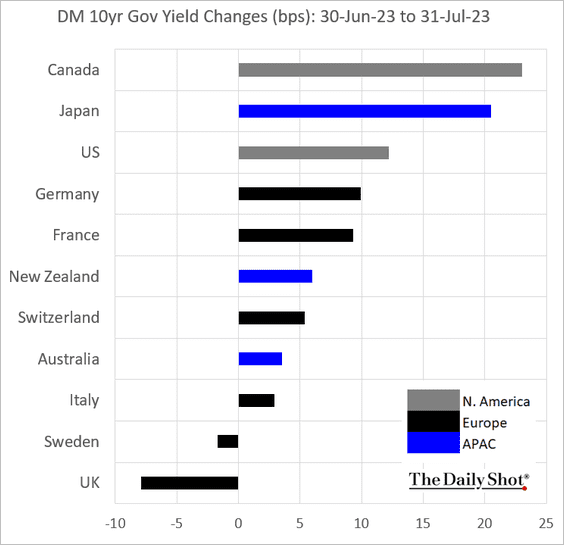
• Bond yields:
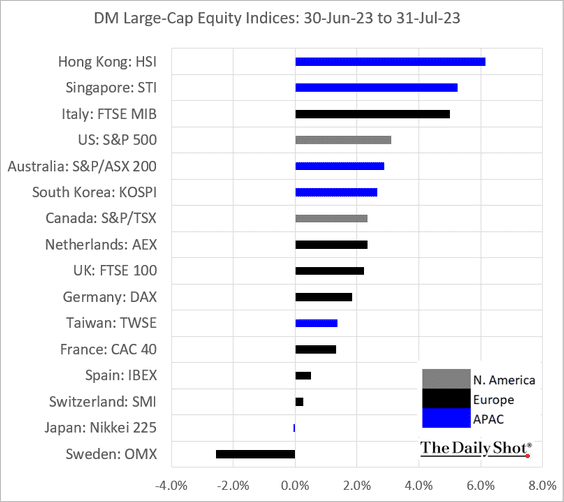
• Equities:
——————–
Food for Thought
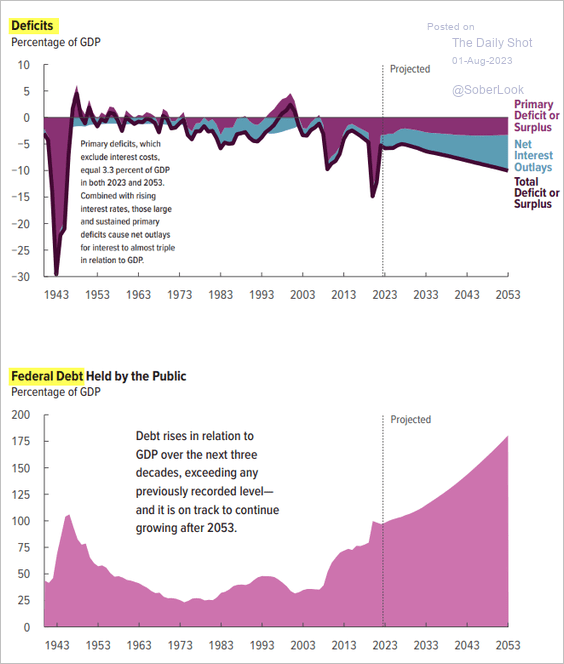
1. Projected US federal deficit and debt:
 Source: CBO
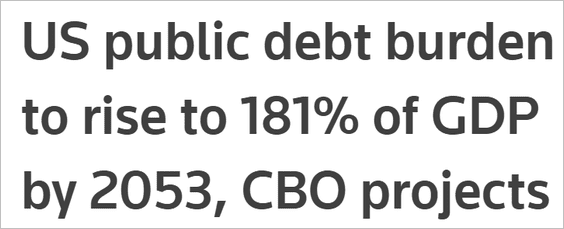 Source: Reuters Read full article
——————–
2. Southward migration:
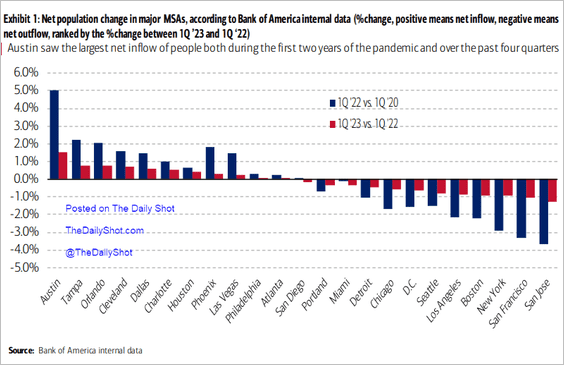 Source: Bank of America Institute
3. Pedestrian traffic fatality rates:
 Source: @axios Read full article
4. Projected air conditioner usage globally:
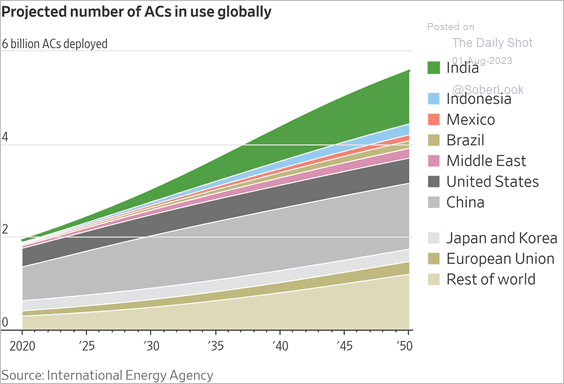 Source: @WSJ Read full article
5. Abortion status:
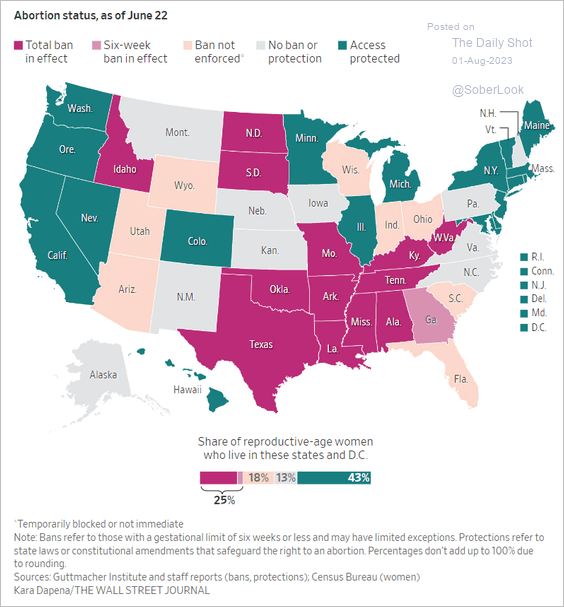 Source: @WSJ Read full article
6. Pride in being American:
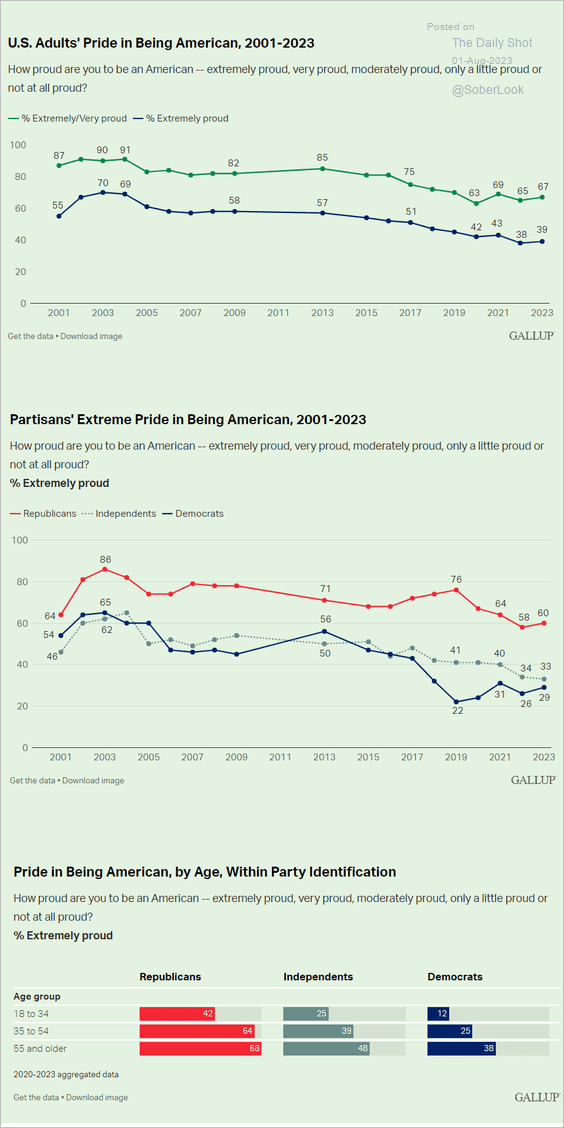 Source: Gallup Read full article
7. Executions in 2022:
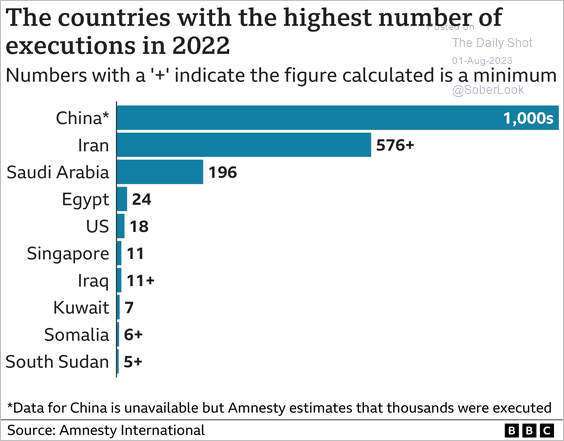 Source: BBC Read full article
8. Job ads with signing bonuses in the US:
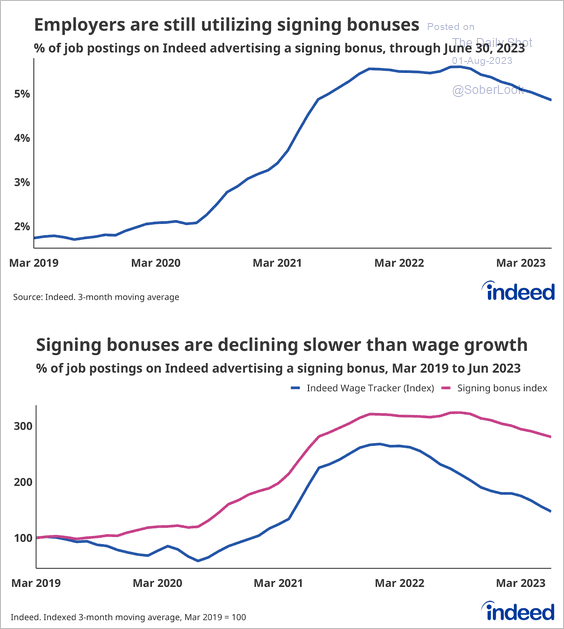 Source: Indeed
9. Asteroid flybys:
 Source: Statista
——————–
Back to Index