
The Daily Shot: 07-Aug-23
• The United States
• Canada
• The United Kingdom
• The Eurozone
• China
• Emerging Markets
• Cryptocurrency
• Commodities
• Energy
• Equities
• Credit
• Rates
• Global Developments
• Food for Thought
The United States
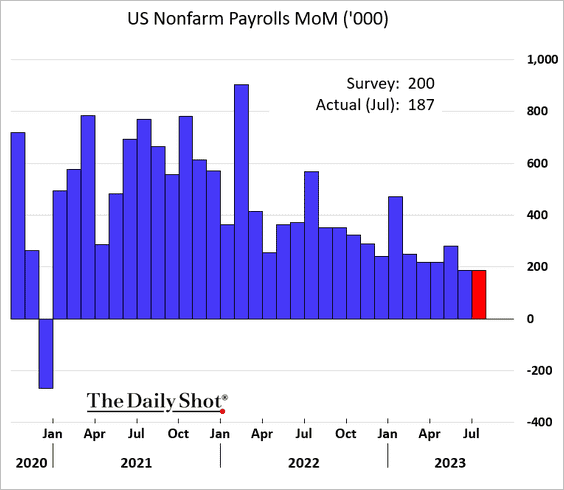
1. The July payrolls report confirmed the downward trend in US employment growth, coming in well below forecasts.
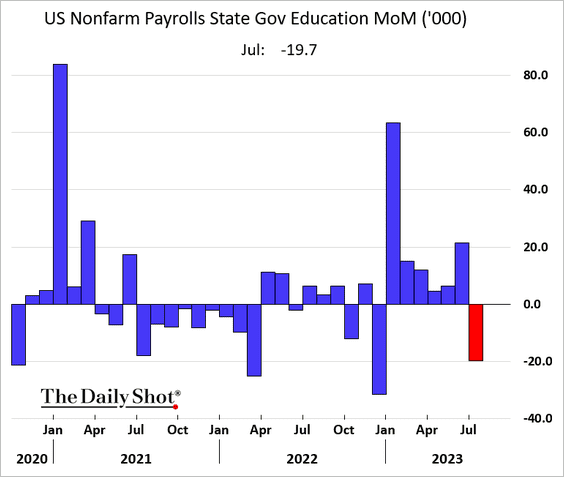
However, the data miss wasn’t as severe as the headline figures suggest. A relatively large decline in state-level employment of educators was a key contributor. Substantial seasonal adjustments to this index tend to make it volatile.
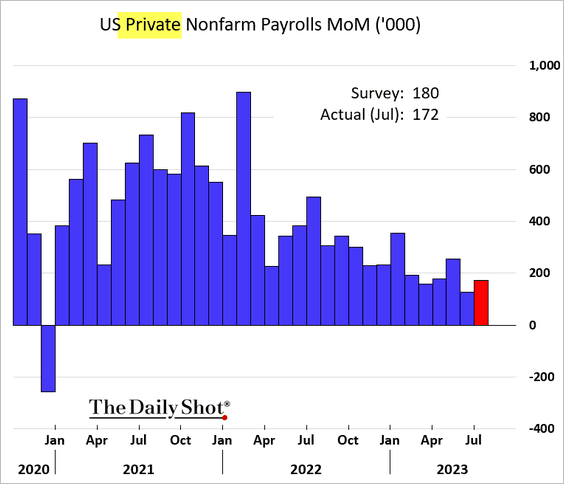
Private employment was almost in line with forecasts.
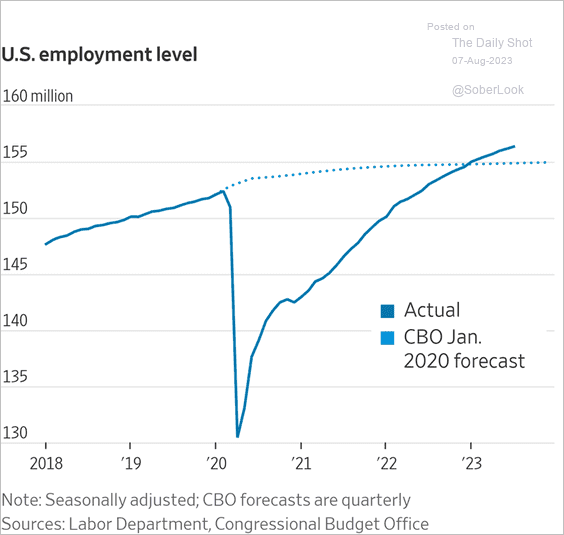
• Total employment remains below the pre-COVID trend, …
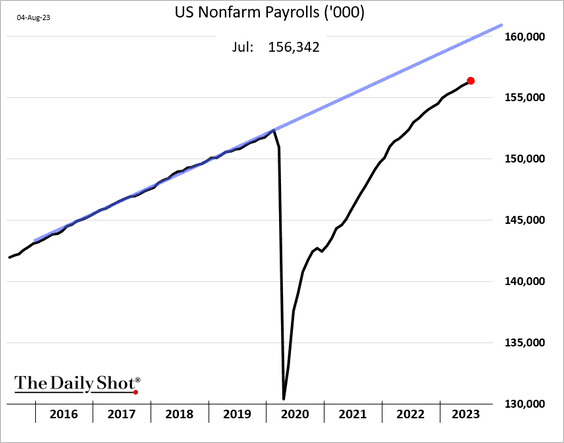
… but above the 2020 CBO forecast.
 Source: @WSJ Read full article
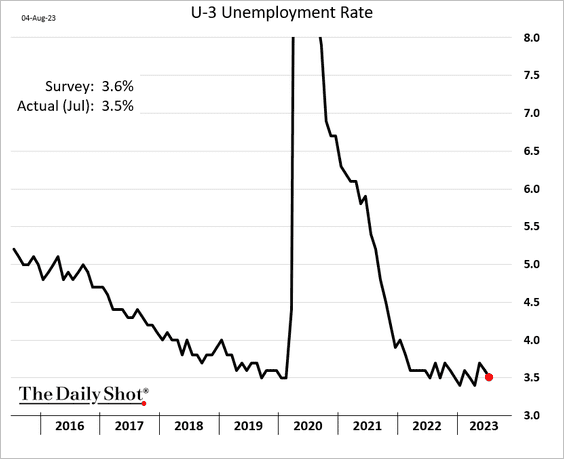
• The unemployment rate declined, suggesting that the labor market remains tight.
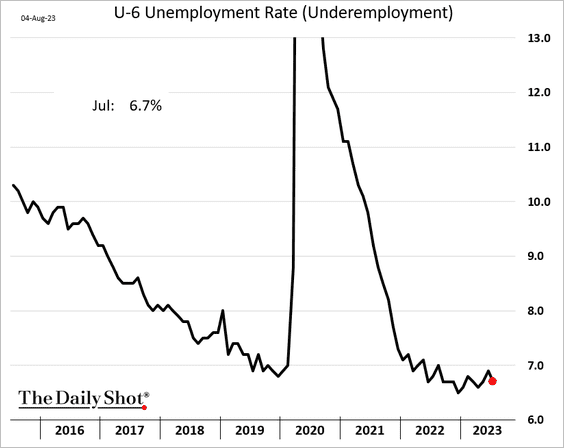
Here is the underemployment index.
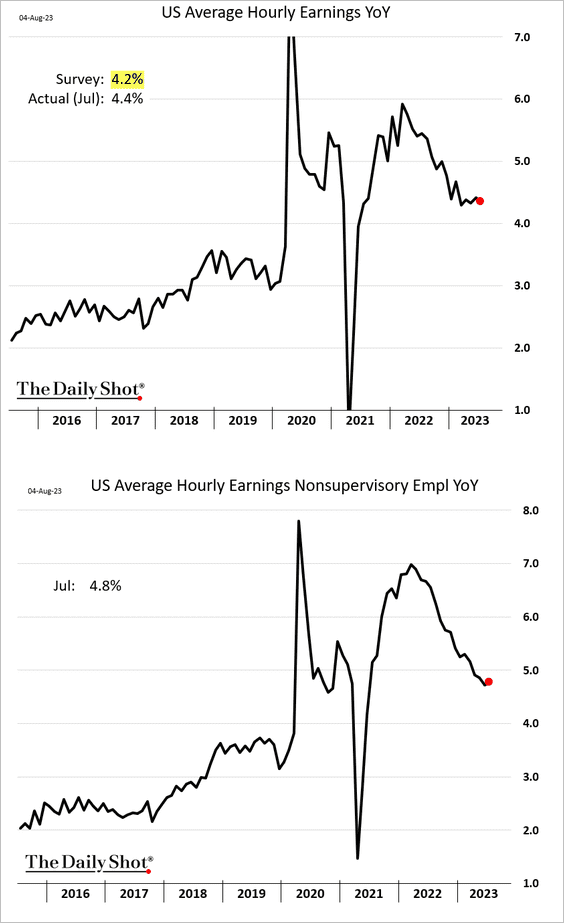
• Wage growth topped expectations, holding above 4%.
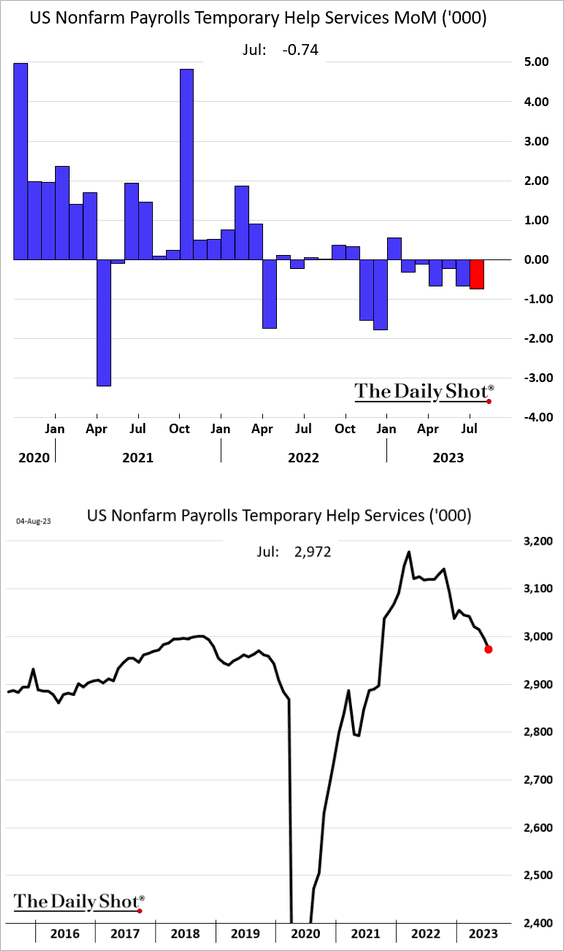
• Temp employment continues to decline.
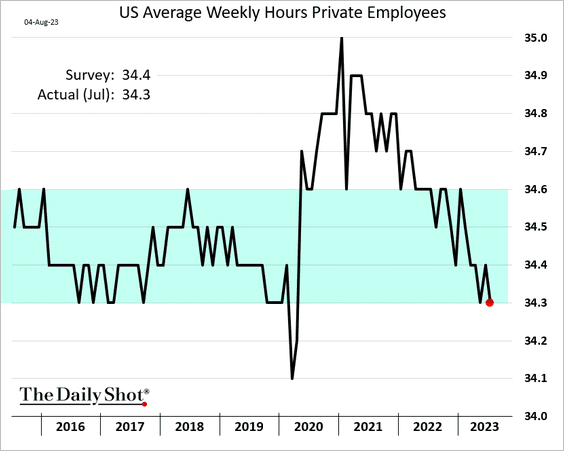
• Weekly hours worked hit the low end of the pre-COVID range.
We will have more updates on the July employment report tomorrow.
——————–
2. Activity at Amazon’s fulfillment centers points to sluggish consumer demand.
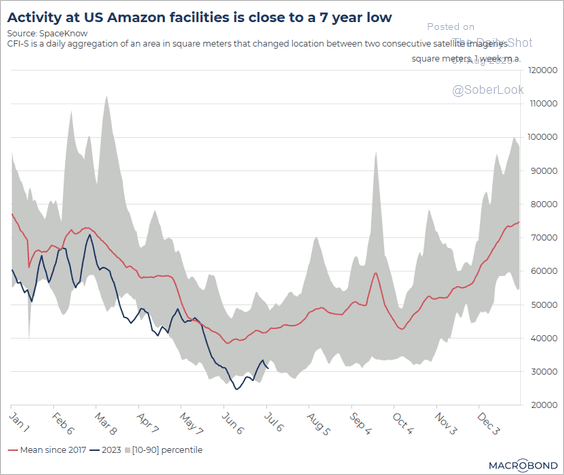 Source: Macrobond
3. US gasoline prices have risen quickly in recent days. This trend is going to hit consumer sentiment and inflation expectations in August.
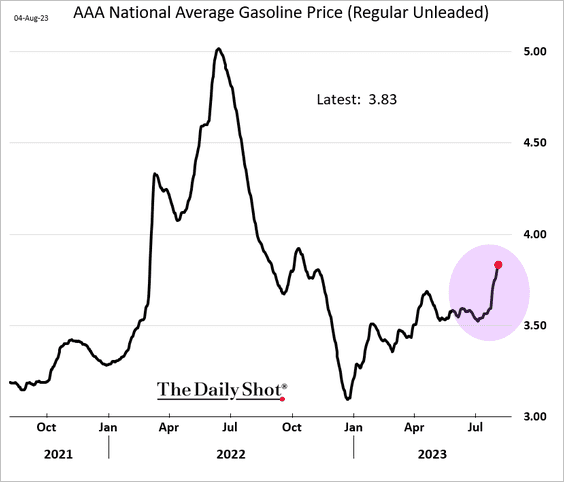
We already see signs of a pullback in sentiment in the Penta-CivicScience indicator.
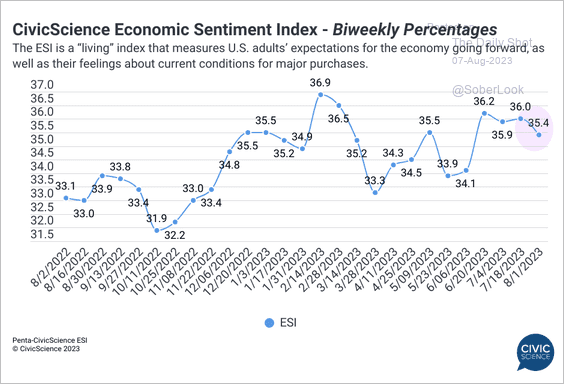 Source: @CivicScience Read full article
Back to Index
Canada
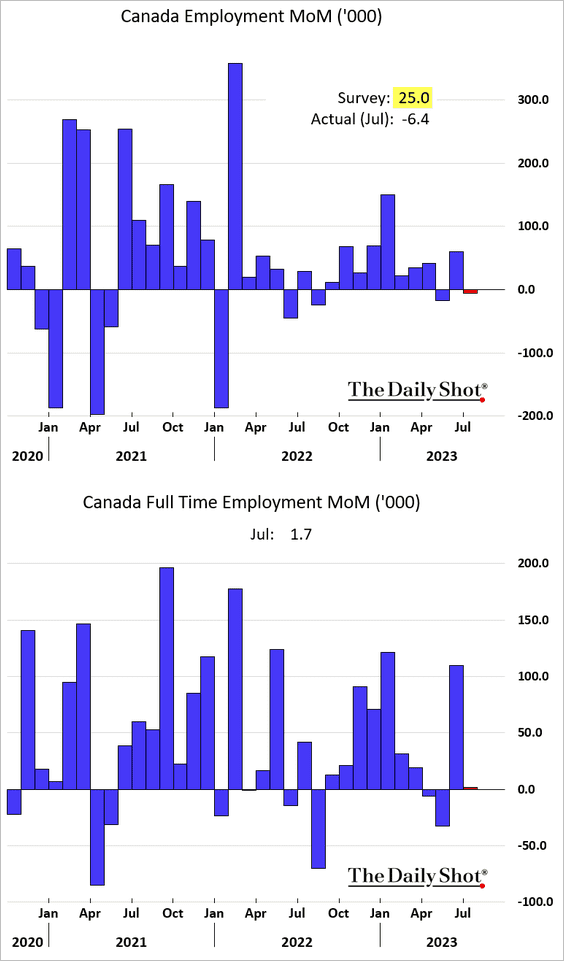
1. Canada unexpectedly lost jobs in July.
 Source: Reuters Read full article
• The construction sector saw a substantial employment decline.
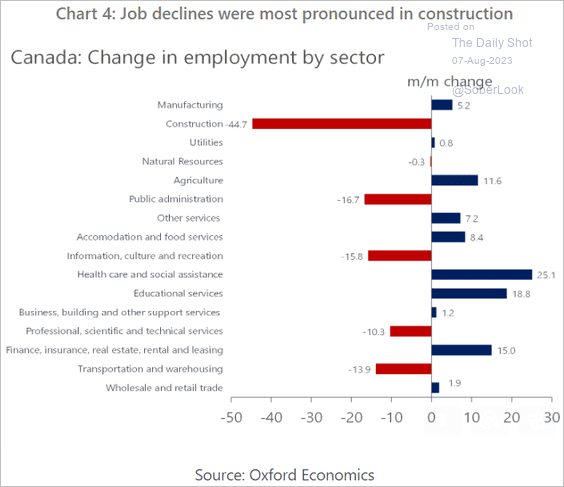 Source: Oxford Economics
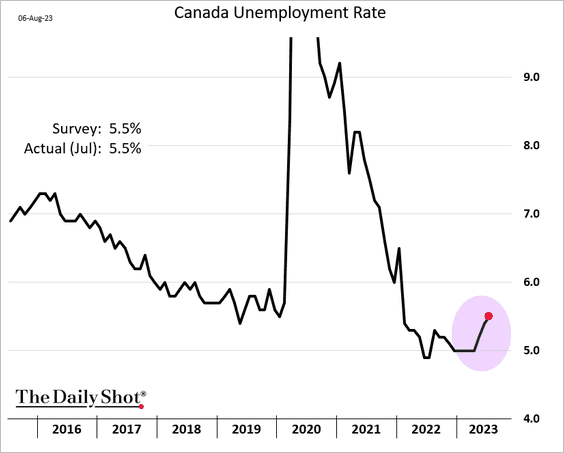
• The unemployment rate has been rising.
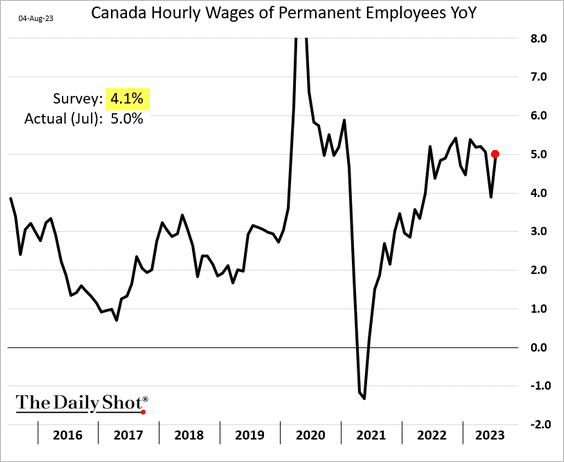
• Wage growth re-accelerated in July.
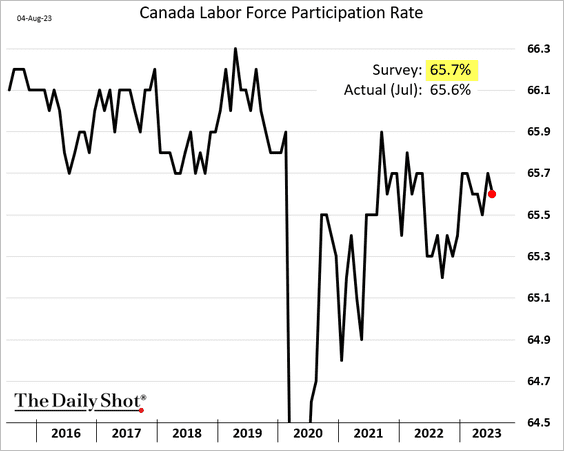
• The participation rate declined.
——————–
2. Work stoppages have been elevated this year.
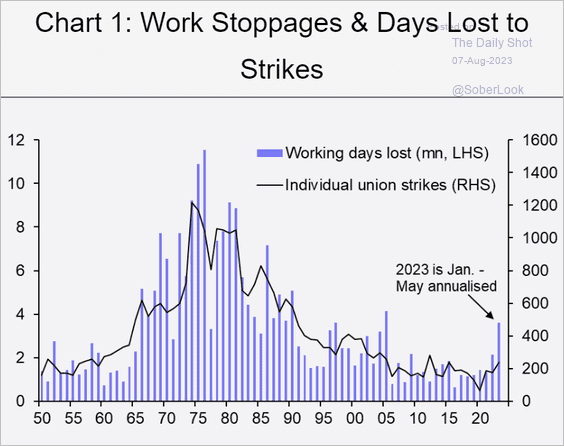 Source: Capital Economics
3. The Ivey PMI showed activity contracting in July.
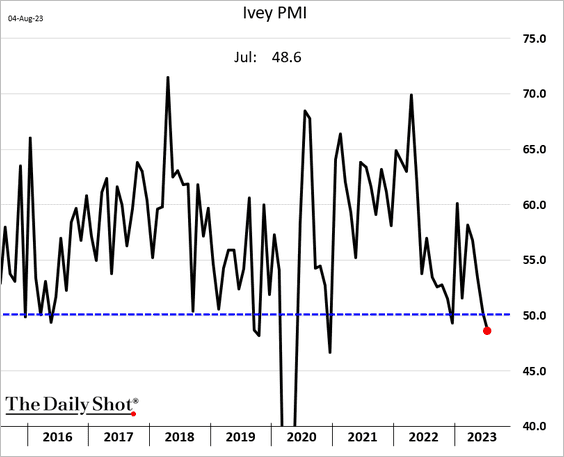
 Source: Reuters Read full article
Back to Index
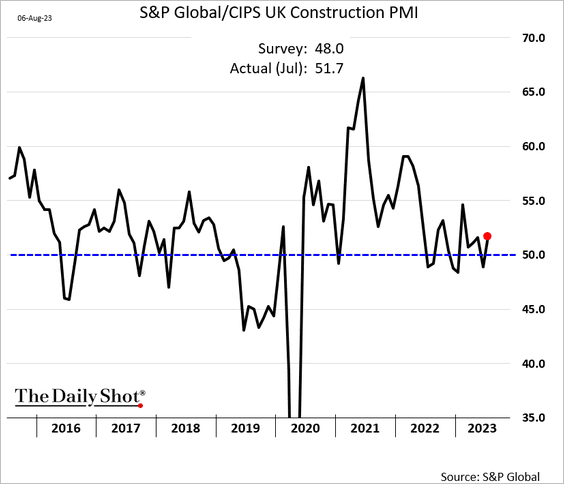
The United Kingdom
1. Construction activity shifted to growth mode last month.
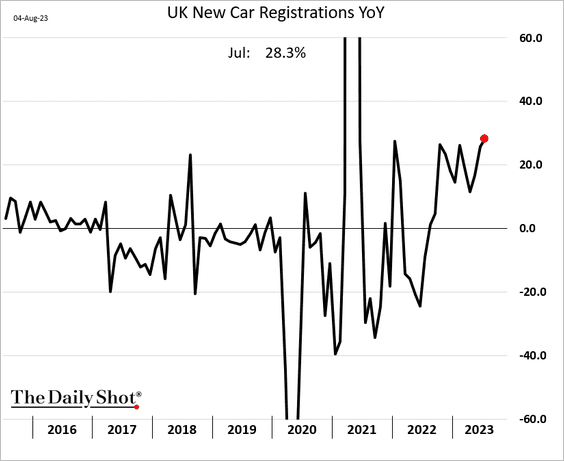
2. New car registrations are up 28% vs. last year.
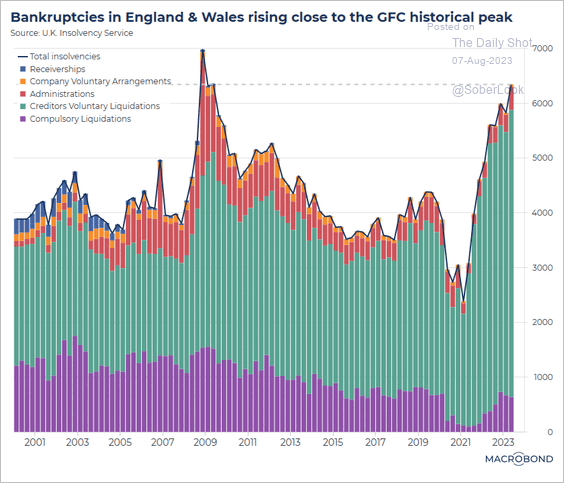
3. Bankruptcies have been rising.
 Source: Macrobond
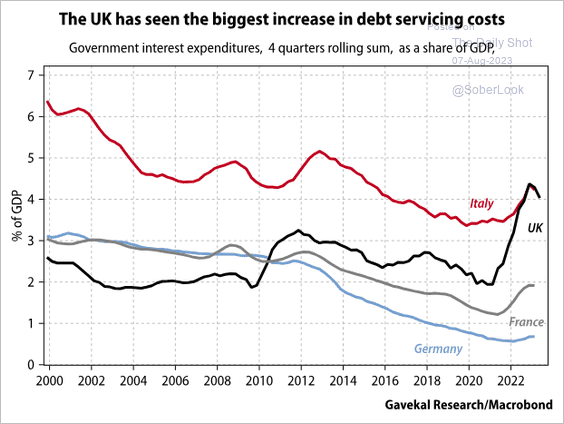
4. Government debt service costs are elevated.
 Source: Gavekal Research
Back to Index
The Eurozone
1. Germany’s manufacturing orders weren’t as robust as the headline figures suggested (see chart).
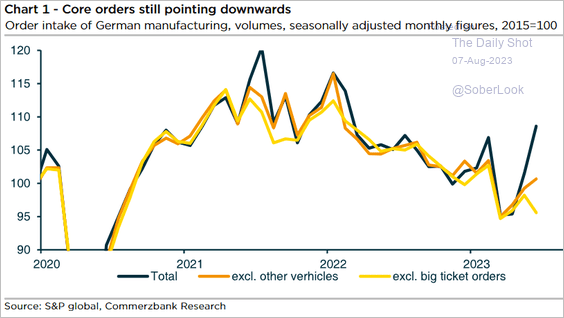 Source: Commerzbank Research
– Companies now see their industrial order backlog as too small.
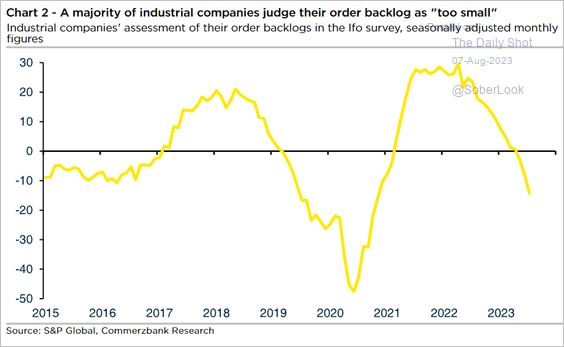 Source: Commerzbank Research
• Germany’s industrial production declined in June, missing expectations.
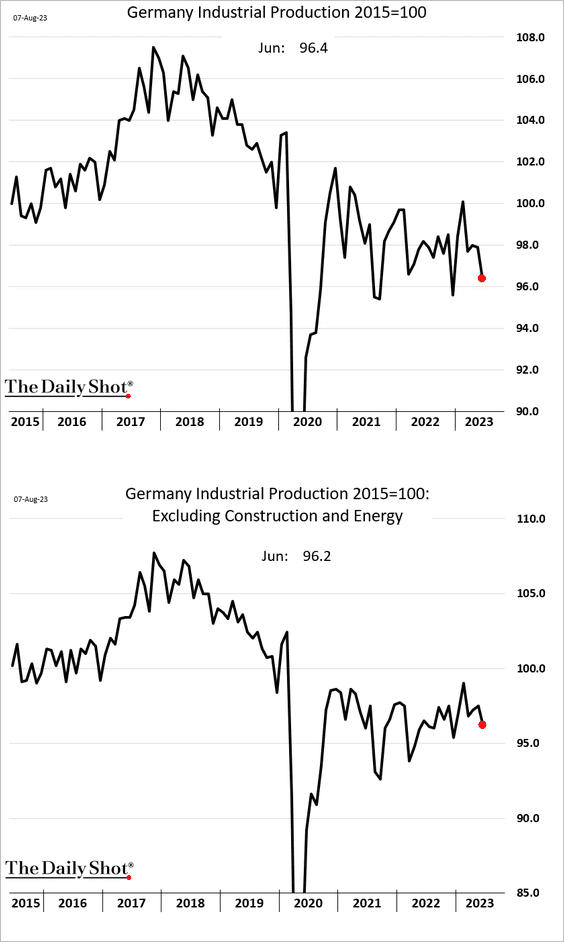
 Source: @WSJ Read full article
——————–
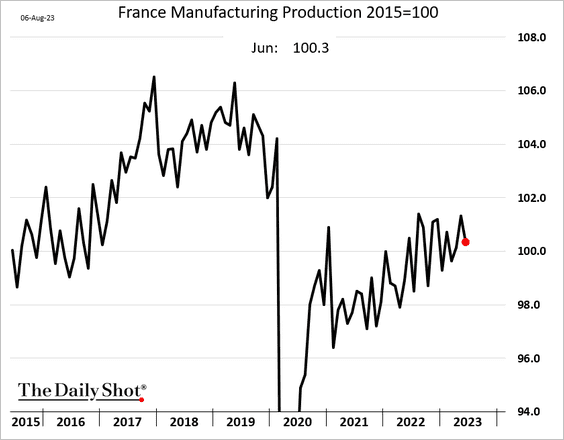
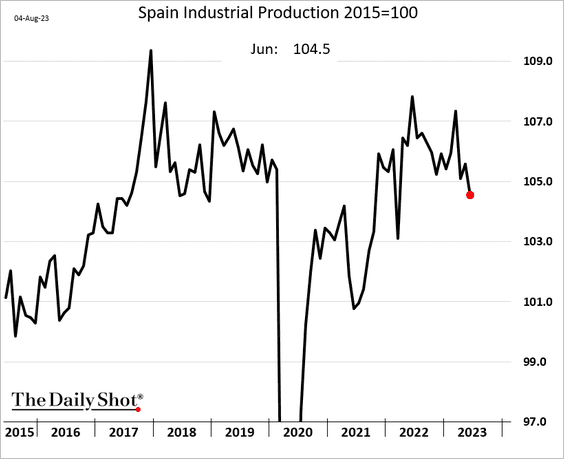
2. Industrial output reports elsewhere were mixed.
• France manufacturing output:
• Spain:
• Italy (another gain):
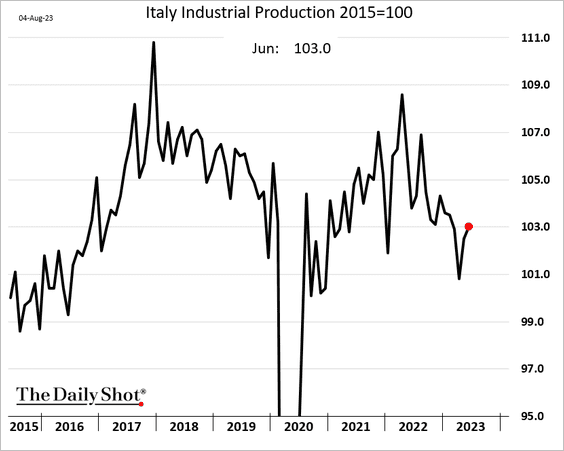
But Italy’s industrial production faces downside risks.
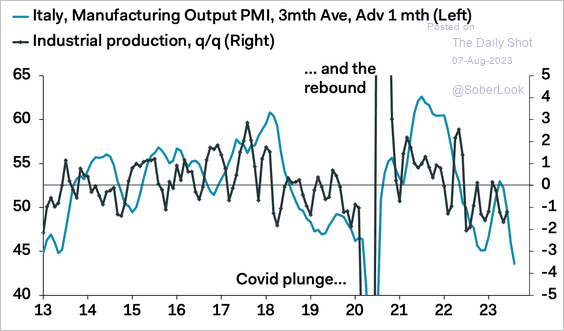 Source: Pantheon Macroeconomics
——————–
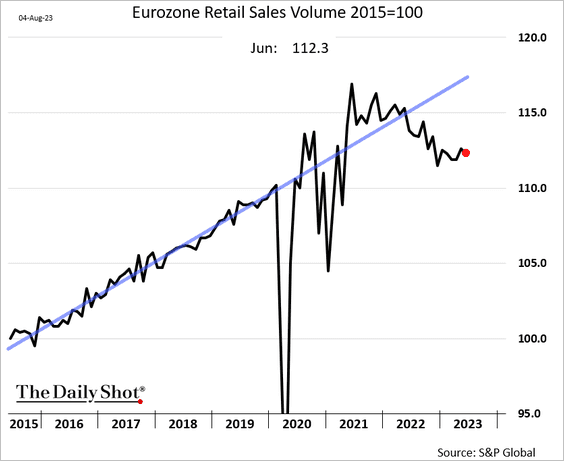
3. Euro-area retail sales edged lower in June.
Back to Index
China
1. The term spread narrowed close to last year’s levels when growth was disrupted by lockdowns. Further rate cuts are needed to meaningfully lower yields.
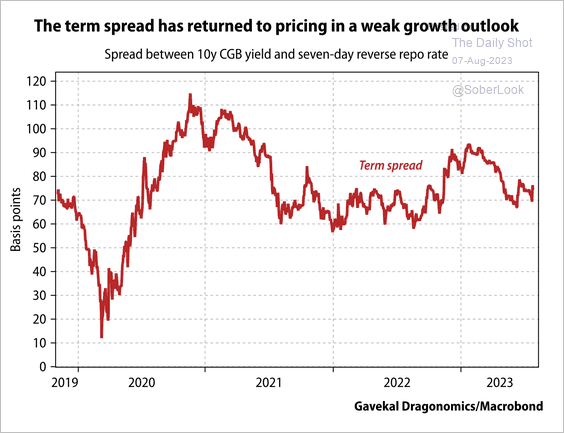 Source: Gavekal Research
2. It takes an increasingly larger investment to achieve the same level of output.
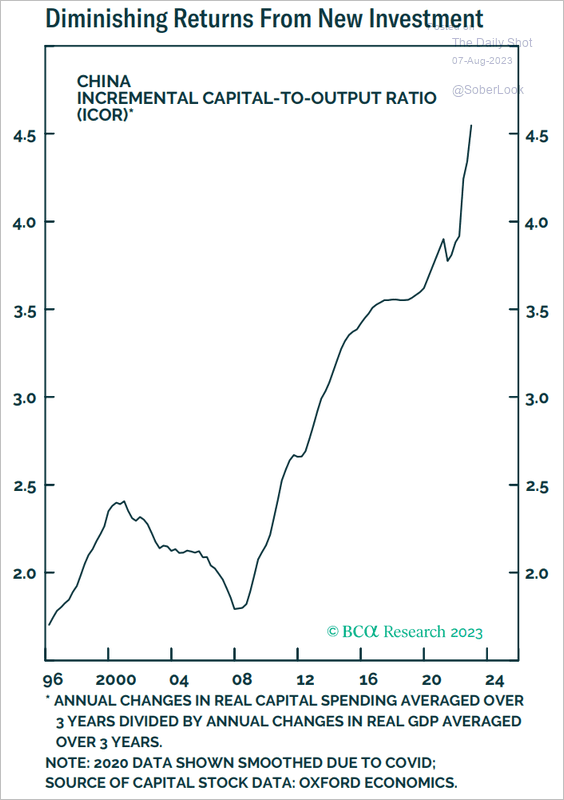 Source: BCA Research
3. Job postings have been trending lower.
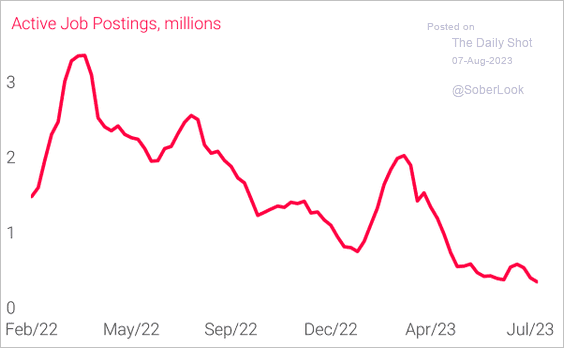 Source: TS Lombard
Back to Index
Emerging Markets
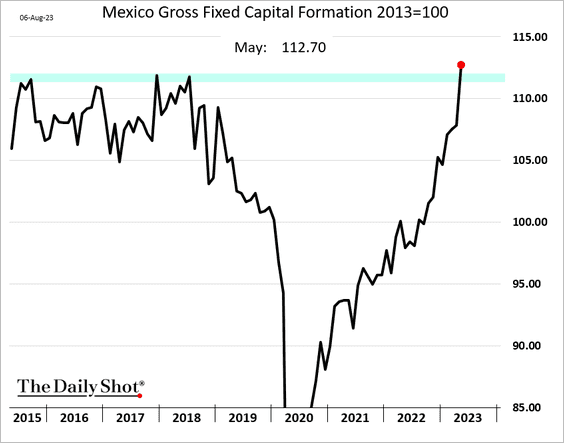
1. Mexico’s vehicle exports hit a multi-year high for this time of the year.
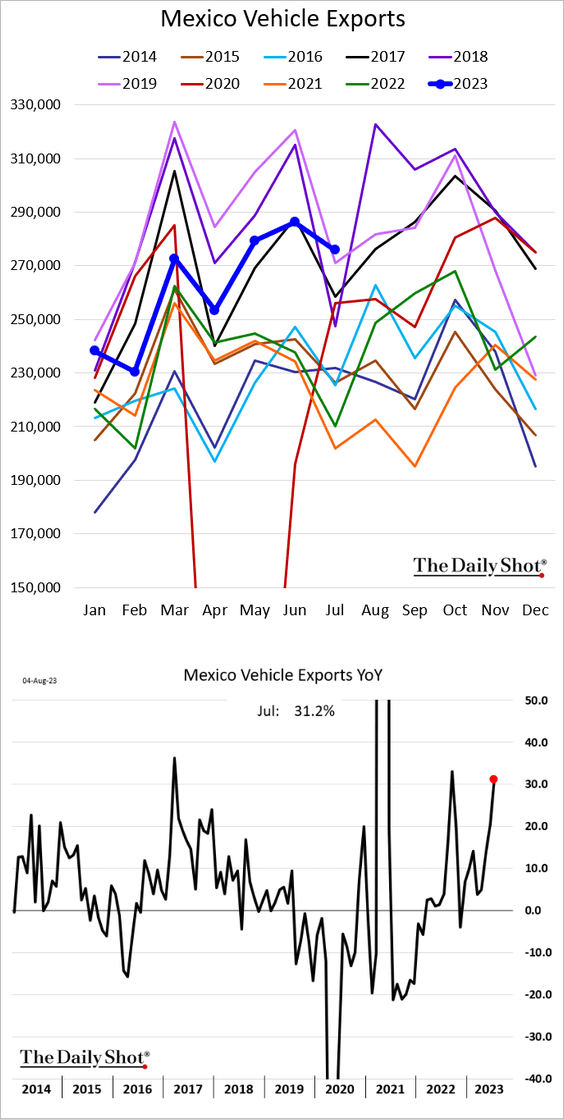
Business investment has been rising.
——————–
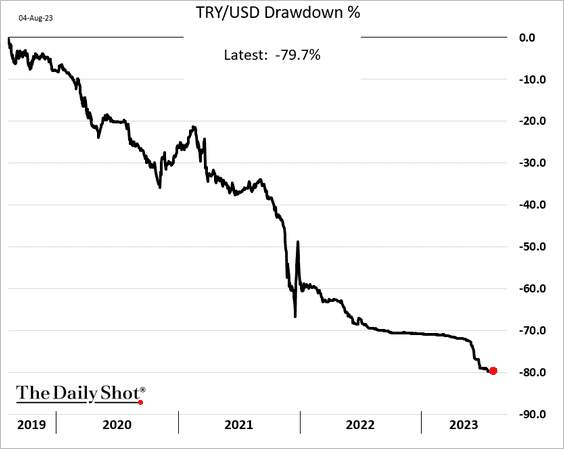
2. The Turkish lira has lost 80% of its value over the past four years.
3. Further dollar weakness could benefit EM equities relative to the rest of the world.
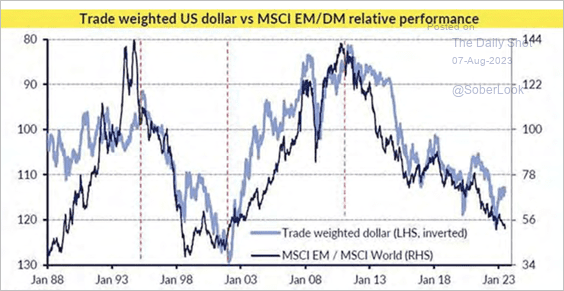 Source: CLSA
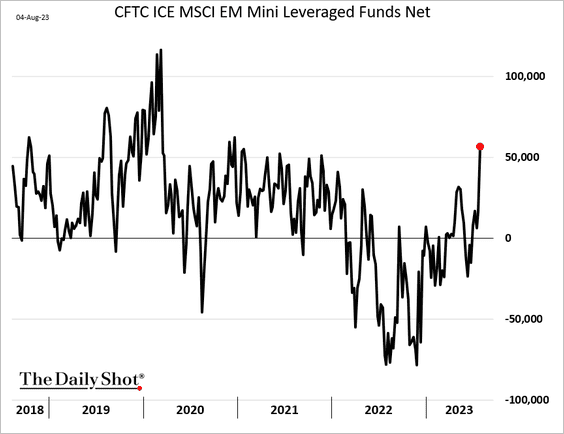
4. Hedge funds boosted their bets on EM equity futures last week.
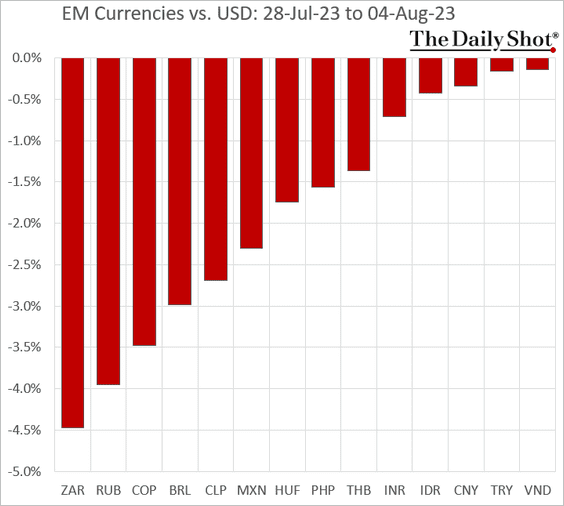
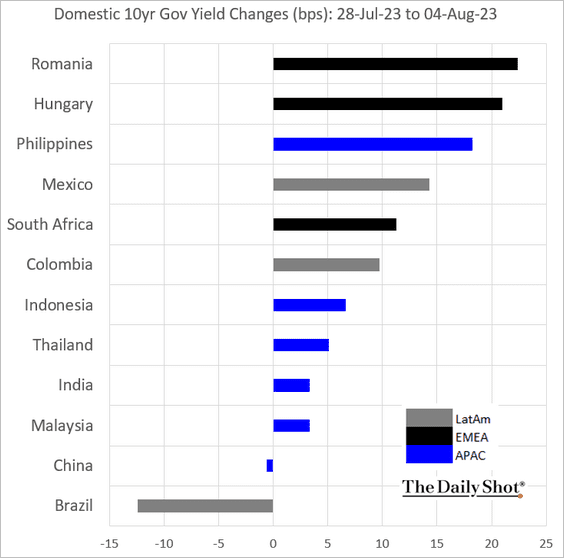
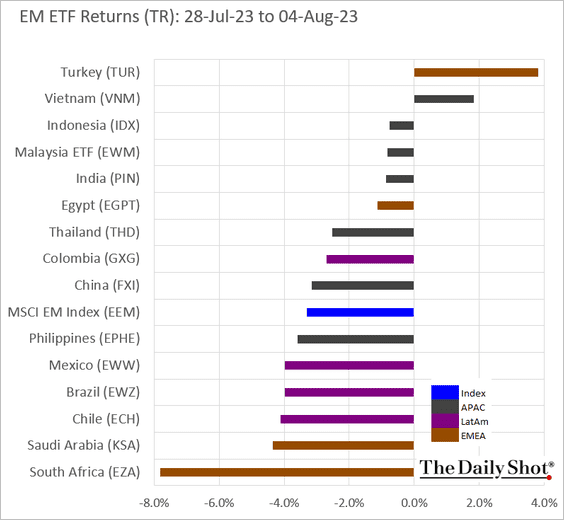
5. Next, we have some performance data from last week.
• Currencies:
• Bond yields:
• Equity ETFs:
Back to Index
Cryptocurrency
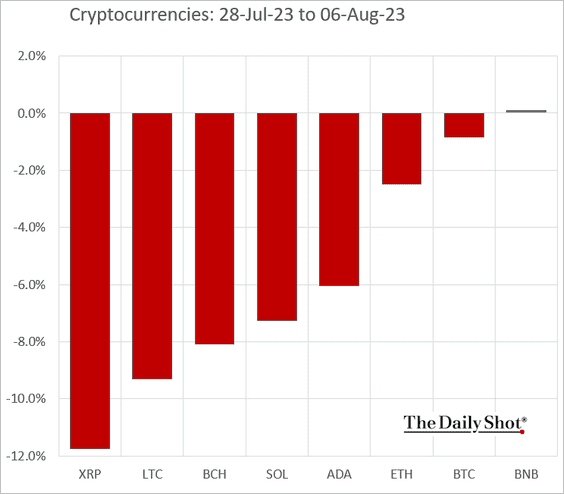
1. It was a tough week for cryptos, with litecoin and XRP underperforming top peers.
2. Bitcoin addresses with a non-zero balance reached a new all-time high.
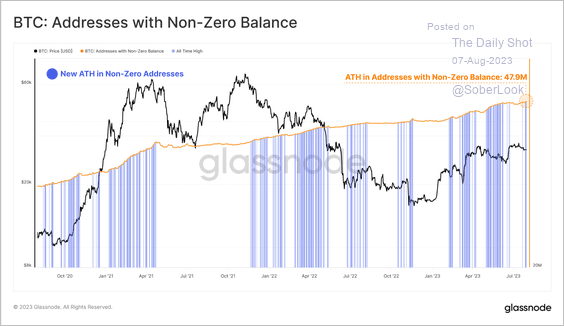 Source: @glassnode
3. Coinbase’s market share has grown since going public in April 2021.
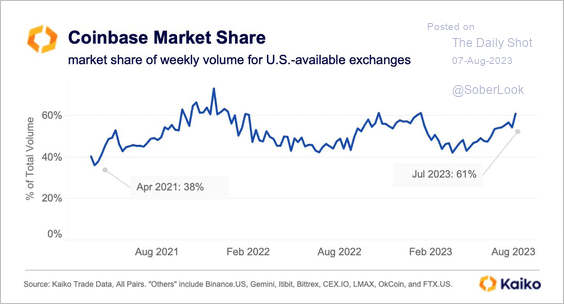 Source: @KaikoData
4. Crypto exchanges experienced a drop in trading volume this year, especially Bittrex and Binance.
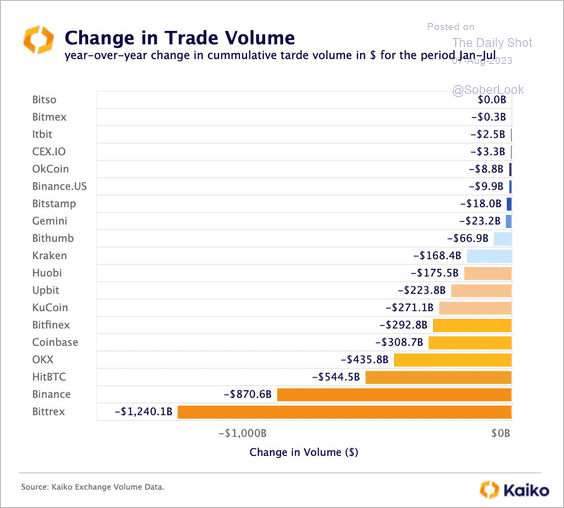 Source: @KaikoData
5. ProShares is the latest firm to file for a crypto ETF.
 Source: CoinDesk Read full article
Back to Index
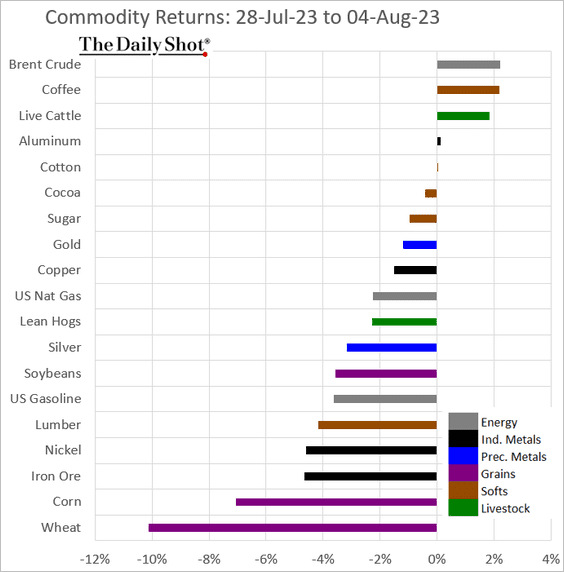
Commodities
Here is last week’s performance across key commodity markets.
Back to Index
Energy
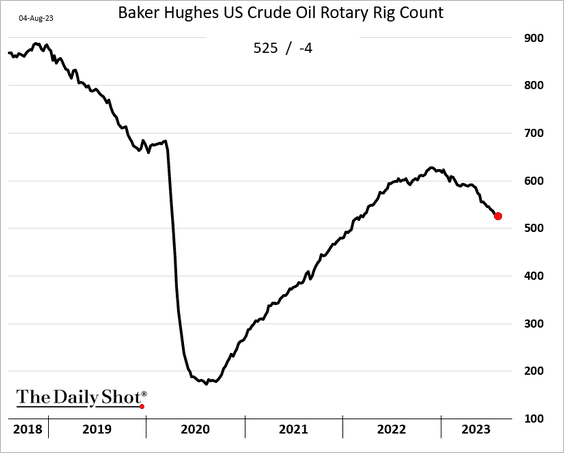
1. US rig count continues to trend lower.
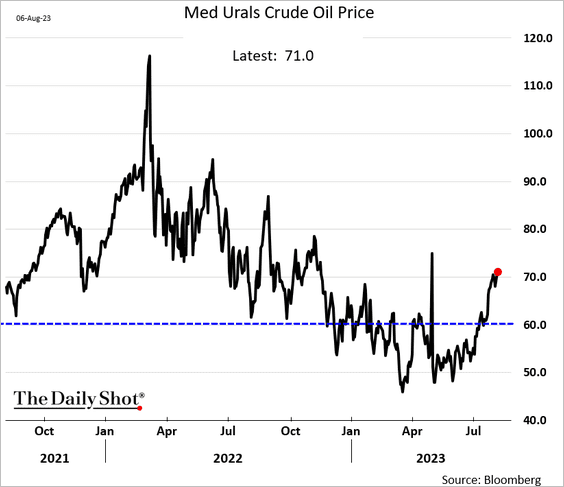
2. Russian crude oil trades above the G7 price cap.
3. Oil implied vol isn’t responding to higher equity vol.
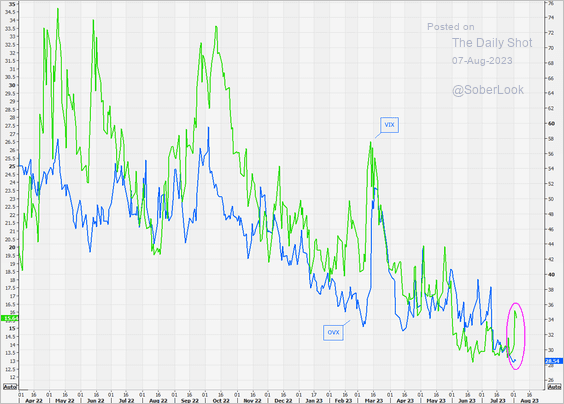 Source: @themarketear
Back to Index
Equities
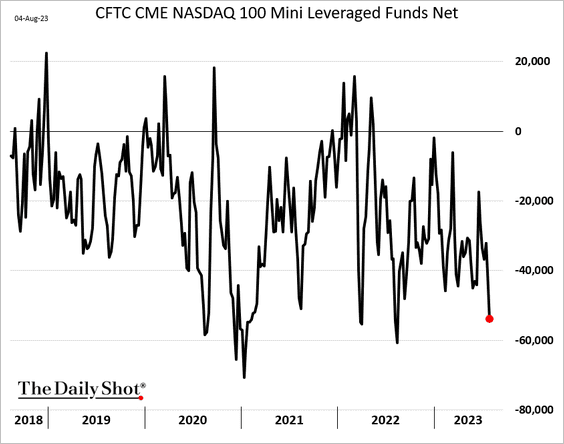
1. Hedge funds boosted their bets against Nasdaq futures last week.
2. Consumers have been increasingly bullish on stocks, although sentiment is not yet extreme.
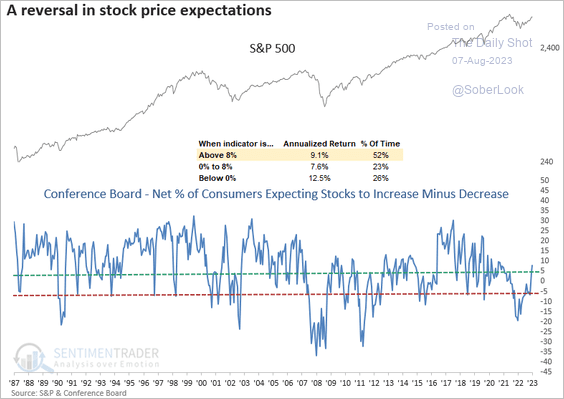 Source: SentimenTrader
3. This chart shows average returns after 5-straight months of gains in the S&P 500.
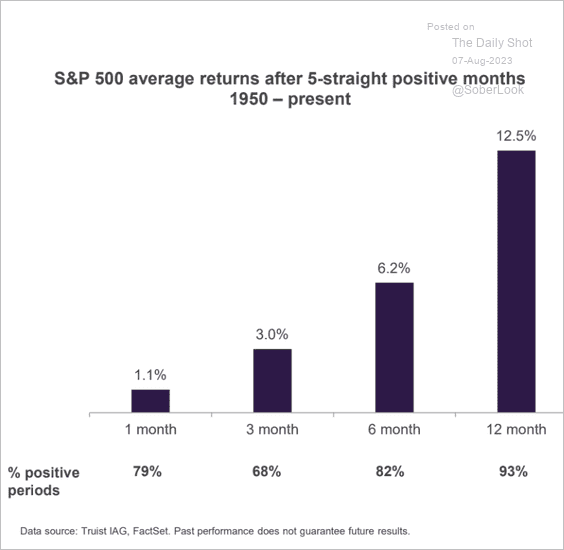 Source: Truist Advisory Services
4. Numera Analytics sees a low chance of a sharp drop in S&P 500 real earnings despite expectations for stagnant economic growth over the next 12 months. (2 charts)
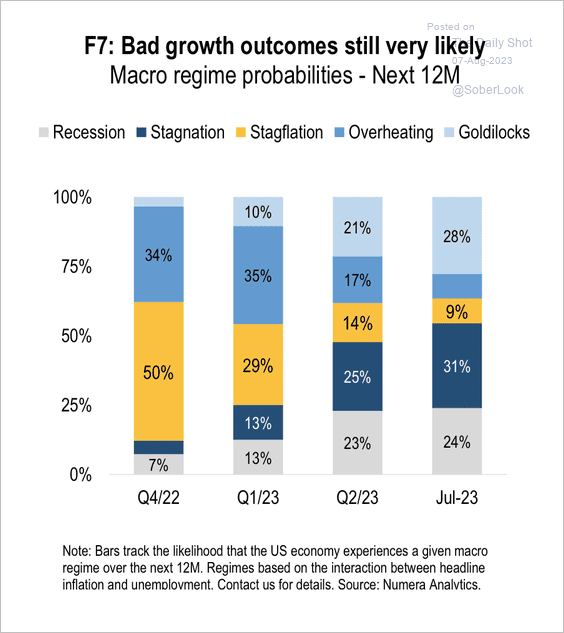 Source: Numera Analytics (@NumeraAnalytics)
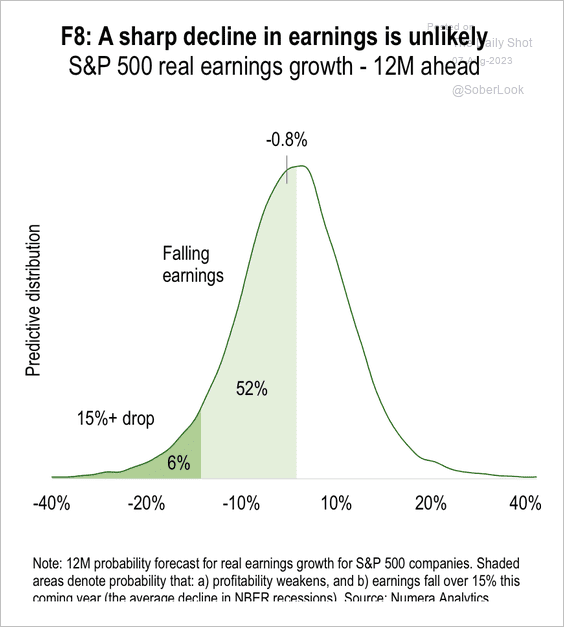 Source: Numera Analytics (@NumeraAnalytics)
——————–
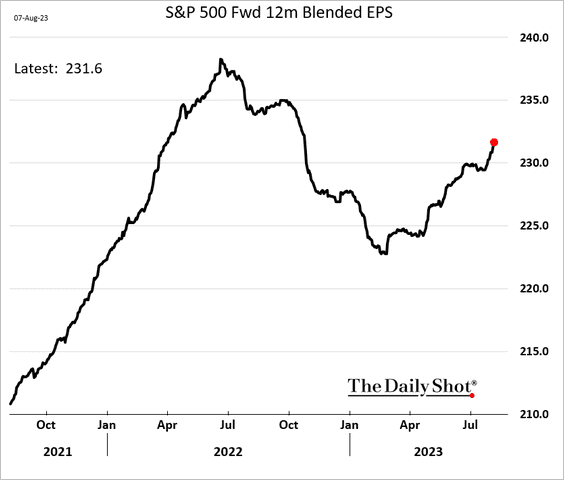
5. The S&P 500 12-month forward earnings estimates are climbing.
• This chart illustrates the relationship between the US nominal GDP growth and S&P 500 revenue per share.
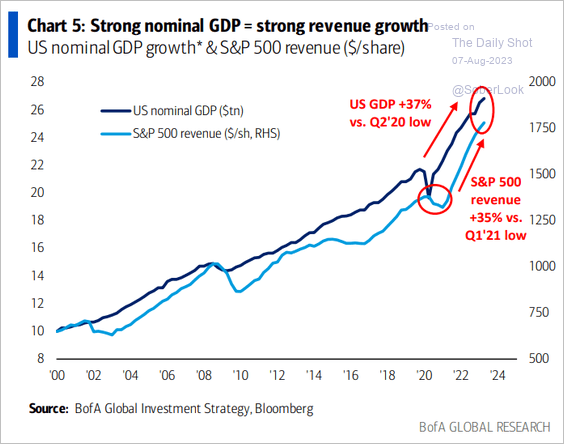 Source: BofA Global Research
——————–
6. Technical indicators show that global equity markets’ outperformance vs. bonds is stretched.
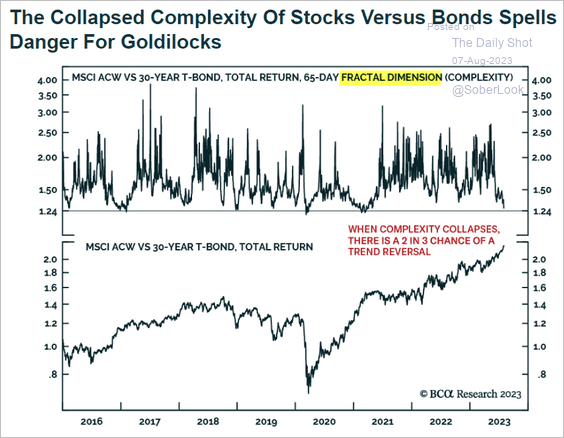 Source: BCA Research
7. Over the long term, a small percentage of US companies create most of the aggregate wealth in the stock market.
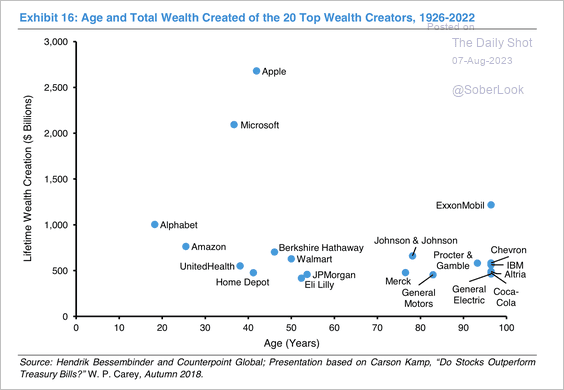 Source: Morgan Stanley Research
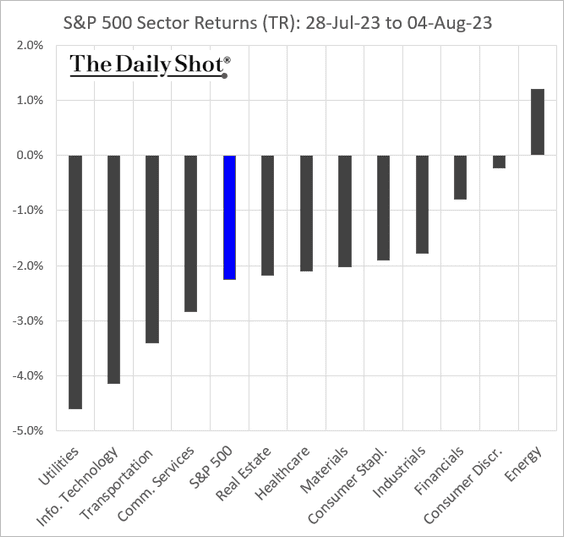
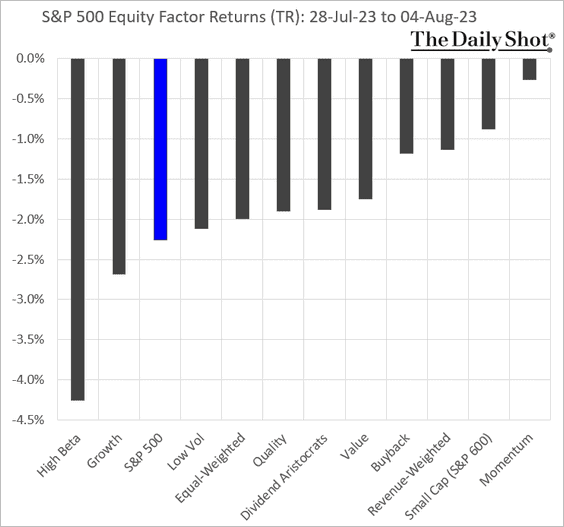
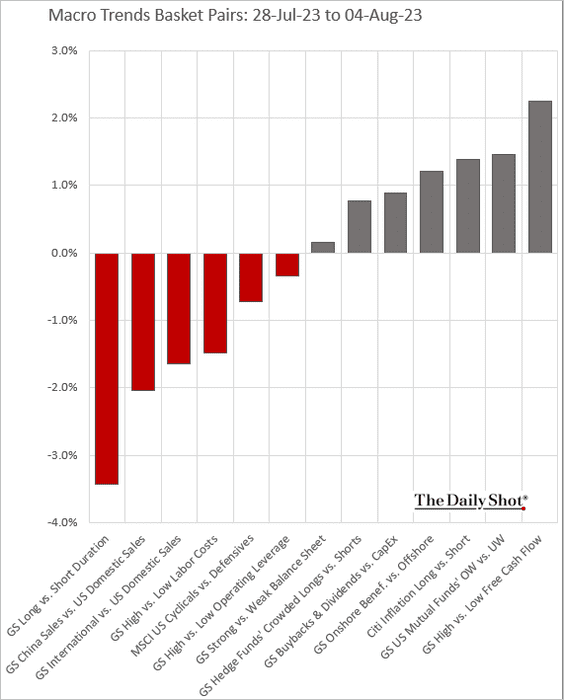
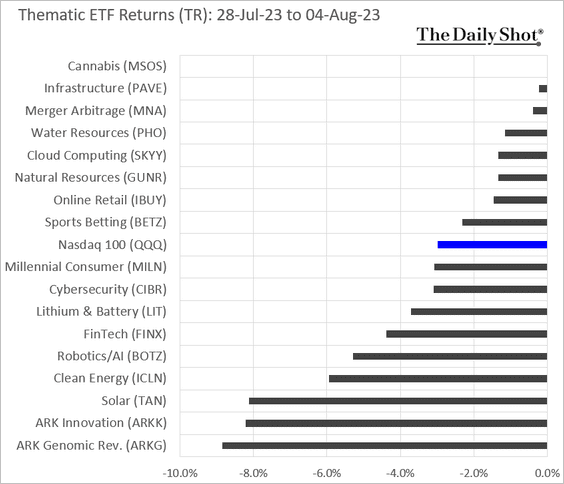
8. Next, we have some performance data from last week.
• Sectors:
• Equity factors:
• Macro basket pairs’ relative performance:
• Thematic ETFs:
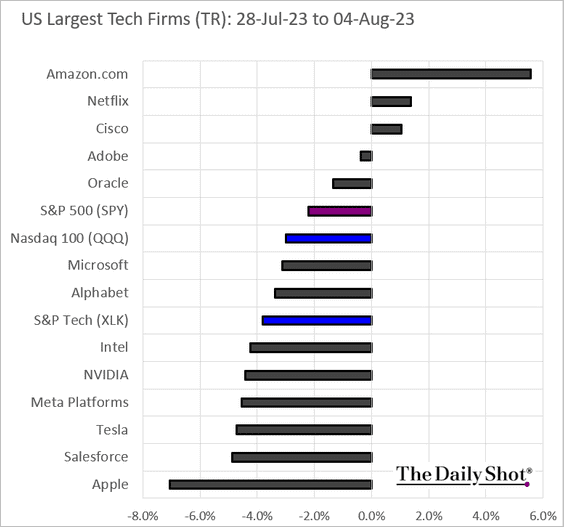
• Largest US tech firms:
Back to Index
Credit
1. S&P recently issued the highest number of corporate downgrades since Q2 2020.
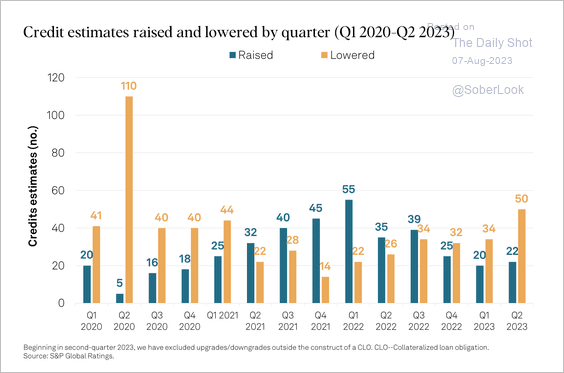 Source: S&P Global Ratings
About 43% of companies reviewed in the first half of this year generated negative free operating cash flow after applying high benchmark rates. According to S&P, this also reflects companies continuing to invest in capital expenditures.
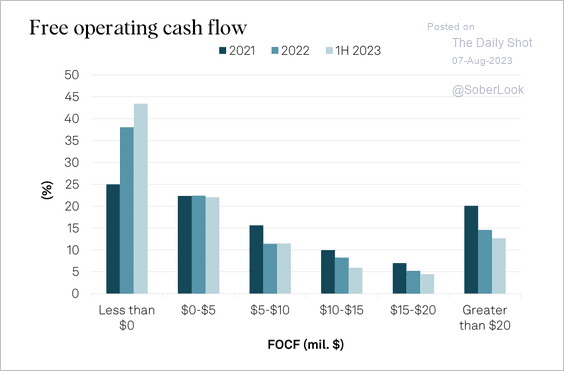 Source: S&P Global Ratings
——————–
2. Corporate bond index durations have been falling due to higher yields and slower issuance.
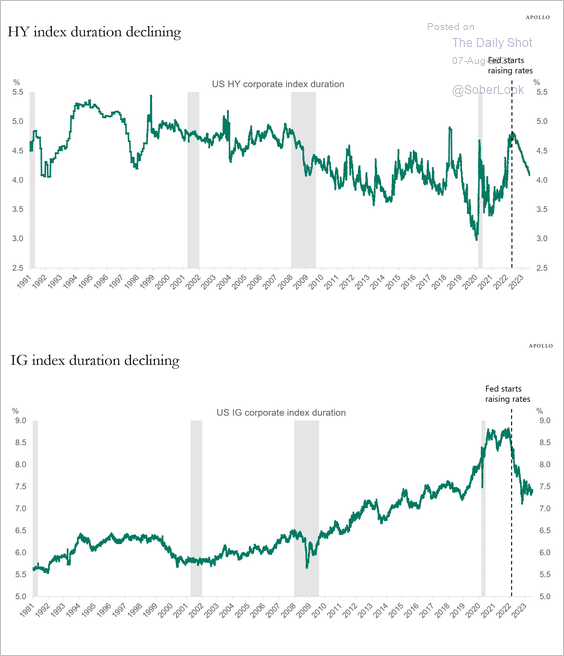 Source: Torsten Slok, Apollo
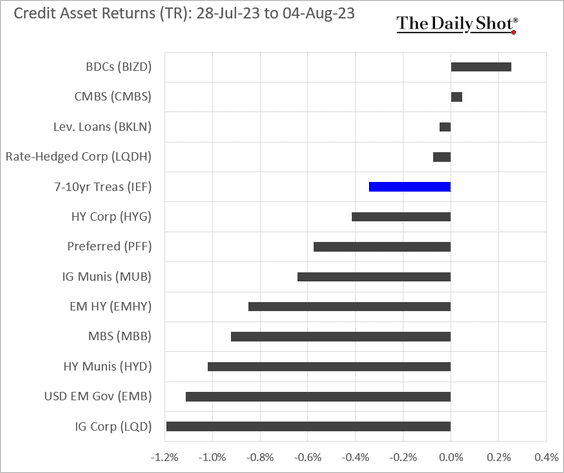
3. Here is last week’s performance by asset class.
Back to Index
Rates
1. Treasury term premium has risen after the US downgrade.
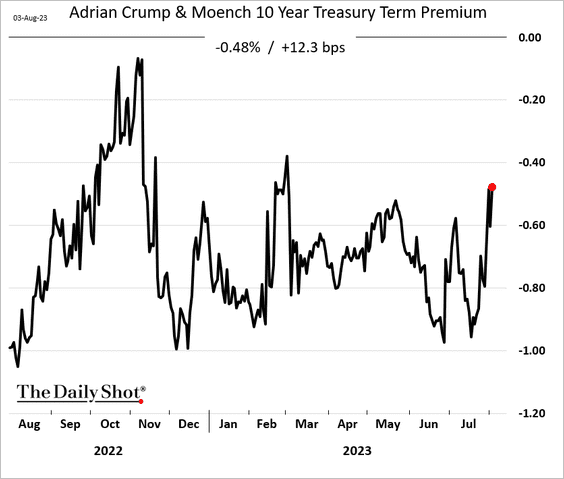
Here are the drivers of recent yield increases.
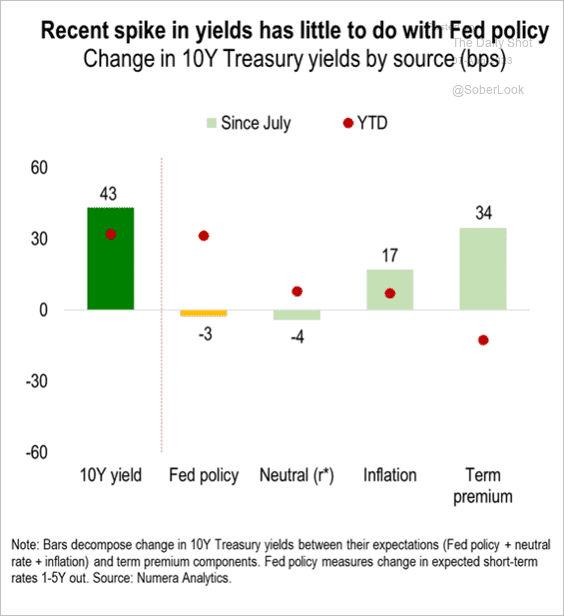 Source: Numera Analytics (@NumeraAnalytics)
——————–
2. Domestic funds have been driving demand for Treasuries at auctions.
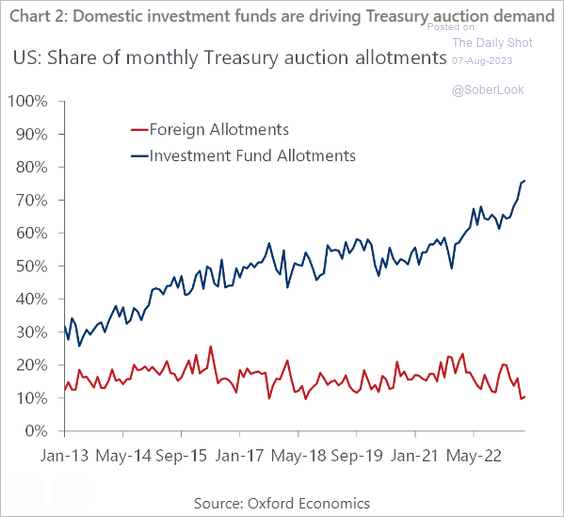 Source: Oxford Economics
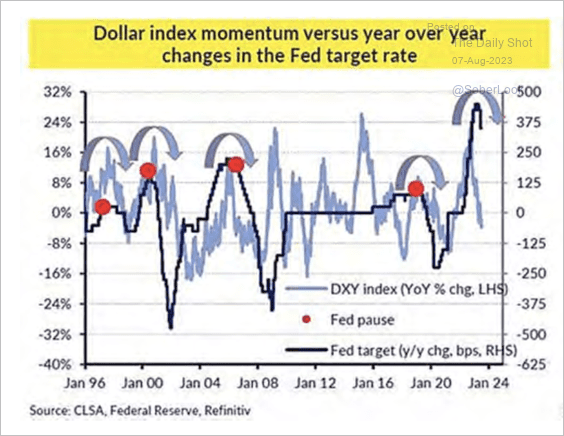
3. Bets against Treasury futures hit another record.
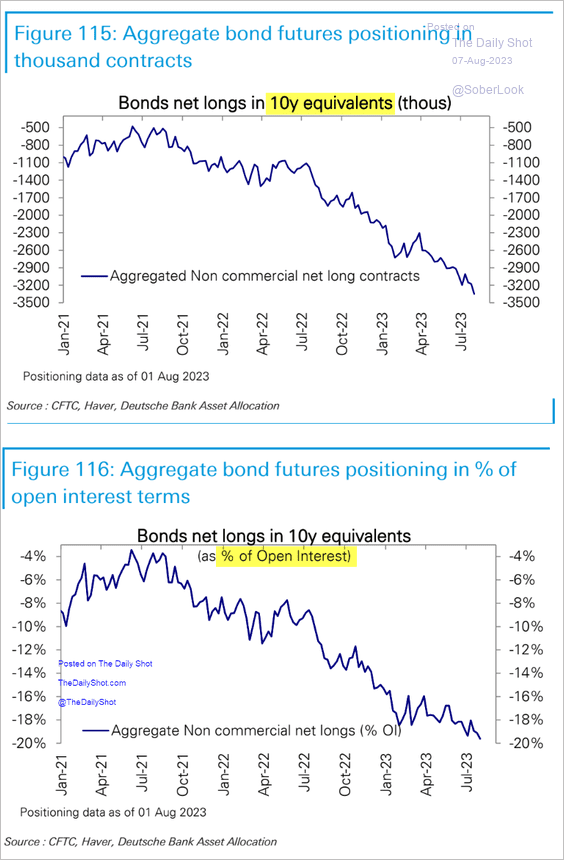 Source: Deutsche Bank Research
Back to Index
Global Developments
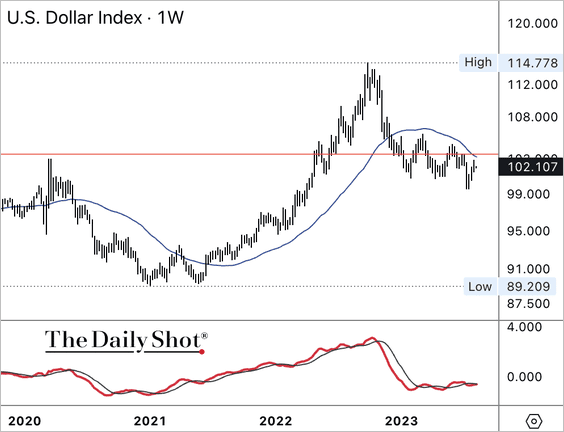
1. Dollar momentum typically peaks within five months of a Fed pause.
 Source: CLSA
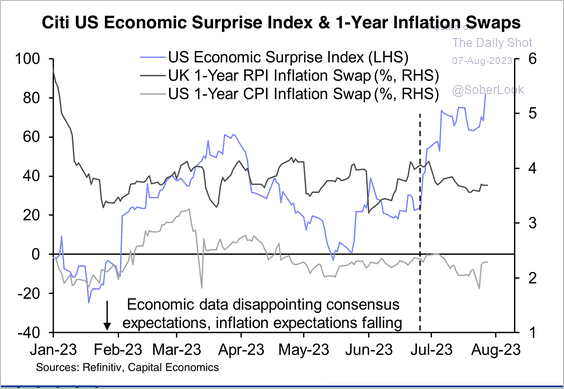
The dollar remains capped below its 40-week moving average after failing to maintain its breakout last year. Momentum signals point to a choppy range around key resistance.
——————–
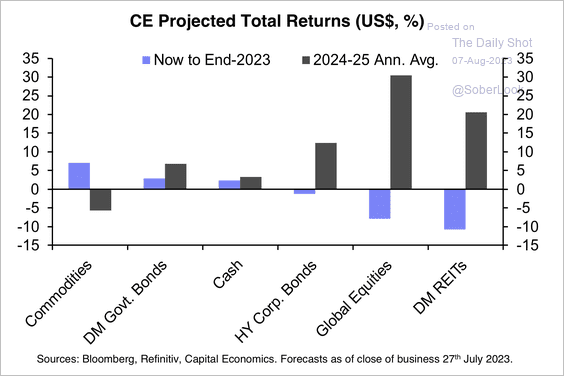
2. The rally in risk assets partly reflects economic resilience, particularly in the US, and further signs of disinflation, especially in the UK.
 Source: Capital Economics
Capital Economics expects most risk assets to struggle for the rest of the year and then surge over 2024-2025.
 Source: Capital Economics
——————–
3. This chart shows corporate earnings growth in the second quarter.
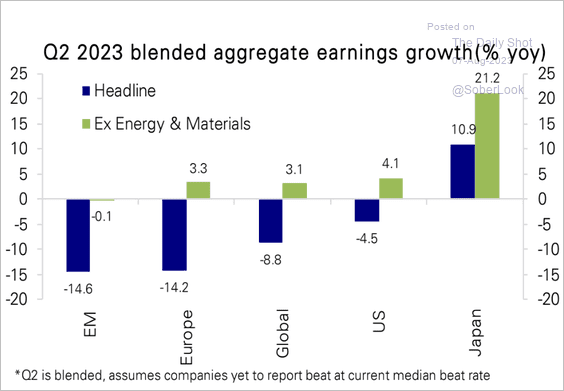 Source: Deutsche Bank Research
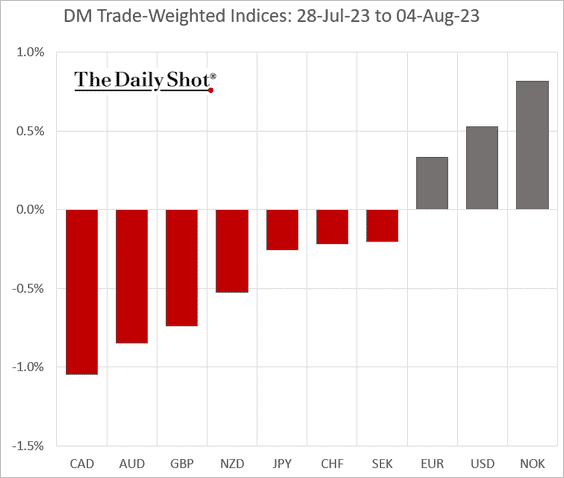
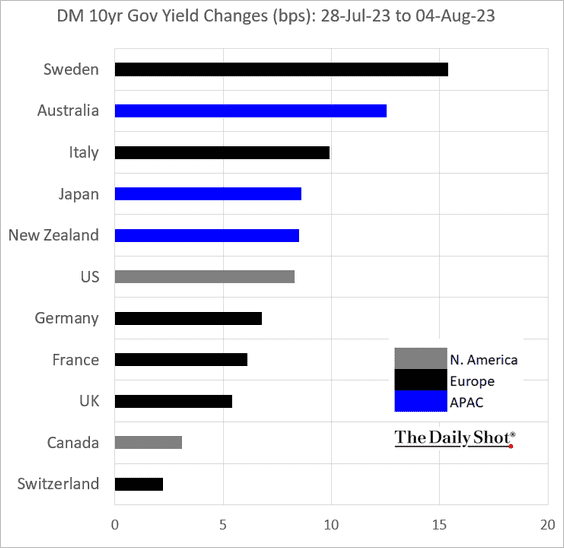
4. Finally, we have last week’s performance data.
• Currencies:
• Bond yields:
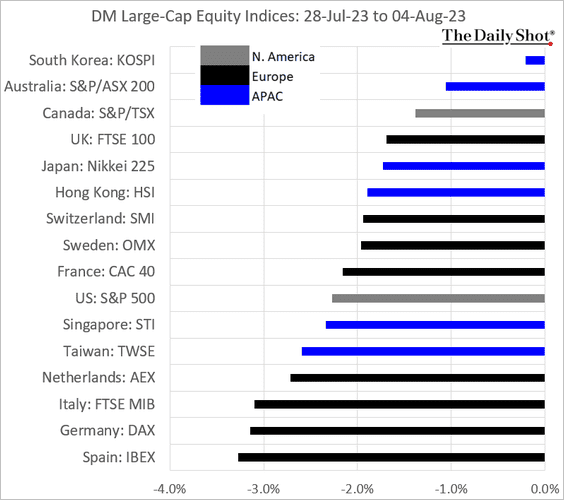
• Equity indices:
——————–
Food for Thought
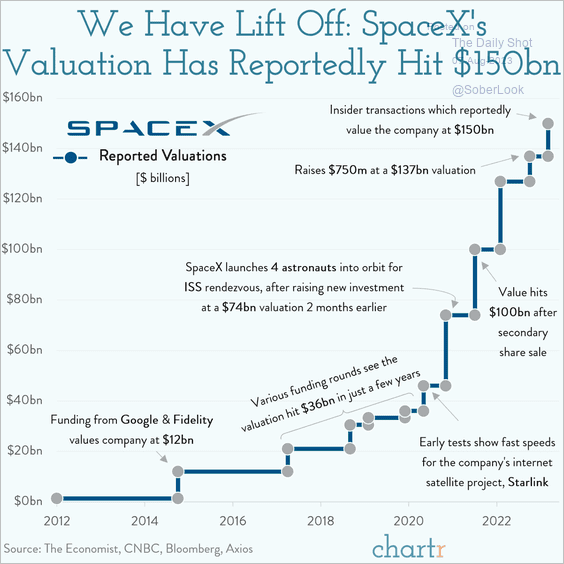
1. SpaceX valuation:
 Source: @chartrdaily
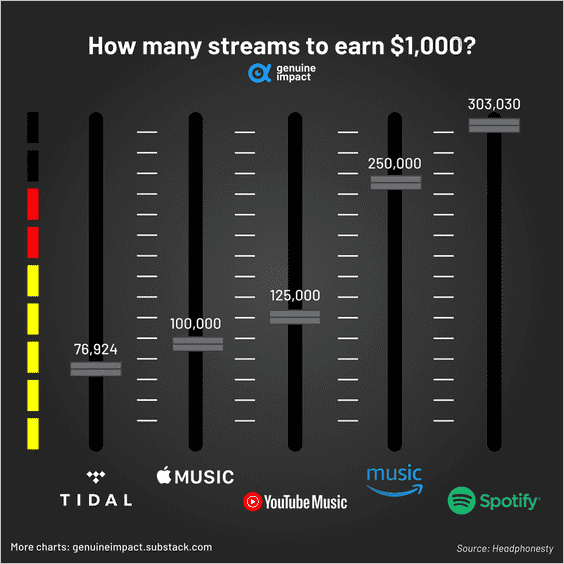
2. The number of music streams needed to earn $1,000:
 Source: @genuine_impact
3. The biggest member-owned businesses in the US:
 Source: Statista
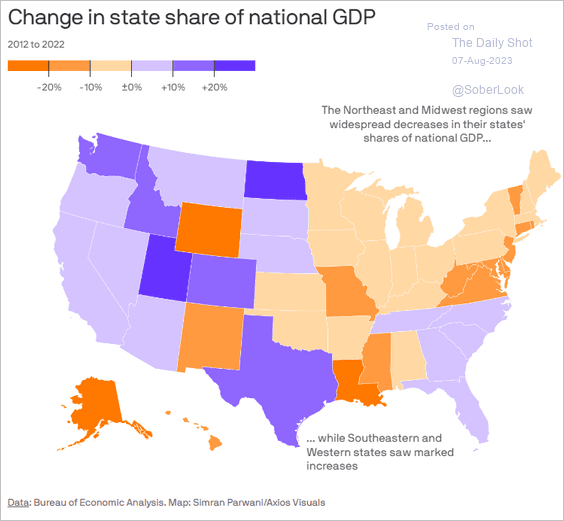
4. Changes in state share of US GDP:
 Source: @axios Read full article
5. In-person card spending before and after lockdowns (by day of the week):
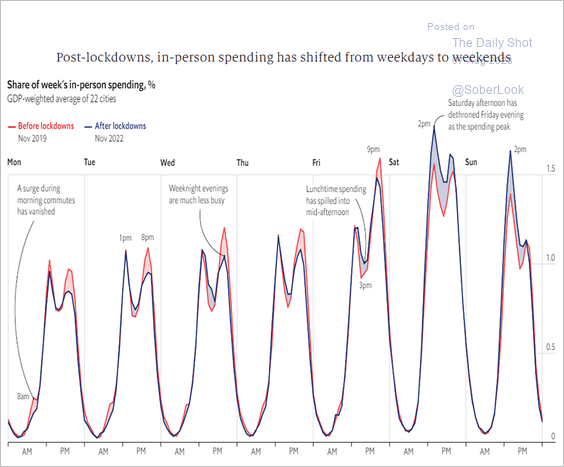 Source: The Economist Read full article
6. The financial demands of supporting a family of four have surpassed what a single salary can adequately provide.
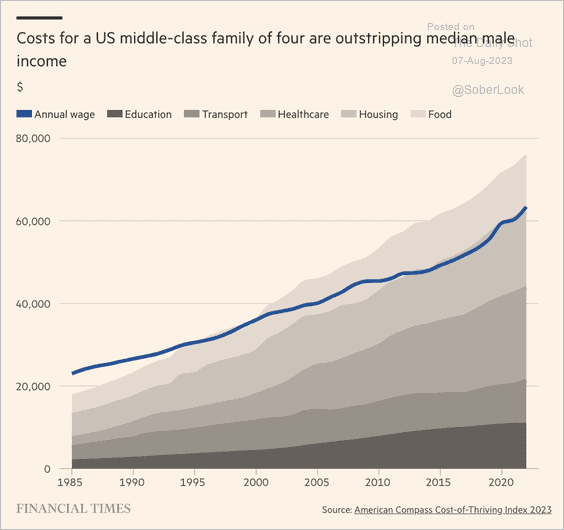 Source: @financialtimes Read full article
7. Share of 40-year-olds in the US that have never been married:
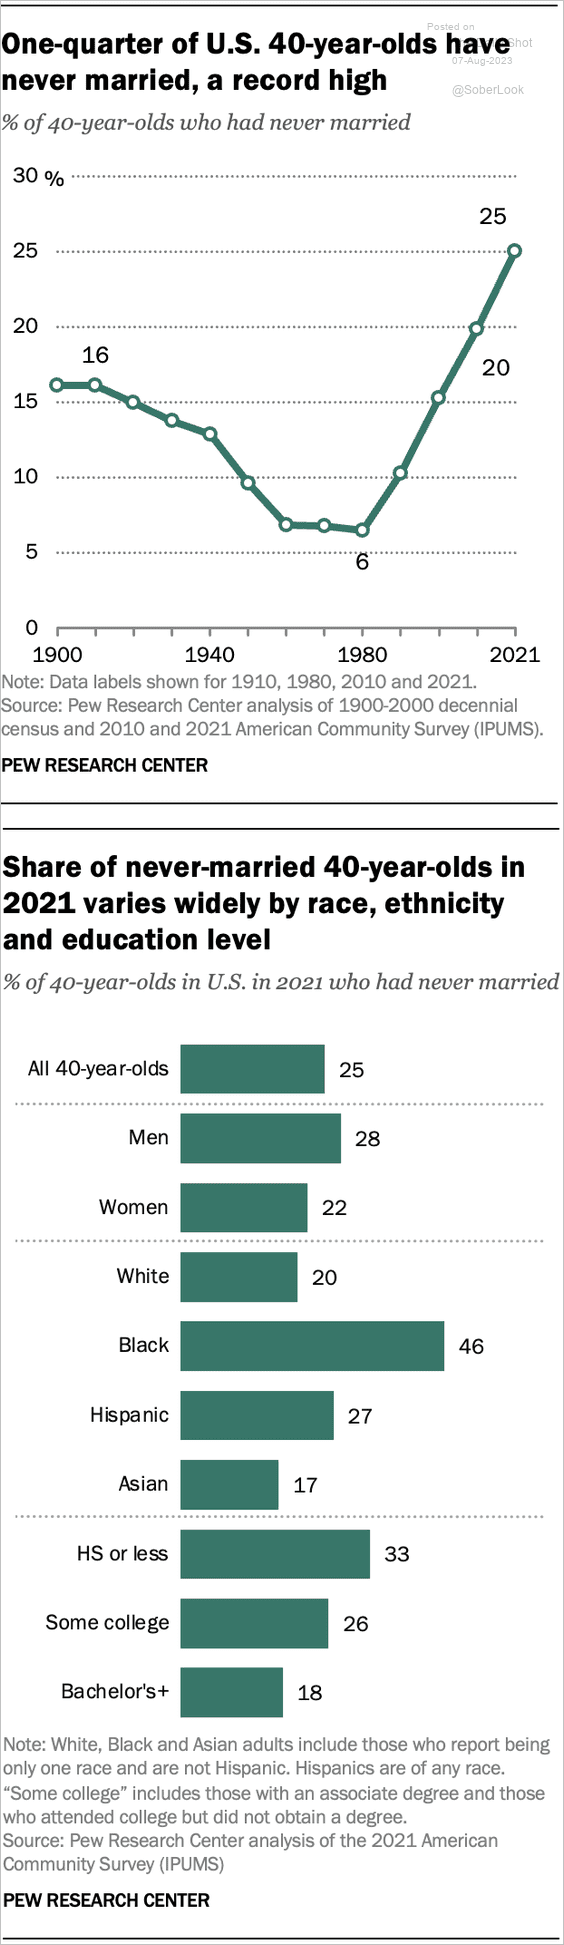 Source: Pew Research Center Read full article
8. UCLA student admissions by race-ethnicity:
 Source: Los Angeles Times Read full article
9. Man-made objects orbiting Earth:
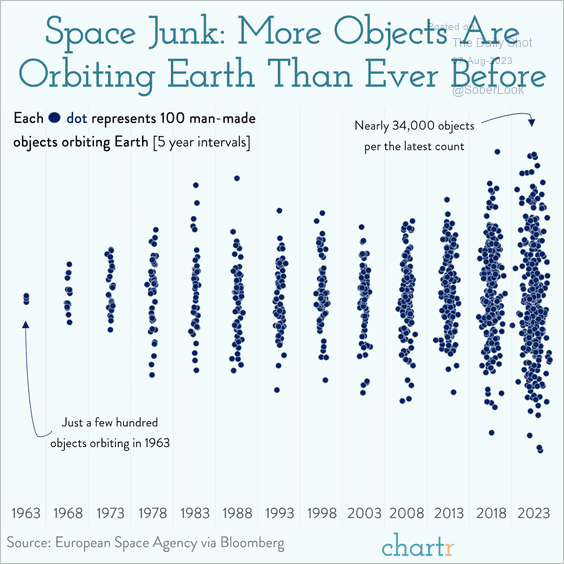 Source: @chartrdaily
——————–
Back to Index