
The Daily Shot: 08-Aug-23
• The United States
• The Eurozone
• Europe
• Japan
• Asia-Pacific
• China
• Emerging Markets
• Cryptocurrency
• Commodities
• Energy
• Equities
• Alternatives
• Credit
• Rates
• Global Developments
• Food for Thought
The United States
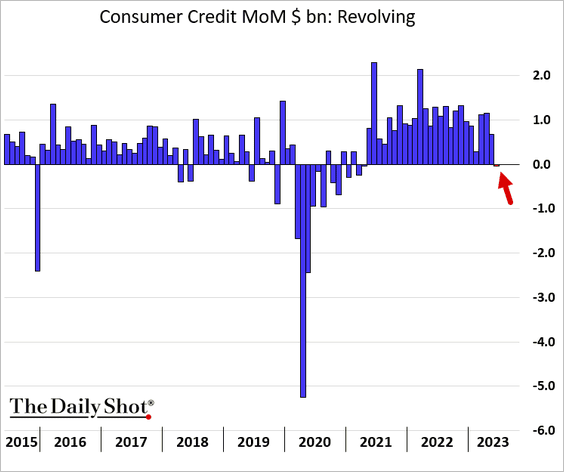
1. Let’s begin with consumer credit.
• Total consumer credit growth picked up in June, …
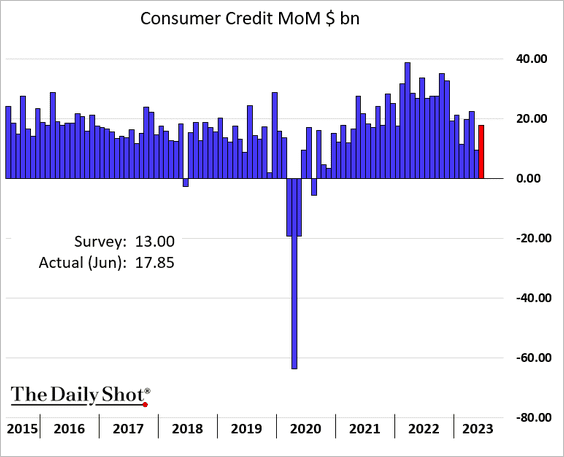
… but credit card debt saw its first decline since 2021.
• This chart shows nominal and real credit card debt levels.
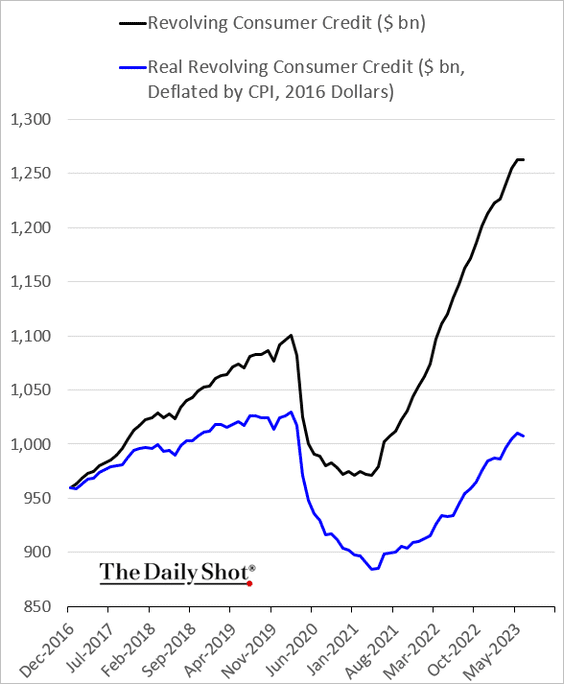
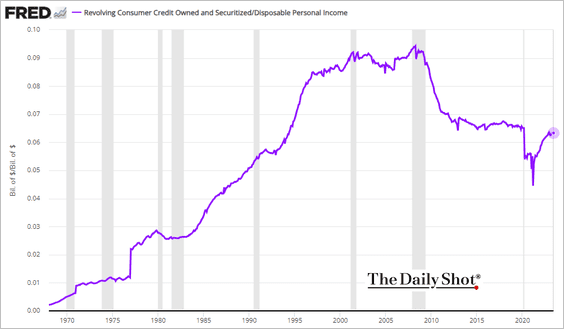
Credit card debt as a share of disposable income remains below pre-pandemic levels.
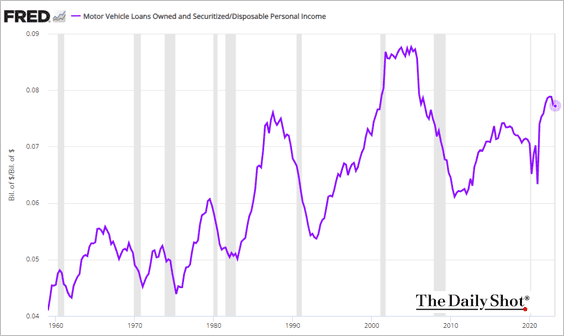
• Automobile debt as a share of disposable income is elevated.
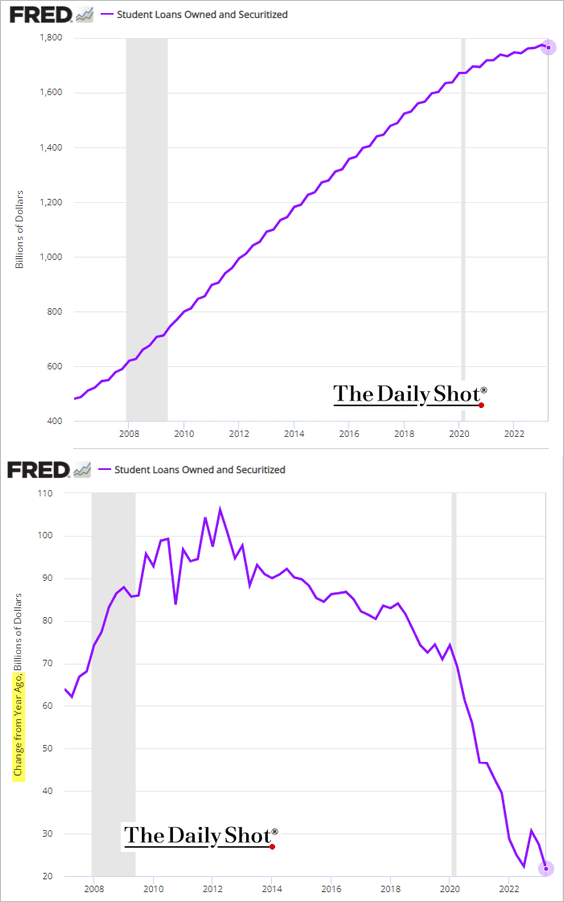
• Growth in student loan balances continues to slow.
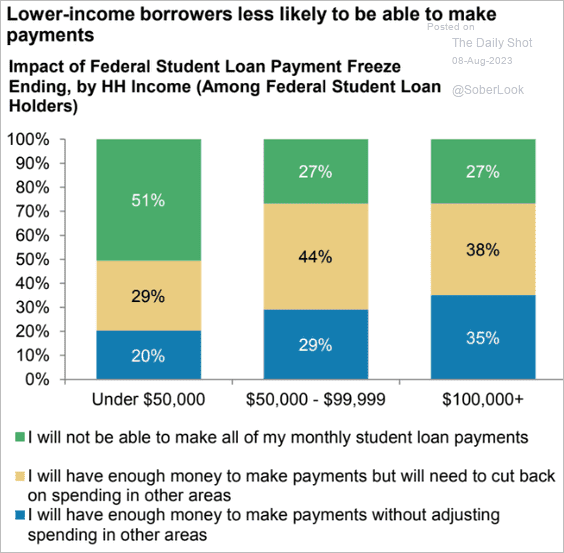
• The conclusion of the student debt payment holiday is likely to pose challenges, particularly for borrowers with lower incomes.
 Source: Morgan Stanley Research
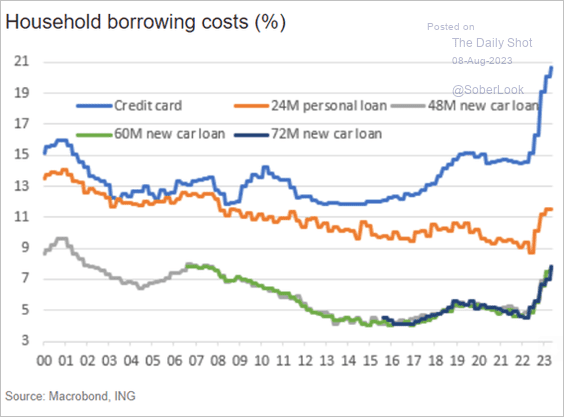
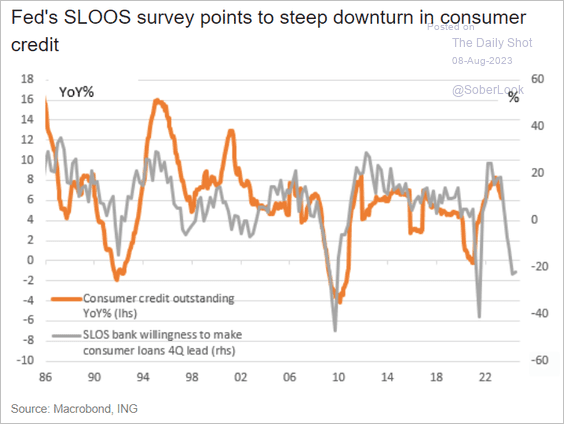
• Consumer credit borrowing costs surged during the current Fed rate-hike cycle.
 Source: ING
• This chart shows consumers’ net spending intentions.
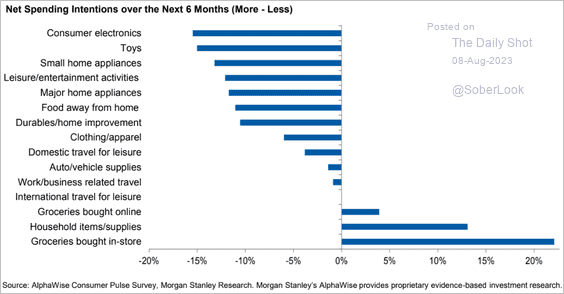 Source: Morgan Stanley Research
• Tighter lending conditions point to a downturn in consumer credit ahead.
 Source: ING
——————–
2. Next, we have some updates on the labor market.
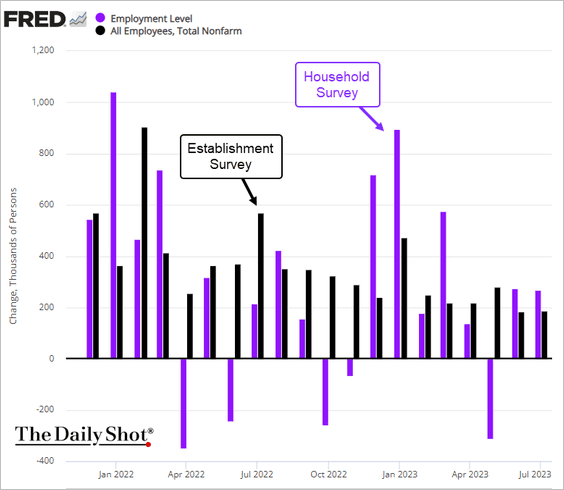
• The household survey outpaced the establishment survey (official nonfarm payrolls) over the past two months.
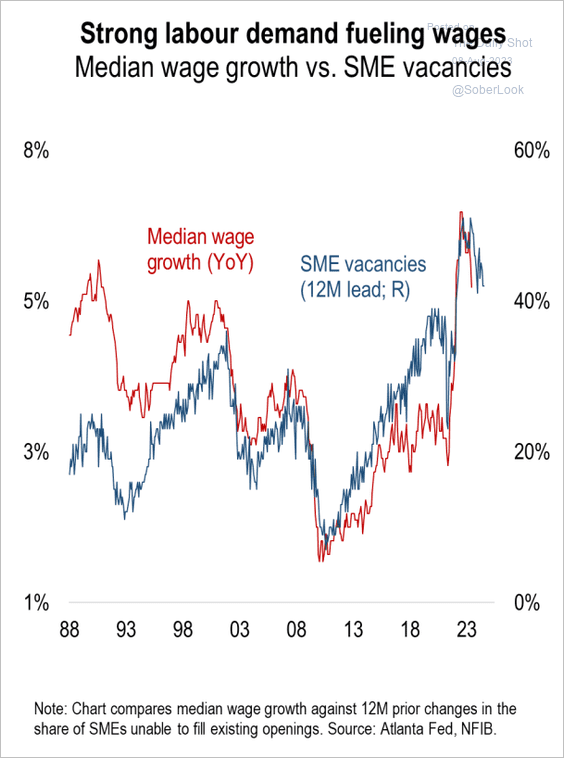
• Robust labor demand continues to fuel wage growth.
 Source: Numera Analytics (@NumeraAnalytics)
– Here is wage growth by industry.
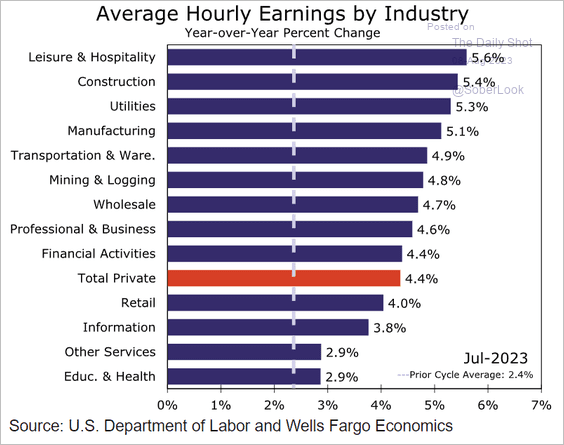 Source: Wells Fargo Securities
• Tighter credit conditions point to labor-market weakness ahead.
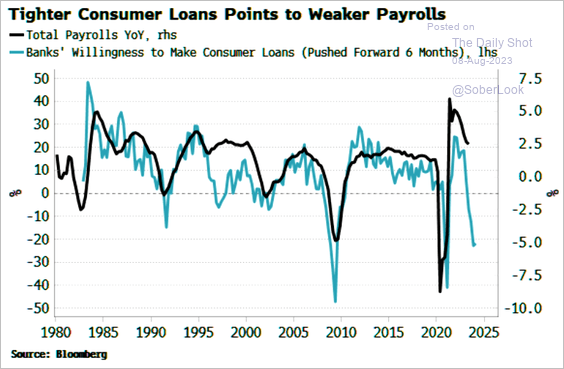 Source: Simon White, Bloomberg Markets Live Blog
• The prime-age labor force participation rate edged lower in July.
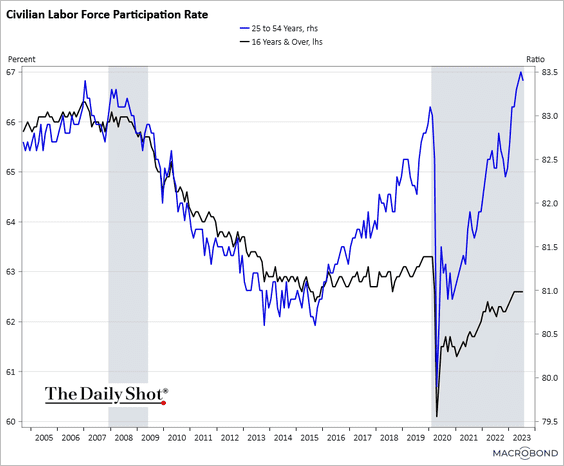 Source: Chart and data provided by Macrobond
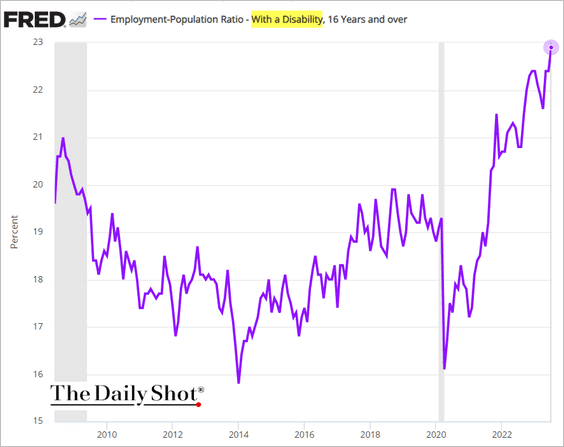
– Here is the employment-to-population ratio.
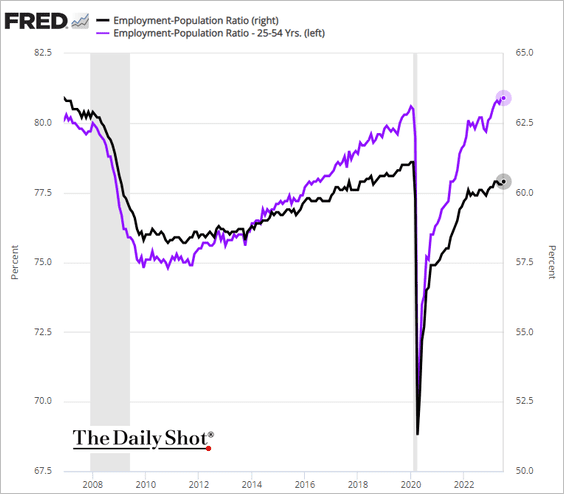
• A greater percentage of Americans with disabilities are now employed.
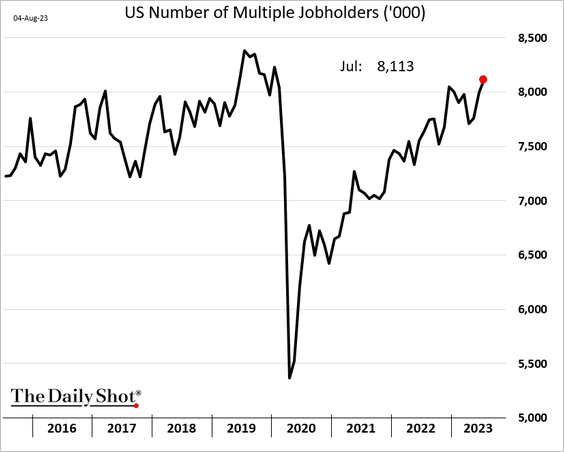
• The number of Americans with more than one job has almost fully recovered from the pandemic shock.
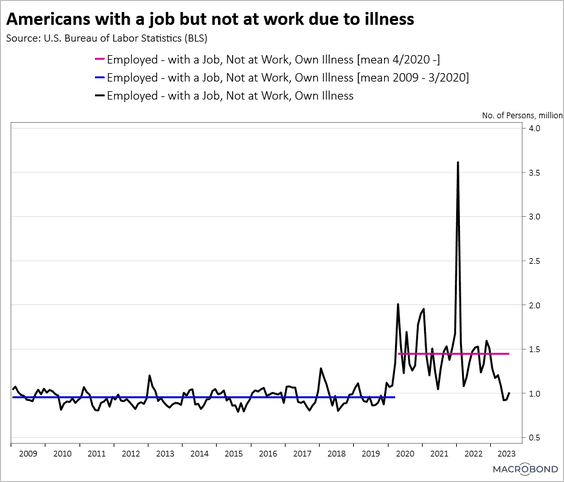
• The number of workers who are out due to illness is back at the pre-COVID average.
 Source: Chart and data provided by Macrobond
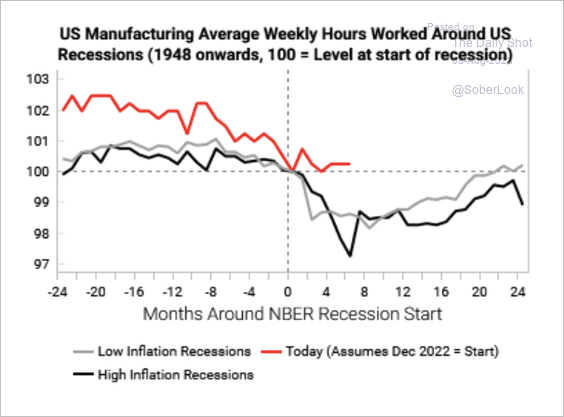
• Weakness in manufacturing employment is following previous recession paths.
 Source: Variant Perception
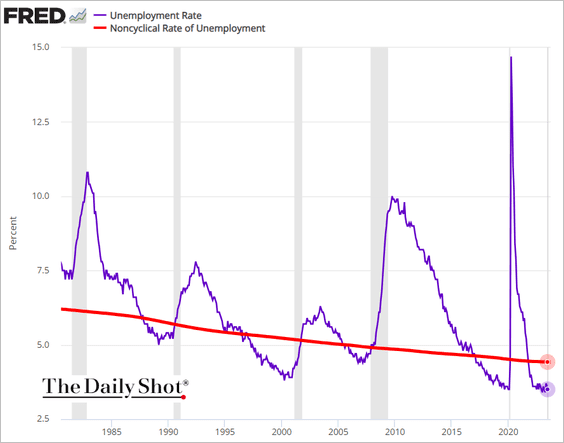
• The unemployment rate remains well below NAIRU (a sign of labor market tightness).
• Finally, here is the labor market “dashboard” from the Atlanta Fed.
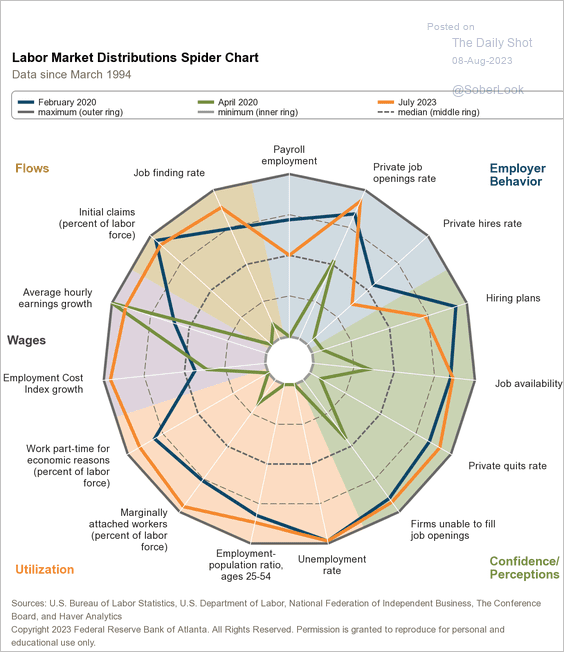 Source: Federal Reserve Bank of Atlanta
——————–
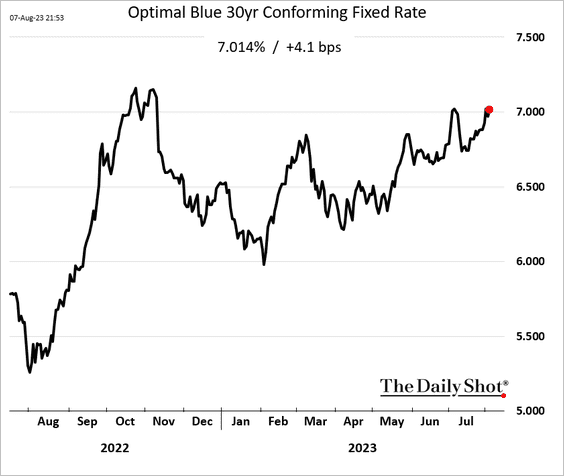
3. Mortgage rates are holding above 7%.
4. Longer-term market-based inflation expectations have risen sharply in recent days.
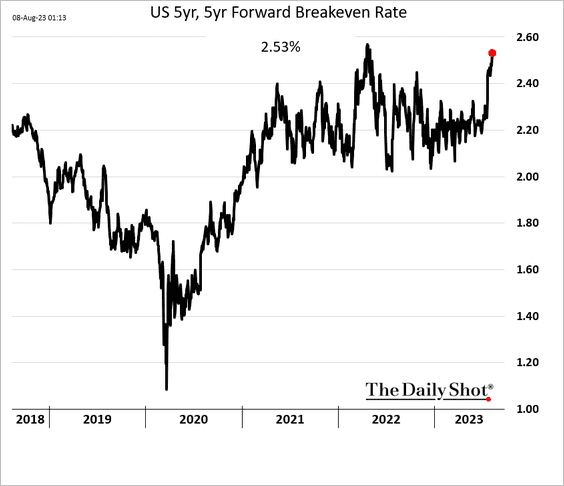 h/t @lisaabramowicz1
Back to Index
The Eurozone
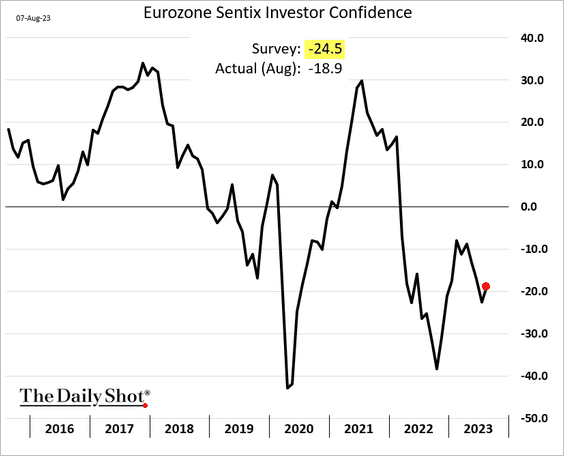
1. Euro-area investor confidence edged higher this month.
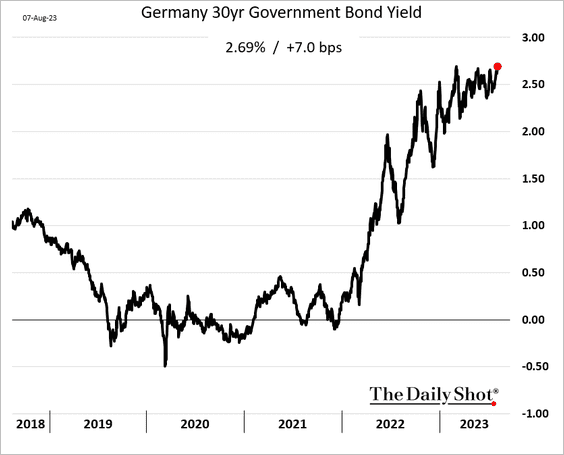
2. The 30-year Bund yield is near multi-year highs.
3. Industrial production is headed lower.
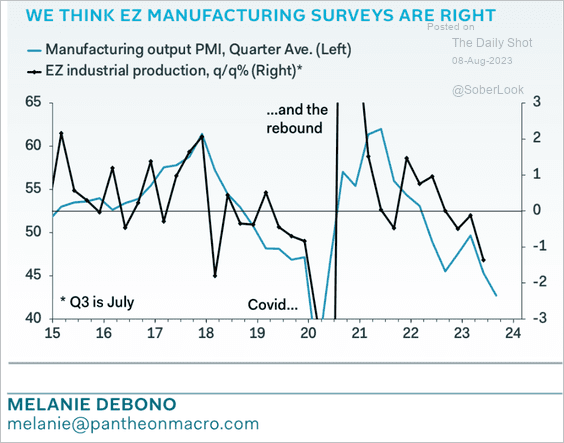 Source: Pantheon Macroeconomics
4. Euro-area services output is back on its pre-COVID trend.
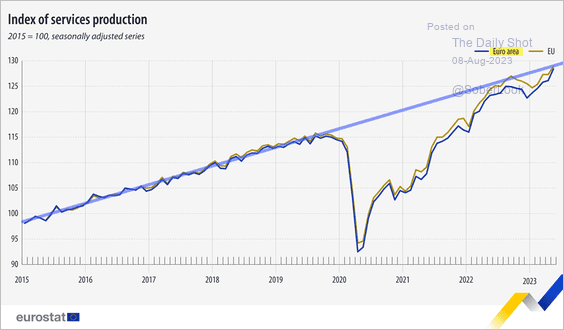 Source: Eurostat
5. Here is the ECB’s balance sheet projection from Capital Economics.
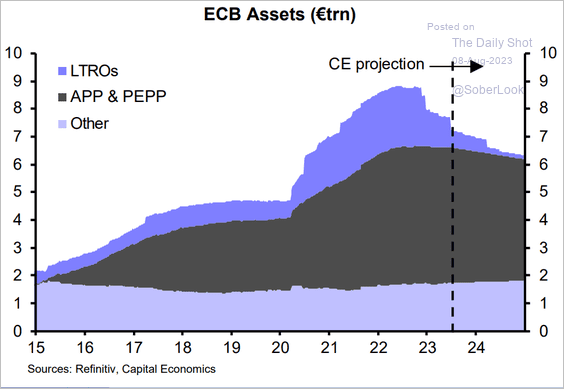 Source: Capital Economics
6. Finally, we have Commerzbank’s leading indicator for the German economy.
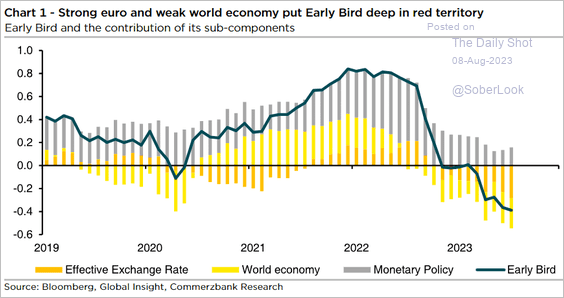 Source: Commerzbank Research
Back to Index
Europe
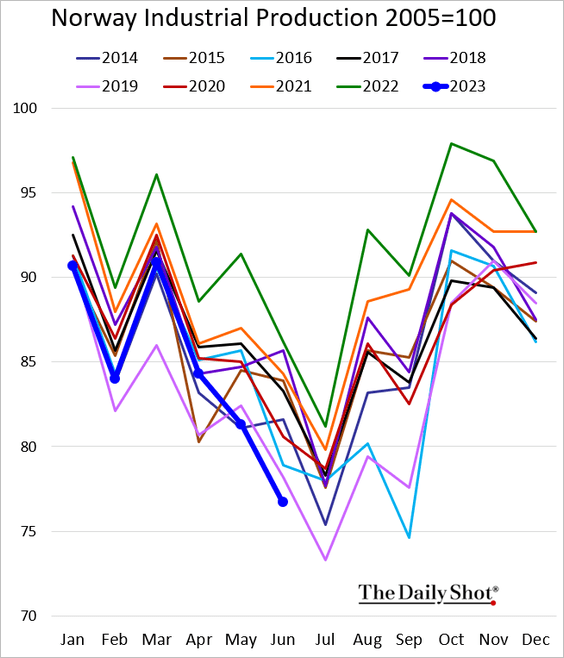
1. Norway’s industrial production has been soft (weakness driven by energy/utilities).
2. Here is a forecast for Sweden’s Riksbank policy rate from Capital Economics.
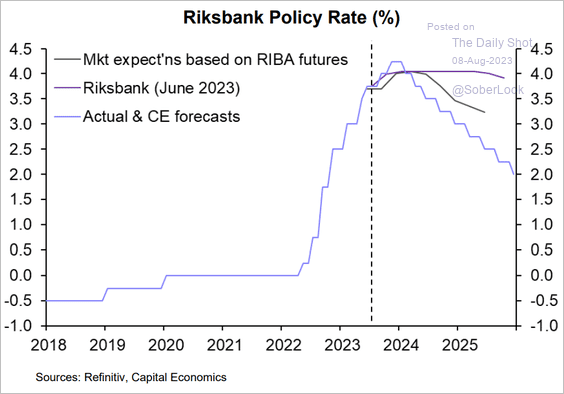 Source: Capital Economics
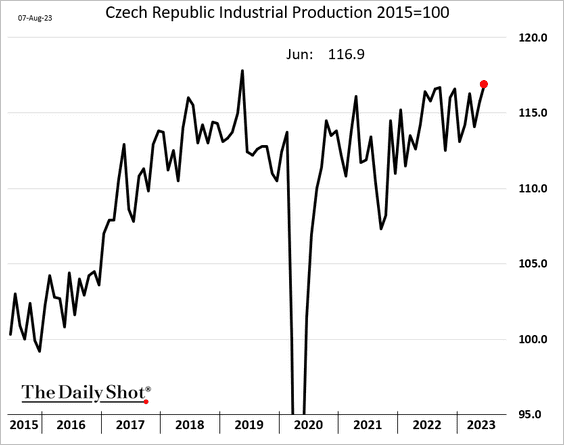
3. Despite weakness in the manufacturing PMI, Czech industrial production has have been strengthening.
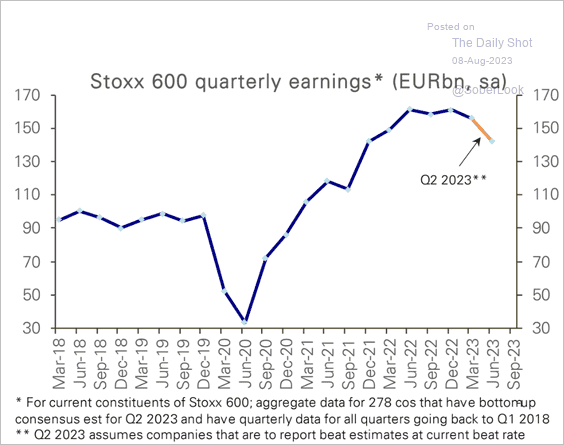
4. European corporate earnings have been rolling over.
 Source: Deutsche Bank Research
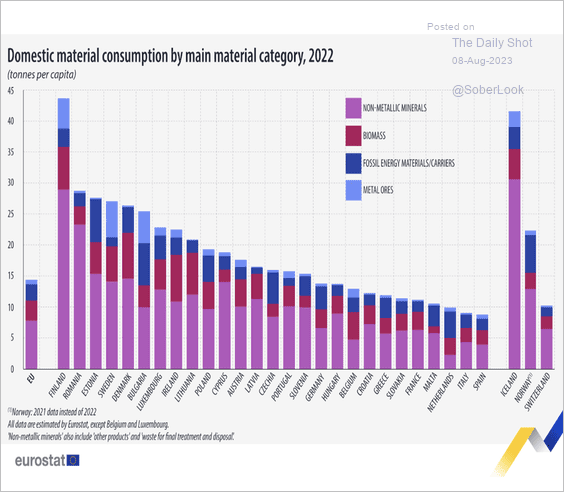
5. Finally, we have some data on domestic materials consumption in the EU.
 Source: Eurostat Read full article
Back to Index
Japan
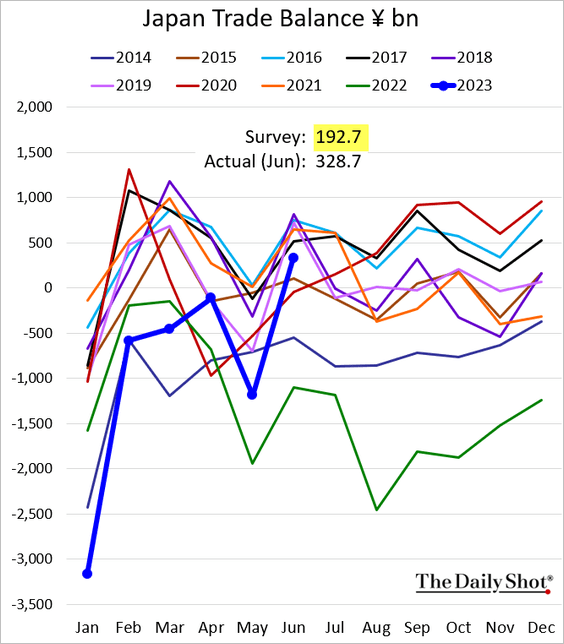
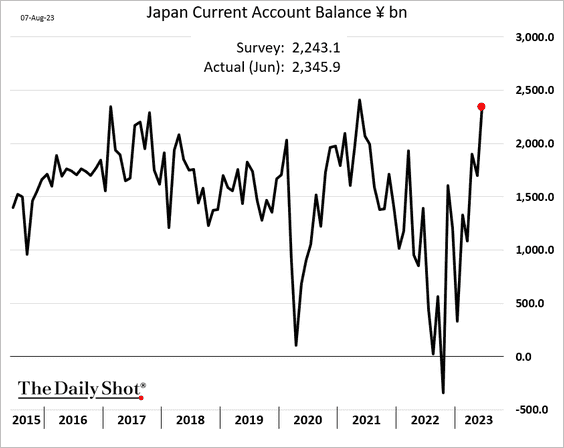
1. The trade surplus topped expectations.
The current account balance has fully recovered from the energy shock.
——————–
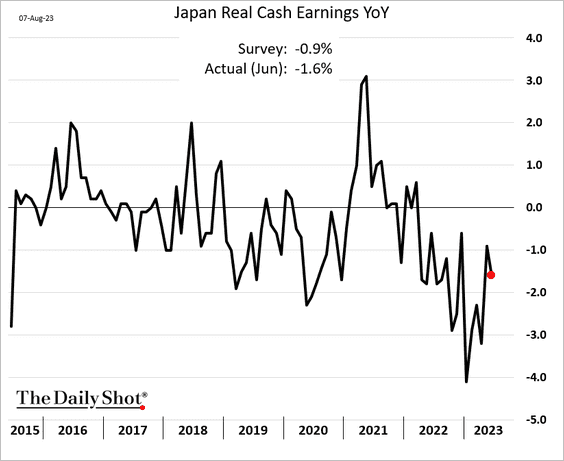
2. Households’ real earnings remain below last year’s levels.
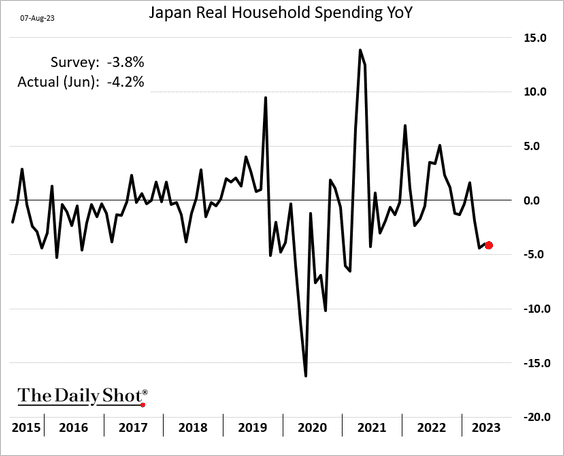
Real spending has deteriorated.
——————–
3. The BoJ’s QE is alive and well.
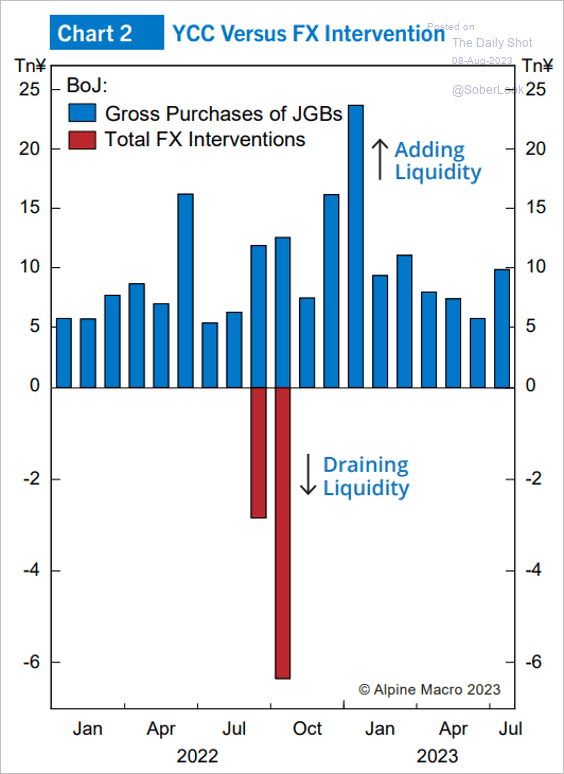 Source: Alpine Macro
Back to Index
Asia-Pacific
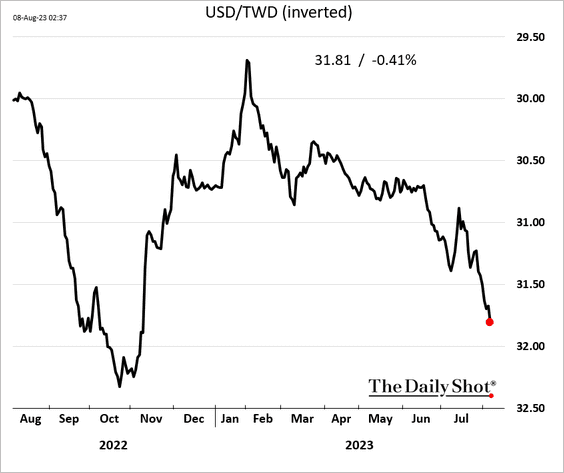
1. The Taiwan dollar remains under pressure.
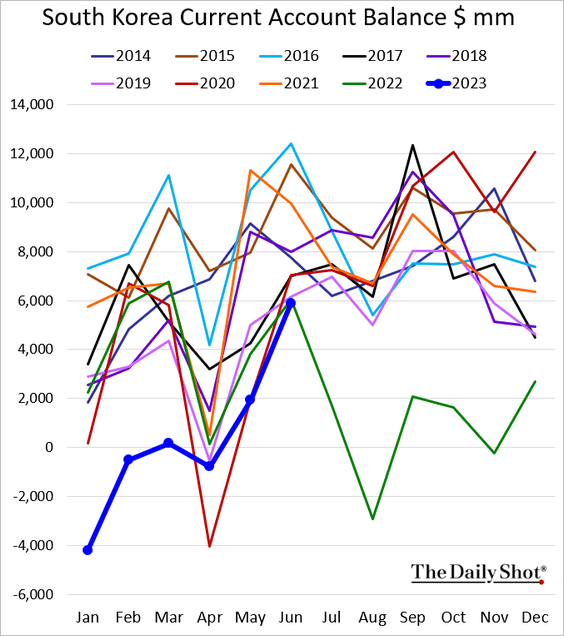
2. South Korea’s current account balance is rebounding.
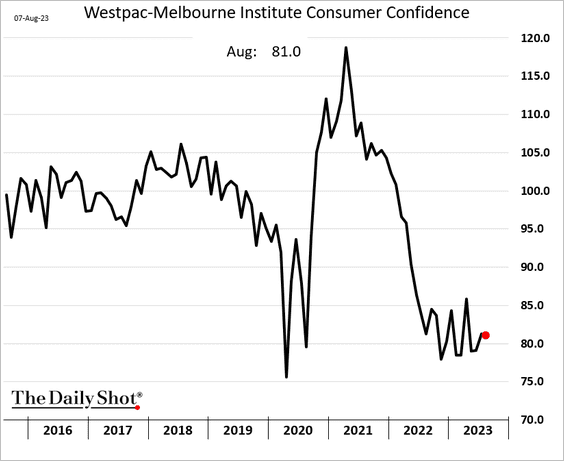
3. Australian consumer sentiment remains depressed.
Back to Index
China
1. Exports surprised to the downside, declining 14.5% from last year.
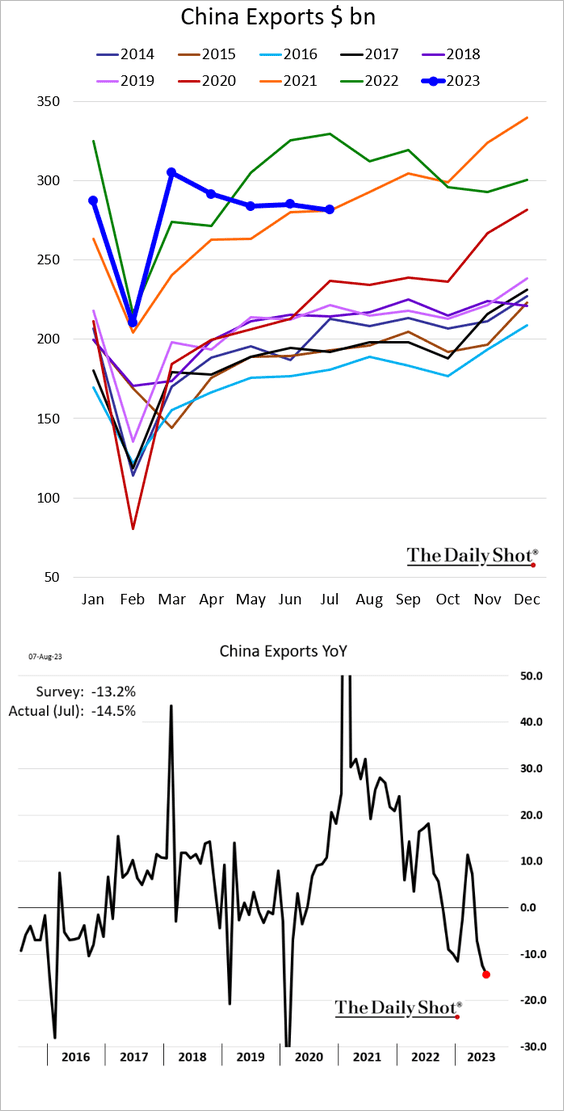
 Source: CNBC Read full article
——————–
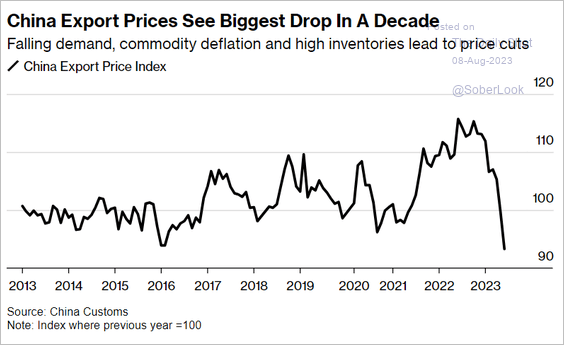
2. China’s export prices have been tumbling.
 Source: @economics Read full article
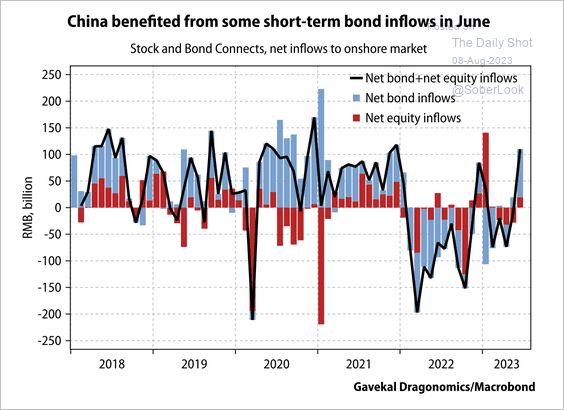
3. Net bond and equity inflows flipped positive for the first time in five months, probably due to dollar weakness benefitting broad EM capital inflows.
 Source: Gavekal Research
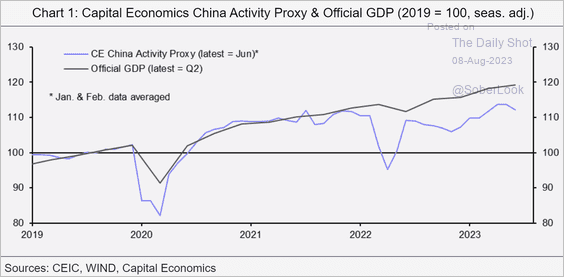
4. Here is the Capital Economics China Activity Proxy vs. the official GDP trend.
 Source: Capital Economics
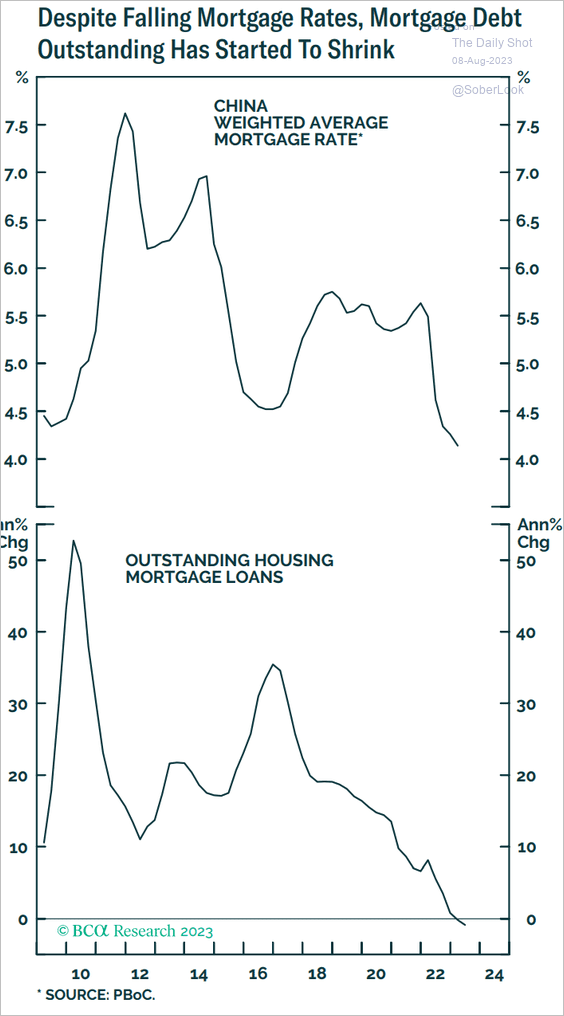
5. Lower mortgage rates did not spur loan growth.
 Source: BCA Research
Back to Index
Emerging Markets
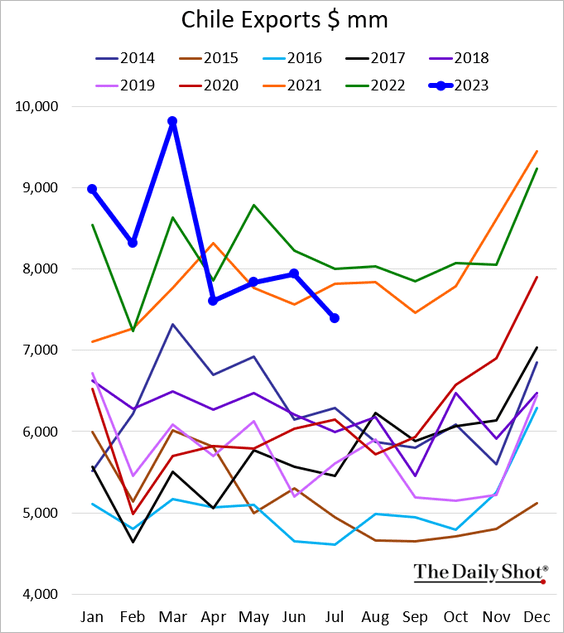
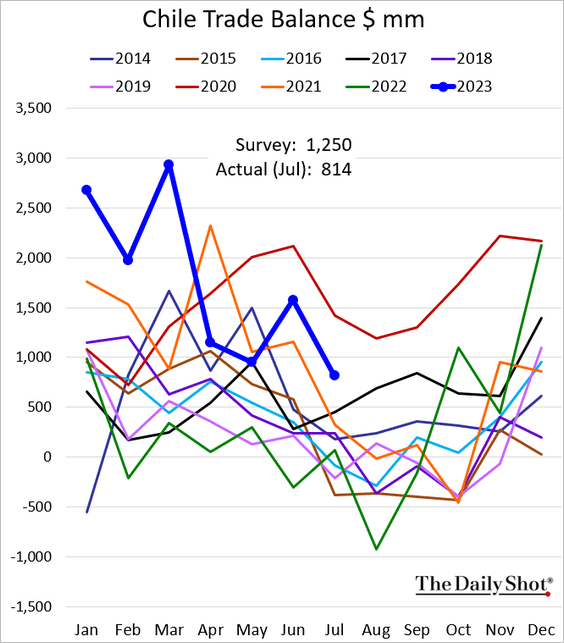
1. Chile’s exports dipped below 2021 levels last month.
Here is the trade balance.
——————–
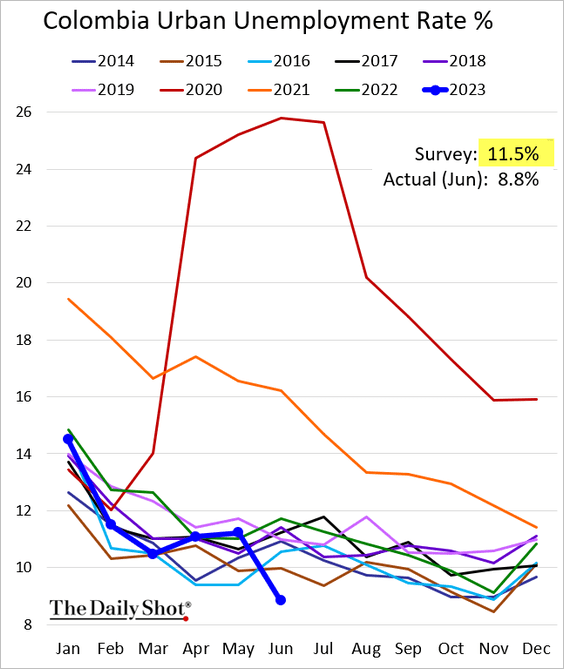
2. Colombia’s unemployment rate hit a multi-year low.
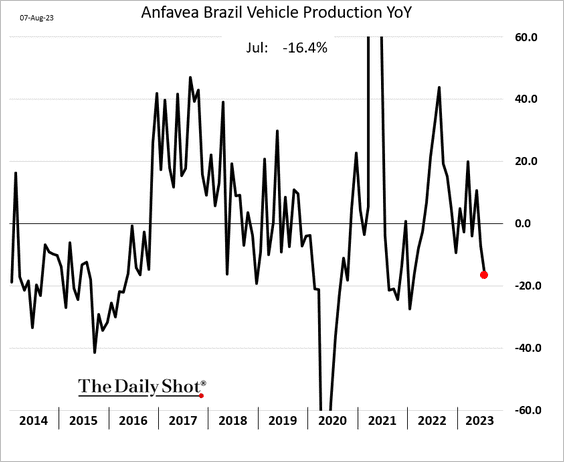
3. Brazil’s vehicle production is down 16% vs. last year.
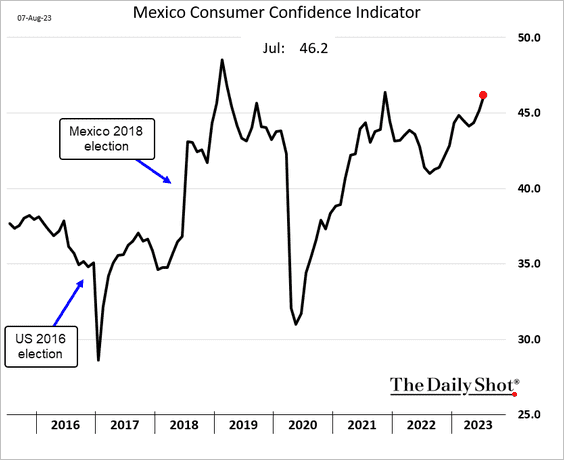
4. Mexican consumer confidence continues to rise.
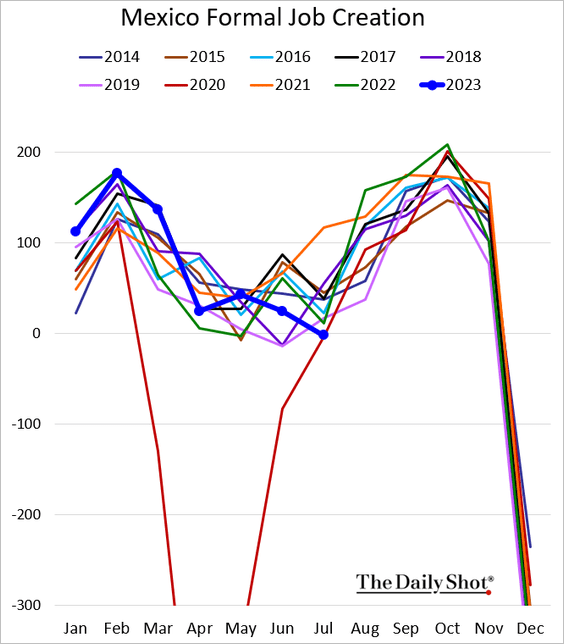
The nation’s formal job creation has slowed.
——————–
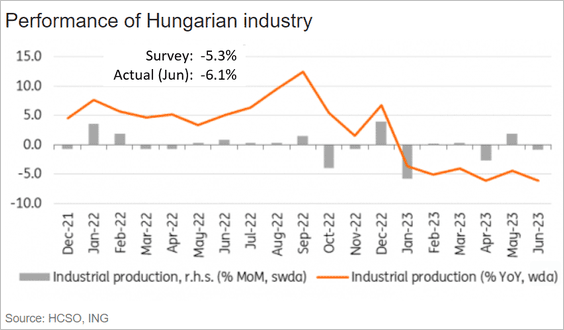
5. Hungarian industrial production remains depressed, dragged lower by weakness in Germany.
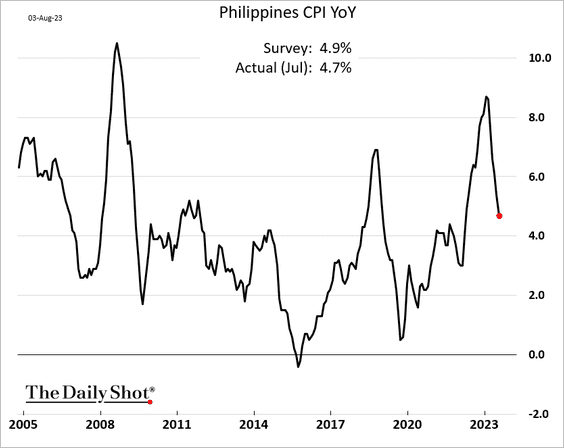
6. Philippine inflation is rapidly slowing.
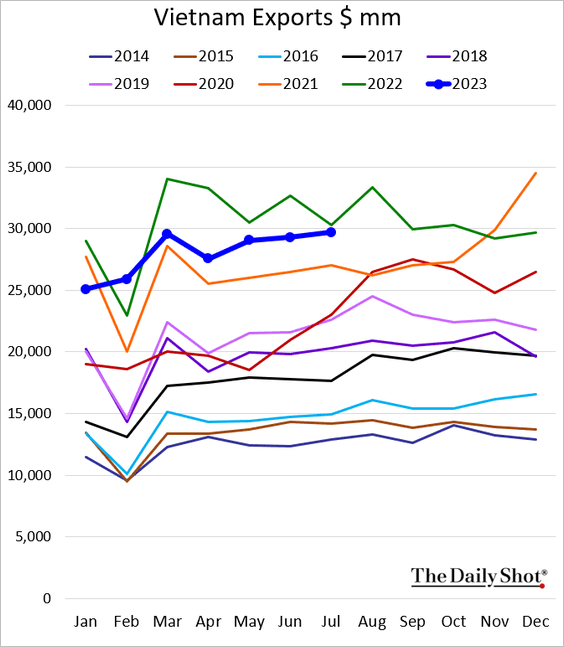
7. Vietnam’s exports are holding up.
8. EM productivity has been weakening.
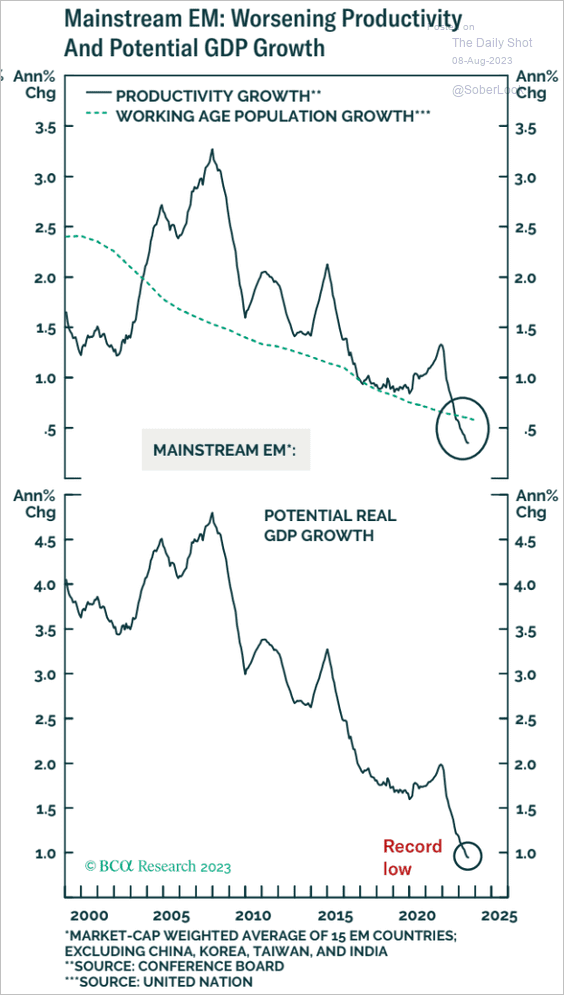 Source: BCA Research
9. EM bonds are improving relative to the US Aggregate Bond Index.
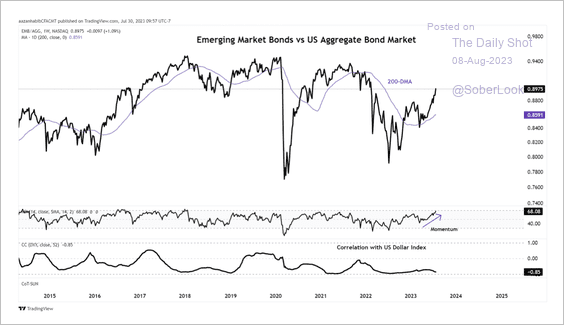 Source: Aazan Habib, Paradigm Capital
Back to Index
Cryptocurrency
1. This chart shows the percentage of variation in bitcoin’s price explained by different macro factors. Monetary policy is increasingly important.
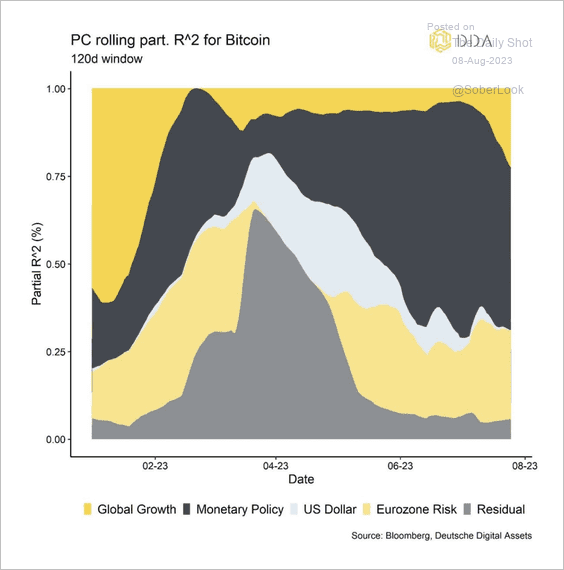 Source: Deutsche Digital Assets
2. Short-term uptrends among altcoins have weakened.
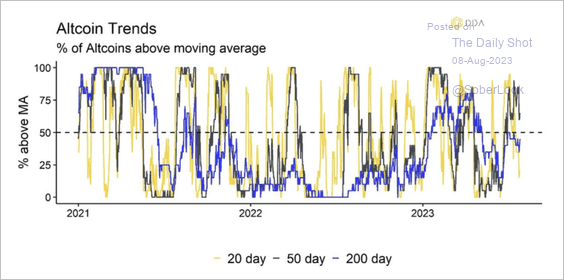 Source: Deutsche Digital Assets
3. This chart shows a significant weakness in relative strength and momentum of altcoins versus bitcoin over the past 12 months.
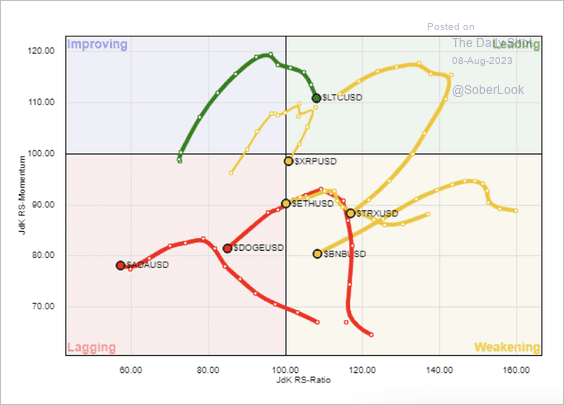 Source: @StocktonKatie
4. Crypto assets saw outflows last week mostly in bitcoin products. Although Solana-focused funds continued to see inflows. (2 charts)
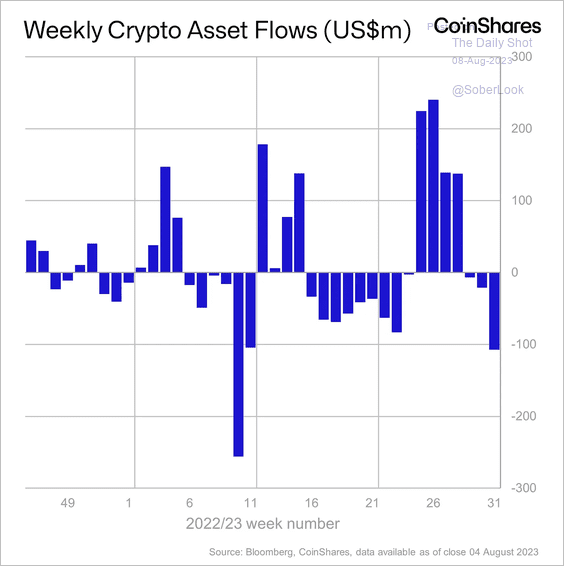 Source: CoinShares Read full article
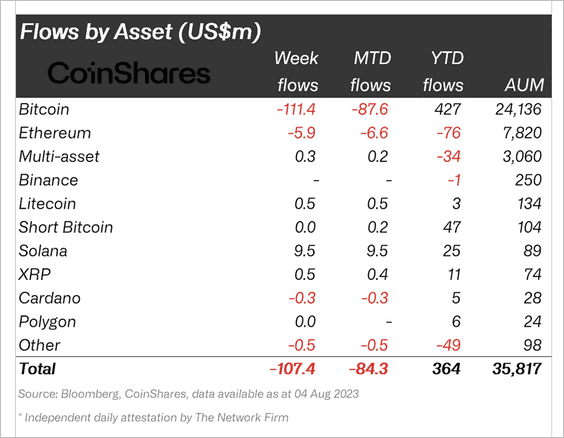 Source: CoinShares Read full article
Back to Index
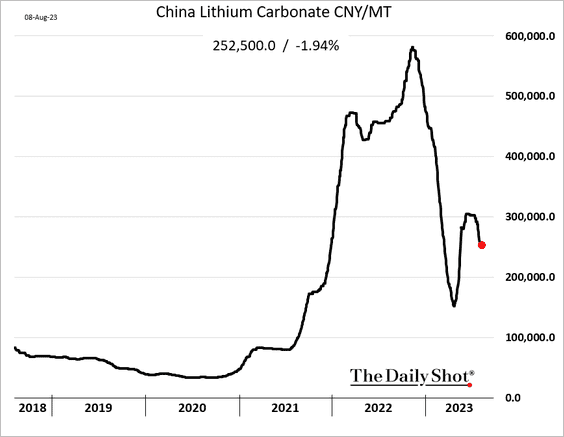
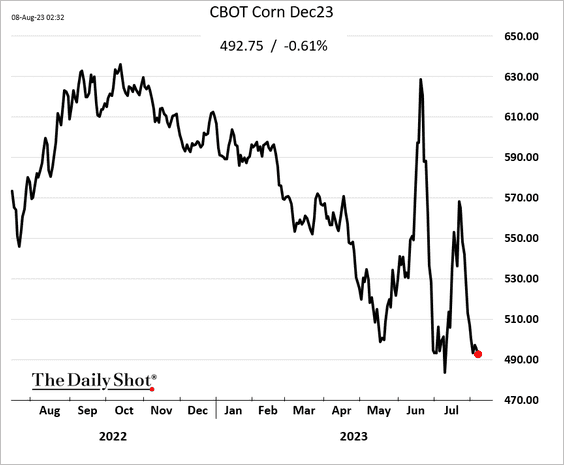
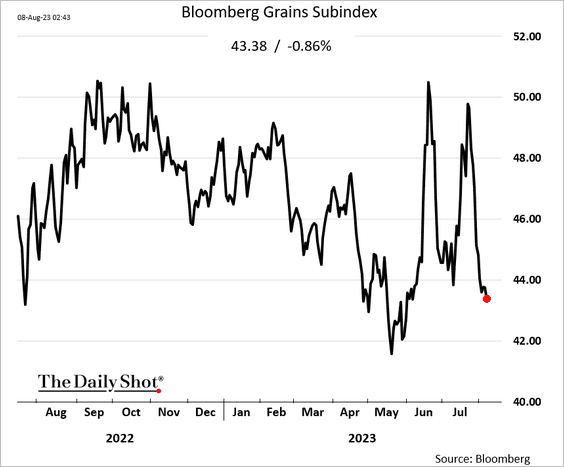
Commodities
1. The rebound in lithium prices is fading.
2. US grains’ second attempt to rally has been thwarted.
Back to Index
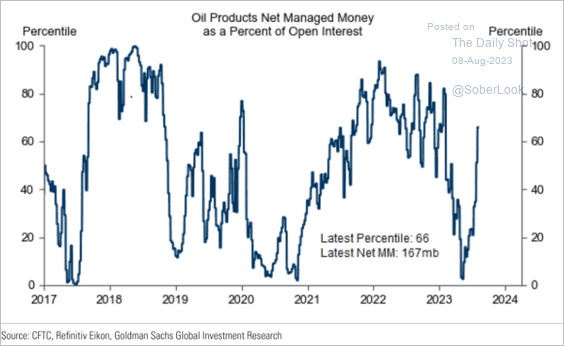
Energy
1. Money managers have been boosting their exposure to oil.
 Source: Goldman Sachs; h/t @dailychartbook
2. This chart illustrates the factors influencing oil supply and demand growth between 2023 and 2024, as analyzed by Capital Economics.
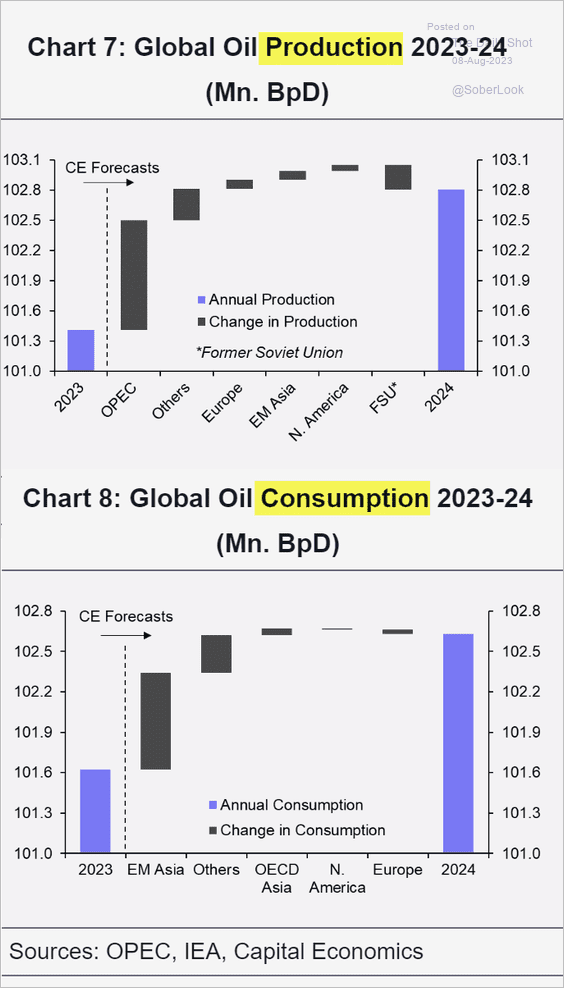 Source: Capital Economics
Back to Index
Equities
1. Here is a look at the S&P 500 Q2 year-over-year earnings growth by sector.
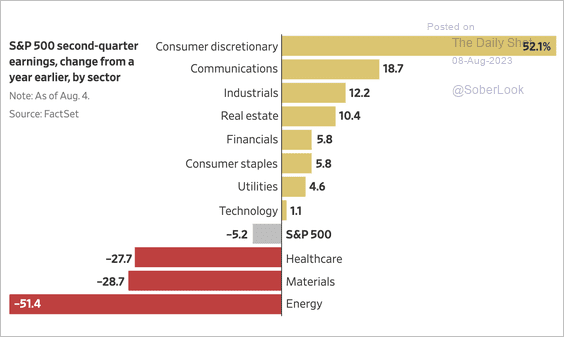 Source: @WSJ Read full article
2. Corporate margins have been closely tied to macro growth. Could we see a rebound?
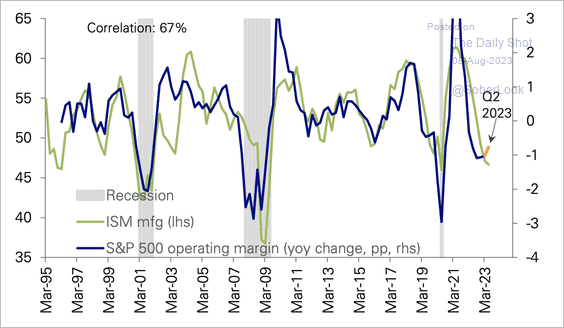 Source: Deutsche Bank Research
• During the current US inflation cycle, corporates have been able to pass on higher costs to consumers, which kept real earnings elevated.
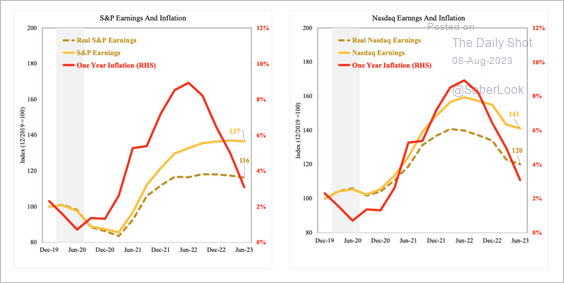 Source: SOM Macro Strategies
——————–
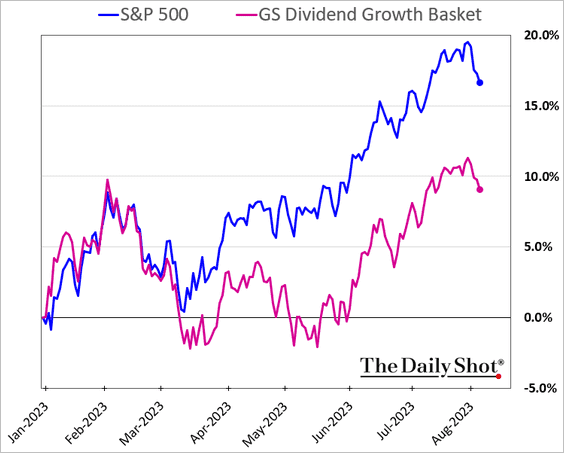
3. Dividend growers have underperformed this year.
4. Measured in terms of options delta, net call purchases have been unprecedented.
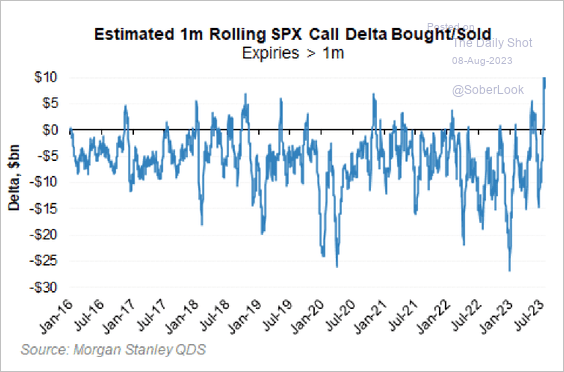 Source: Morgan Stanley Research
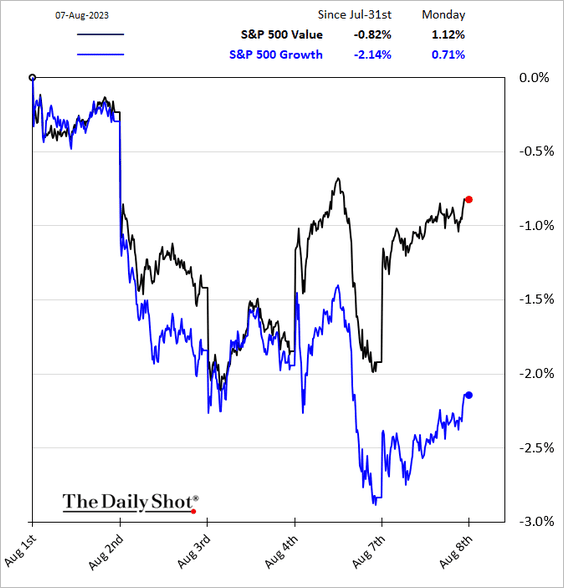
5. Value stocks have outperformed growth in recent days.
6. Is VIX headed higher?
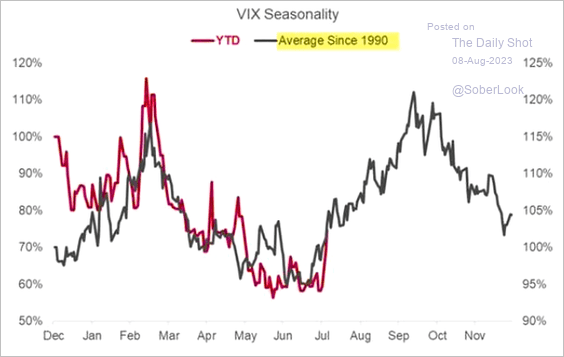 Source: Nomura Securities; h/t @themarketear
7. ETF managers have been boosting fees this year.
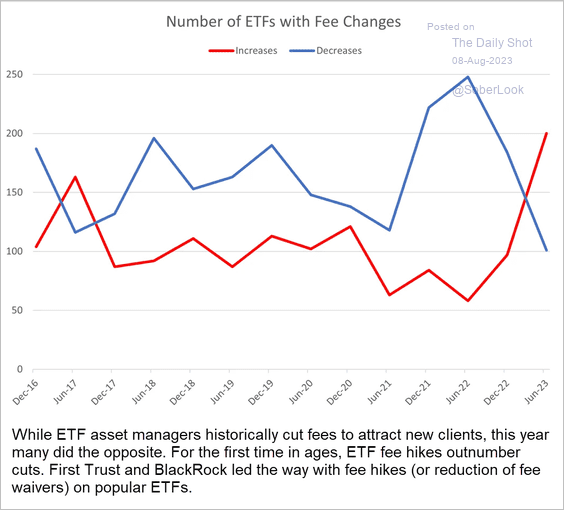 Source: @FactSet Read full article
Back to Index
Alternatives
1. There is a lot of distressed PE-backed debt.
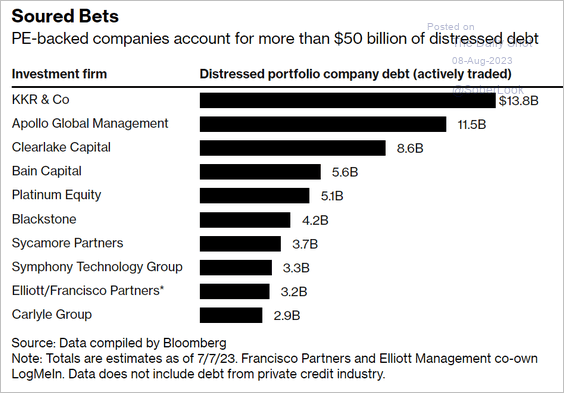 Source: @business Read full article
2. Next, we have some data on terminated PE/VC-backed deals.
 Source: S&P Global Market Intelligence
3. Here is a look at public vs. PE-owned US companies over time.
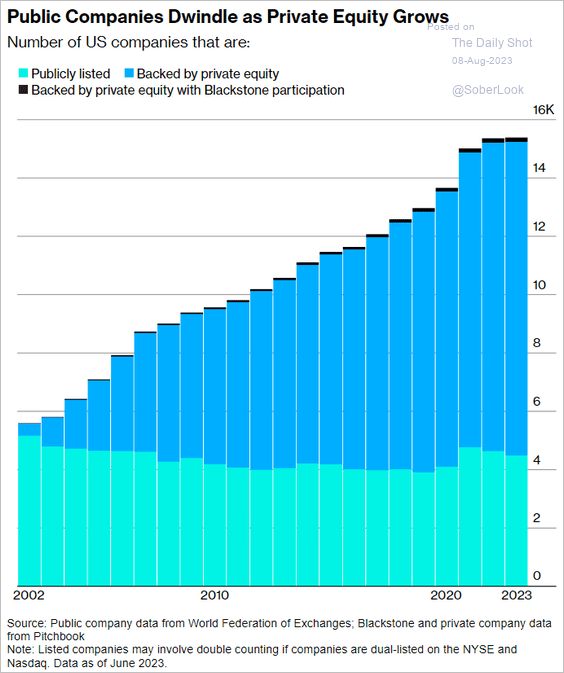 Source: @wealth Read full article
4. European private equity deal activity dropped to its lowest level since the onset of the 2020 pandemic.
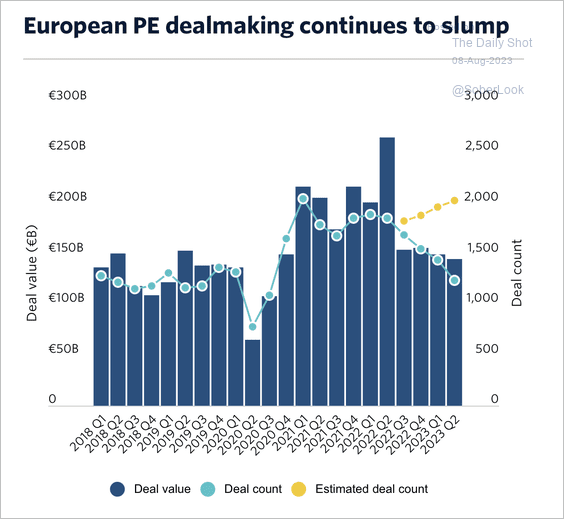 Source: PitchBook
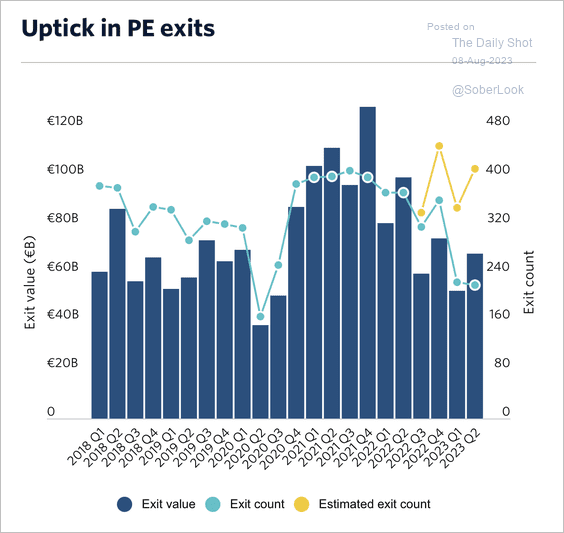
European private equity exits increased slightly in Q2. According to Pitchbook, sponsors are starting to exit large investments to free up capital in a tight fundraising environment.
 Source: PitchBook
——————–
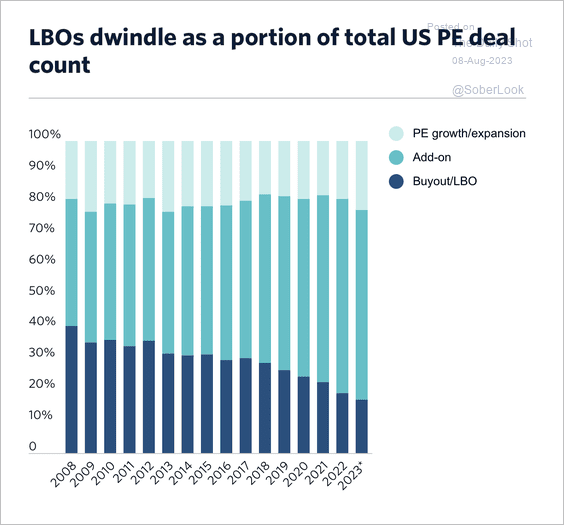
5. Leveraged buyouts have accounted for a lower share of US private equity deal counts in recent years.
 Source: PitchBook Read full article
Back to Index
Credit
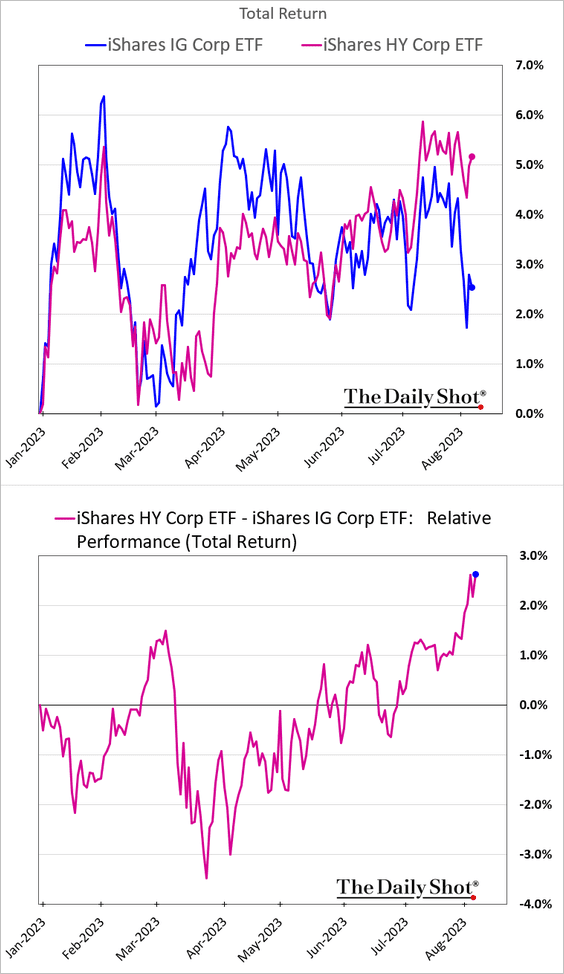
1. High-yield bonds have been outperforming investment-grade debt.
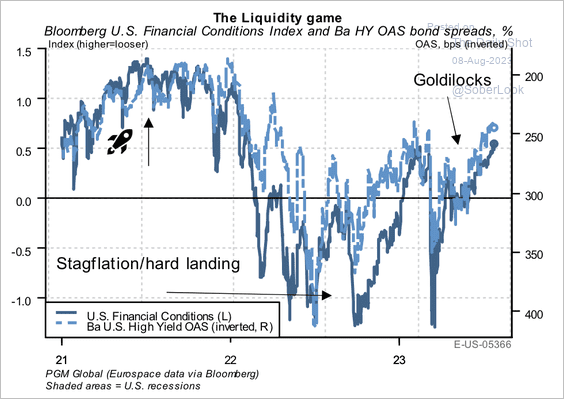
2. US high-yield spreads have narrowed as financial conditions loosened.
 Source: PGM Global
3. Demand for commercial real estate loans has deteriorated.
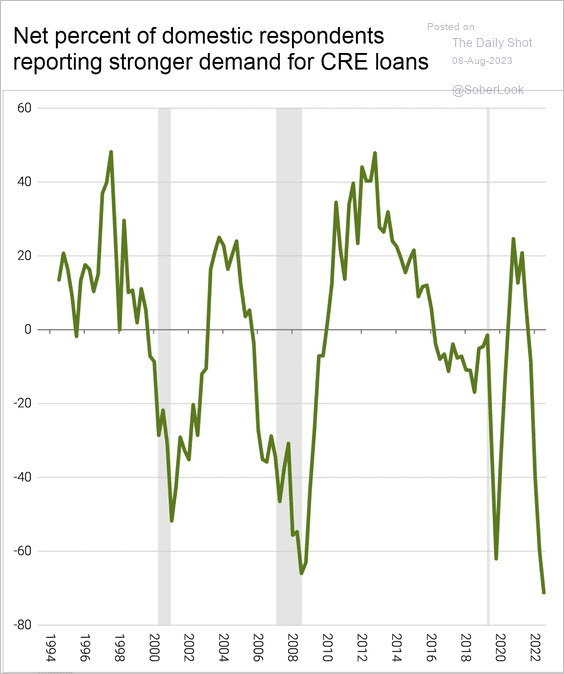 Source: @FactSet Read full article
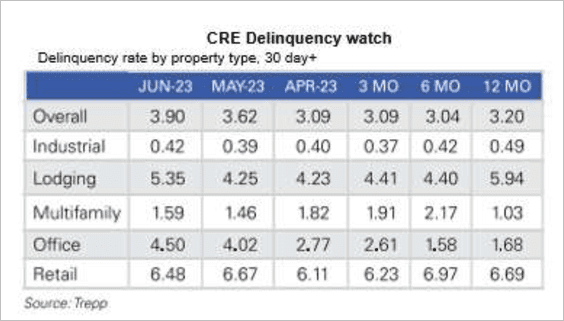
Here is a look at US commercial real estate delinquency rates by property type.
 Source: PGM Global
——————–
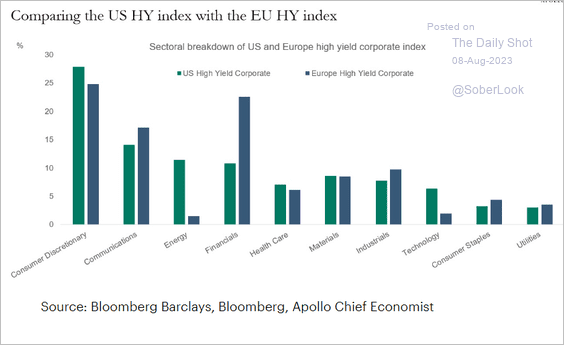
4. Finally, here is a look at the US vs. European HY index sector weights.
 Source: Torsten Slok, Apollo
Back to Index
Rates
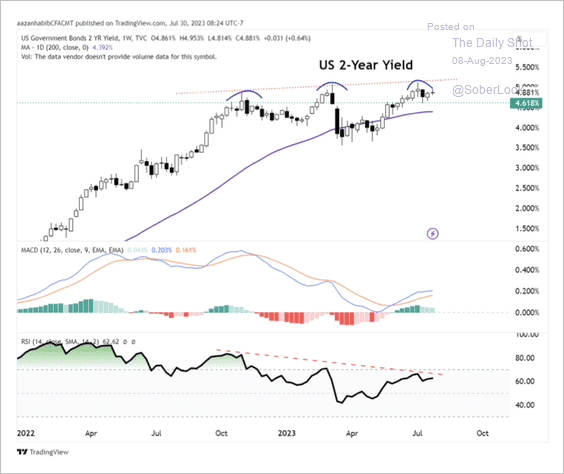
1. The 2-year Treasury yield is hovering under the 5% resistance zone as upside momentum fades.
 Source: Aazan Habib, Paradigm Capital
2. Speculators are positioned for a deeper curve inversion.
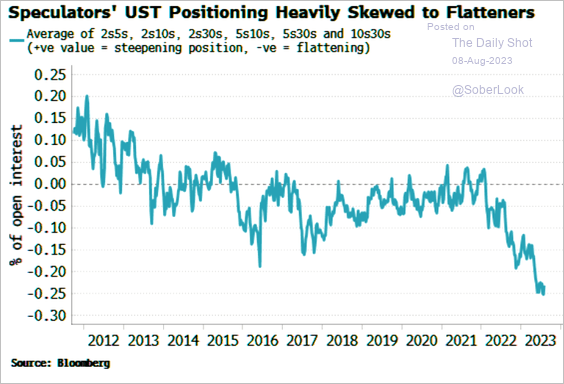 Source: Simon White, Bloomberg Markets Live Blog
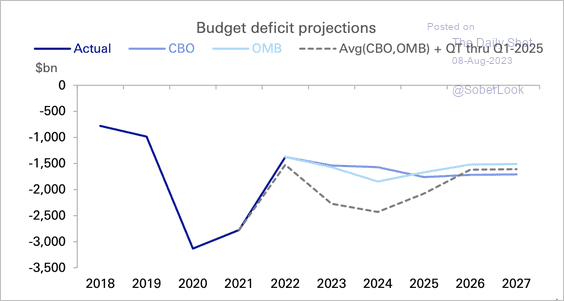
3. Treasury borrowing needs are elevated over the next few years. According to Deutsche Bank, this could be significantly higher if the Fed’s policy remains tight through 2024-2025.
 Source: Deutsche Bank Research
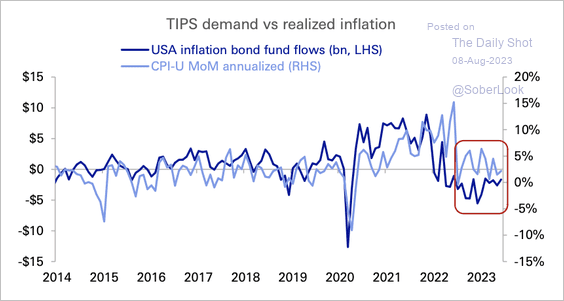
4. TIPS fund flows have weakened since inflation began to moderate.
 Source: Deutsche Bank Research
Back to Index
Global Developments
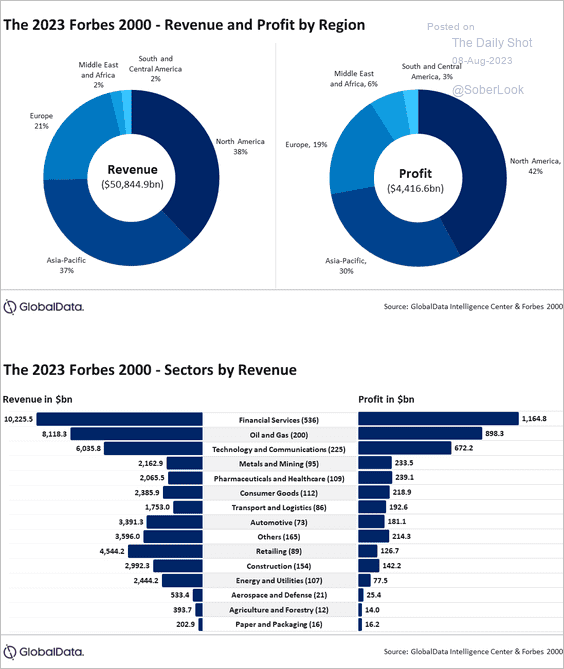
1. Here is a look at the Forbes 2000 list.
 Source: GlobalData
2. Manufacturing activity is starting to improve relative to services.
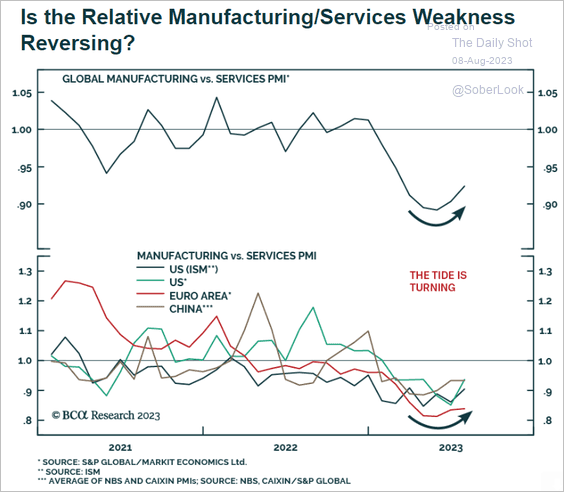 Source: BCA Research
3. G7 headline inflation is moderating, although core inflation remains elevated.
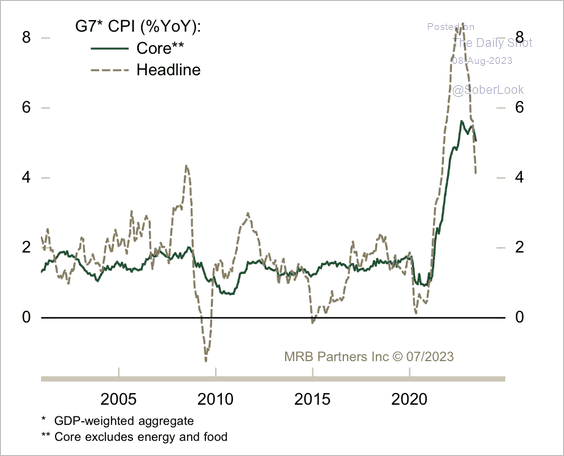 Source: MRB Partners
4. Secondhand luxury watch prices continue to fall.
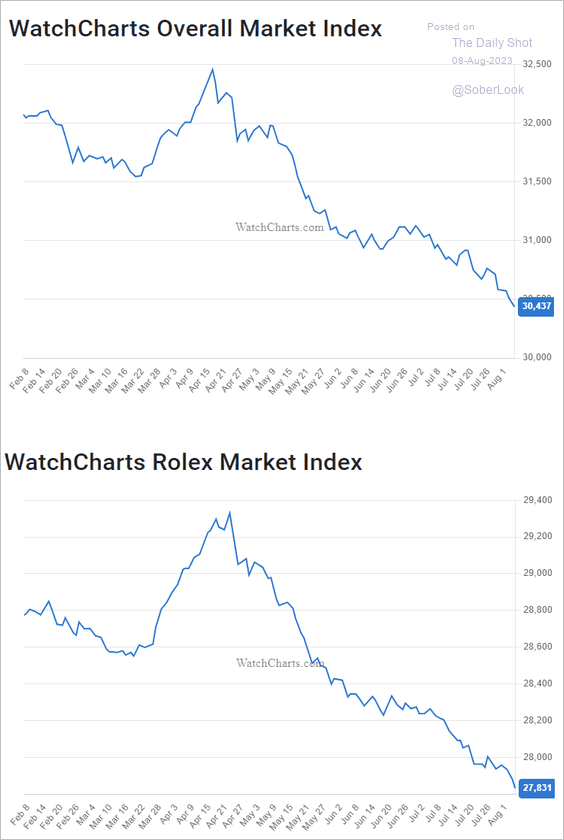 Source: WatchEnthusiasts
——————–
Food for Thought
1. US Supreme Court justices’ ideology over time:
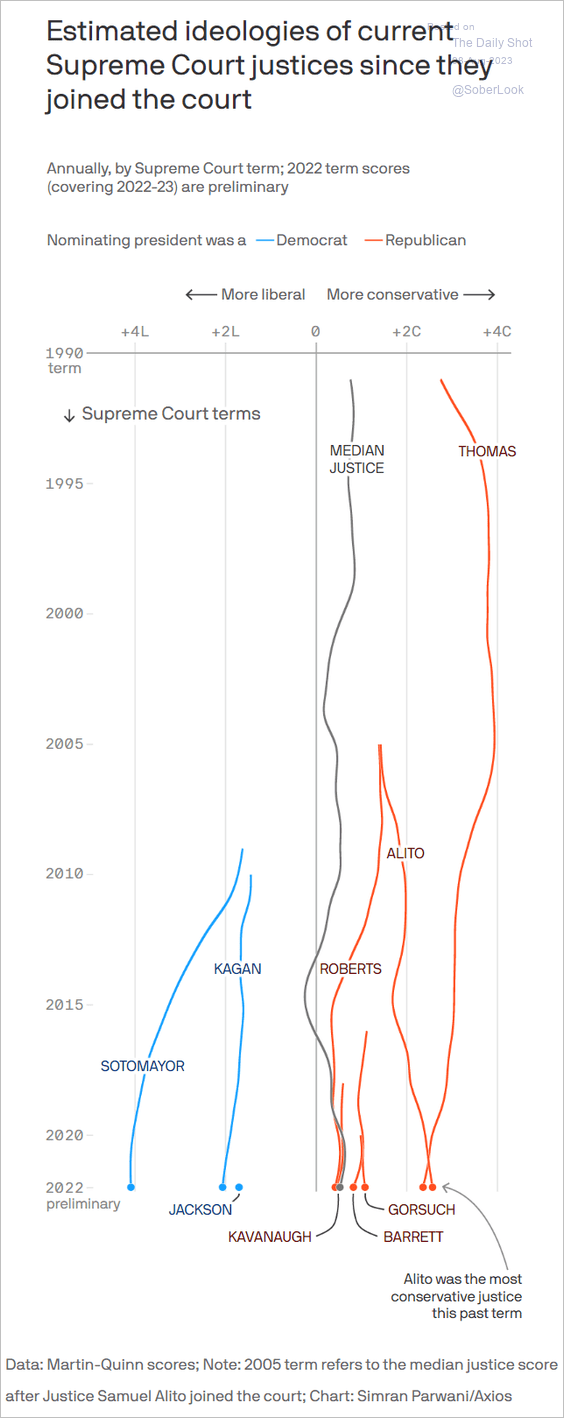 Source: @axios Read full article
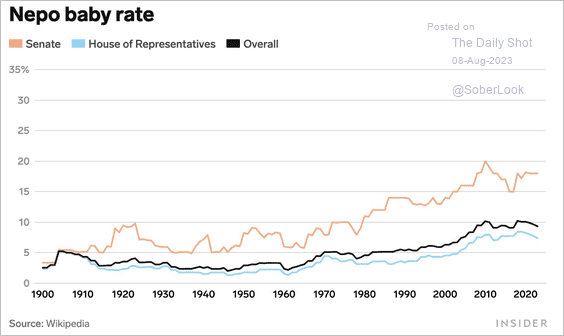
2. How many US Congress members have at least one parent who has a Wikipedia page?
 Source: Business Insider Read full article
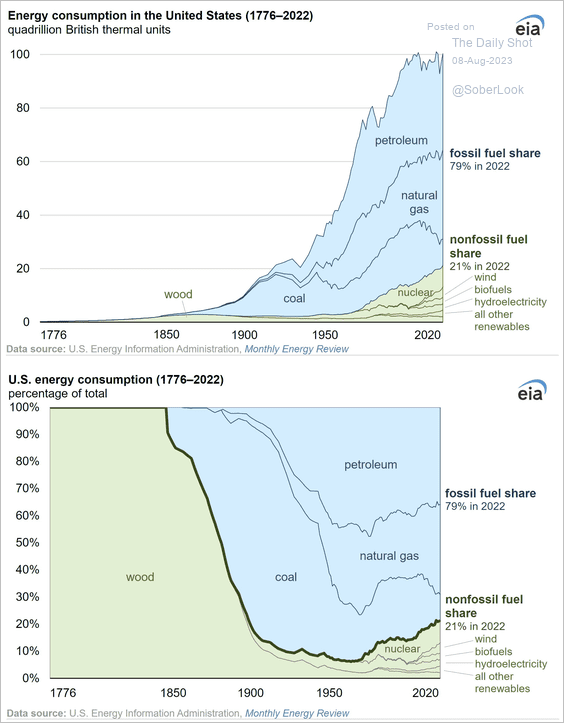
3. US energy consumption:
 Source: @EIAgov
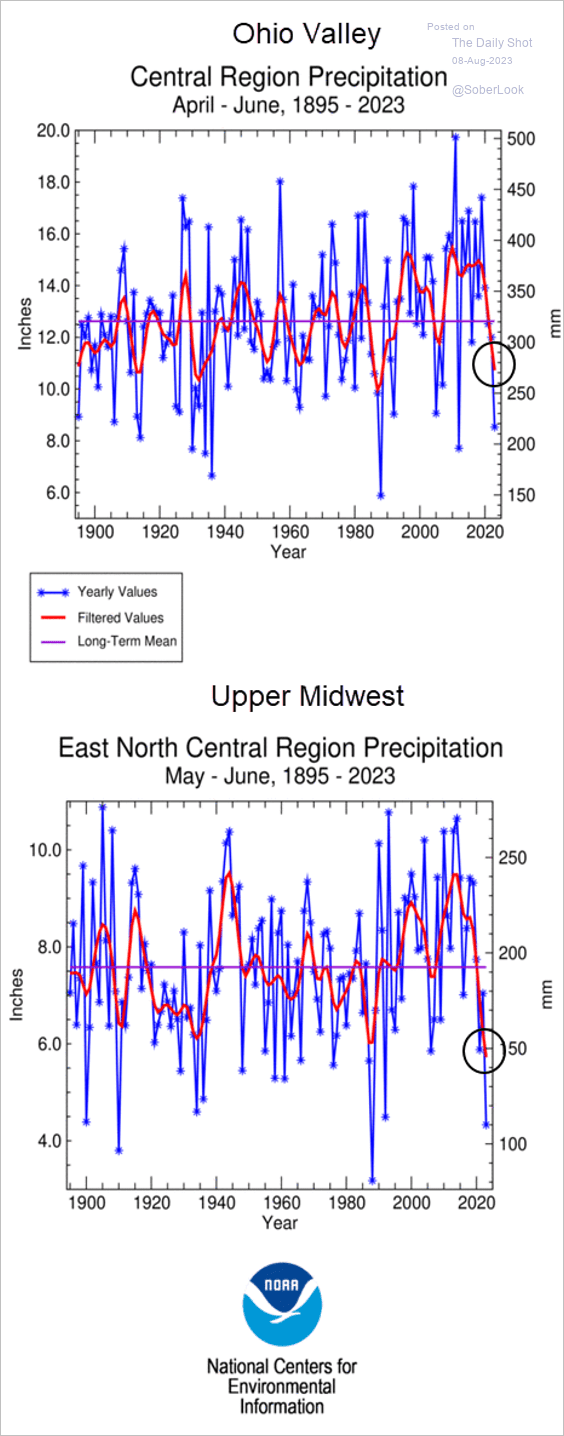
4. Midwest drought:
 Source: NOAA Read full article
5. Life expectancy:
• by US state:
 Source: USAFacts
• over time:
 Source: The Economist Read full article
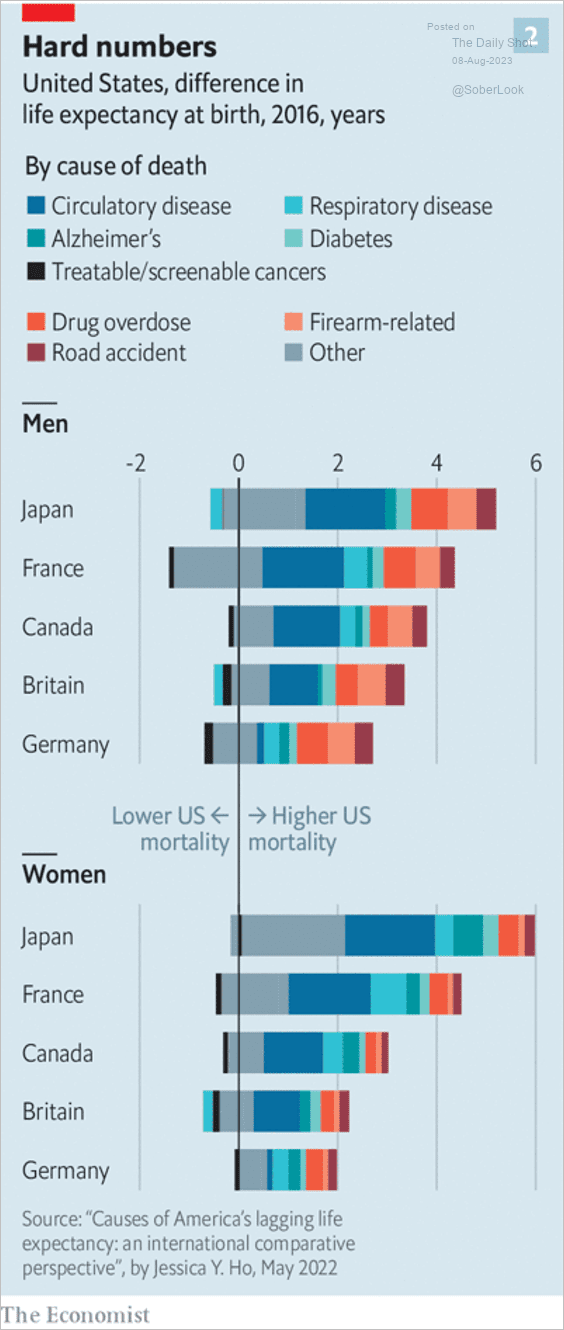
• What explains the difference in life expectancy between the US and other advanced economies?
 Source: The Economist Read full article
——————–
6. Buying fossil fuels from Russia:
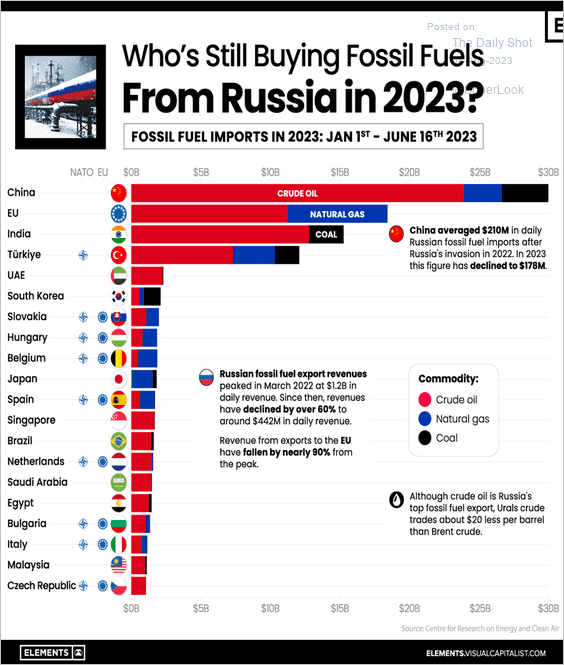 Source: Visual Capitalist Read full article
7. Back-to-school spending:
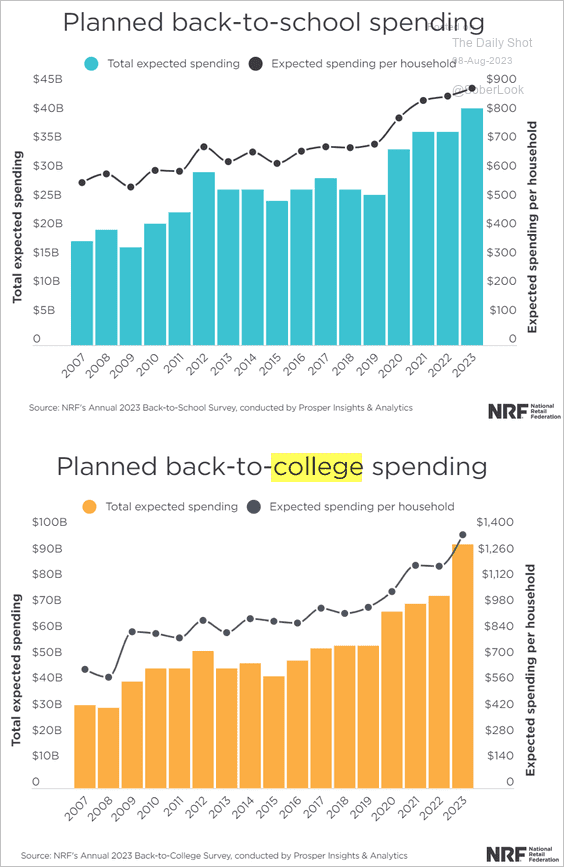 Source: NRF
8. Mega Millions lottery jackpot:
 Source: @chartrdaily
——————–
Back to Index