
The Daily Shot: 31-Aug-23
• The United States
• The United Kingdom
• The Eurozone
• Japan
• Asia-Pacific
• China
• Emerging Markets
• Cryptocurrency
• Commodities
• Energy
• Equities
• Credit
• Rates
• Global Developments
• Food for Thought
The United States
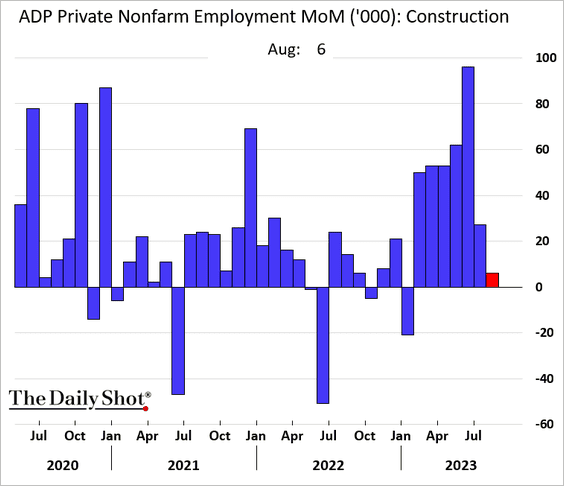
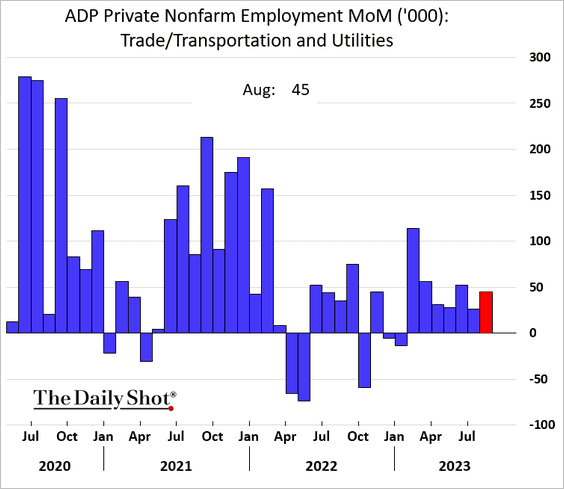
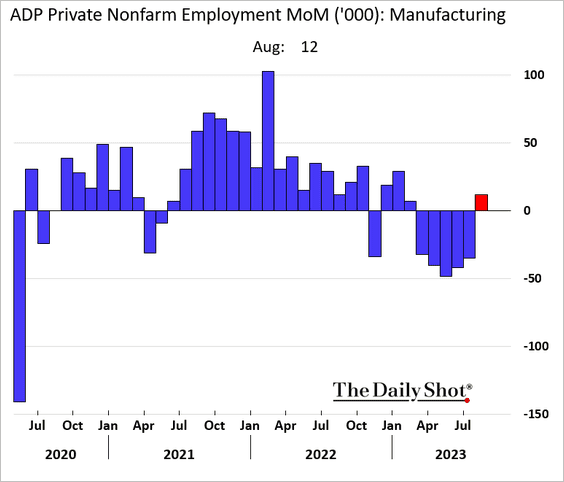
1. The ADP private payrolls report for August came in well below expectations. Although this metric isn’t a reliable forecaster of the official employment report, it suggests a potential slowdown in the job market.
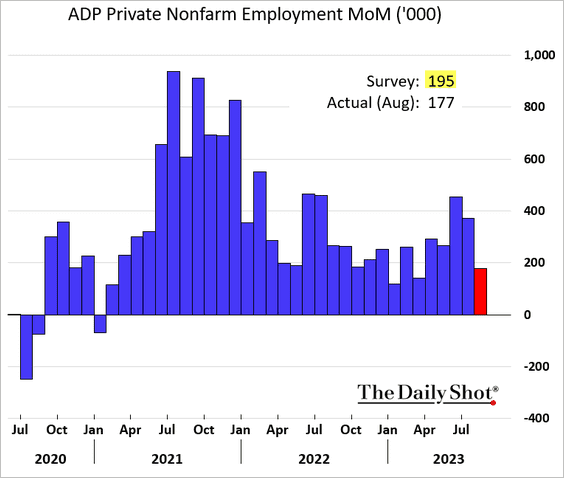
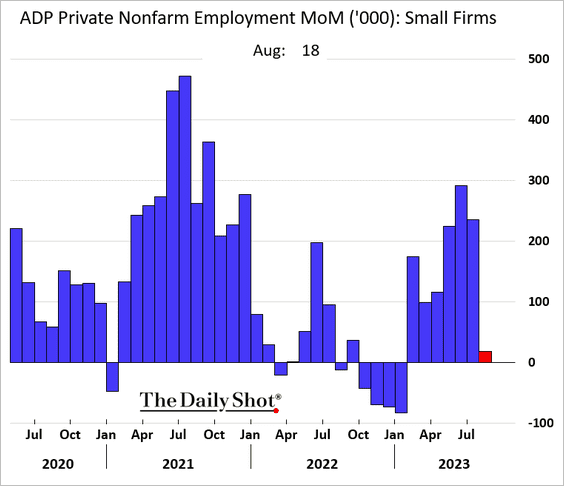
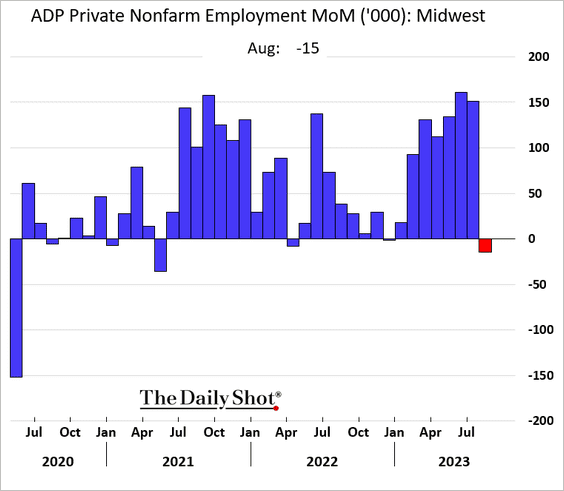
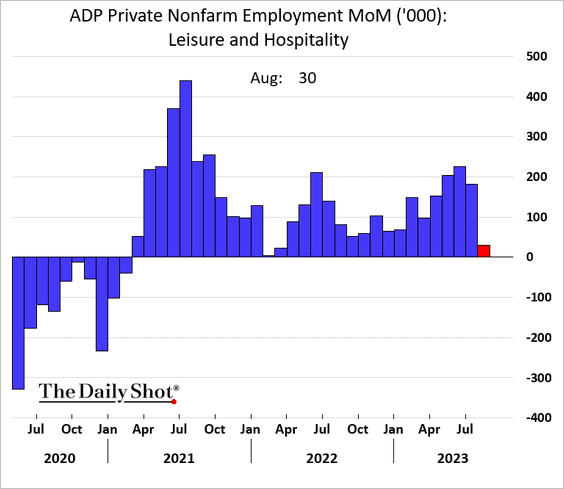
• Here are the key drivers of the decline.
– Small businesses:
– The Midwest region:
– Hotels, restaurants, bars:
• Below are some additional hiring trends.
– Construction:
– Logistics:
– Manufacturing (first increase in six months):
——————–
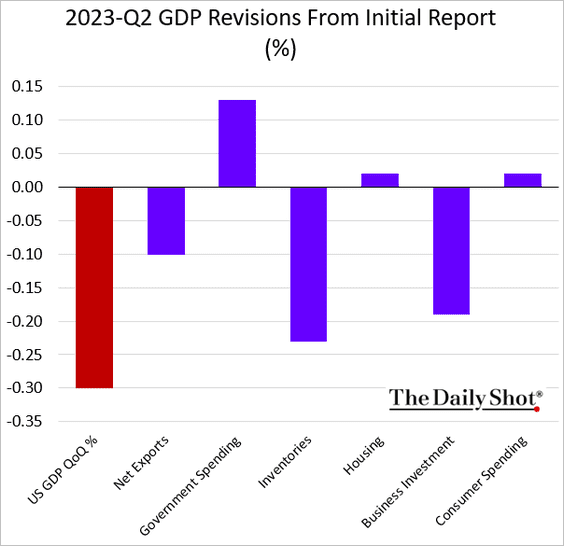
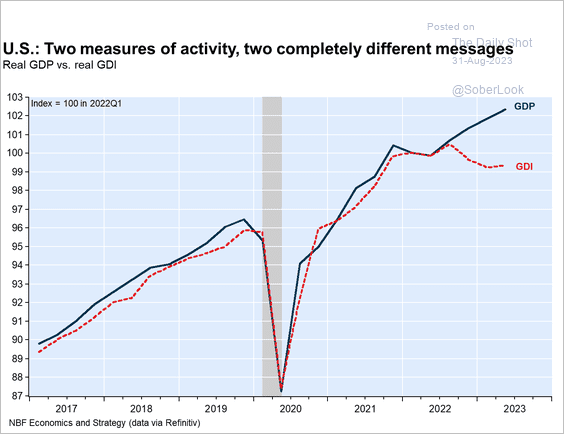
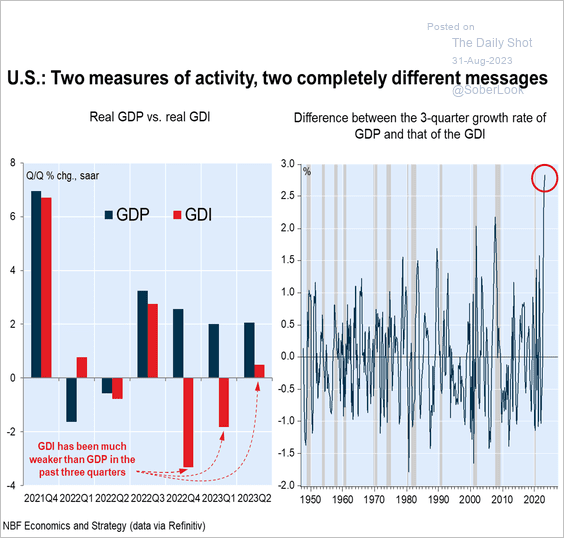
2. The Q2 GDP growth has been revised downward. Here are the drivers.
• The widening disparity between GDP and GDI indicates potential challenges for future GDP growth (2 charts).
 Source: Economics and Strategy Group, National Bank of Canada
 Source: Economics and Strategy Group, National Bank of Canada
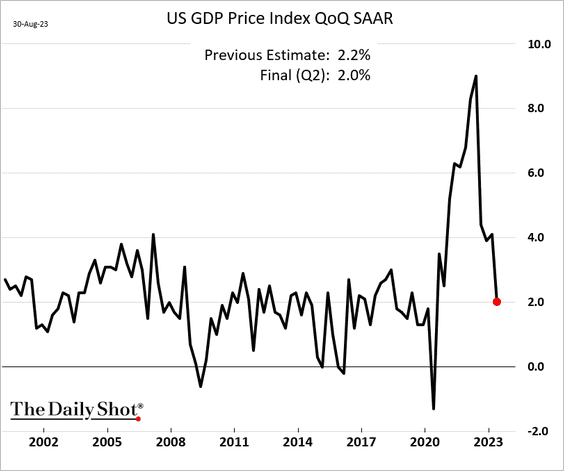
• The GDP deflator is back at 2%.
——————–
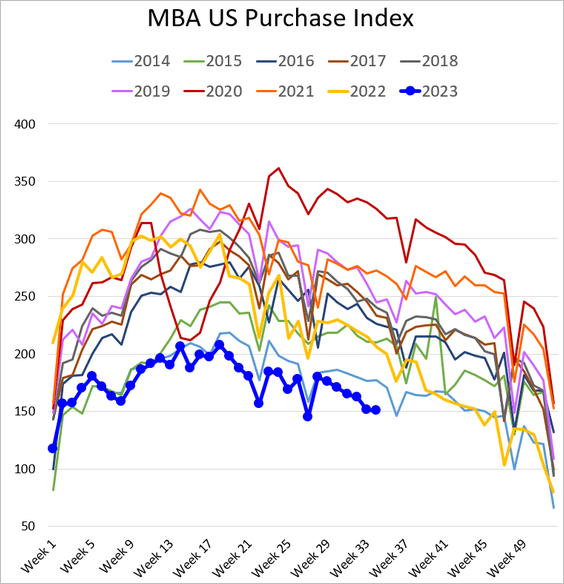
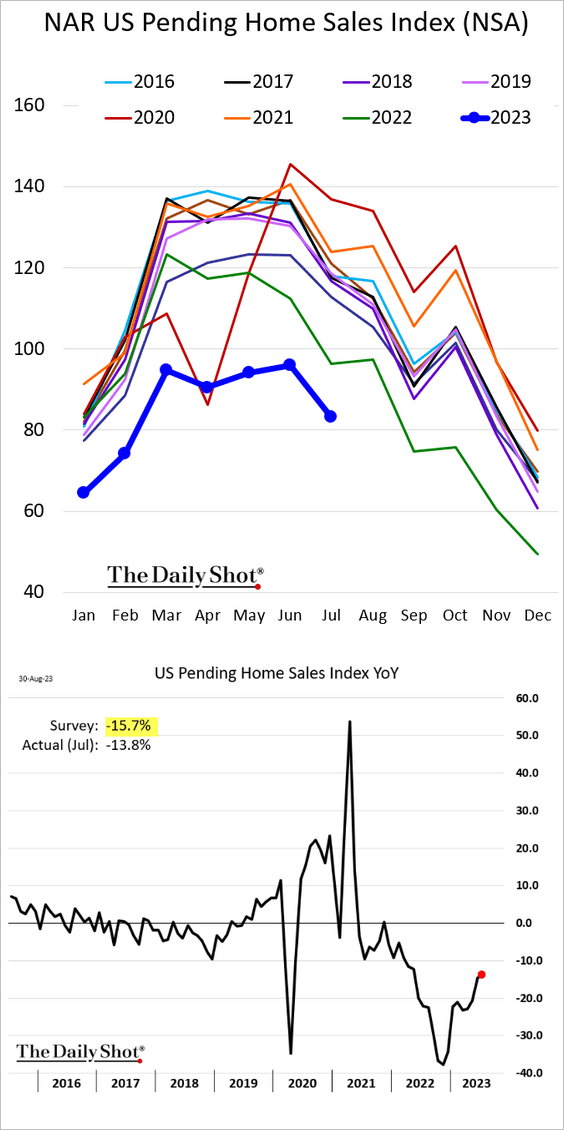
3. Next, we have some updates on the housing market.
• Mortgage applications remain soft.
– While still at multi-year lows, pending home sales showed some improvement last month (topping expectations).
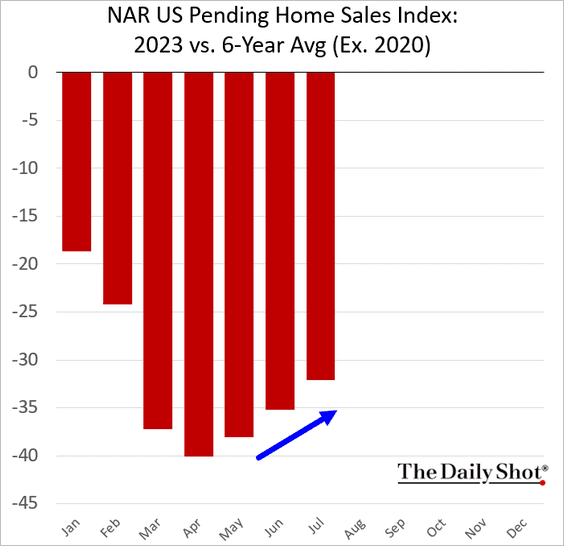
Here is the comparison of the 2023 pending home sales index versus the average of 2016-2022 (ex 2020).
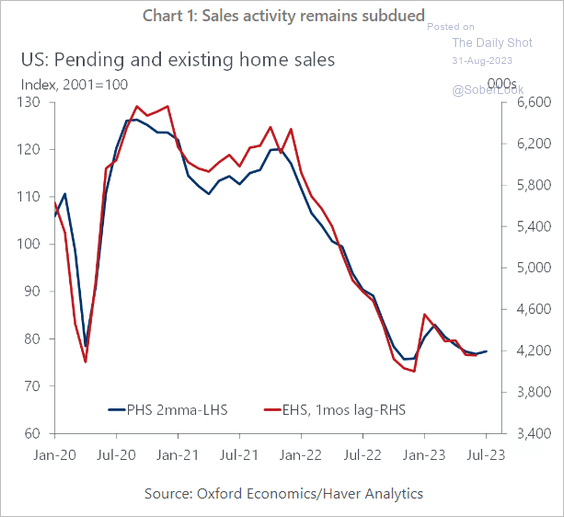
– The uptick in pending sales is expected to manifest in September’s report on existing home sales.
 Source: Oxford Economics
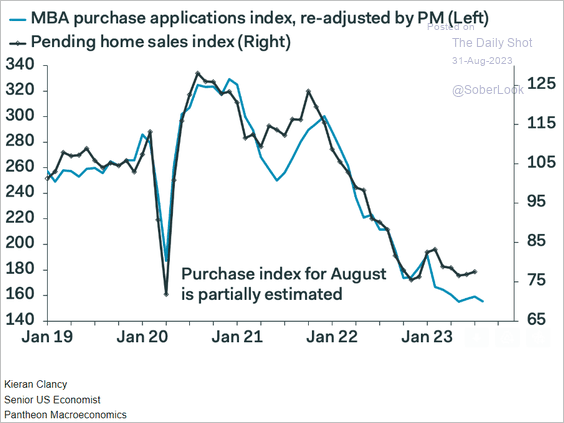
– Weak mortgage applications point to downside risks for home sales.
 Source: Pantheon Macroeconomics
• Investors’ residential real estate purchases are well below last year’s levels, but their market share remains elevated.
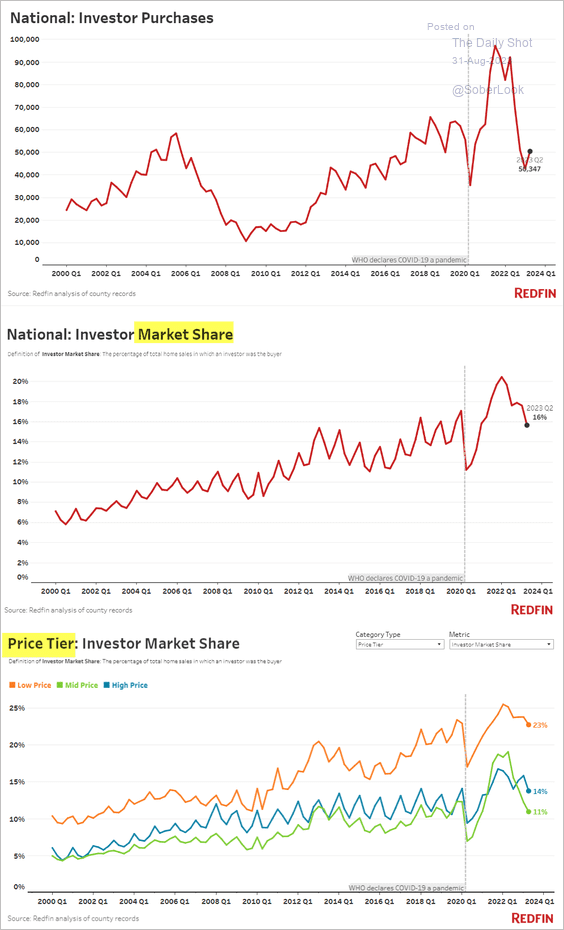 Source: Redfin
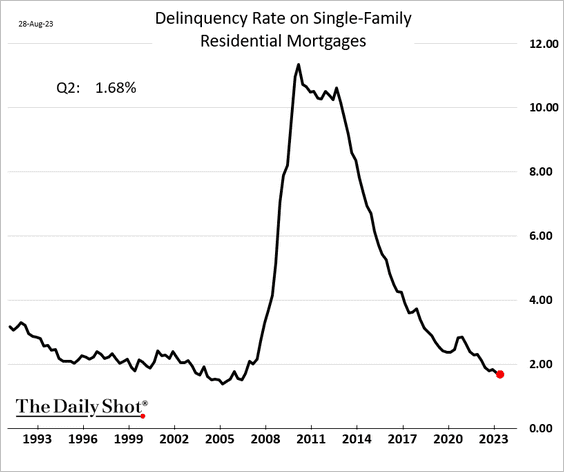
• Mortgage delinquencies continue to fall.
——————–
4. The trade deficit in goods widened last month as imports increased more than exports.
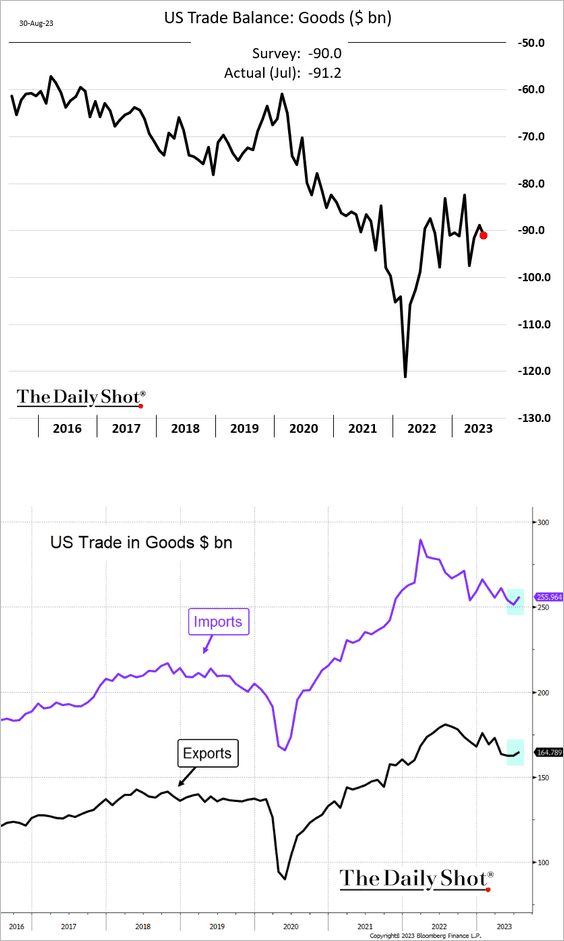 Source: @TheTerminal, Bloomberg Finance L.P.
• This chart shows containers moving through the West Coast ports.
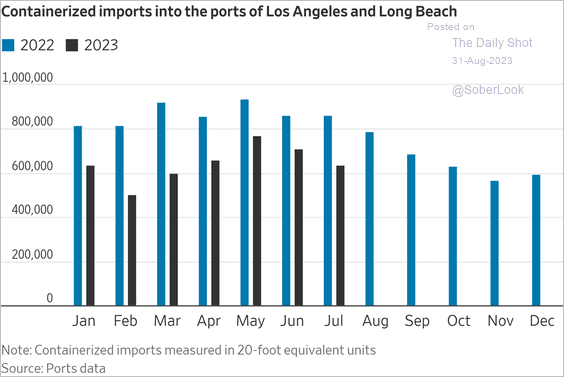 Source: @WSJ Read full article
——————–
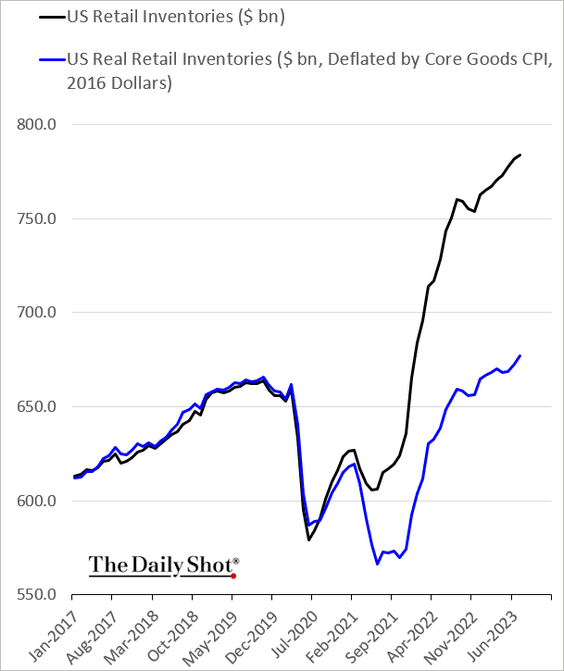
5. Real retail inventories are now well above pre-COVID levels.
6. Federal spending on road construction has been rising.
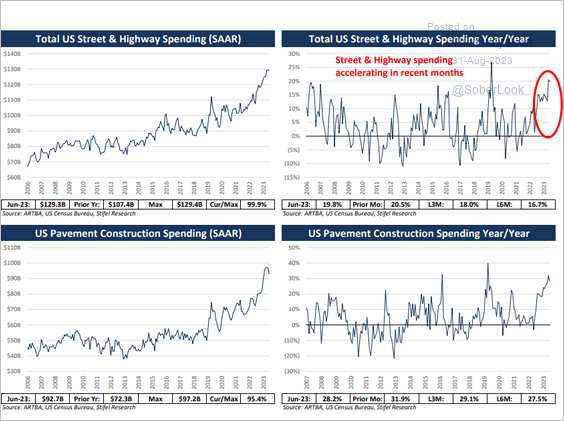 Source: Stifel
Back to Index
The United Kingdom
1. Mortgage approvals declined more than expected last month.
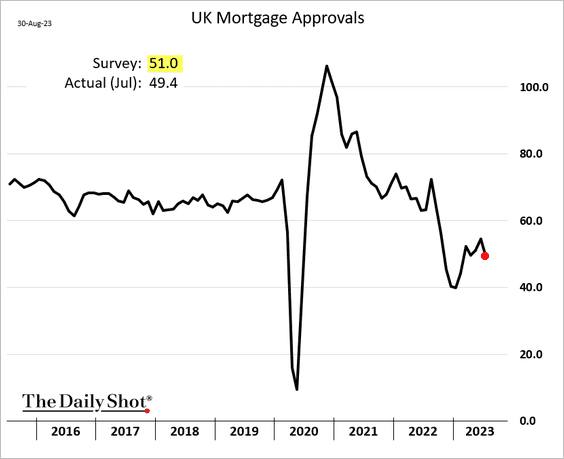
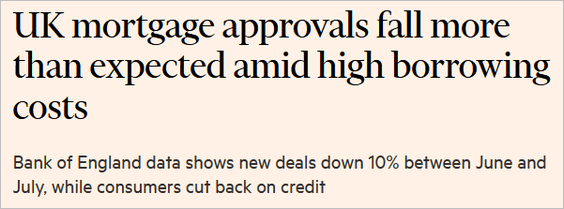 Source: @financialtimes Read full article
——————–
2. Home sales have been soft this year.
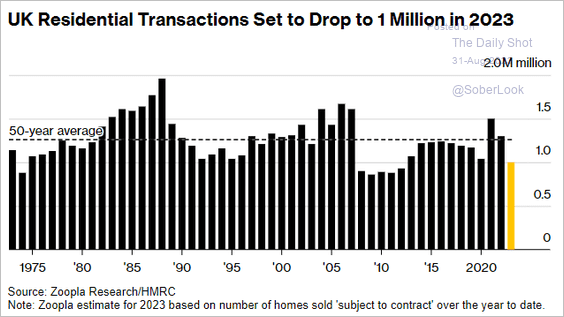 Source: @economics Read full article
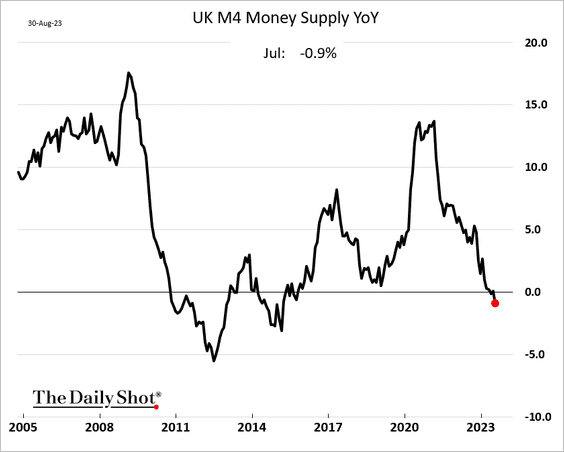
3. The broad money supply is now down on a year-over-year basis.
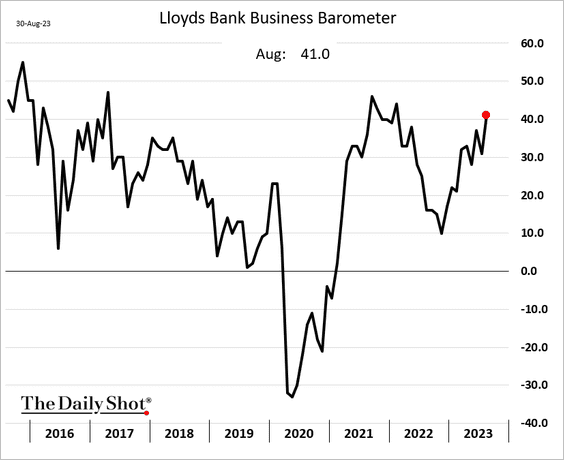
4. The Lloyds Bank business sentiment index continues to improve.
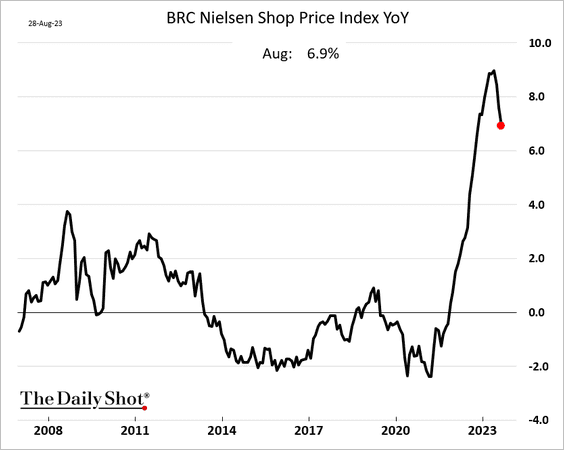
5. Shop price inflation has finally peaked.
Back to Index
The Eurozone
1. Germany’s CPI remained stubbornly high this month.
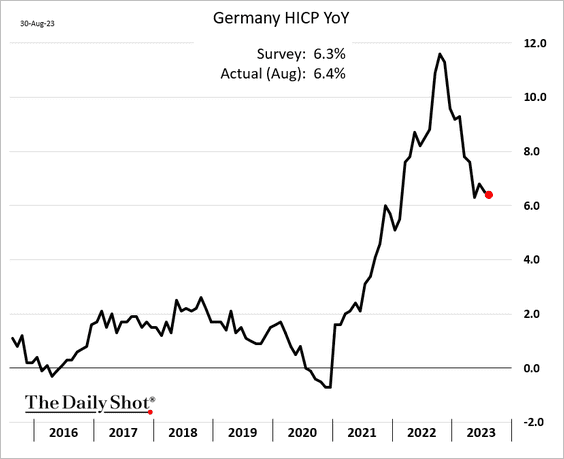
 Source: @economics Read full article
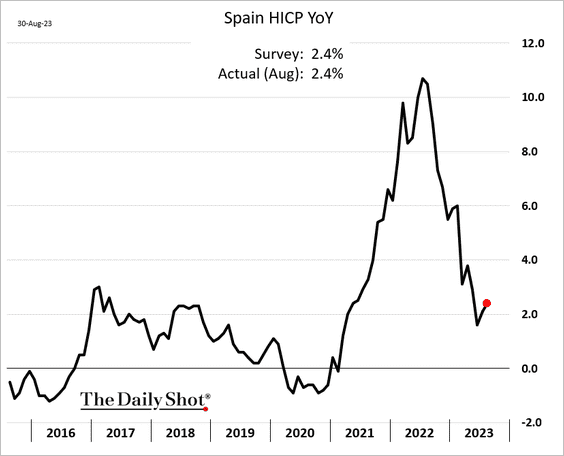
Spain’s CPI climbed again, …
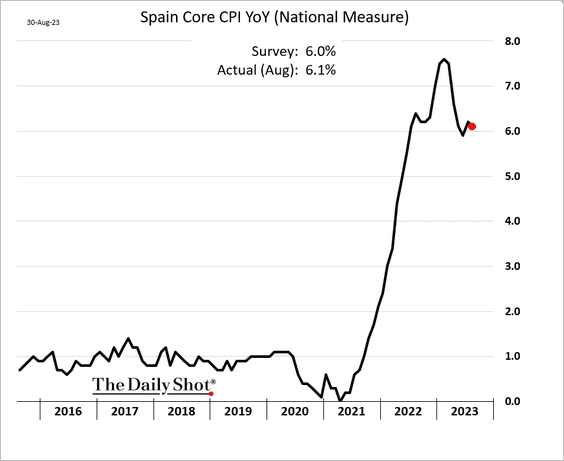
… and core inflation was higher than expected.
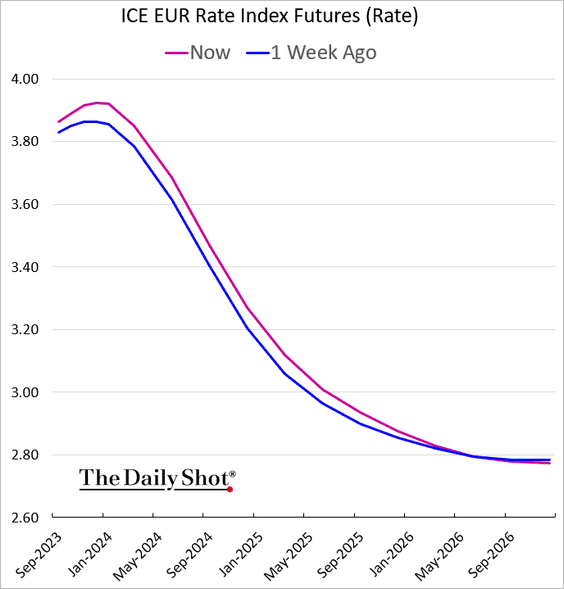
2. Rate hike expectations climbed in response to the CPI report.
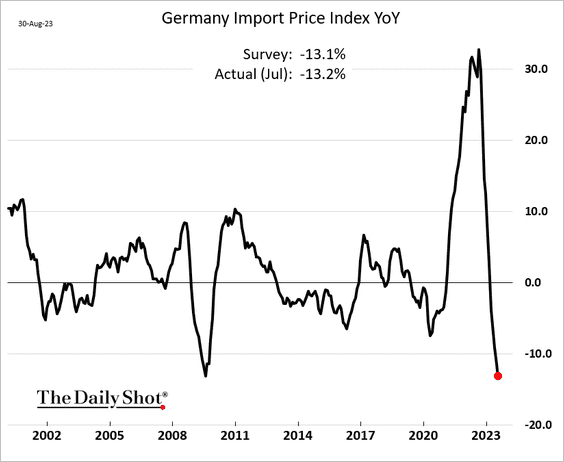
3. Leading indicators point to easing inflation in Germany.
• Import prices:
• Survey data (2 charts):
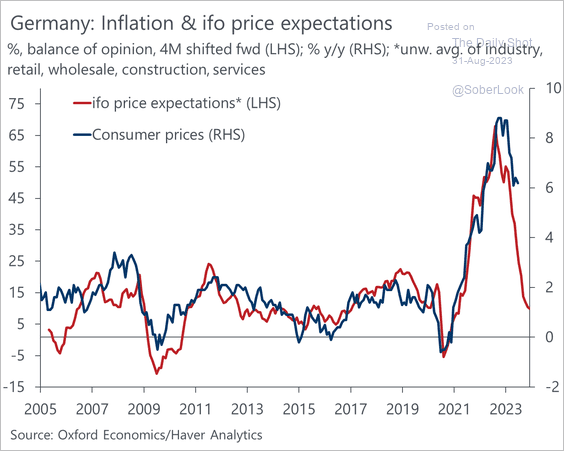 Source: @OliverRakau
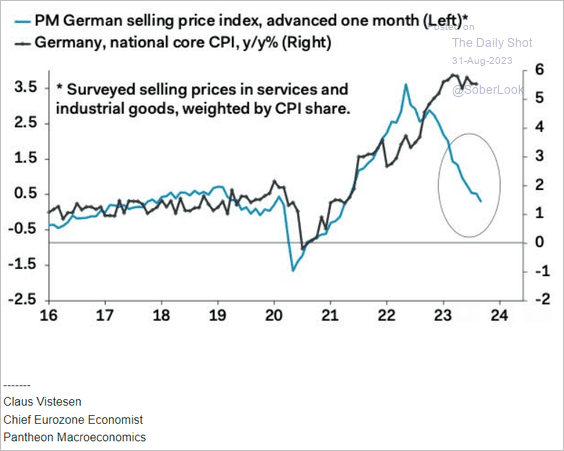 Source: Pantheon Macroeconomics
——————–
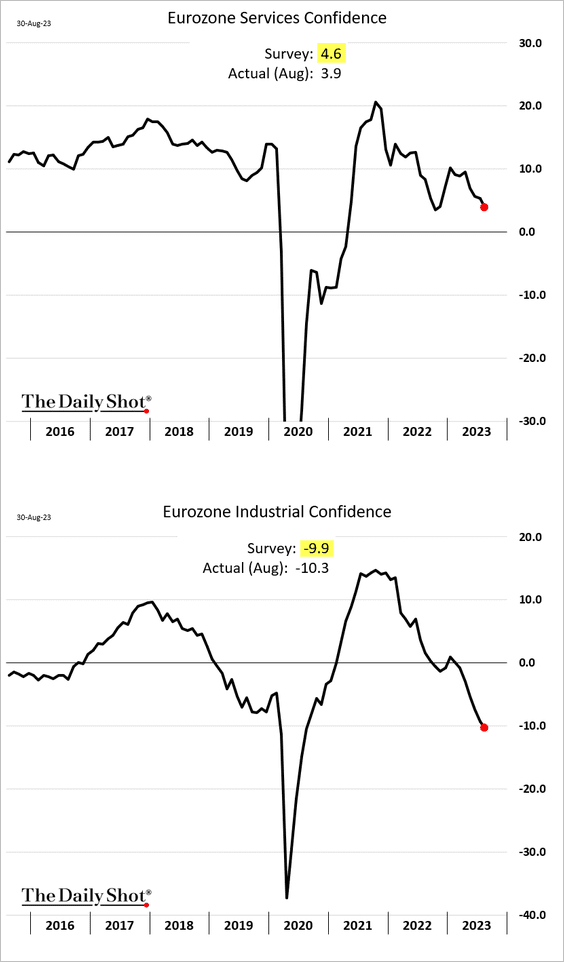
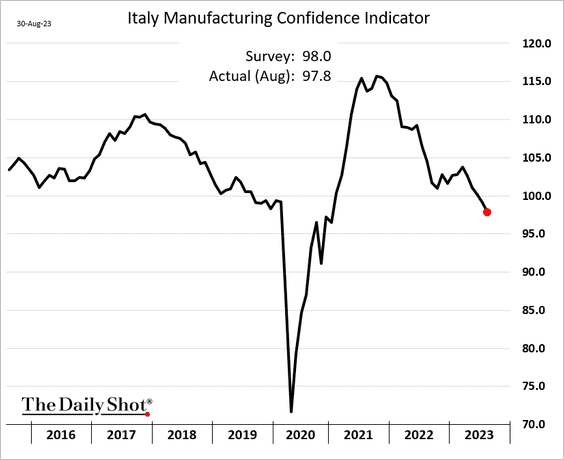
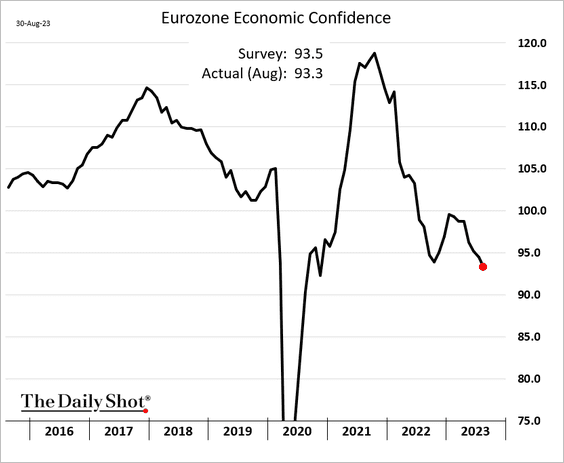
4. Euro-area business confidence deteriorated further in August.
Here is Italy’s manufacturing confidence.
This chart shows the economic confidence in the Eurozone, encompassing both business and consumer sentiment.
Back to Index
Japan
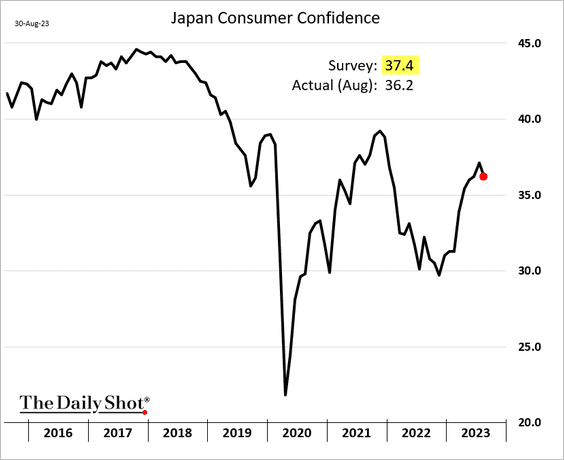
1. Consumer confidence eased this month.
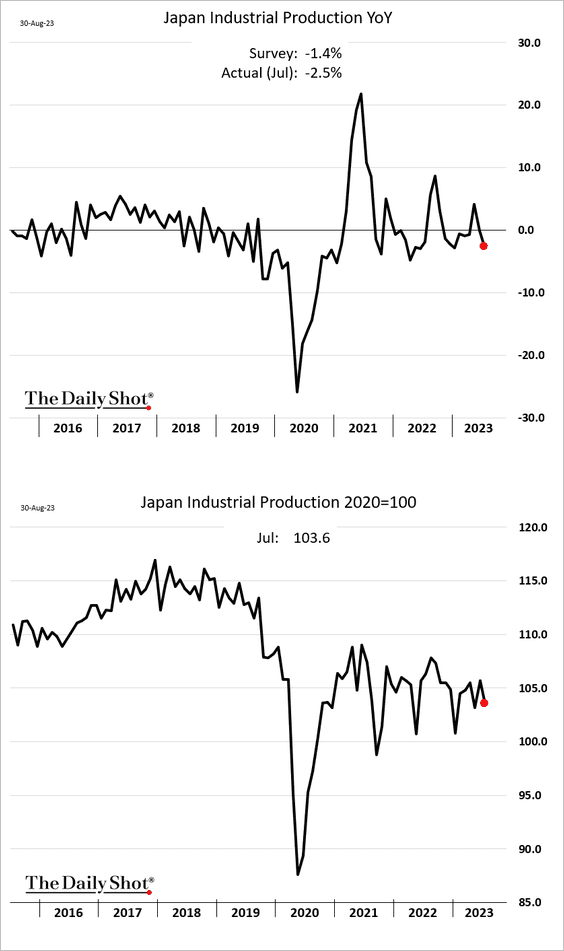
2. Industrial production declined more than expected in July.
Back to Index
Asia-Pacific
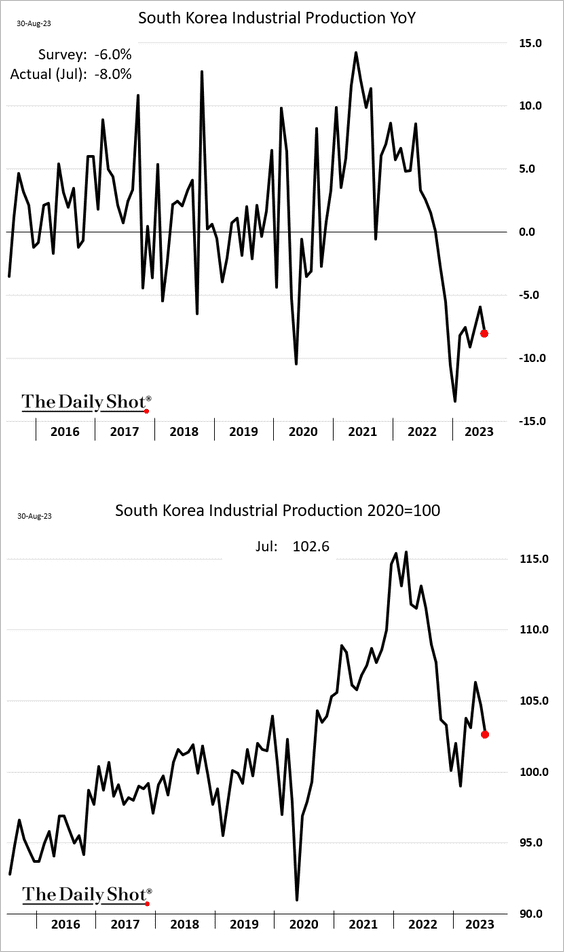
1. South Korea’s industrial production is down 8% vs. 2022.
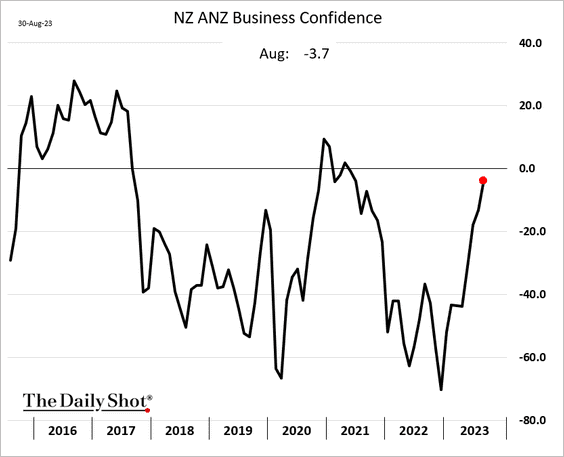
2. New Zealand’s business confidence is improving.
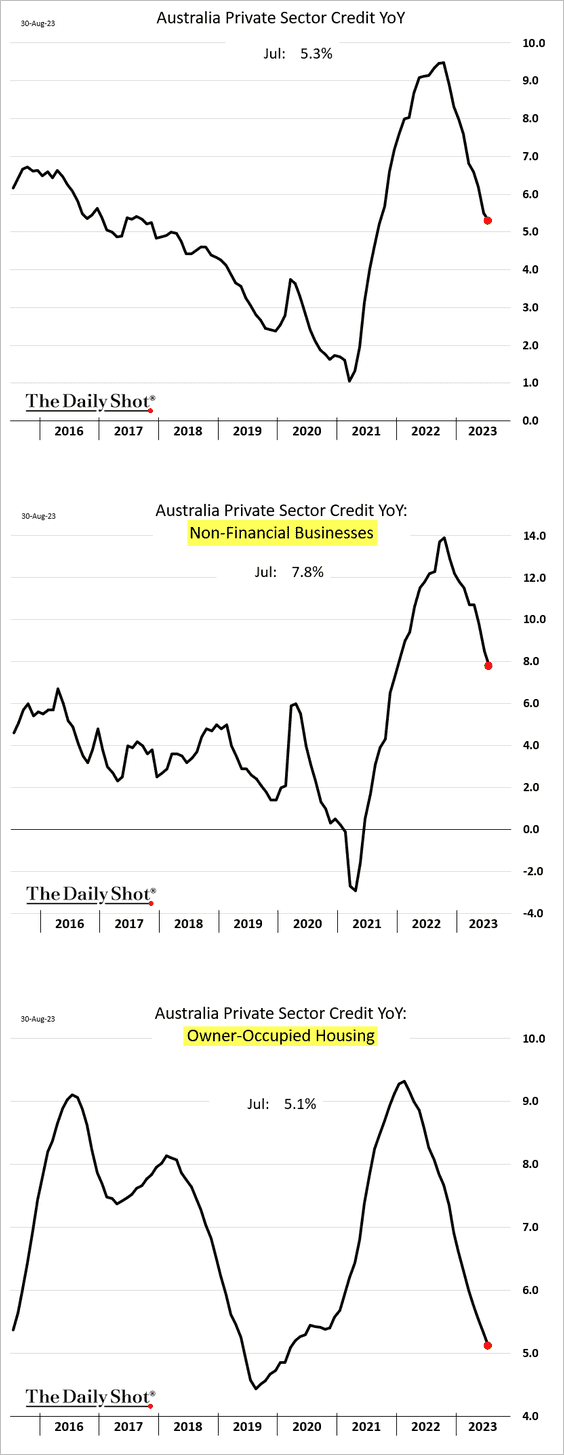
3. Australia’s credit growth is decelerating, yet it remains over 5% higher compared to the previous year.
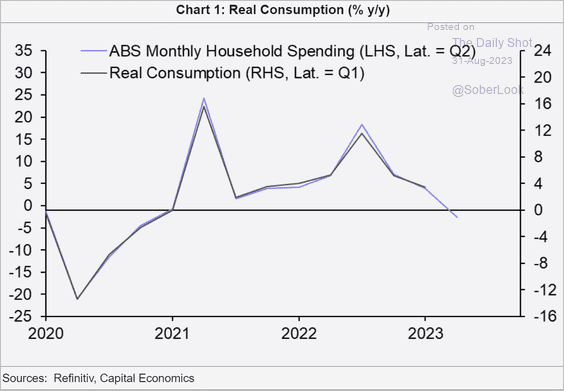
Australian household spending continues to slow.
 Source: Capital Economics
Back to Index
China
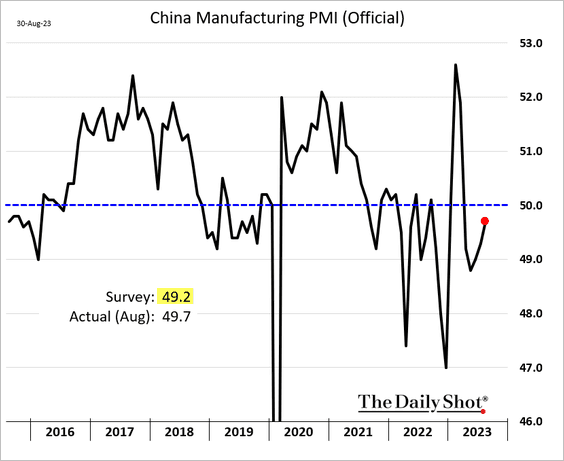
1. The official manufacturing PMI remained in the contractionary zone this month, though its pace has slowed.
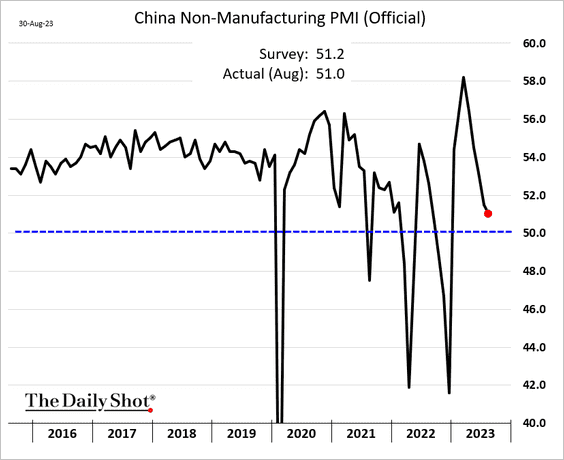
Non-manufacturing growth eased further.
——————–
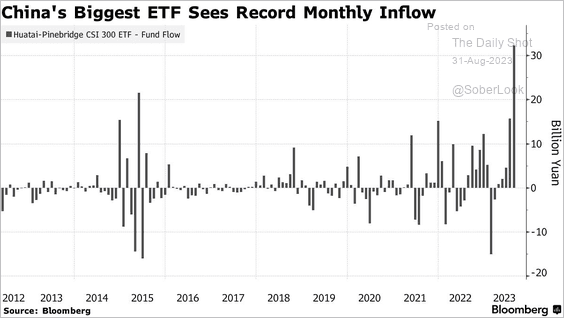
2. Investors have been buying the largest domestic equity ETF.
 Source: @markets Read full article
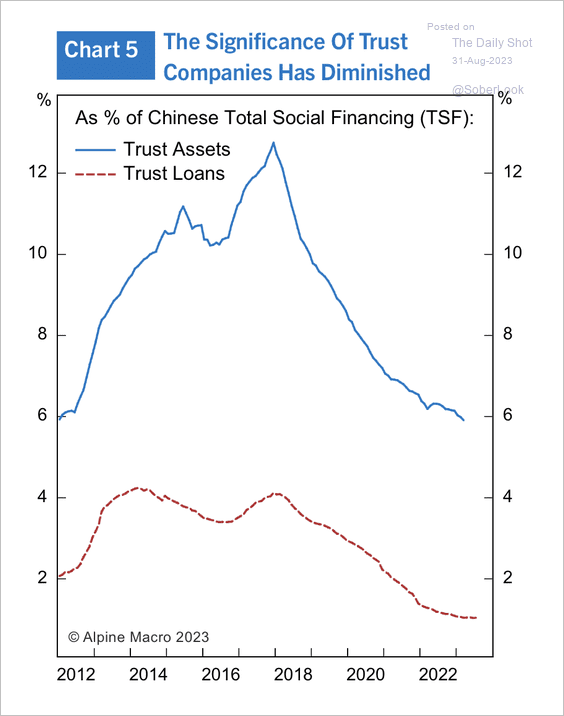
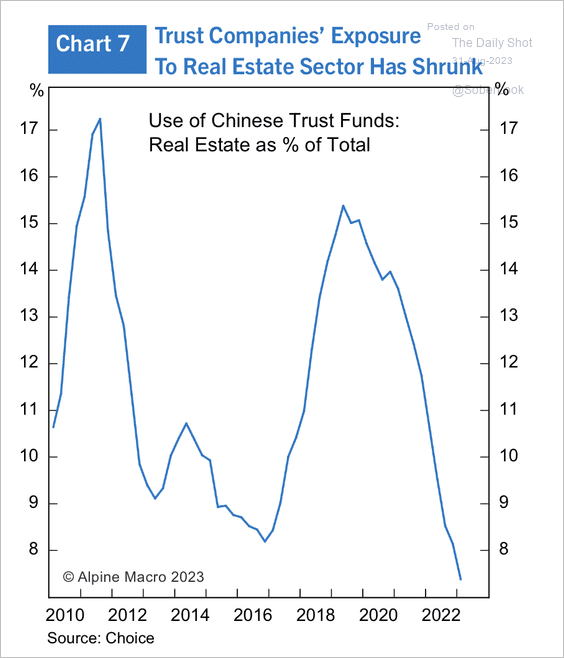
3. The significance of the trust sector in the overall economy has diminished due to heightened regulatory scrutiny, which could limit contagion risk.
 Source: Alpine Macro
The real estate sector accounts for roughly 7% of all trust funds, down from 15% in 2020.
 Source: Alpine Macro
——————–
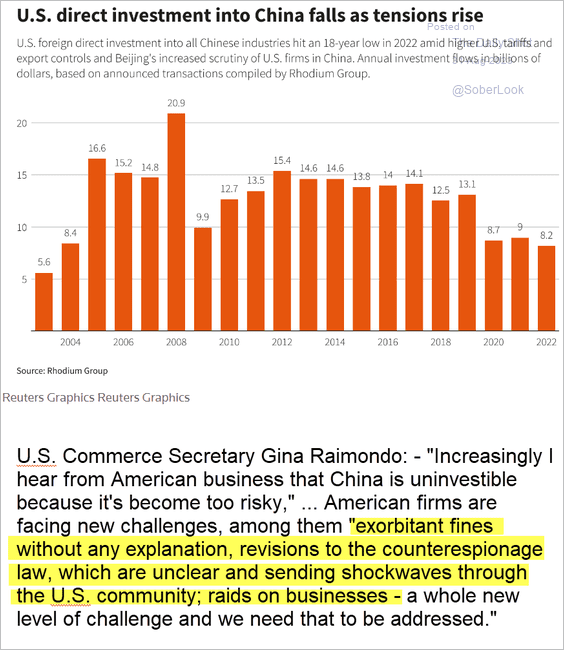
4. This chart shows US direct investment in China (see comment below).
 Source: Reuters Read full article
Back to Index
Emerging Markets
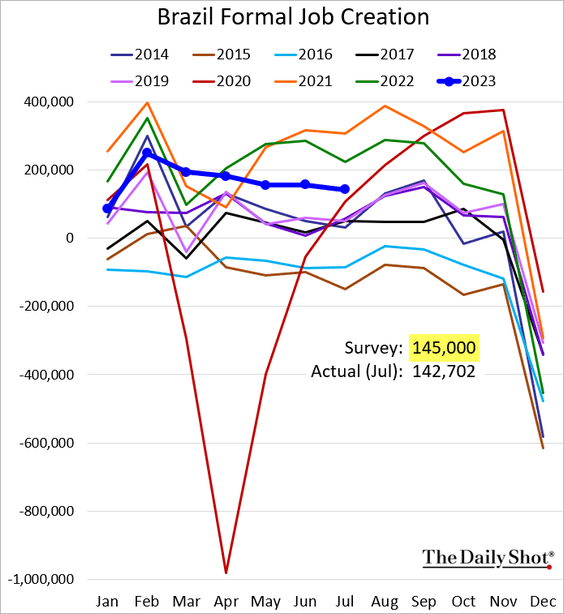
1. Brazil’s formal job creation is slowing.
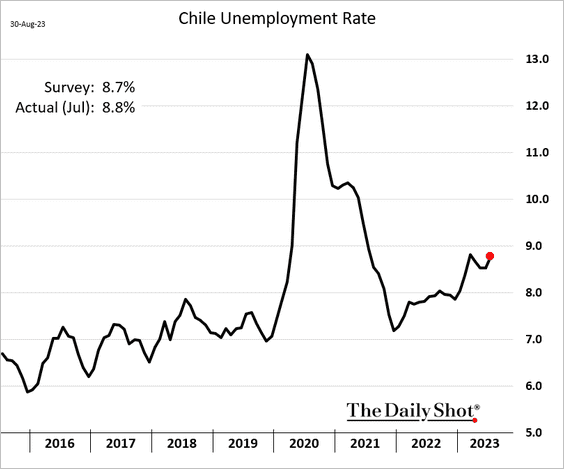
2. Chile’s unemployment rate continues to climb.
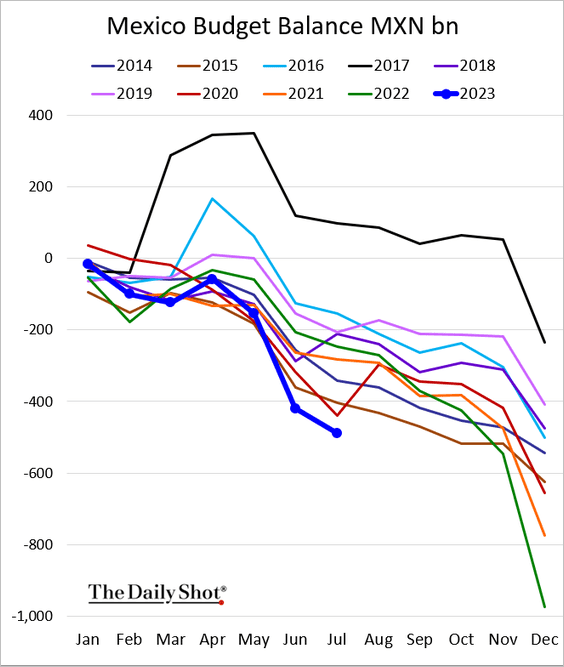
3. Here is Mexico’s cumulative budget deficit.
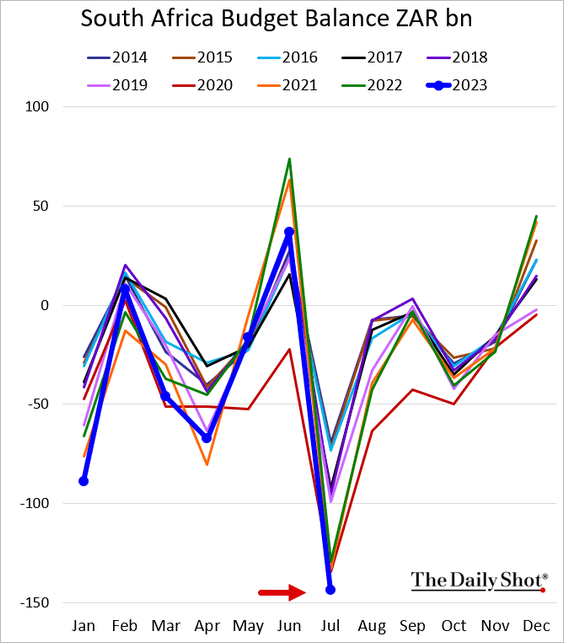
4. This chart shows South Africa’s budget deficit.
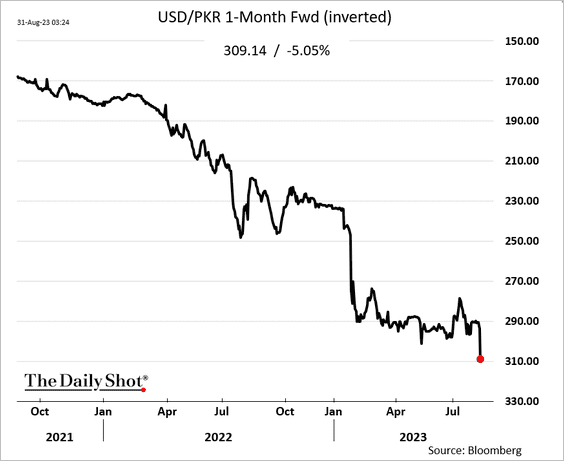
5. The Pakistani rupee remains under pressure.
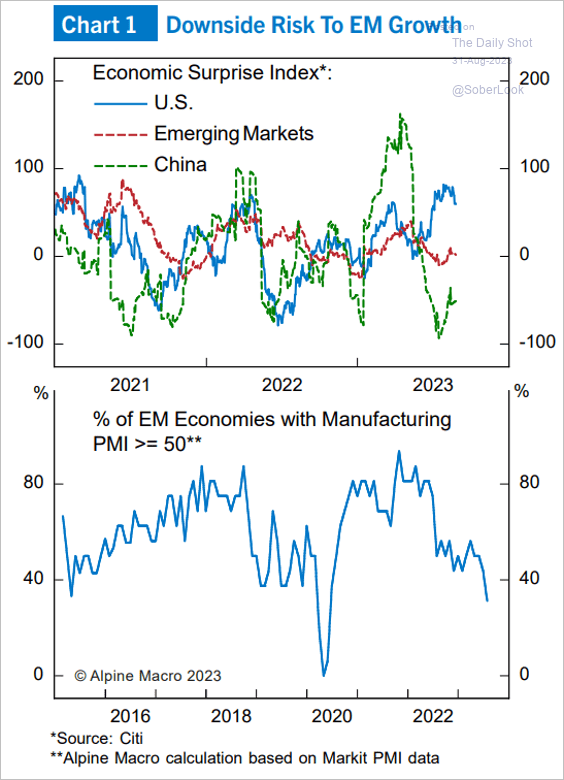
6. Softer demand from China poses growth risks for emerging markets.
 Source: Alpine Macro
Back to Index
Cryptocurrency
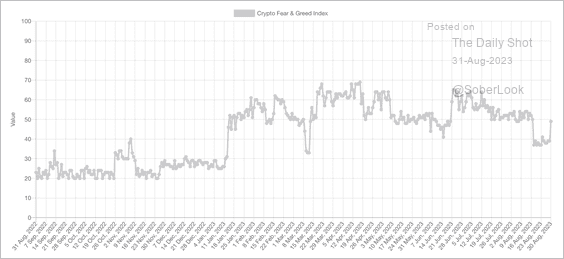
1. The Crypto Fear & Greed Index flipped back into “neutral” territory after reaching “fear” levels last week. News of Grayscale’s court victory versus the SEC boosted investor optimism.
 Source: Alternative.me
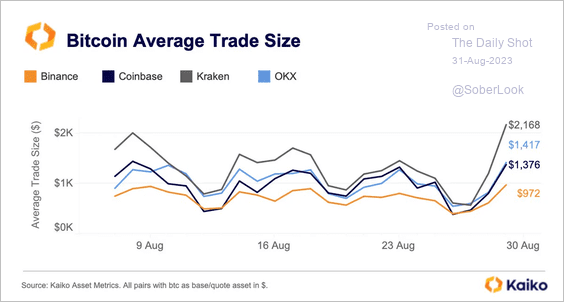
2. Bitcoin’s average trade size surged to its highest level since June.
 Source: @KaikoData
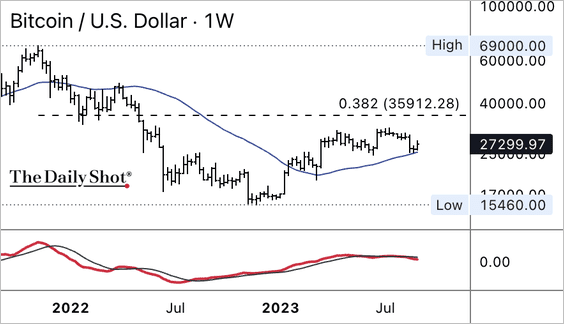
3. Bitcoin held support at its 40-week moving average, although negative momentum suggests upside could be limited.
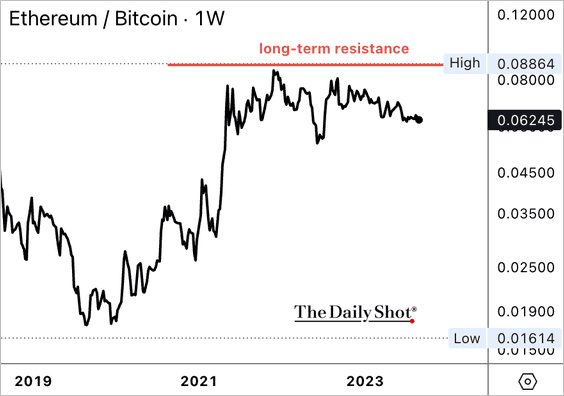
4. The ETH/BTC price ratio continues to fade from long-term resistance.
Back to Index
Commodities
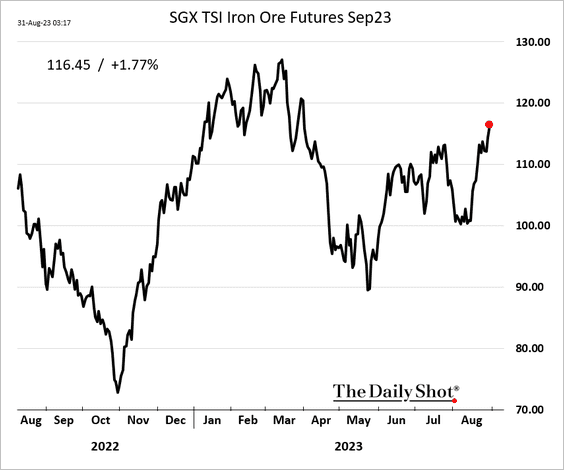
1. Iron ore futures continue to rally, suggesting that China’s economy has pockets of strength.
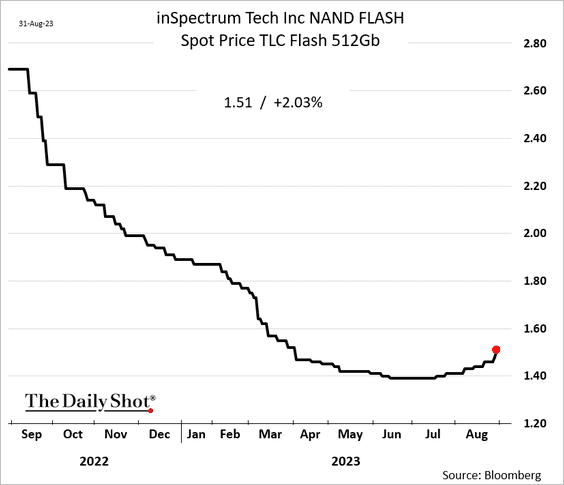
2. NAND memory prices appear to be rebounding.
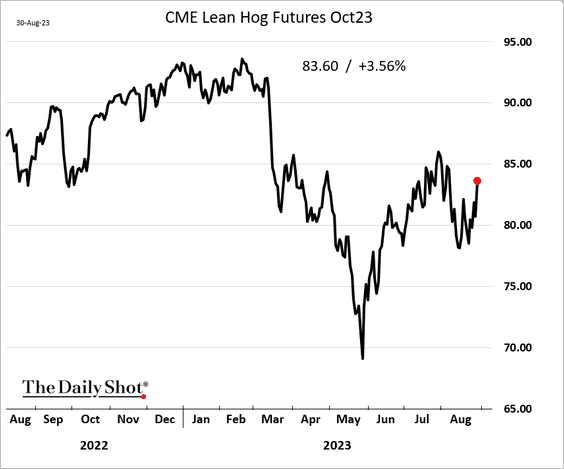
3. Chicago hog futures are up sharply.
 Source: barchart.com Read full article
——————–
4. Orange juice futures hit a record high, …
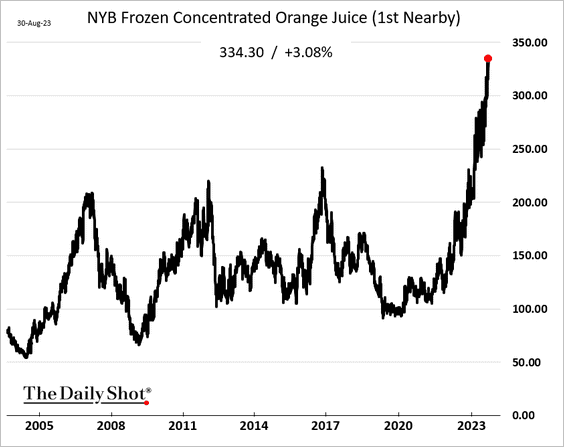
… amid low supplies.
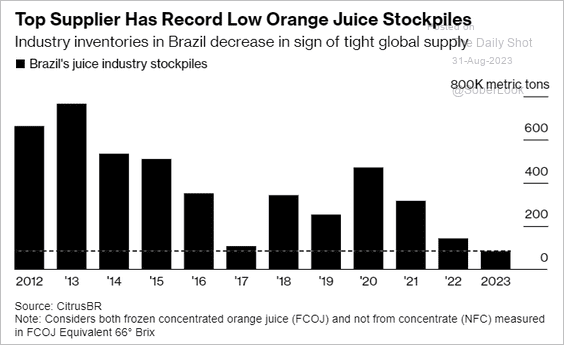 Source: @markets Read full article
——————–
5. Marijuana is an important crop in the US.
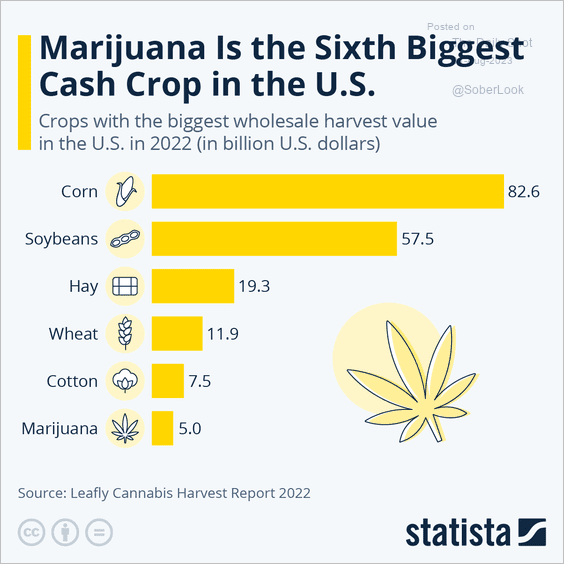 Source: Statista
Back to Index
Energy
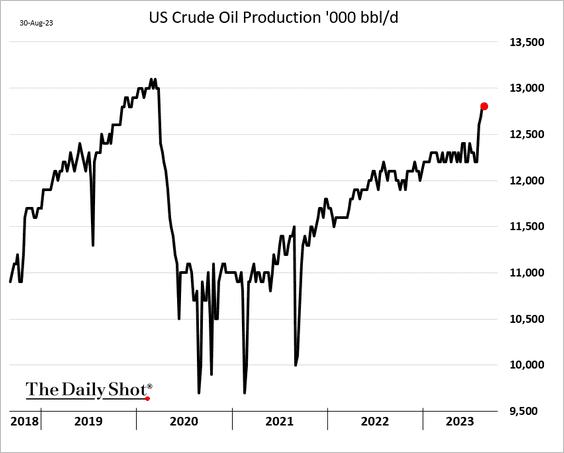
1. US crude oil inventories continue to fall, …
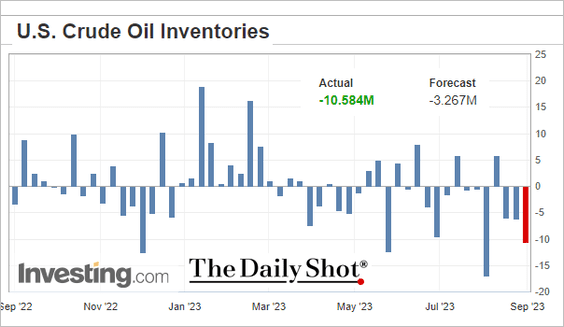
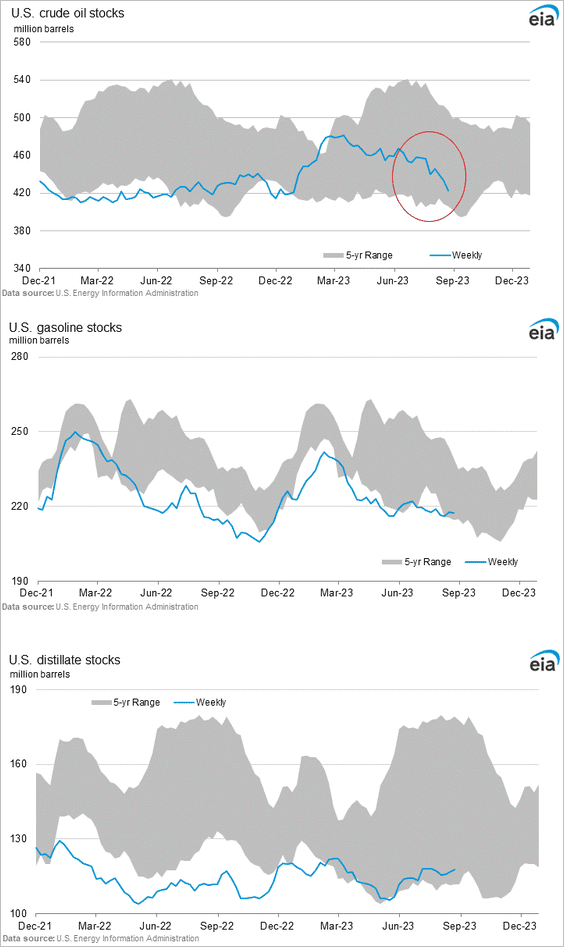
… even as production held at multi-year highs last week.
——————–
2. El Niño conditions will be a headwind for natural gas prices this winter.
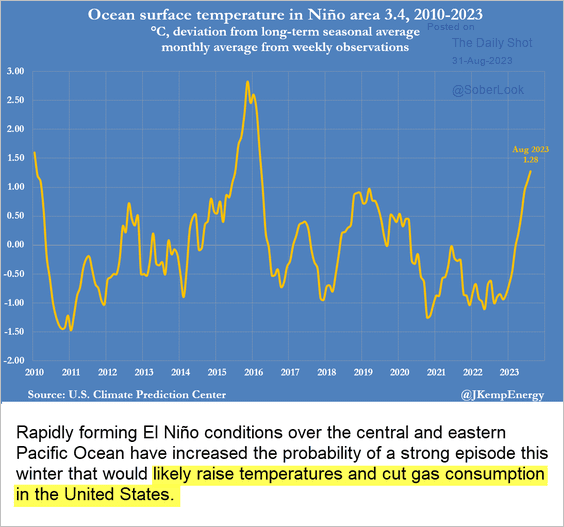 Source: @JKempEnergy Read full article
Back to Index
Equities
1. The S&P 500 valuations continue to diverge from that of the equal-weight index.
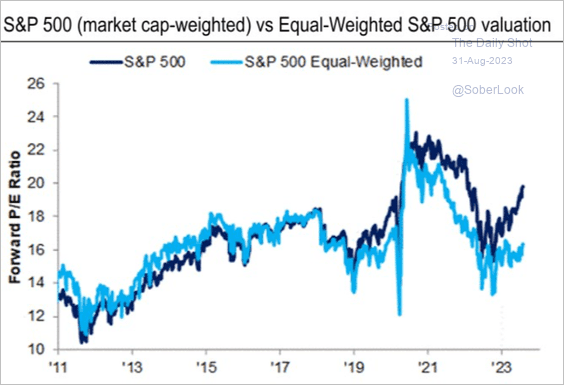 Source: Citi Private Bank
By the way, the S&P 500 equal-weight index outperformed the market-cap-weighted index over the long run.
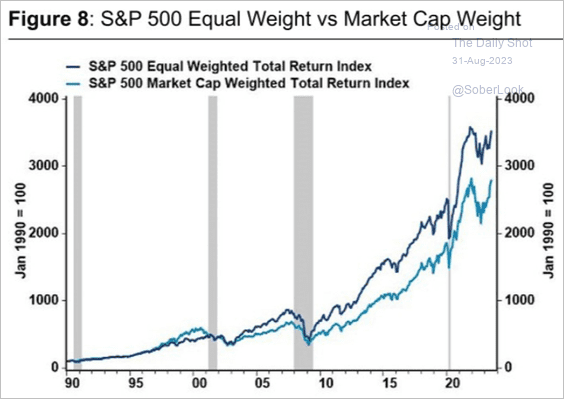 Source: Citi Private Bank
——————–
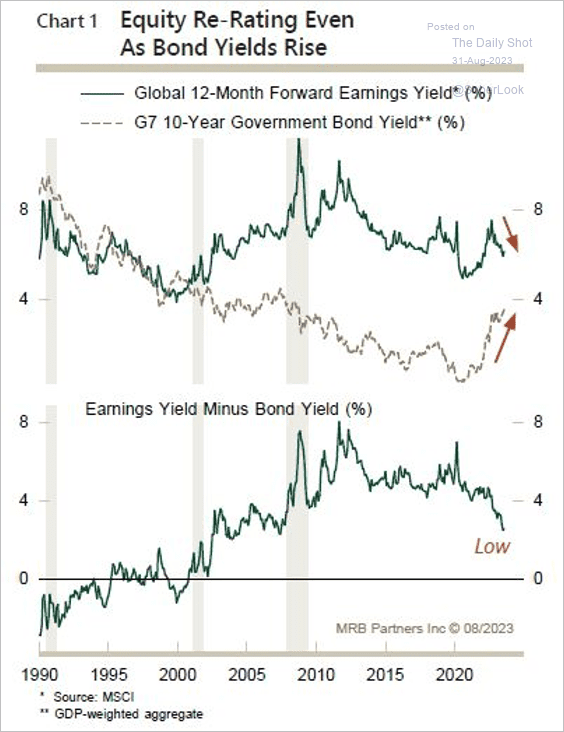
2. Developed market stock/bond ratios continue to climb. However, the declining equity risk premium suggests stocks are increasingly vulnerable to another rise in bond yields. (2 charts)
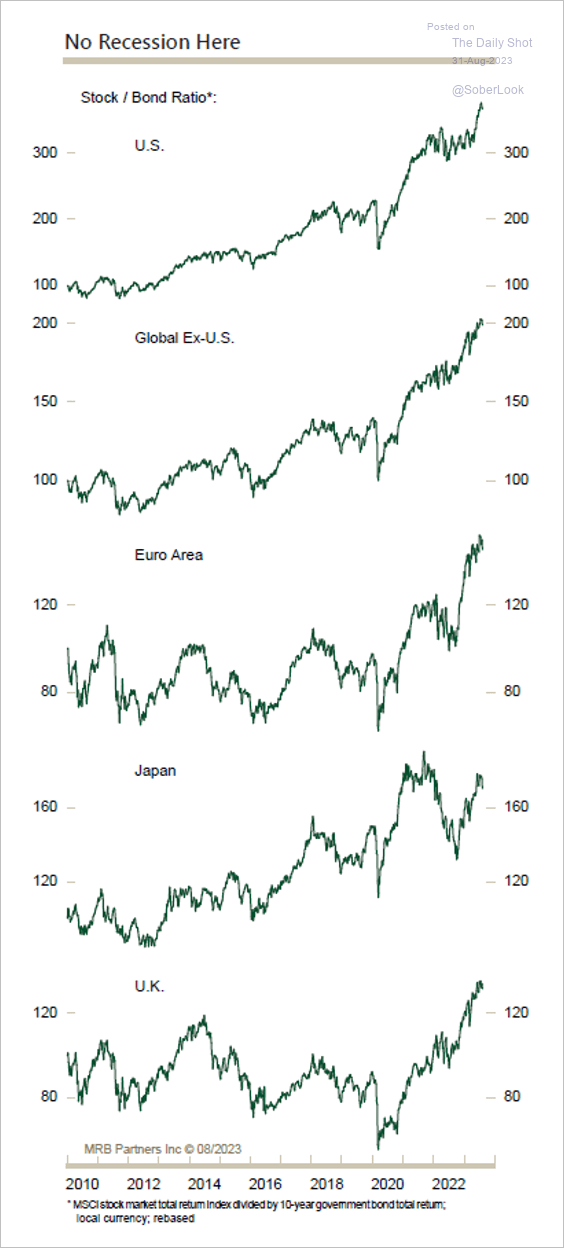 Source: MRB Partners
 Source: MRB Partners
——————–
3. Macro hedge funds’ US equity exposure tends to be correlated to leading economic indicators.
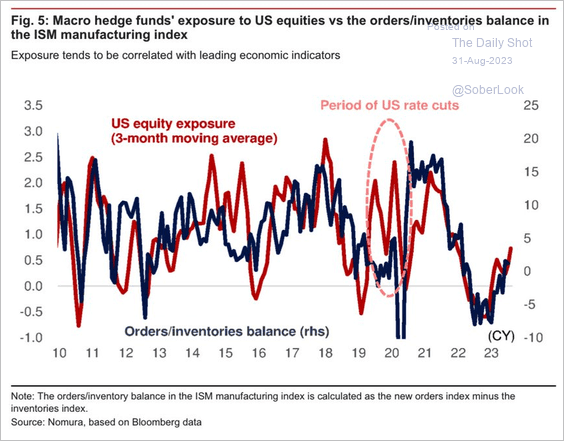 Source: Nomura Securities; @WallStJesus
4. A potential trough in US leading indicators could bode well for stocks.
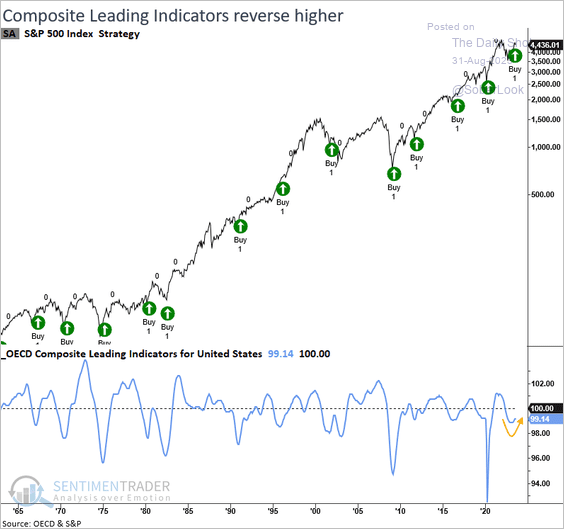 Source: SentimenTrader
5. Historically, US high-dividend yield has underperformed in rising rate environments, while shareholder yield outperformed.
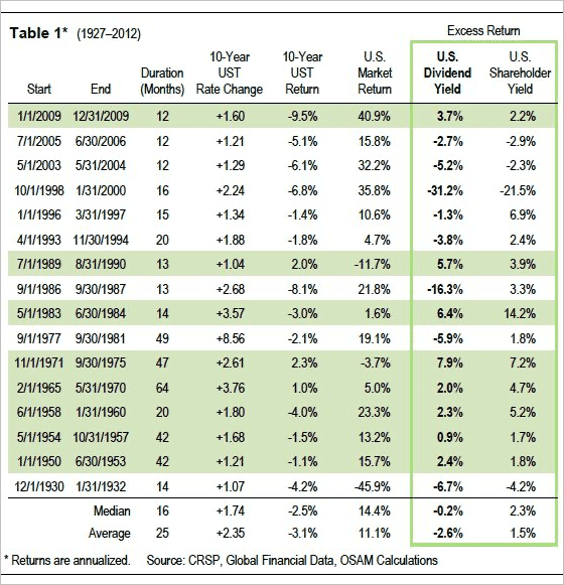 Source: O’Shaughnessy Asset Management; {h/t} @MebFaber
6. US value stocks appear depressed relative to their fair value.
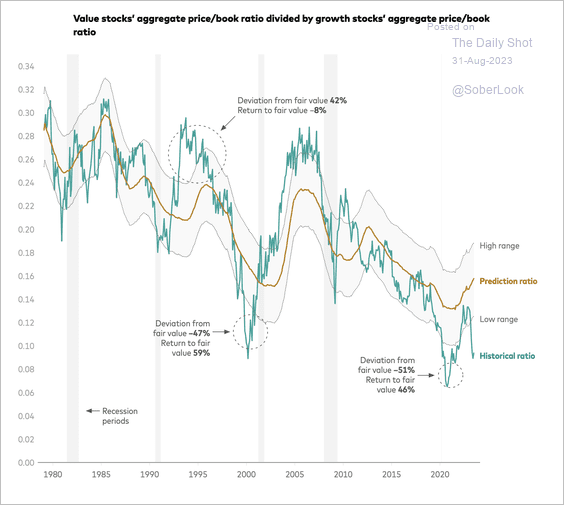 Source: Vanguard Read full article
Historically, value stocks have outperformed during economic recoveries.
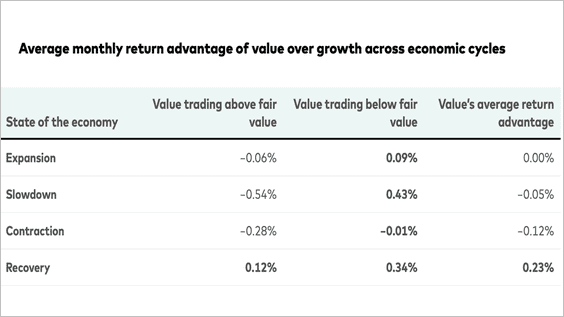 Source: Vanguard Read full article
——————–
7. S&P 500 industrial stocks typically outperform after similar periods of manufacturing weakness.
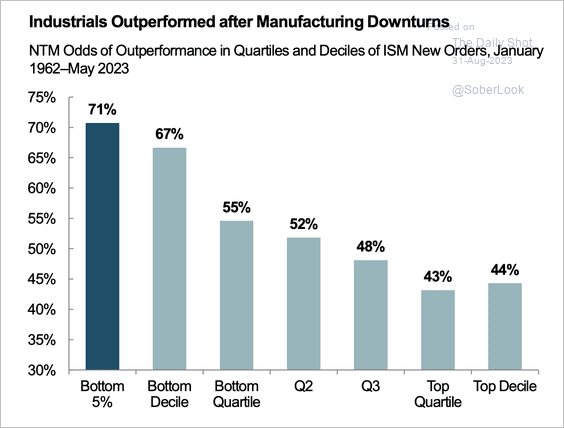 Source: Fidelity Investments Read full article
8. Top-decile monthly S&P 500 tech sector returns typically coincide with strong forward market returns.
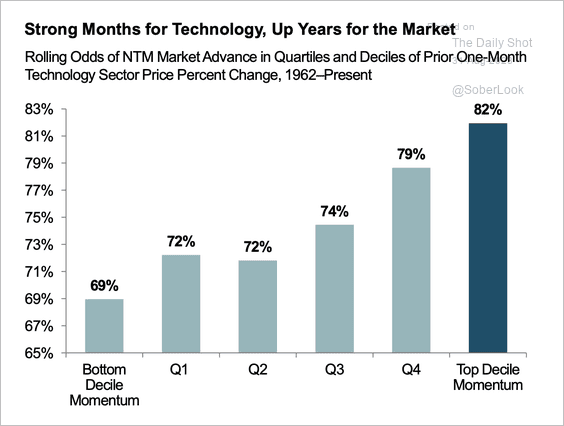 Source: Fidelity Investments Read full article
10. It was a good day for cannabis stocks.
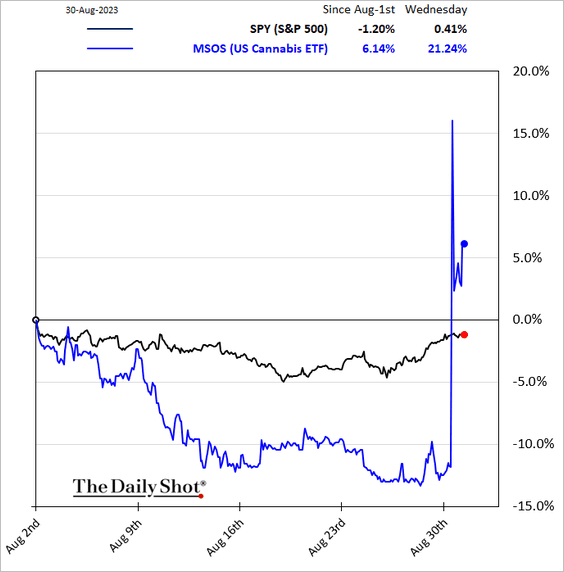
 Source: @axios Read full article
Back to Index
Credit
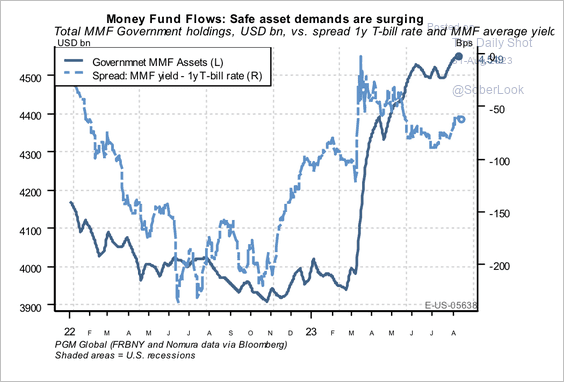
1. There is still robust demand for money market funds. According to PGM Global, healthy Treasury bill spreads to average money market fund (MMF) yields suggest that ongoing issuance of new supply will be funded with MMF inflows plus existing Fed Reverse Repo balances.
 Source: PGM Global
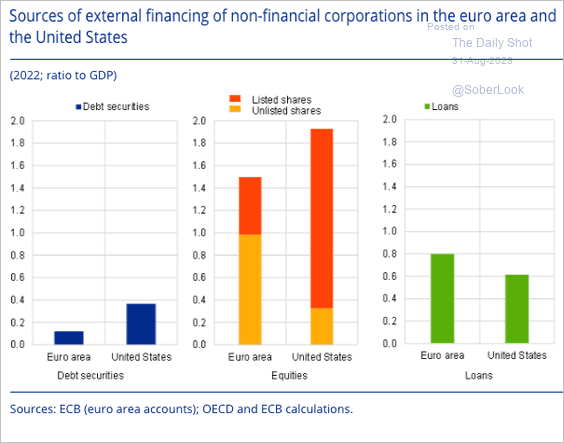
2. What are the sources of funding for US and European companies?
 Source: ECB Read full article
3. Here is a look at distressed commercial real estate over time.
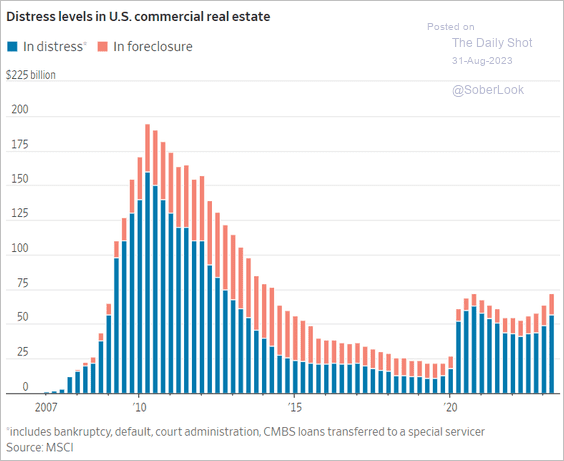 Source: @WSJ Read full article
Back to Index
Rates
1. Private accounts in Europe have been big buyers of US Treasuries.
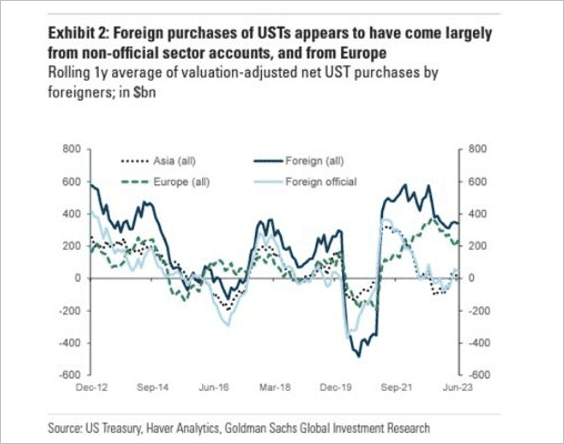 Source: Goldman Sachs
2. There is a lot of interest in the neutral rate.
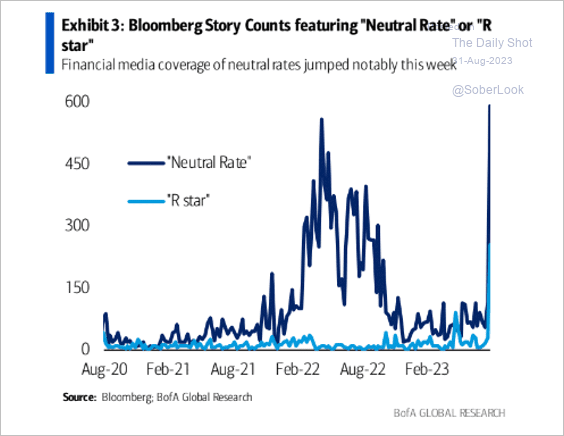 Source: BofA Global Research; @dailychartbook
Back to Index
Global Developments
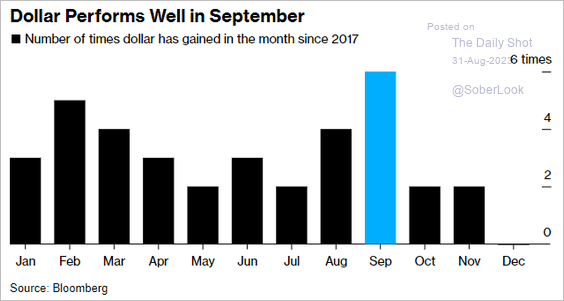
1. The US dollar index (DXY) is testing support at the 200-day moving average.
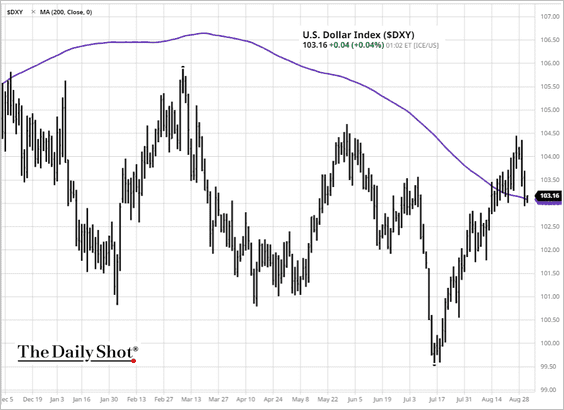
• September tends to be a good month for the US dollar.
 Source: @markets Read full article
——————–
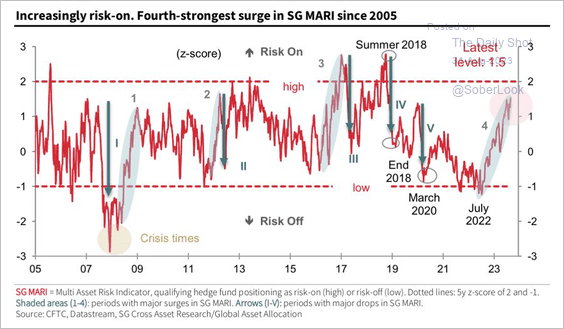
2. It’s risk-on …
 Source: SG Markets Cross Asset Research; @WallStJesus
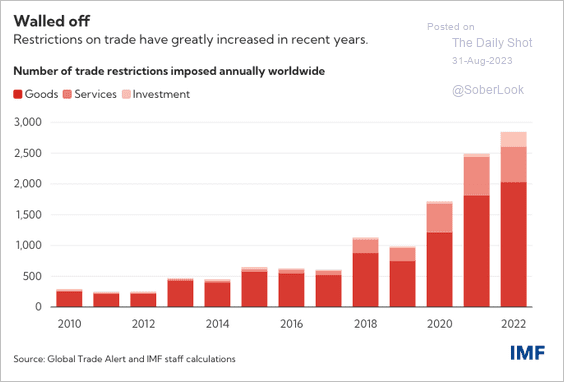
3. Trade restrictions are rising.
 Source: IMF Read full article
——————–
Food for Thought
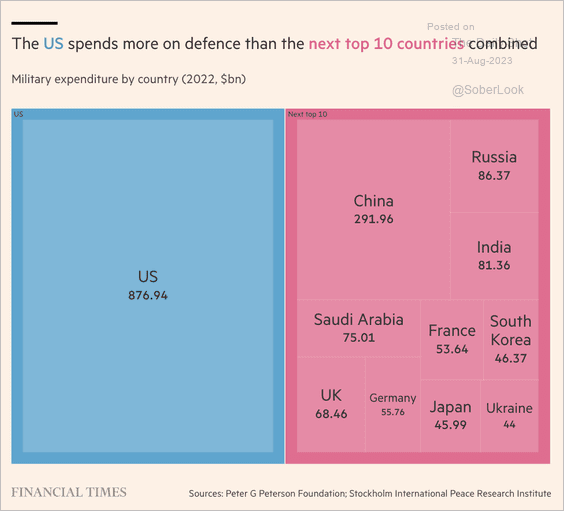
1. US defense spending in perspective:
 Source: @financialtimes Read full article
• Global military spending adjusted for inflation:
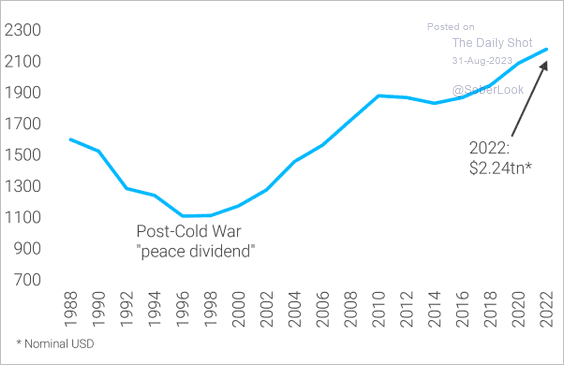 Source: TS Lombard
——————–
2. Cutting back on aspartame:
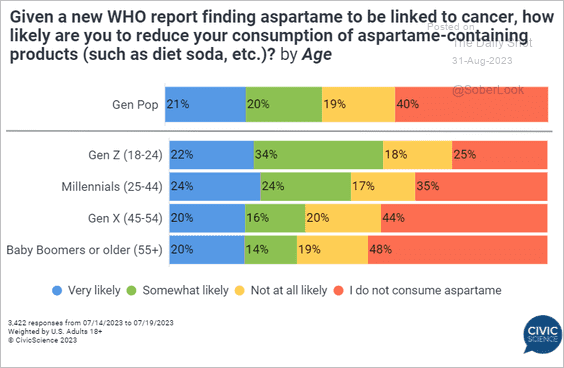 Source: @CivicScience Read full article
3. Self-reported number of close friends:
 Source: Statista
4. Cities tend to be warmer:
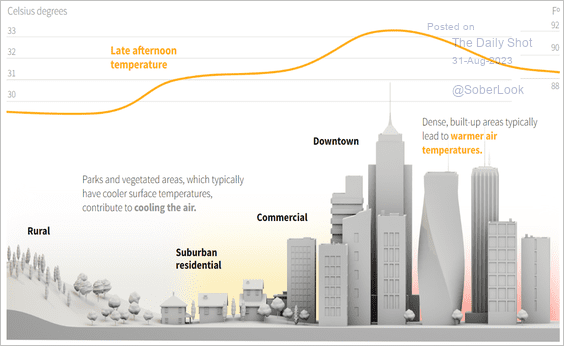 Source: Reuters Read full article
5. Confidence in the US military:
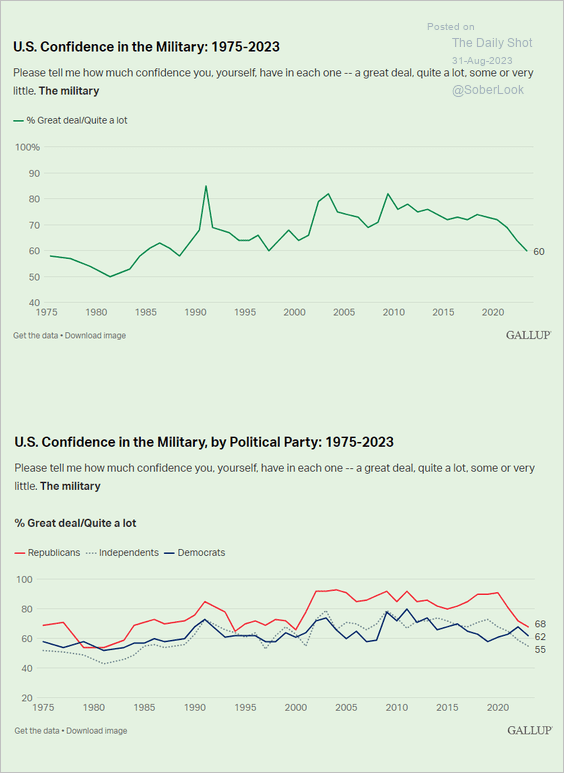 Source: Gallup Read full article
6. Metaverse vs. AI:
 Source: @chartrdaily
7. The fast food app market:
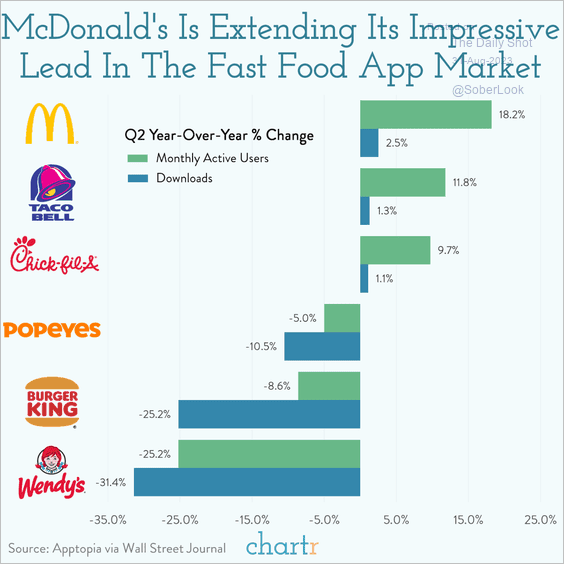 Source: @chartrdaily
8. Weather-forecast accuracy over time:
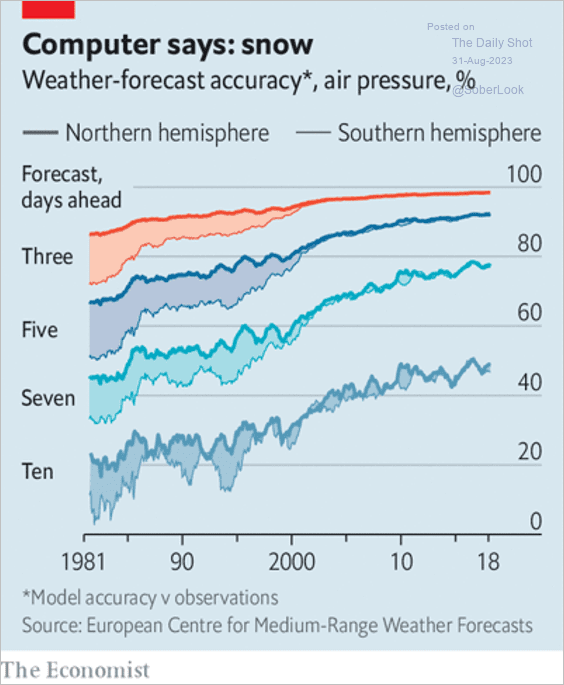 Source: The Economist Read full article
——————–
Back to Index