
The Daily Shot: 01-Sep-23
• The United States
• The Eurozone
• Europe
• Japan
• Asia-Pacific
• China
• Emerging Markets
• Commodities
• Energy
• Equities
• Credit
• Rates
• Global Developments
• Food for Thought
The United States
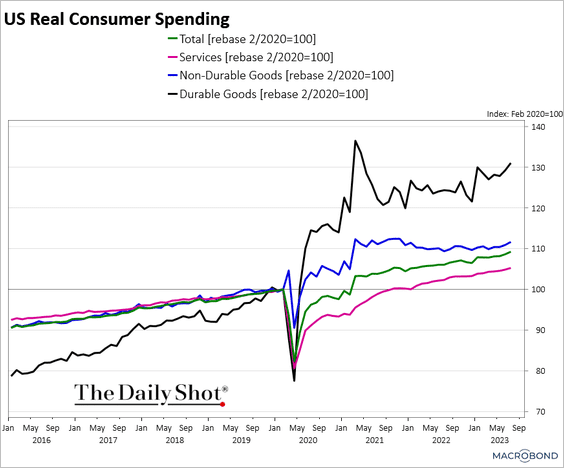
1. Consumer spending jumped in July, topping expectations.
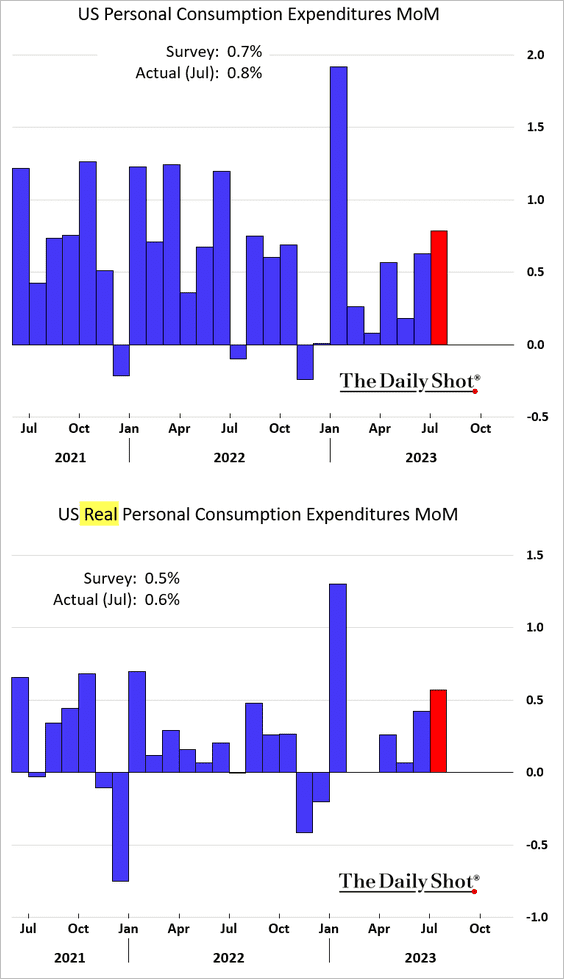
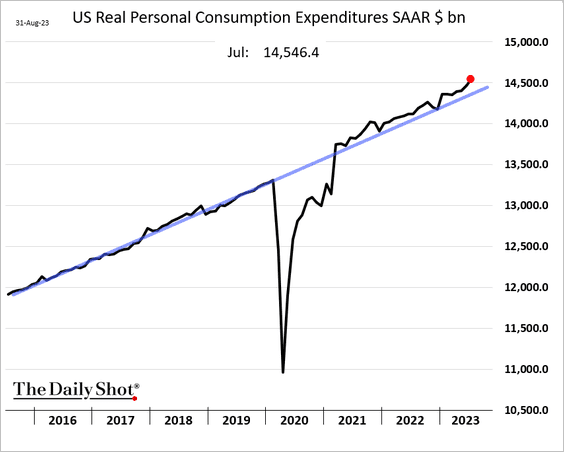
Most sectors registered an increase in consumption (2 charts).
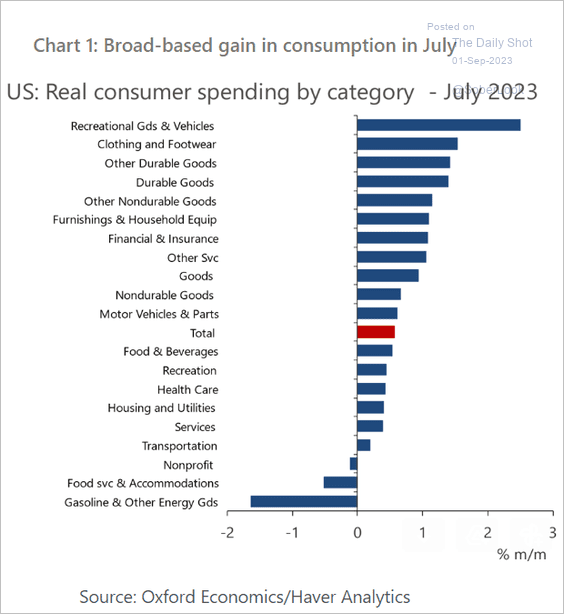 Source: Oxford Economics
 Source: Chart and data provided by Macrobond
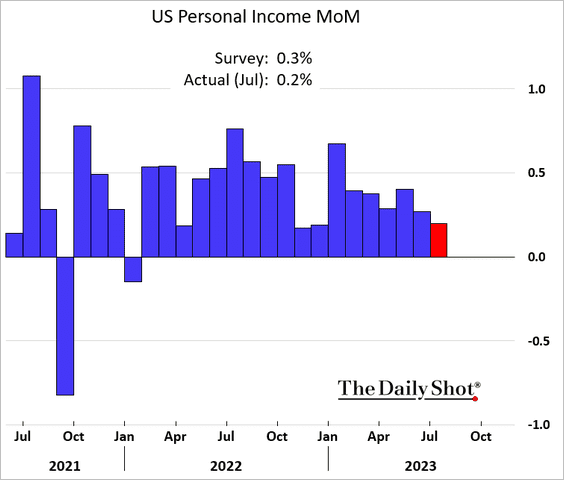
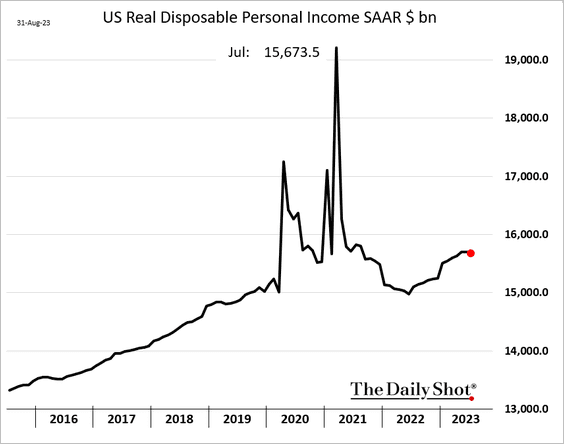
• Income growth slowed, with a lower-than-expected gain in July.
This chart shows real disposable income.
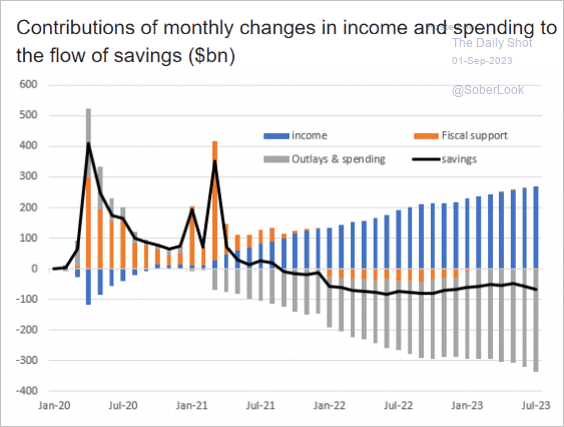
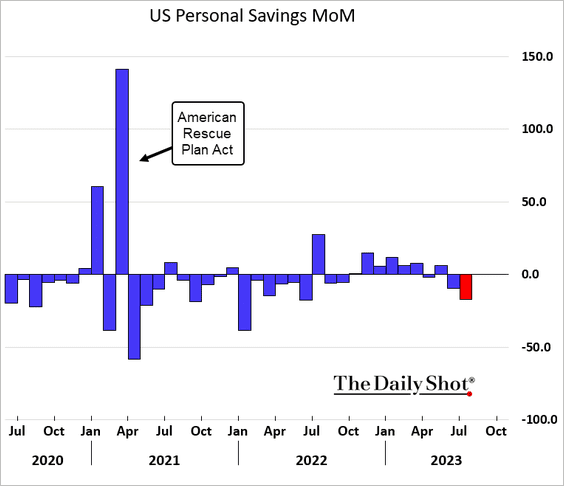
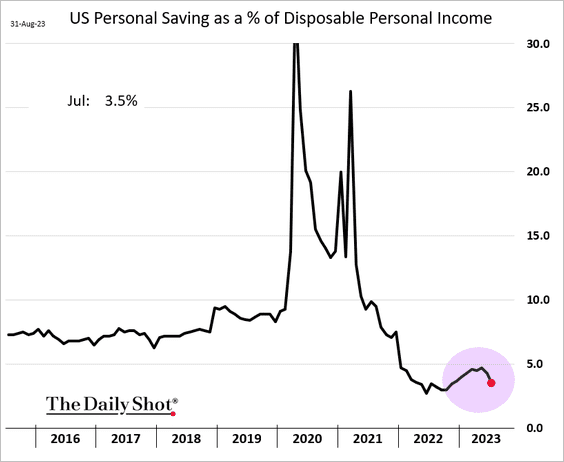
• Increased expenditures, coupled with sluggish income growth, have reduced the savings rate (3 charts).
 Source: ING
• With student debt payments kicking in shortly, …
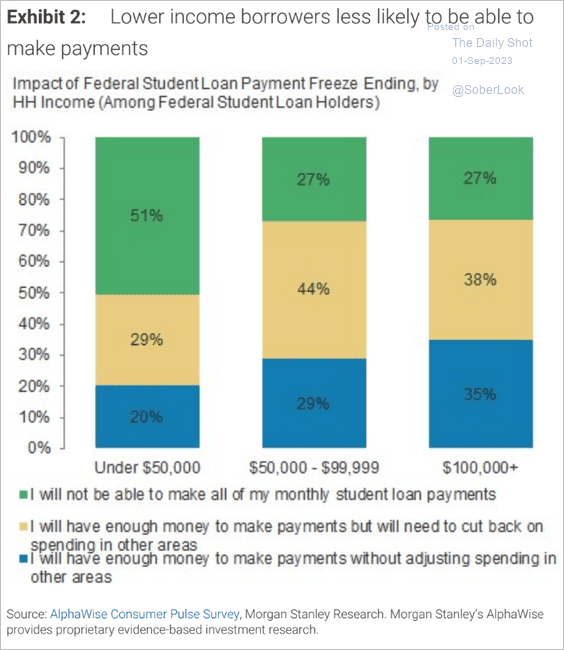 Source: Morgan Stanley Research
… we are likely to see a sharp pullback in spending in the fourth quarter.
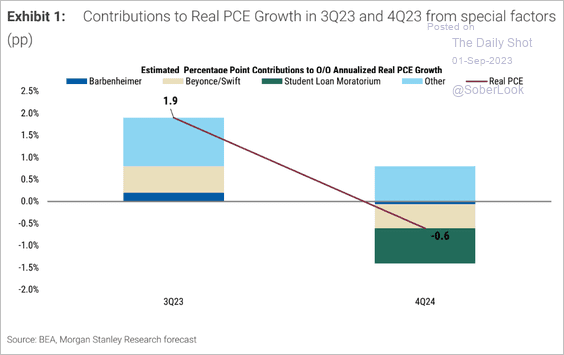 Source: Morgan Stanley Research
——————–
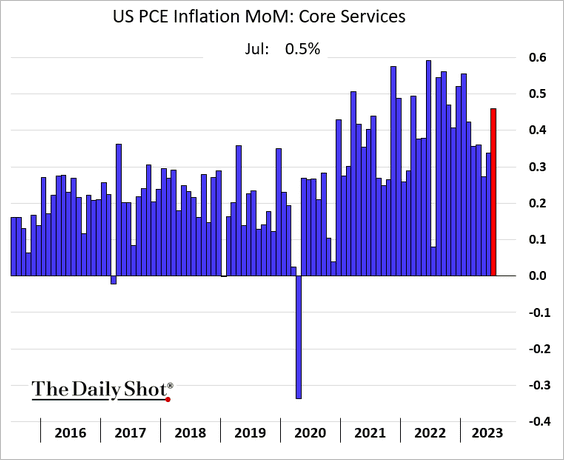
2. The core PCE inflation increased by 0.2% in July, the same as in June.
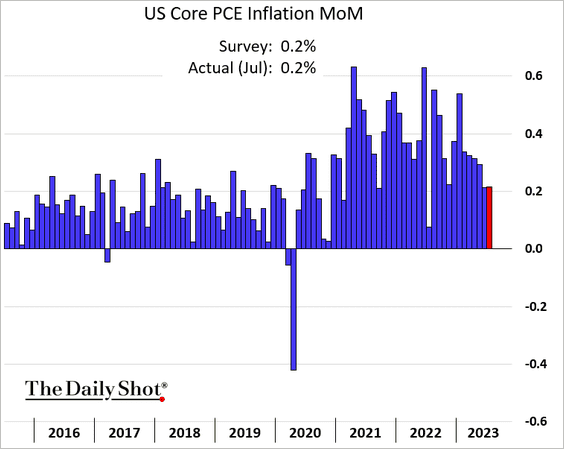
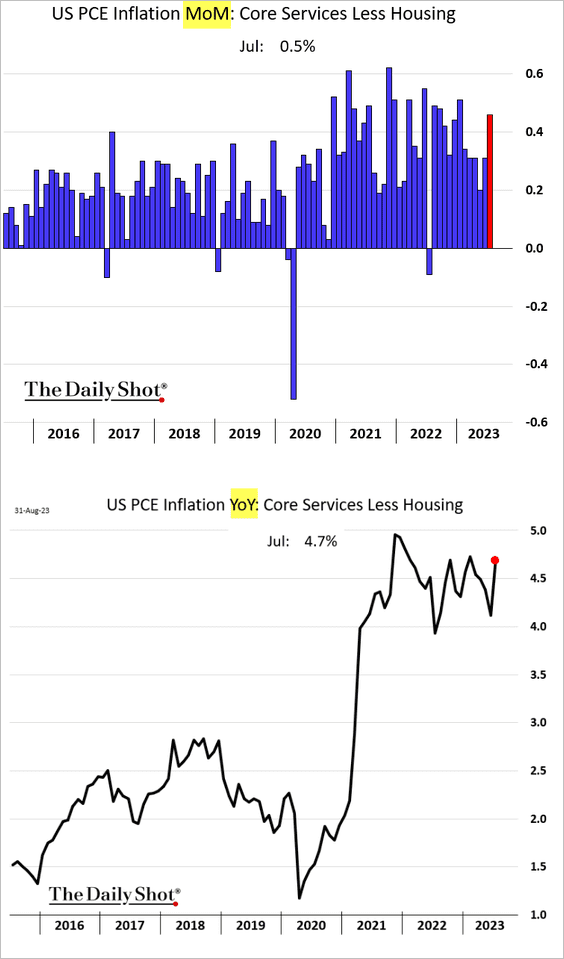
But core services inflation accelerated.
Here is the supercore PCE inflation, a measure closely tracked by the Fed.
——————–
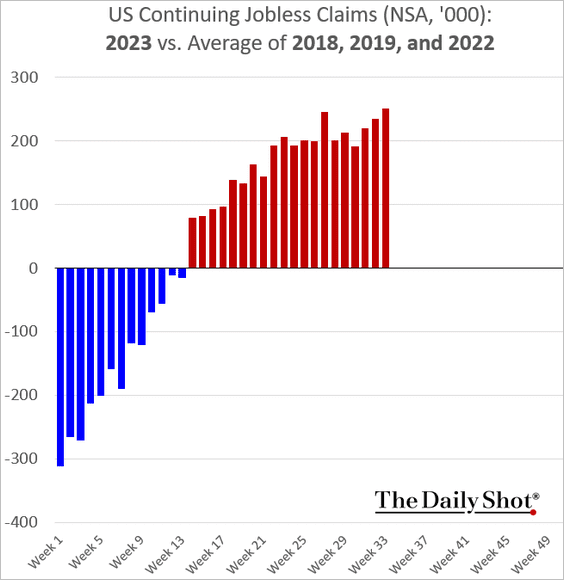
3. Initial jobless claims eased last week.
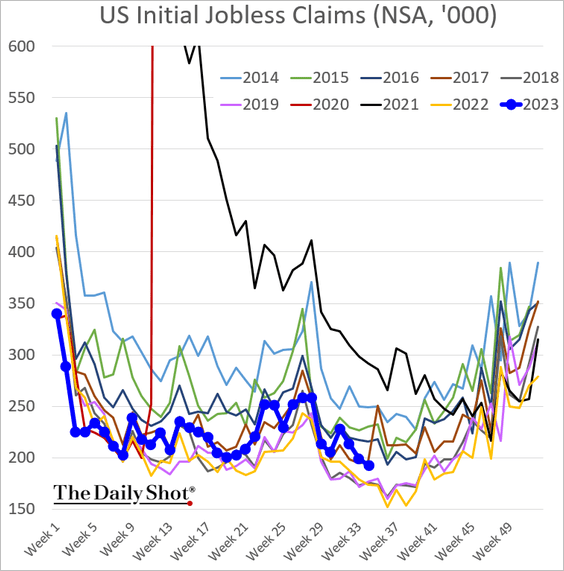
However, continuing claims keep diverging from their historical pattern.
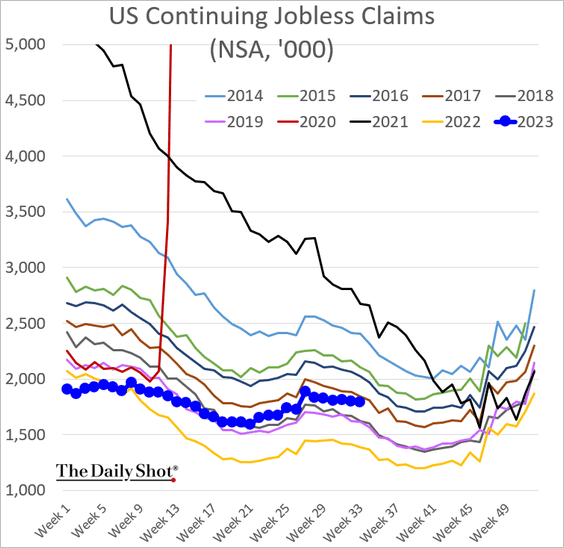
This deviation clearly shows a softening in the labor market.
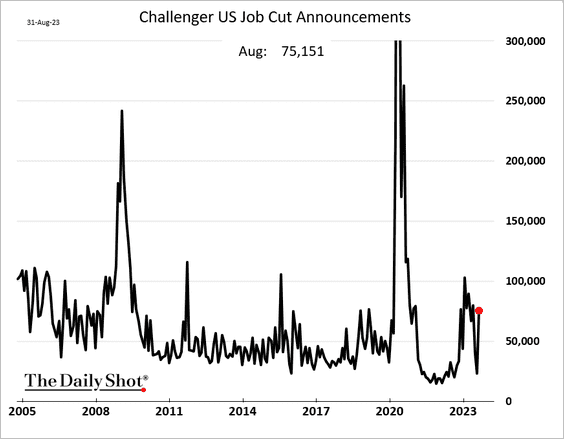
• Job cut announcements increased in August.
——————–
4. The Chicago PMI surprised to the upside, …
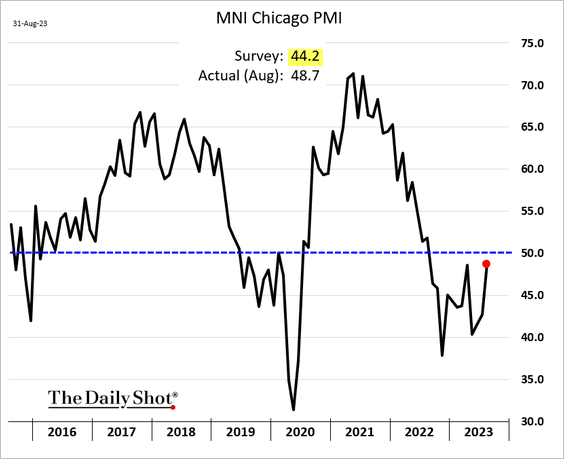
… boosted by Boeing’s orders.
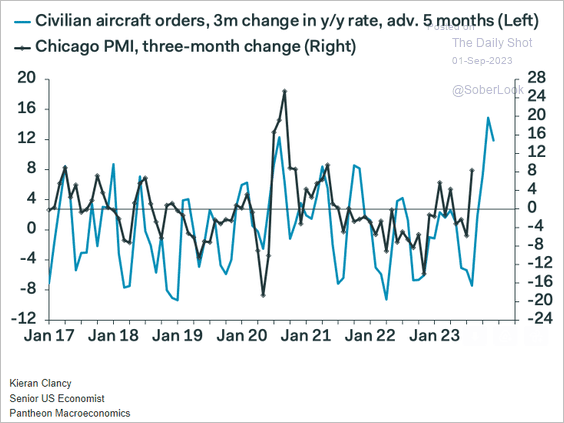 Source: Pantheon Macroeconomics
• Leading indicators point to some strengthening in US factory activity in August.
– The stock market:
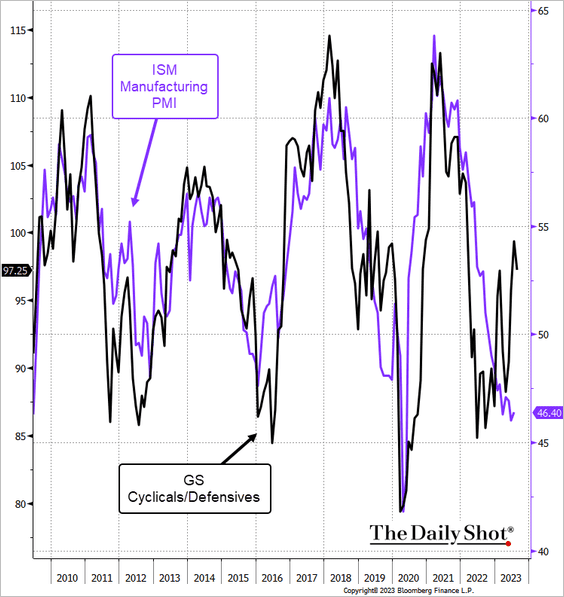 Source: @TheTerminal, Bloomberg Finance L.P.
– The Philly Fed’s manufacturing index:
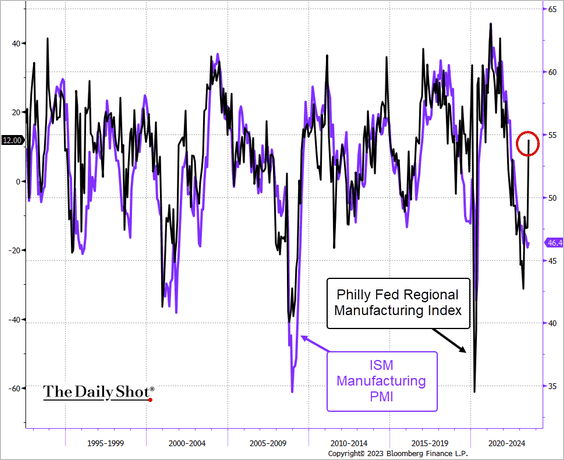 Source: @TheTerminal, Bloomberg Finance L.P.
Back to Index
The Eurozone
1. French inflation accelerated in August, boosted by higher energy prices.
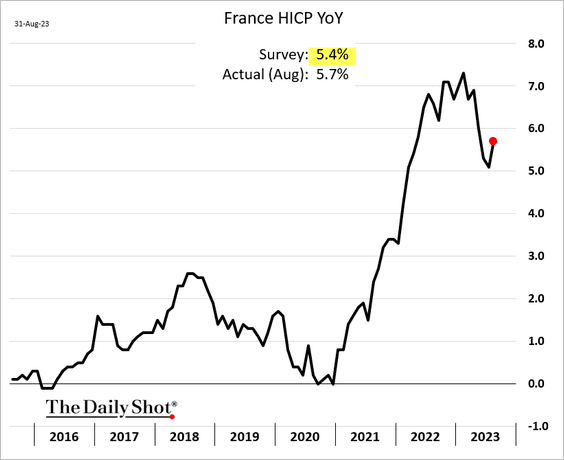
 Source: @economics Read full article
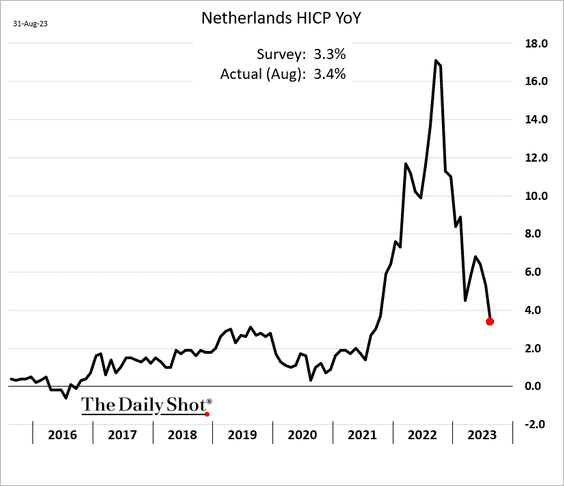
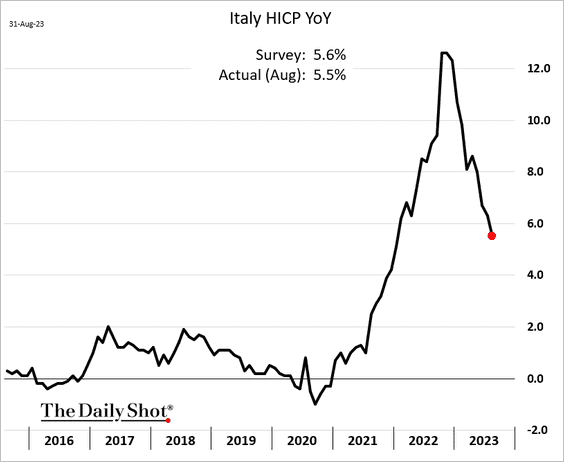
• Dutch and Italian inflation continued to ease.
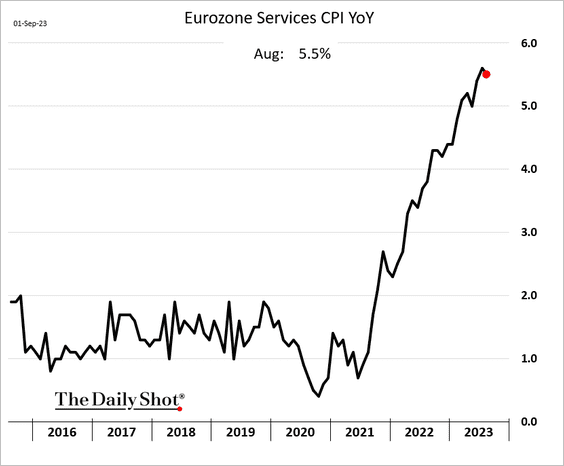
• At the Eurozone level, the CPI topped expectations, …
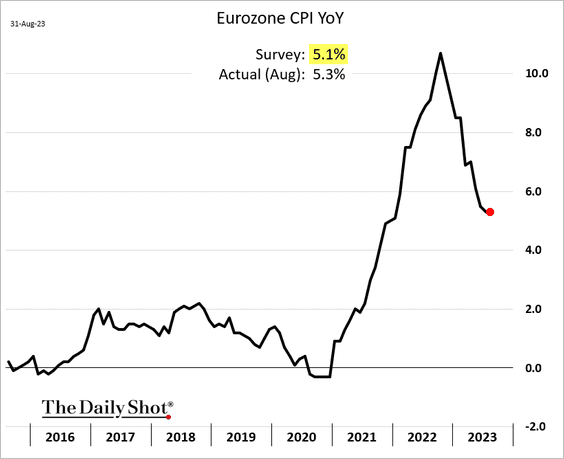
… as services inflation remains elevated.
 Source: @economics Read full article
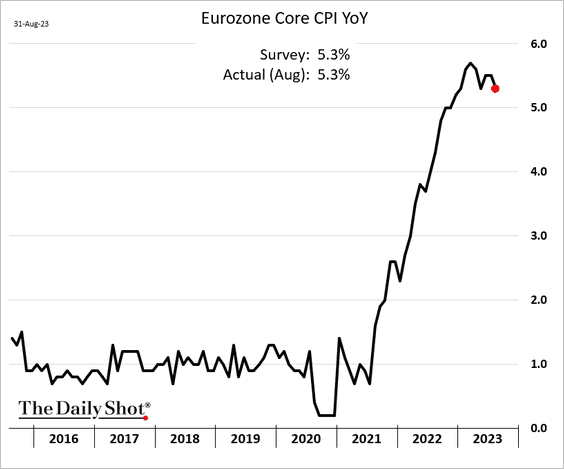
Here is the core CPI.
Survey data point to easing services inflation.
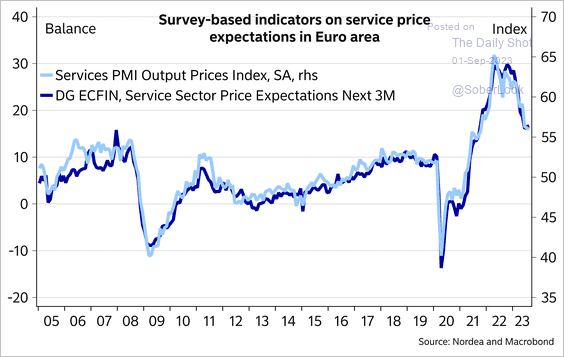 Source: Nordea Markets
——————–
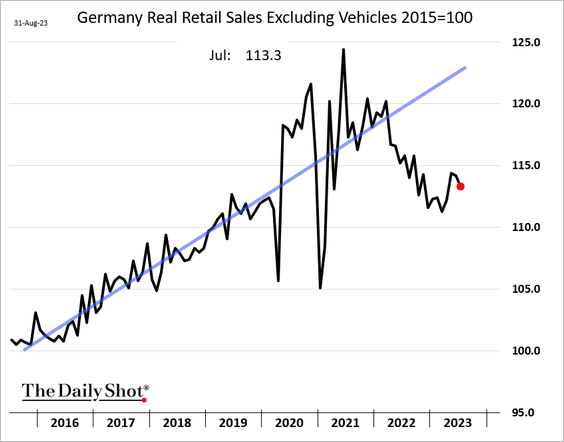
2. Germany’s retail sales declined in July.
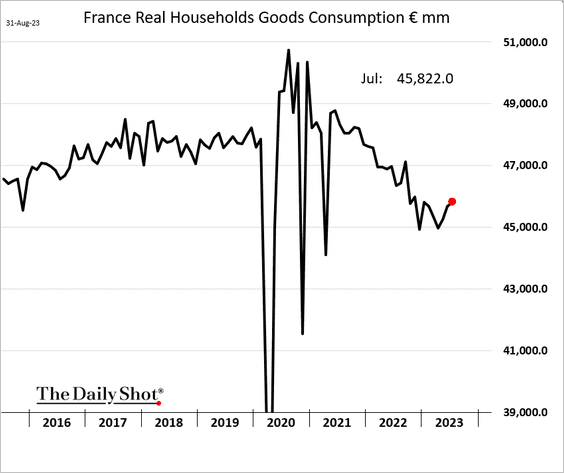
But French household spending on goods continued to increase.
——————–
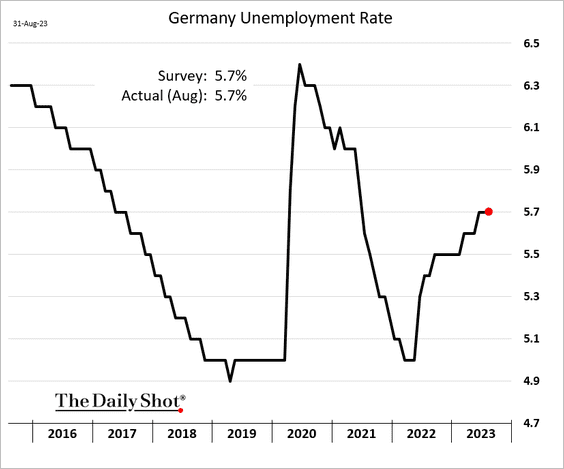
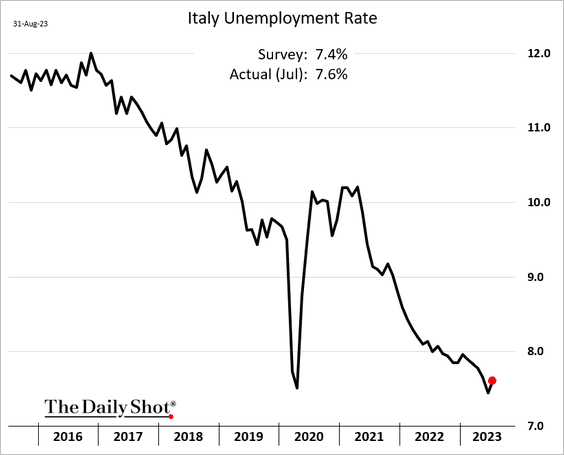
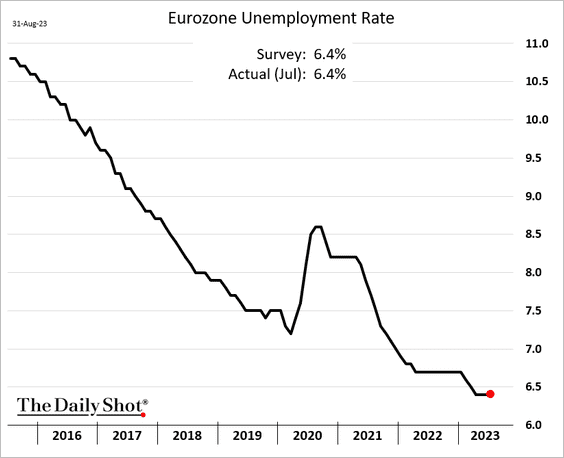
3. Let’s take a look at some labor market trends.
• Germany’s unemployment rate (steady):
• Italian unemployment rate (unexpected increase in July):
• Eurozone unemployment rate (steady):
• Labor constraints continue to limit production for many firms.
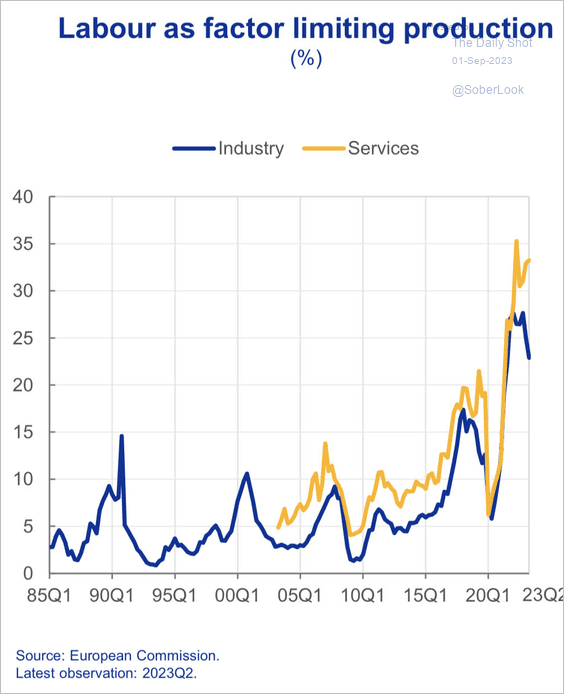 Source: ECB
——————–
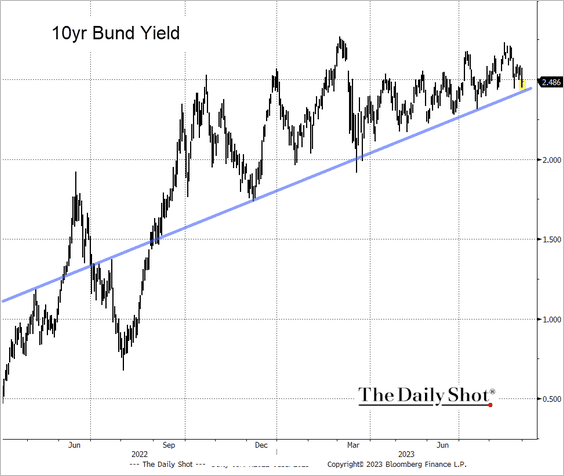
4. Will the 10-year Bund yield hold the uptrend support?
 Source: @TheTerminal, Bloomberg Finance L.P.
Back to Index
Europe
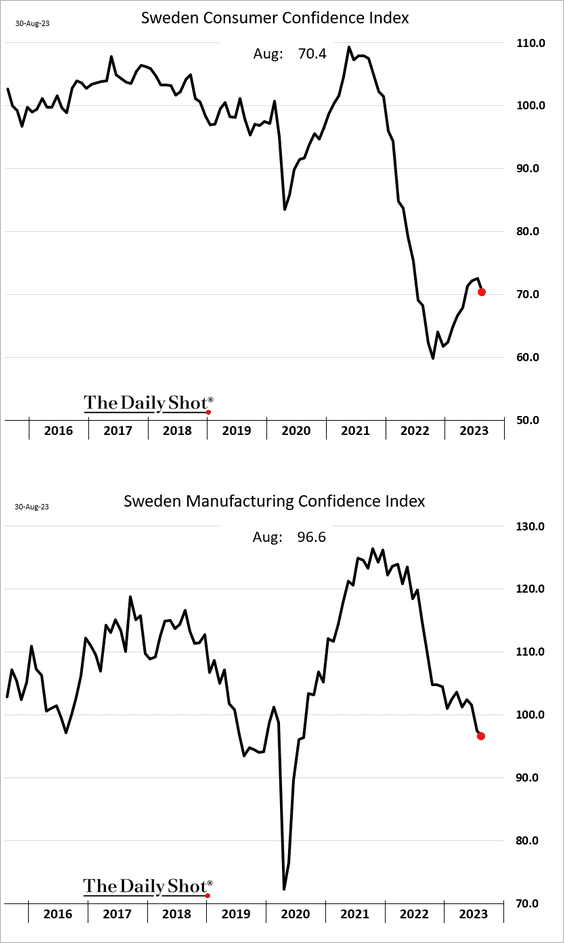
1. Sweden’s sentiment indicators softened in August.
The GDP has been running below Riksbank’s forecasts.
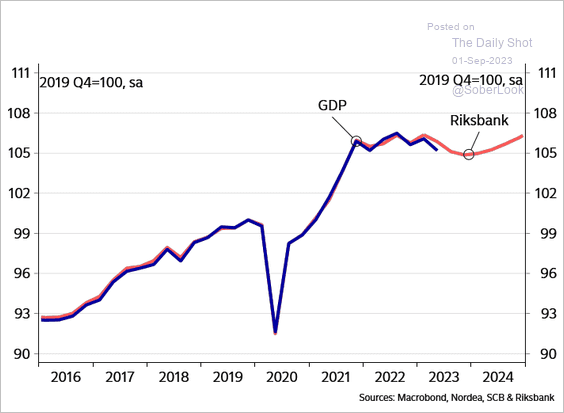 Source: Nordea Markets
——————–
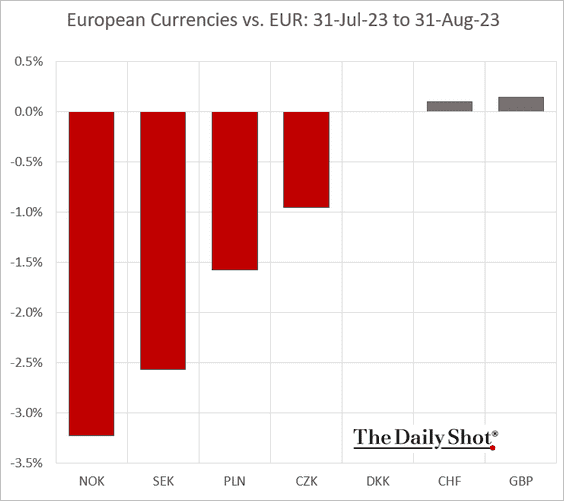
2. This chart shows how some European currencies performed against the euro in August.
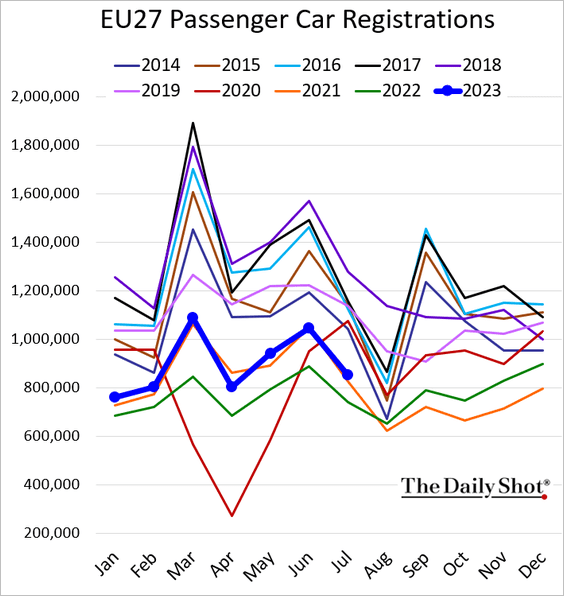
3. EU car registrations are following the 2021 trend.
4. A shortfall in European natural gas supply remains a risk.
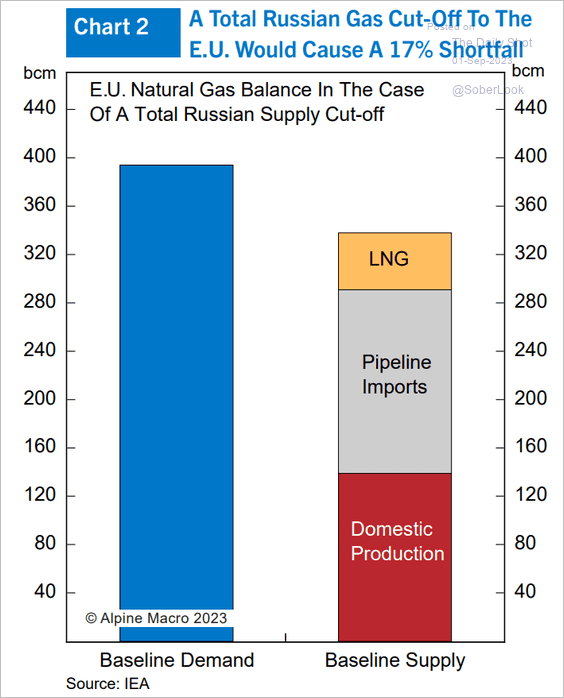 Source: Alpine Macro
Back to Index
Japan
1. Business investment slowed in Q2.
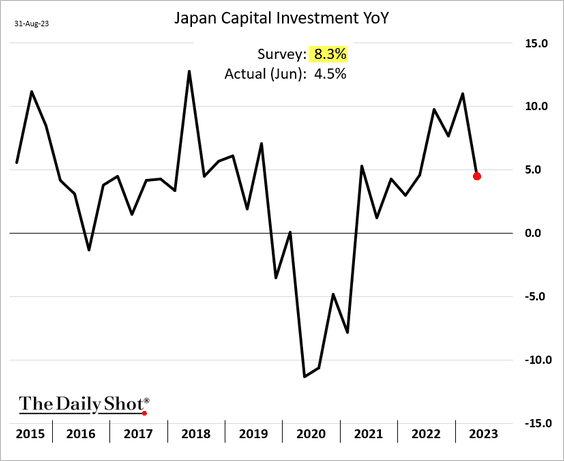
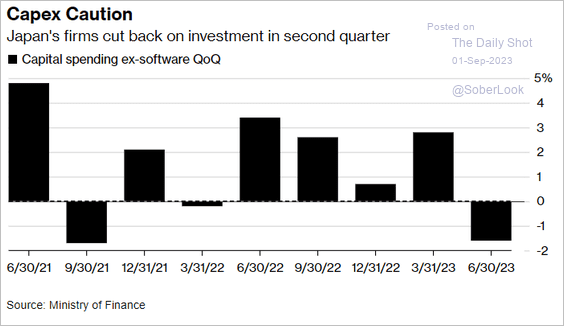 Source: @economics Read full article
——————–
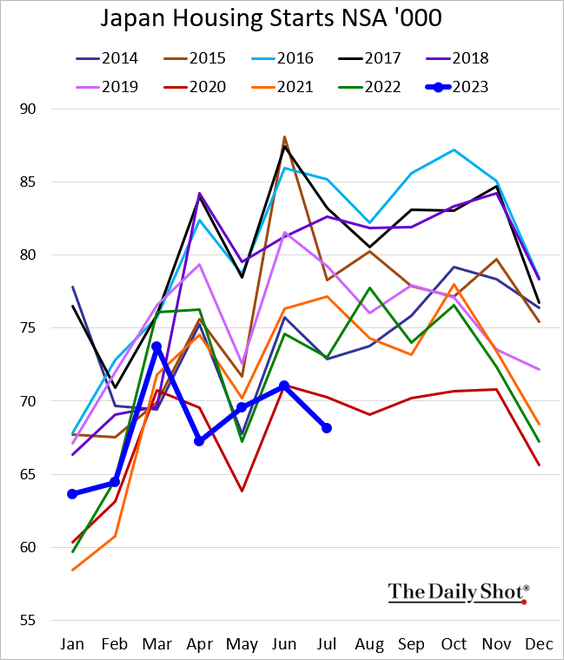
2. Housing starts hit a multi-year low in July.
3. Japanese stocks continue to outperform Asian peers.
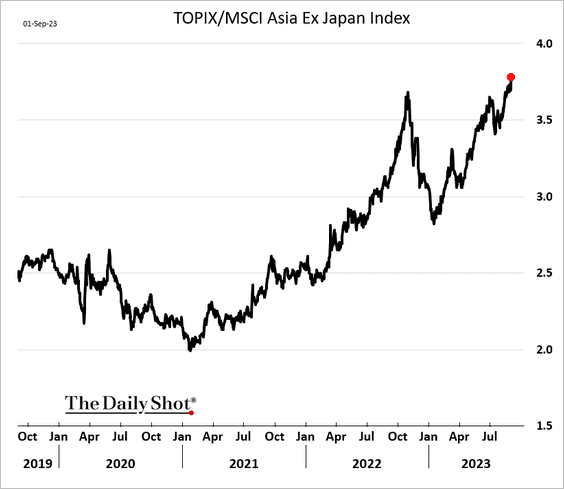 h/t Sungwoo Park, Bloomberg
Back to Index
Asia-Pacific
1. South Korea’s manufacturing activity remains sluggish.
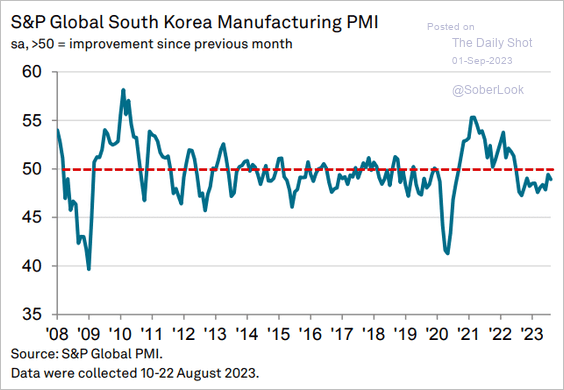 Source: S&P Global PMI
Taiwan’s manufacturing contraction continues.
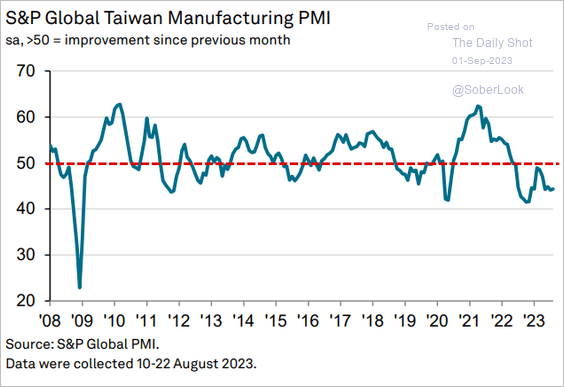 Source: S&P Global PMI
——————–
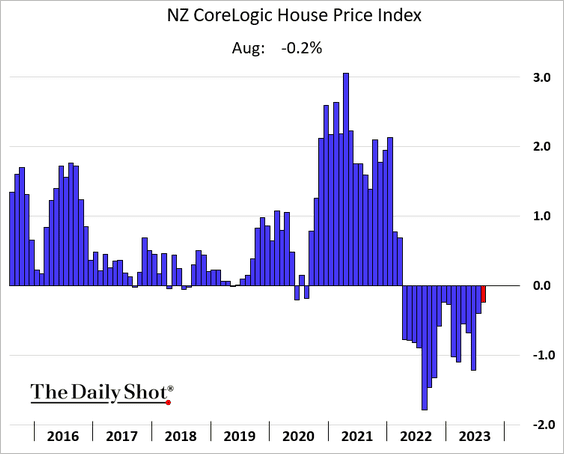
2. New Zealand’s home prices continue to fall.
3. Australia’s housing prices were up again in August.
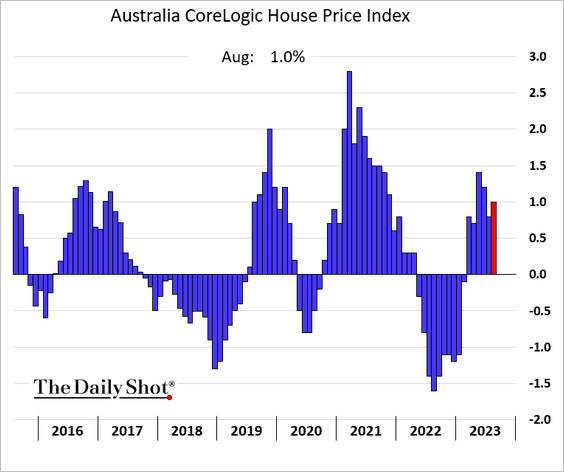
 Source: ABC News Read full article
Back to Index
China
1. The manufacturing PMI from S&P Global showed factory activity expanding in August, topping forecasts.
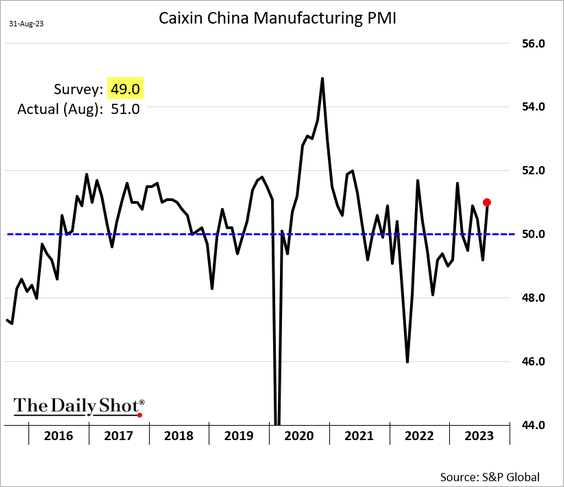
 Source: MarketWatch Read full article
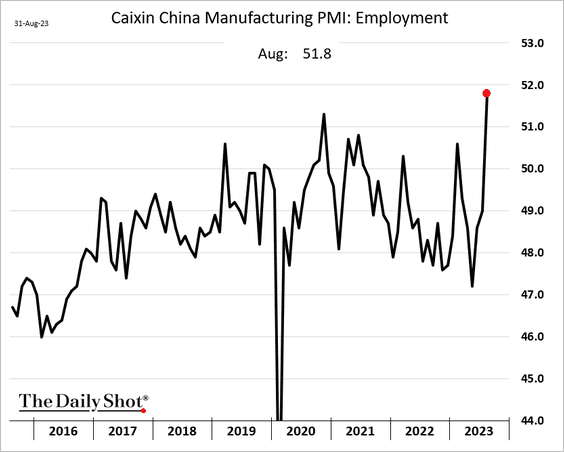
Hiring in the manufacturing sector accelerated.
——————–
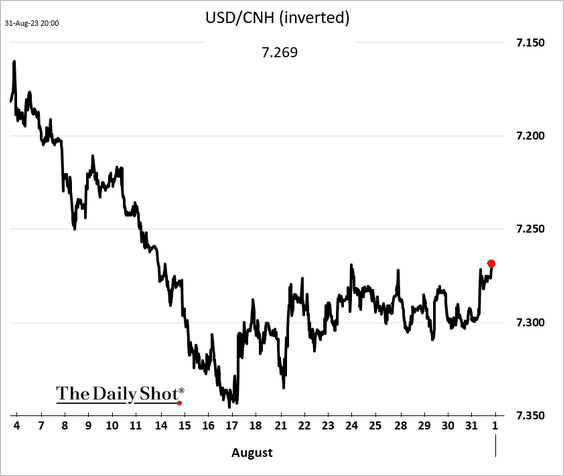
2. Beijing cut the forex reserve ratio, …
 Source: @markets Read full article
… boosting the renminbi.
Back to Index
Emerging Markets
1. Let’s run through Asian manufacturing PMI trends.
• Indonesia (faster growth):
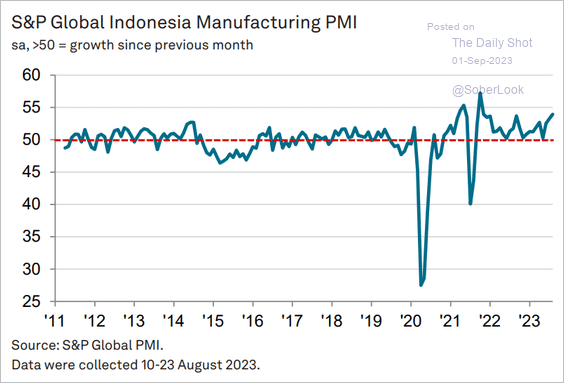 Source: S&P Global PMI
• Malaysia (sluggish):
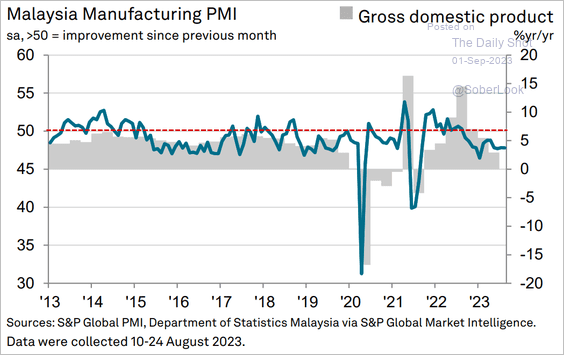 Source: S&P Global PMI
• Thailand (sudden contraction):
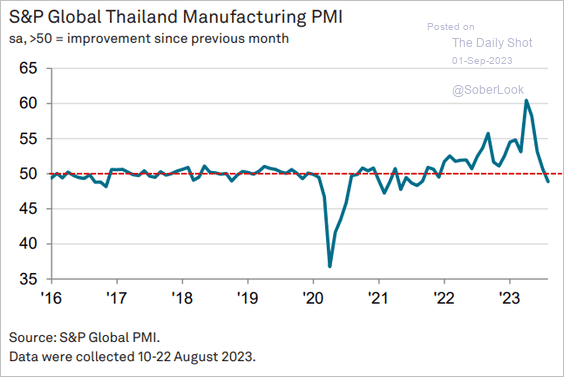 Source: S&P Global PMI
• The Philippines (also contracting):
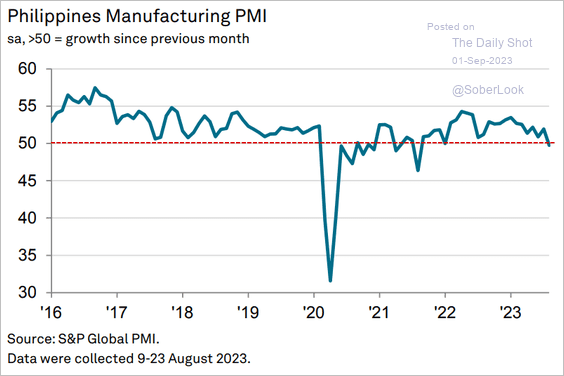 Source: S&P Global PMI
——————–
2. India’s GDP growth picked up in Q2.
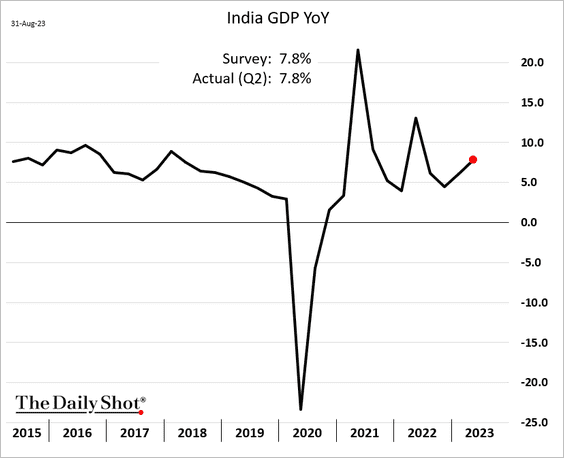
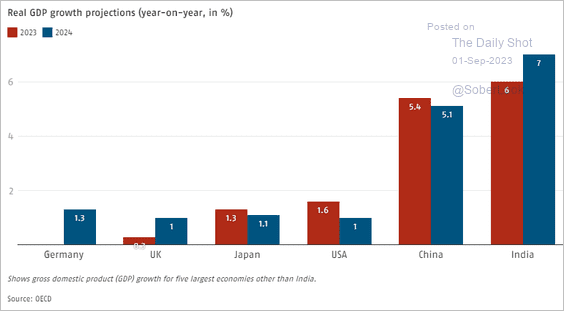 Source: Business Standard Read full article
Core industries’ output remains robust.
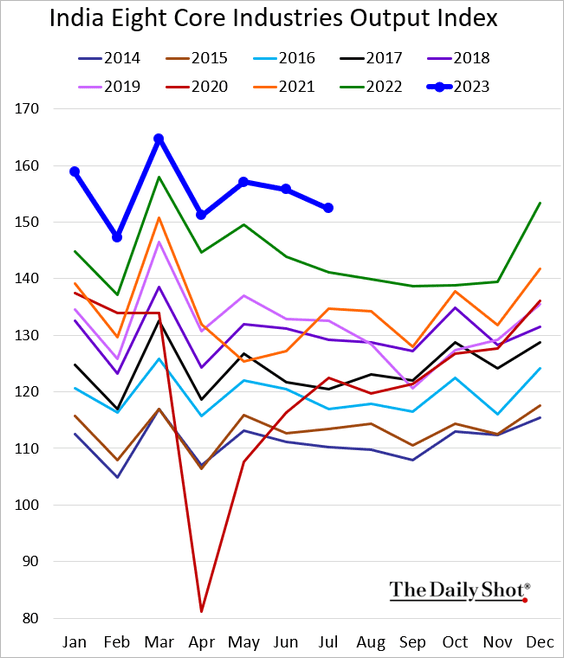
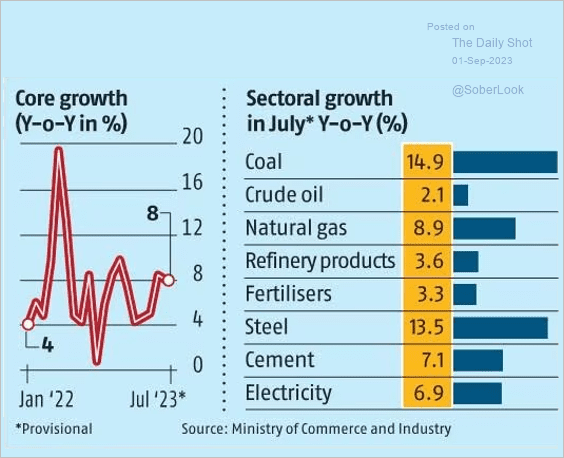 Source: Business Standard Read full article
——————–
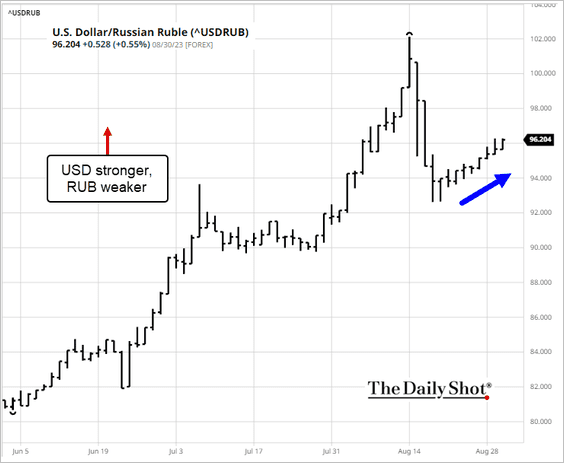
3. The ruble remains under pressure.
4. The Mexican peso’s rally is over.
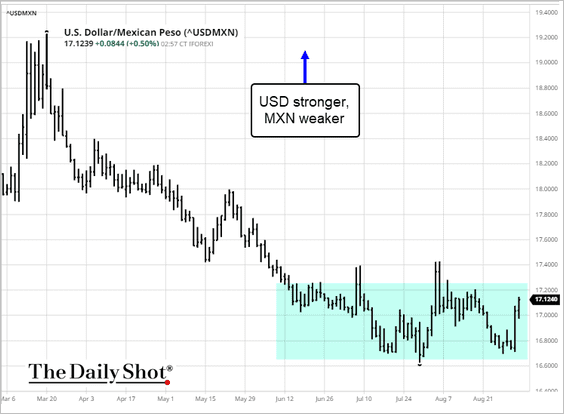 Source: barchart.com
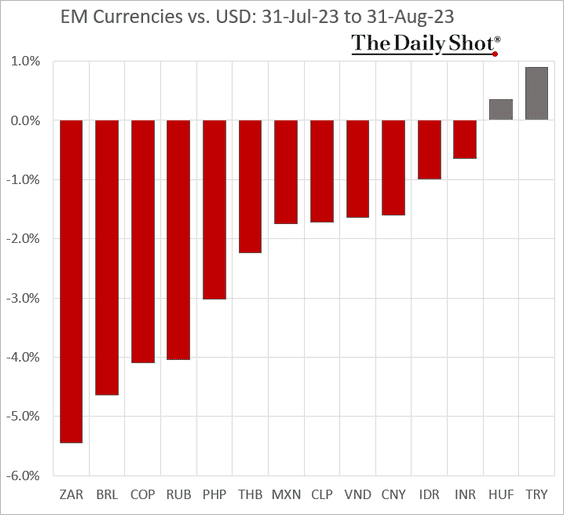
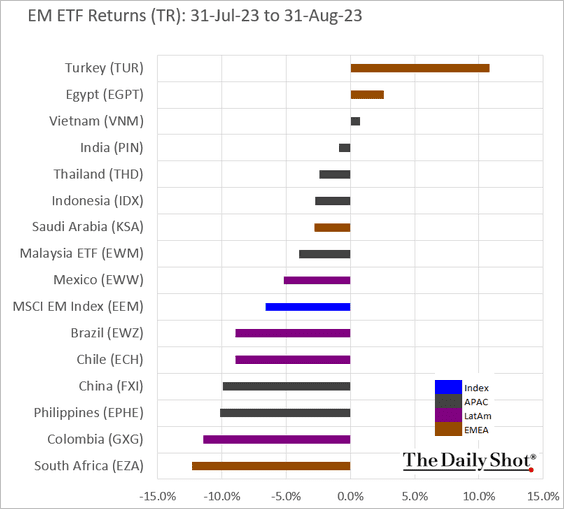
5. Next, we have some performance data for August.
• Currencies:
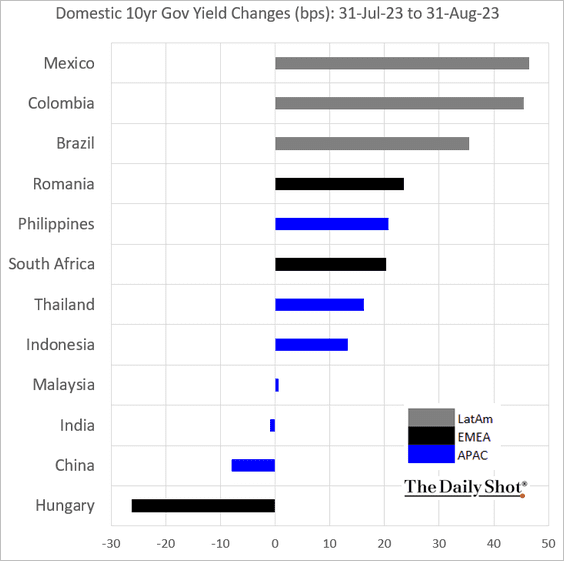
• Bond yields:
• Equity ETFs:
Back to Index
Commodities
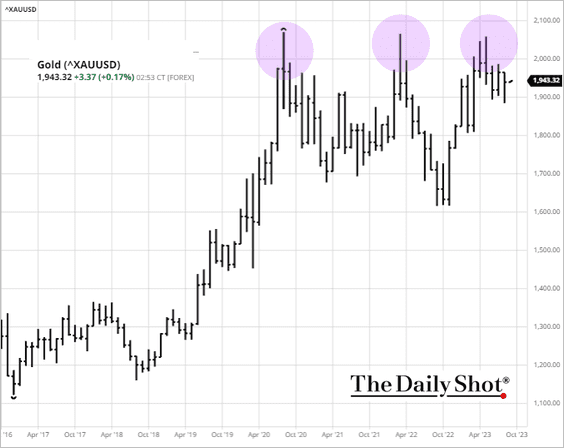
1. A triple top for gold?
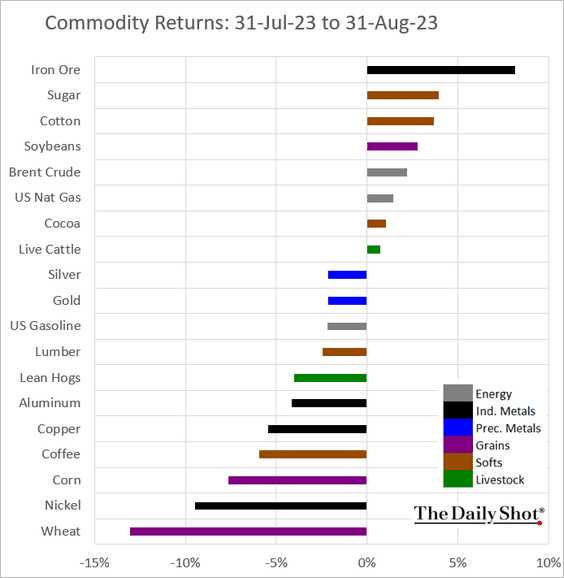
2. Here is last month’s performance across key commodity markets.
Back to Index
Energy
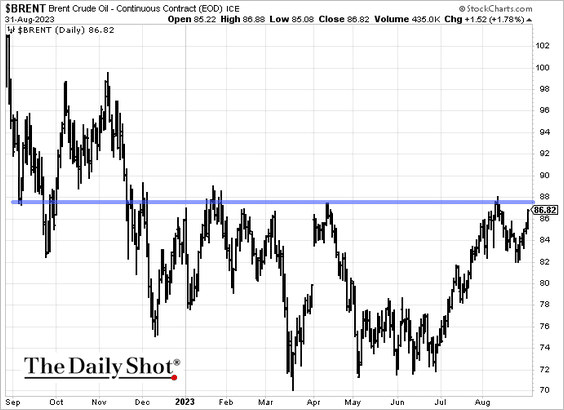
1. Brent is nearing resistance again.
2. On a five-year smoothed basis, capex among oil producers turned positive for the first time since 2015.
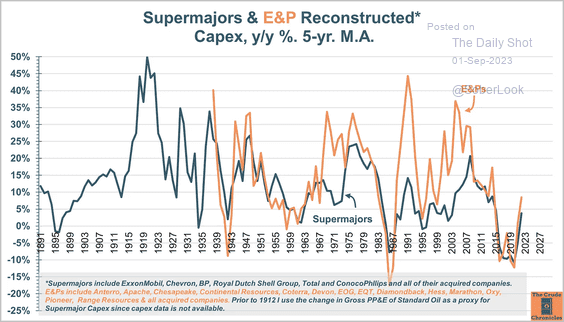 Source: The Crude Chronicles Read full article
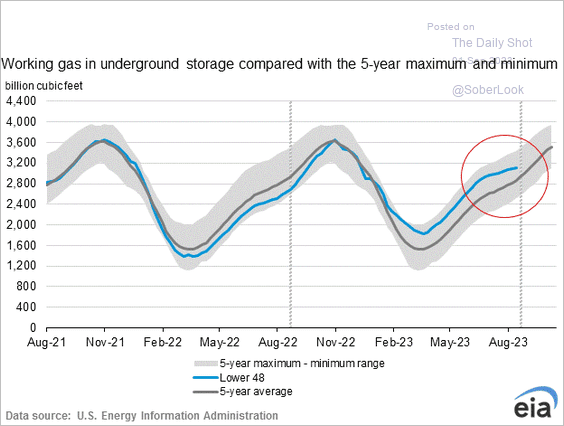
3. US natural gas in storage is rising slower than usual for this time of the year.
Back to Index
Equities
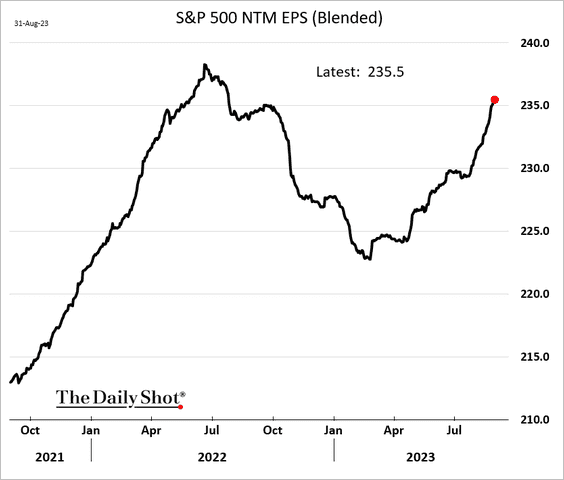
1. S&P 500 earnings expectations for the next 12 months continue to climb.
Here are the quarterly trends for 2024.
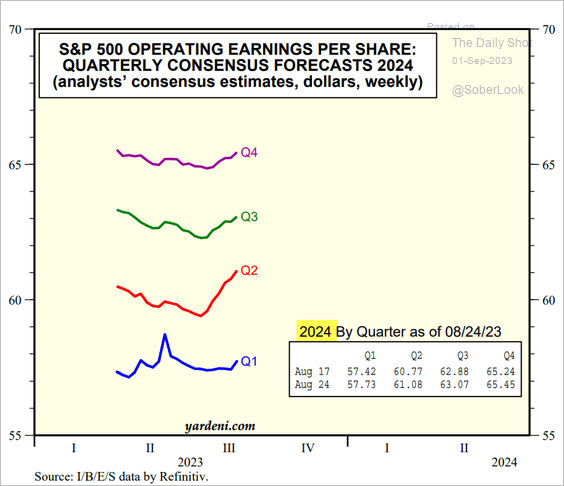 Source: Yardeni Research
——————–
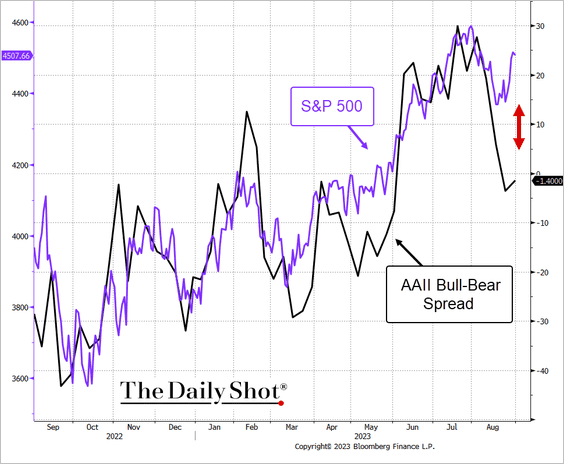
2. Retail investors were unprepared for the market rebound.
 Source: @TheTerminal, Bloomberg Finance L.P.; h/t @themarketear
3. Breadth in global stocks has been narrowing for years.
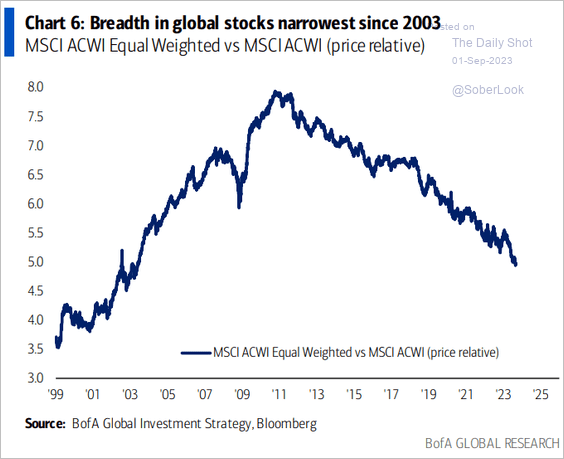 Source: BofA Global Research
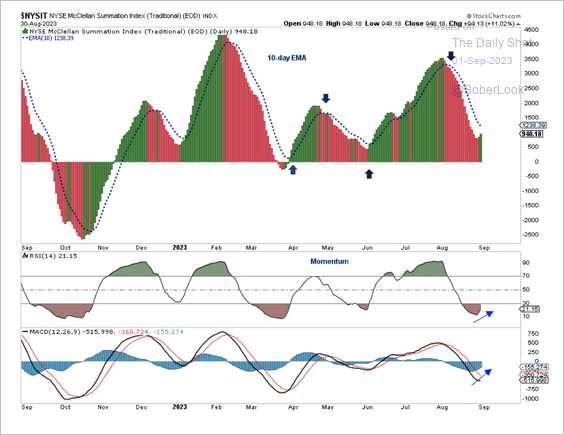
But short-term breadth is improving among NYSE-listed stocks.
 Source: Aazan Habib, Paradigm Capital
——————–
4. The SPY/TLT price ratio (stock/bond ratio) appears extended, although, for now, momentum is still positive.
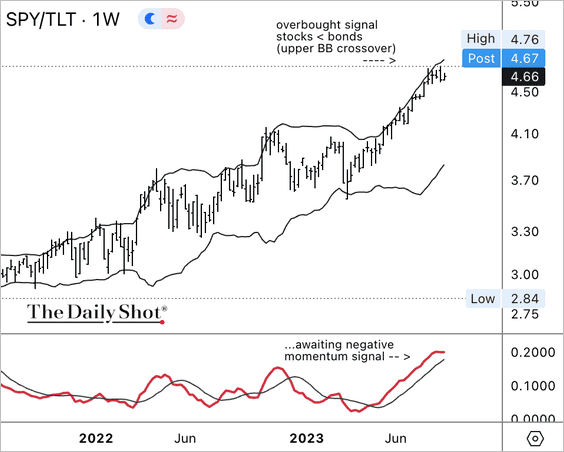
But higher energy-driven inflation could place upward pressure on yields, resulting in a positive correlation between US equity and bond returns – a potential headwind for both assets.
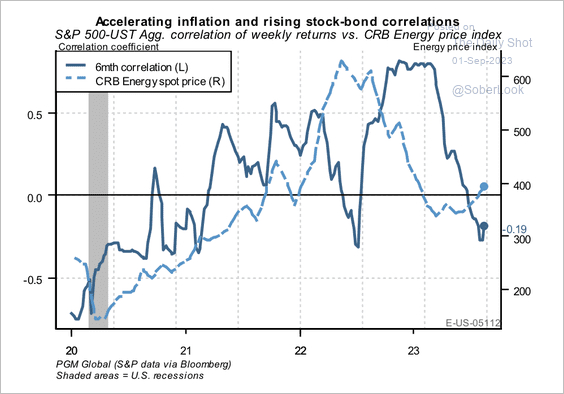 Source: PGM Global
A depressed risk premium points to a pullback in the stock/bond ratio.
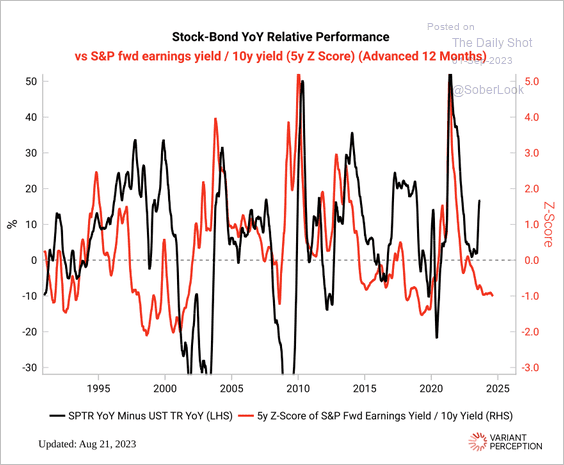 Source: Variant Perception
——————–
5. Housing and retail stocks have diverged.
 Source: BofA Global Research
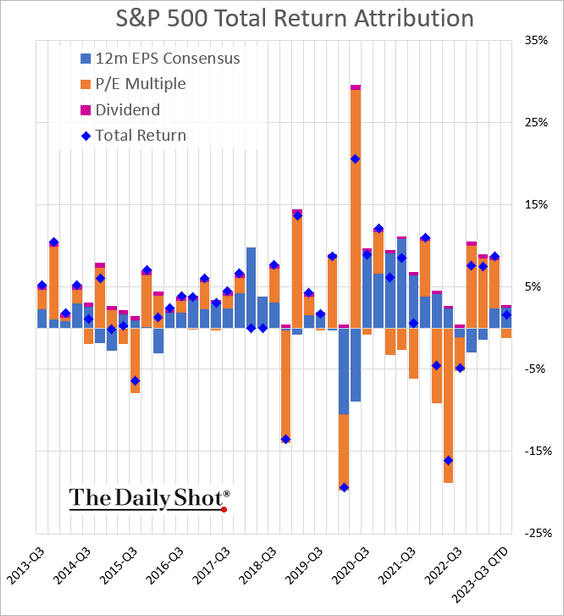
6. Next, let’s take a look at quarterly performance attribution.
• S&P 500 (this quarter’s gains have been driven by earnings expectations):
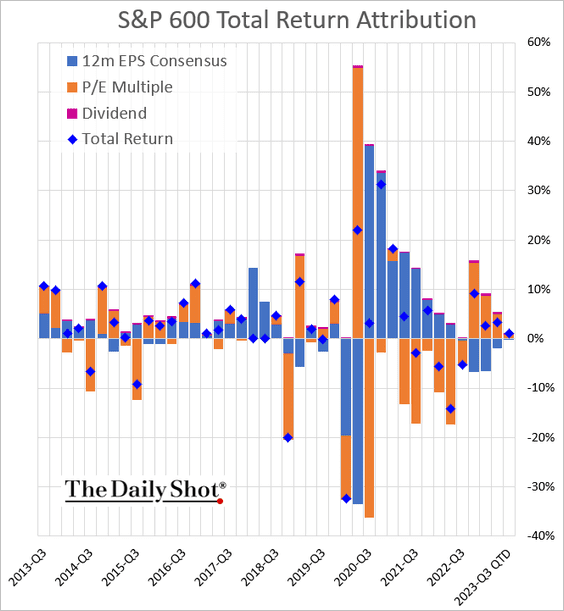
• S&P 600 (small caps are almost flat QTD):
——————–
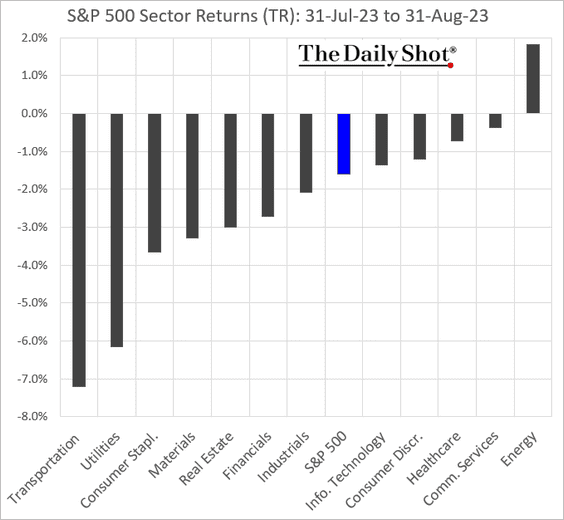
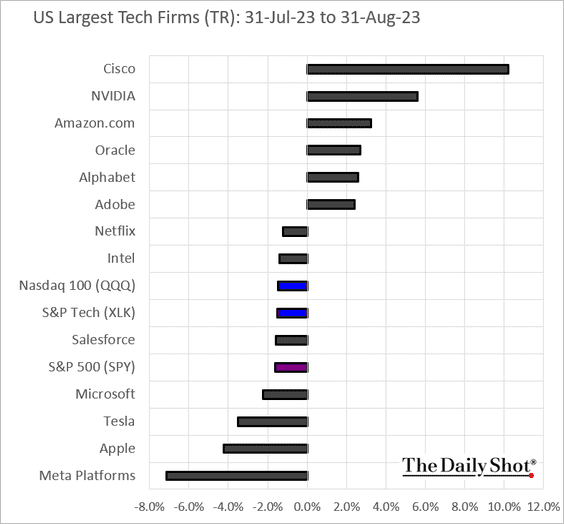
7. Finally, here are some performance metrics for August.
• Sectors:
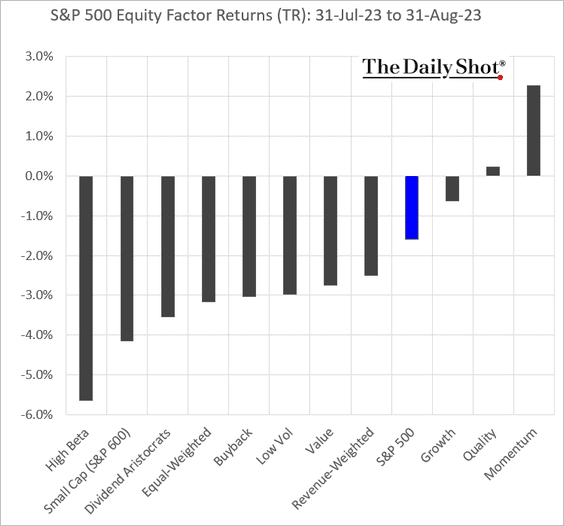
• Equity factors:
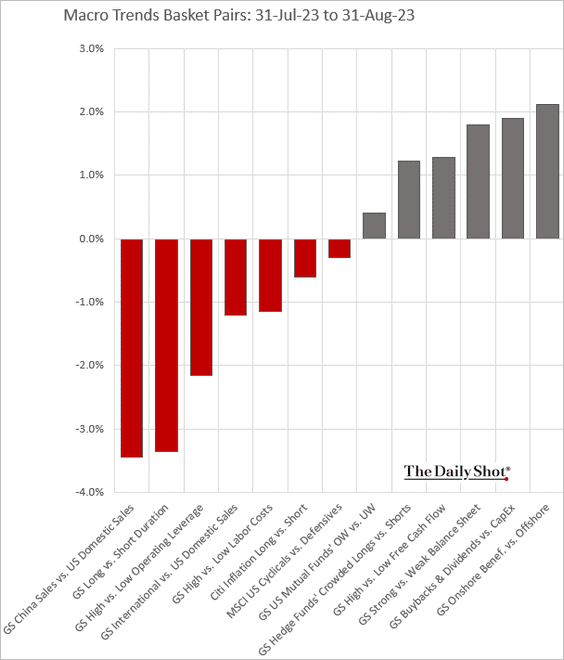
• Macro basket pairs’ relative performance:
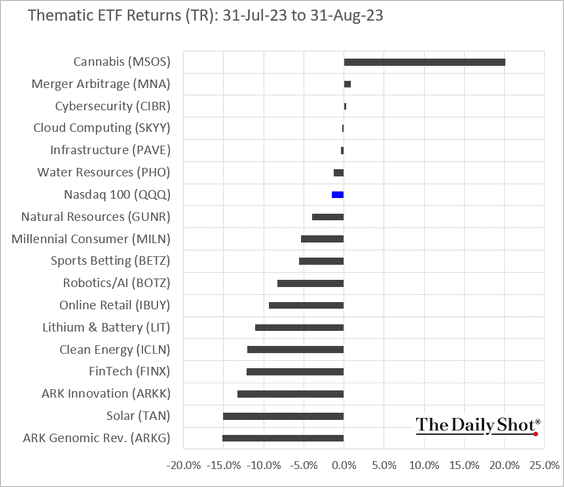
• Thematic ETFs:
• Largest US tech firms:
Back to Index
Credit
1. MBS spreads are elevated relative to corporate bonds.
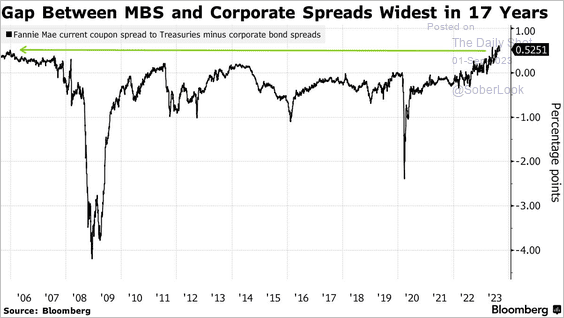 Source: @markets Read full article
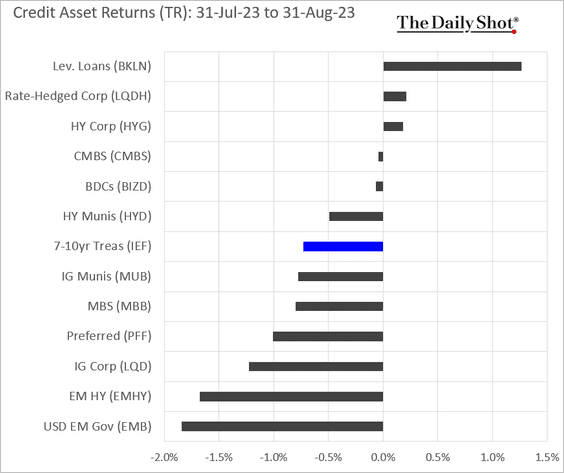
2. Here is last month’s performance across credit asset classes.
Back to Index
Rates
1. Variant Perception’s model shows the 10-year Treasury yield at a short-term peak, which coincides with extremes in the stock/bond ratio.
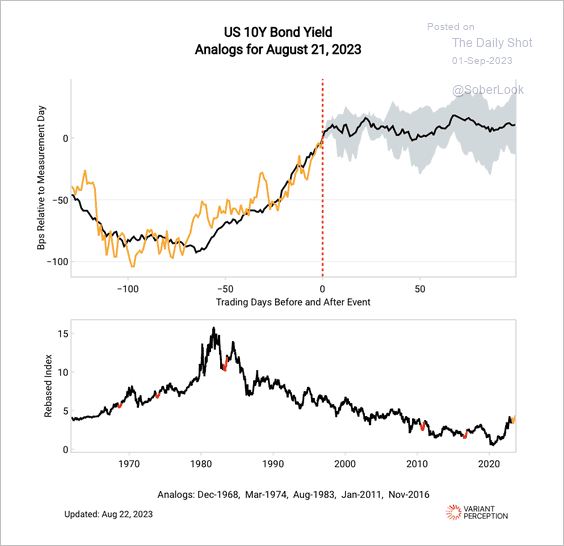 Source: Variant Perception
• Technicals suggest the 10-year Treasury note is oversold.
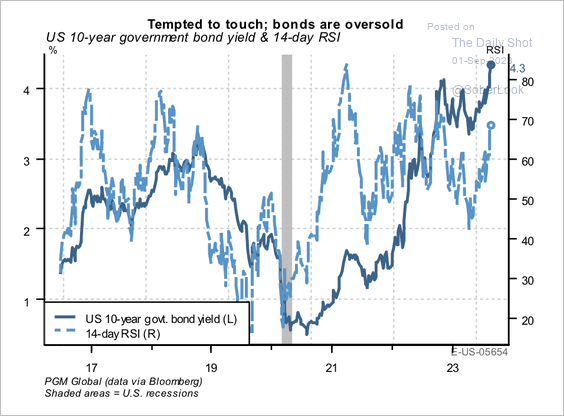 Source: PGM Global
——————–
2. BofA’s private clients are dumping inflation-linked Treasuries again.
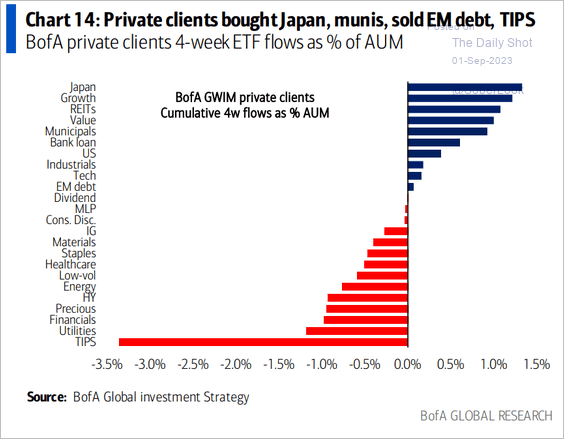 Source: BofA Global Research
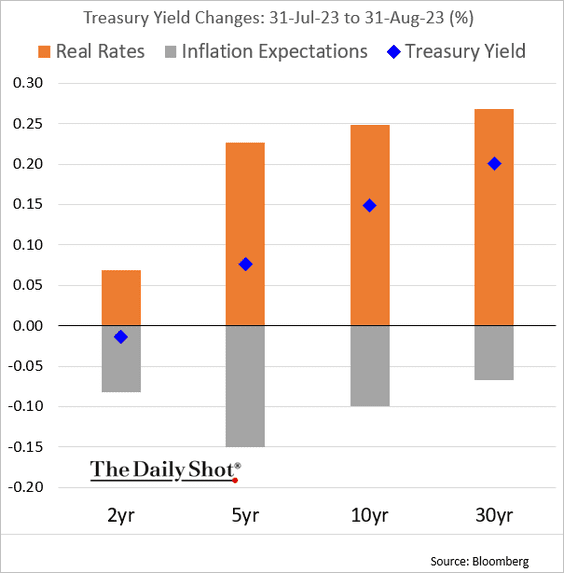
3. Here is the attribution of Treasury yield changes in August.
Back to Index
Global Developments
1. What do central bankers fear most?
 Source: ING
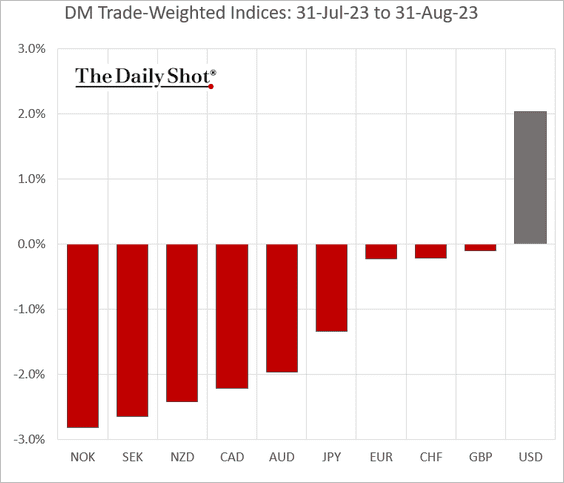
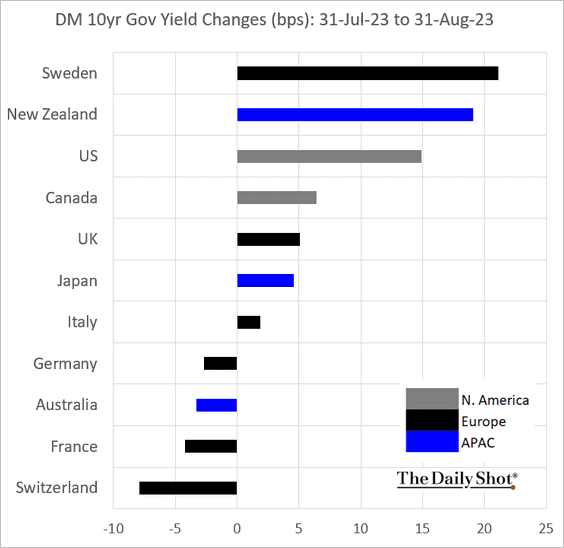
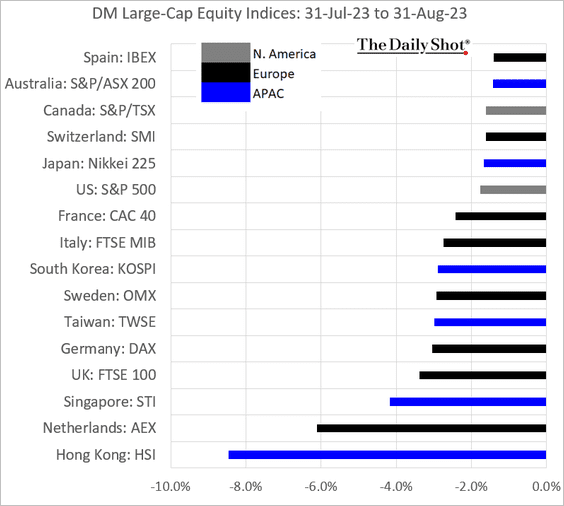
2. Here is last month’s market performance across advanced economies.
• Currencies:
• Bond yields:
• Equities:
——————–
Food for Thought
1. US credit card usage:
 Source: LendingTree Read full article
2. Days lost to strike action:
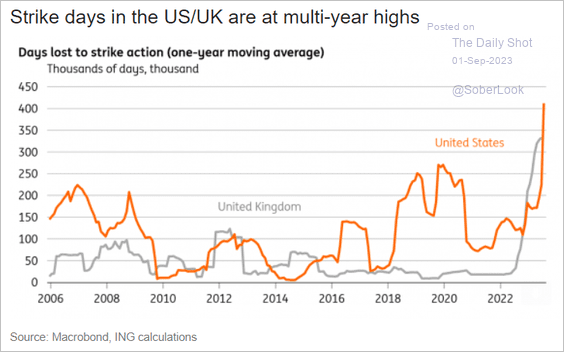 Source: ING
3. According to S&P Global, “retailers are preparing for Halloween sales earlier than ever.”
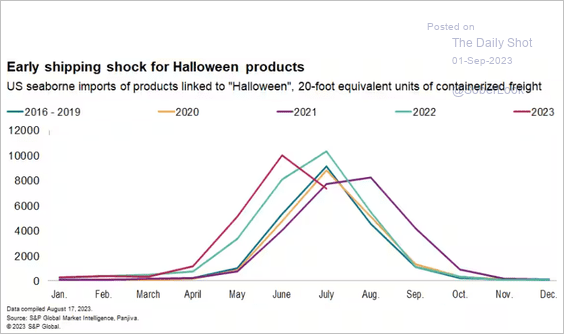 Source: S&P Global Market Intelligence
4. Growth in digitally-delivered service exports:
 Source: @WSJ Read full article
5. Music popularity by genre:
 Source: @chartrdaily
6. Proportion of women born in 1970 who are childless:
 Source: @bbgequality Read full article
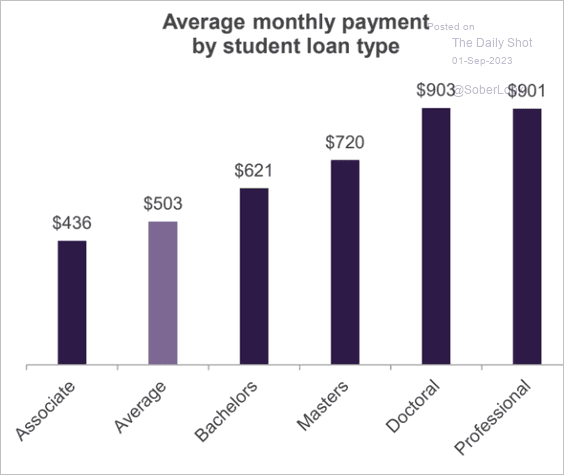
7. Average monthly payment on student debt:
 Source: Truist Advisory Services
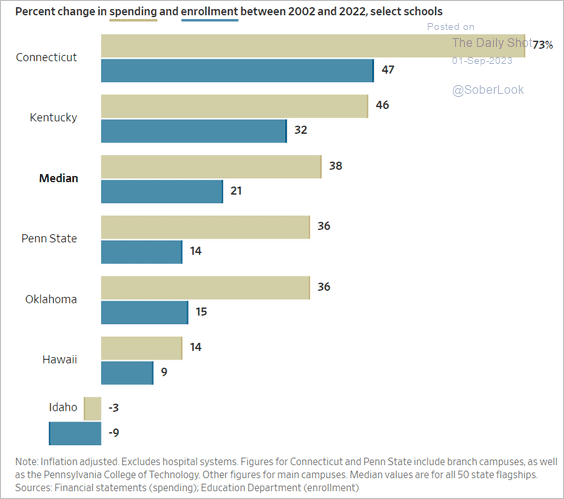
8. Changes in spending and enrollment at public universities:
 Source: @WSJ Read full article
9. Golf course popularity:

——————–
The next Daily Shot will be published on Tuesday.
Have a great weekend!
Back to Index