
The Daily Shot: 08-Sep-23
• The United States
• The Eurozone
• Europe
• Japan
• China
• Emerging Markets
• Cryptocurrency
• Commodities
• Energy
• Equities
• Global Developments
• Food for Thought
The United States
1. Let’s begin with the labor market.
• Initial jobless claims eased again last week.


Continuing claims remain elevated relative to 2018, 2019, and 2022.


• Here are the key measures of labor market slack (number of standard deviations).
 Source: Capital Economics
• Labor productivity is back on its pre-COVID trend.

• Employee motivation has been deteriorating.
 Source: @economics Read full article
——————–
2. Inflation is following the pattern we saw in previous spikes.
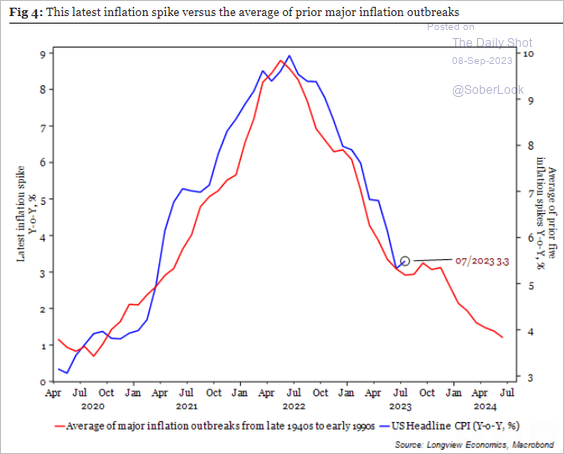 Source: Longview Economics
3. Rents declined last month, according to Apartment List.
 Source: Apartment List
Rents are also down on a year-over-year basis.
 Source: Apartment List
——————–
4. Construction of new apartments is near record highs, and there is more in the pipeline, …
 Source: Quill Intelligence
…while the supply/demand imbalance suggests lower prices ahead (2 charts).
 Source: Quill Intelligence
 Source: @WSJ Read full article
——————–
5. The GDPNow model estimate for the Q3 growth rate is holding above 5% (annualized), …
 Source: Federal Reserve Bank of Atlanta
… boosted by robust inventory build and consumer spending (PCE goods and services).
 Source: @TheTerminal, Bloomberg Finance L.P.
——————–
6. Next, we have some updates on trade.
• Services trade surplus has been improving.
 Source: Oxford Economics
• Pre-COVID protectionism remains in place, …
 Source: TS Lombard
… contributing to the shift in bilateral US trade.
 Source: TS Lombard
• US imports from Mexico are now above that of China.
 Source: BofA Global Research
• US trips abroad (imports) are above pre-COVID levels, but inbound trips (exports) are lagging.
 Source: Economics and Strategy Group, National Bank of Canada
Back to Index
The Eurozone
1. The Q2 GDP growth was revised lower.

• PMI indicators point to a contraction ahead.
 Source: Pantheon Macroeconomics
• Softer demand also signals weaker economic growth.
 Source: Longview Economics
——————–
2. These charts show household debt and interest expense as a percent of disposable income.
 Source: Capital Economics
 Source: Capital Economics
——————–
3. Below is the composition of the broad money supply growth.
 Source: Macrobond
4. Here is the euro-area Phillipps Curve: the core CPI vs. job openings per unemployed resident
 Source: ECB
Back to Index
Europe
1. The Polish zloty tumbled after the central bank’s decisive rate cut.
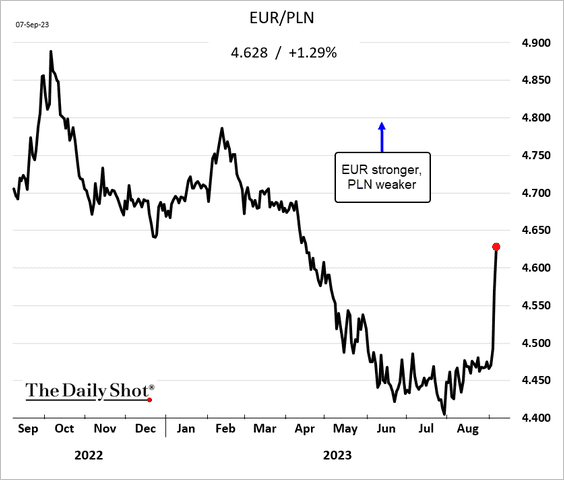
Bond yields dropped.

The Czech koruna also dropped.

——————–
2. Swiss FX reserves continue to fall as the SNB shrinks its balance sheet (putting upward pressure on the franc).

3. Russia’s share in EU trade fell below 2%.
 Source: Eurostat Read full article
Back to Index
Japan
1. The GDP was revised lower, …

… with domestic demand weaker than the earlier estimates.

 Source: US News Read full article
——————–
2. The current account surplus hit a record high.

3. Real wages remain below last year’s levels, with the July figure surprising to the downside.

4. The leading index continues to trend lower.

5. More upside for Japan’s bank shares as the BoJ eases yield control?
 Source: BofA Global Research
Back to Index
China
1. The renminbi’s descent has been relentless, …

… even as Bejing attempts to stabilize China’s currency (2 charts).

 Source: @TheTerminal, Bloomberg Finance L.P.
——————–
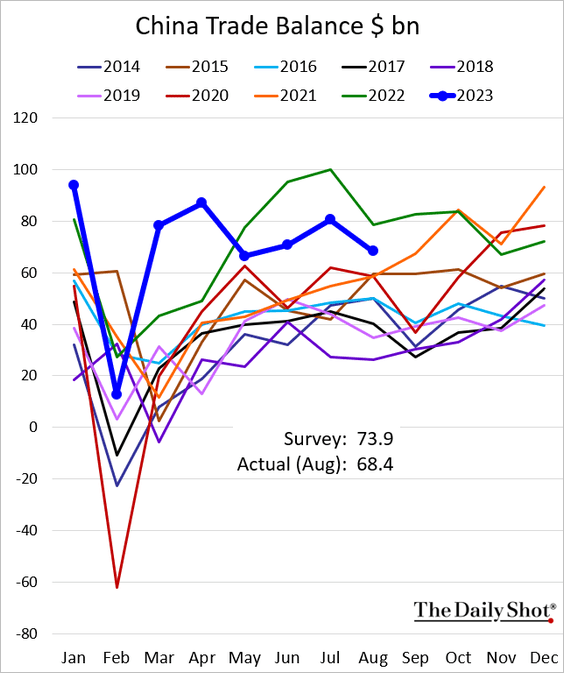
2. Exports dipped below 2021 levels last month.

 Source: @WSJ Read full article
The trade surplus was below expectations.
——————–
3. China’s F/X reserves declined more than expected.

 Source: @WSJ Read full article
Hong Kong’s F/X reserves also fell.

——————–
4. China’s narrow money supply is massive relative to the rest of the world.
 Source: Simon White, Bloomberg Markets Live Blog
5. Will Beijing consider raising the retirement age to address the decline in the labor force?
 Source: Jason Clenfield Read full article
Back to Index
Emerging Markets
1. Let’s begin with Mexico.
• Inflation (easing):

• CapEx (very strong):

• Consumer confidence (still climbing):

• Vehicle production (the rebound is slowing):

• Unemployment (bottomed?):

• Remittances:

• Is the peso overvalued?
 Source: Oxford Economics
——————–
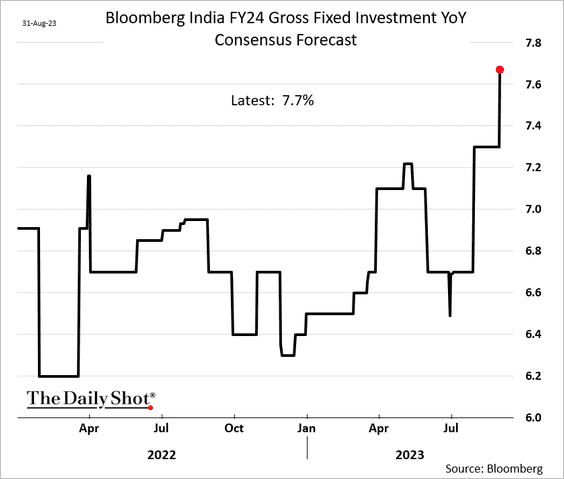
2. Economists continue to boost their forecasts for India’s business investment.
3. Here is a look at financial linkages to China across EM Asia.
 Source: Gavekal Research
Back to Index
Cryptocurrency
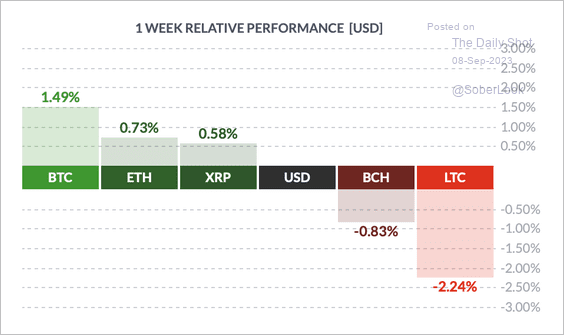
1. It has been a mixed week for cryptos, with BTC in the lead and Litecoin (LTC) underperforming top peers.
 Source: FinViz
2. BTC/USD appears oversold and is holding support at its 40-week moving average. However, long-term momentum has weakened.

3. Bitcoin’s market cap relative to the total crypto market cap (dominance ratio) stabilized last week, although nearby resistance suggests altcoins could display relative strength.

4. Roughly 30% of altcoins have outperformed bitcoin over the past 90 days, rising from just 3% in May.
 Source: Blockchain Center
Back to Index
Commodities
1. US real rates continue to signal downside risks for gold.

2. Here is a look at global steel production.
 Source: @Jess_Shankleman, @markets Read full article
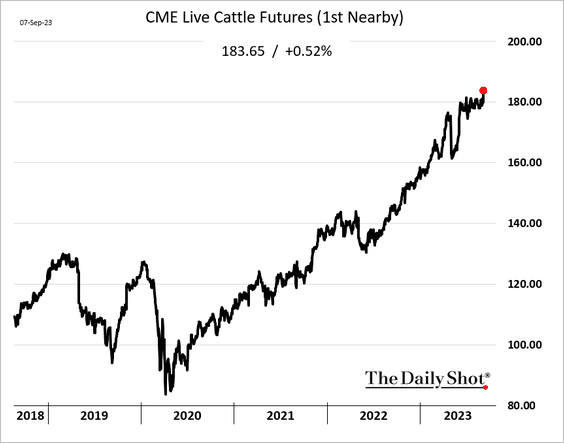
3. Chicago cattle futures hit a record high amid growing demand for beef.
 Source: @WSJ Read full article
Back to Index
Energy
1. Once again, US oil inventories declined more than expected last week (3 charts).


US gasoline inventories also fell sharply, …

… as demand surged.

——————–
2. US natural gas injections remain slower than is typical for this time of the year.

Back to Index
Equities
1. Let’s begin with some sector updates.
• Tech:

 Source: Reuters Read full article
– First outflow from tech in 11 weeks:
 Source: BofA Global Research
• Semiconductors:

 Source: Yahoo Finance Read full article
• Consumer discretionary:

• Energy:

• Transportation:
![]()
• Banks:

——————–
2. The Nasdaq 100 has been consolidating.
 h/t @themarketear
3. It has been a while (137 business days) since the S&P 500 had a 2% daily price move.
 Source: @bespokeinvest
4. Equity sentiment is normalizing from bullish extremes.
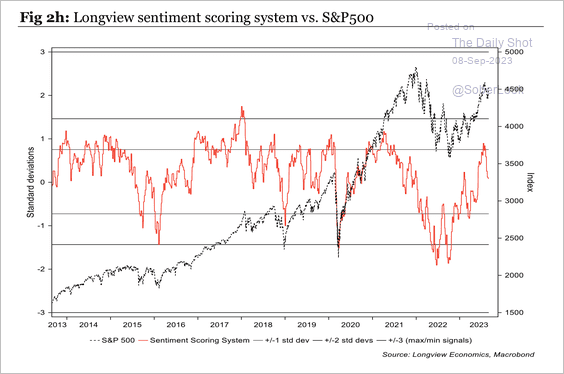 Source: Longview Economics
5. The earnings yield of the S&P 500 remains below the cash yield.
 Source: BofA Global Research
6. This chart provides in-depth equity factor performance for August.
 Source: CornerCap Institutional
Back to Index
Global Developments
1. Cross-border banking has been weak relative to pre-financial crisis levels.
 Source: TS Lombard
2. The market revised its expectations for US interest rates relative to the rest of the G10, which supported the dollar. (2 charts)
 Source: BCA Research
 Source: BCA Research
On the other hand, the expansion of the US fiscal deficit could be a headwind for the dollar.
 Source: Aazan Habib, Paradigm Capital
——————–
4. The rate of change of G4 central bank balance sheets appears to have bottomed.
 Source: Aazan Habib, Paradigm Capital
——————–
Food for Thought
1. Undergraduate petroleum-engineering enrollments:
 Source: @WSJ Read full article
2. Florida voter registrations by party:
 Source: The Economist Read full article
3. Allowing at least one day of remote work gives companies an edge in hiring:
 Source: @WSJ Read full article
4. The long-term impact on earnings from a job loss:
 Source: Becker Friedman Institute for Economics at the University of Chicago Read full article
5. Overqualified workers in advanced economies:
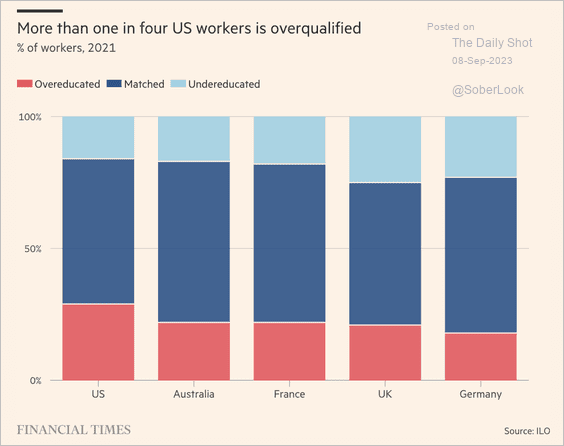 Source: @financialtimes Read full article
6. Going on your first solo trip:
 Source: ePassportPhoto.com Read full article
7. Socializing:
 Source: Statista
——————–
Have a great weekend!
Back to Index