
The Daily Shot: 07-Sep-23
• Administrative Update
• The United States
• Canada
• The United Kingdom
• The Eurozone
• Europe
• Japan
• Asia-Pacific
• China
• Emerging Markets
• Cryptocurrency
• Commodities
• Energy
• Equities
• Rates
• Food for Thought
Administrative Update
• If you are having trouble viewing images in The Daily Shot, please adjust the settings on your email application as shown here.
• Detailed instructions for Microsoft Outlook users are available here.
• Alternatively, you can always click “View in your browser” at the top of the letter.

• If the above solutions don’t work, please email [email protected] with the following information:
– The type of device and email application you are using.
– A screenshot with the images missing.
– Let us know whether you are able to see images in this sample letter.
Back to Index
The United States
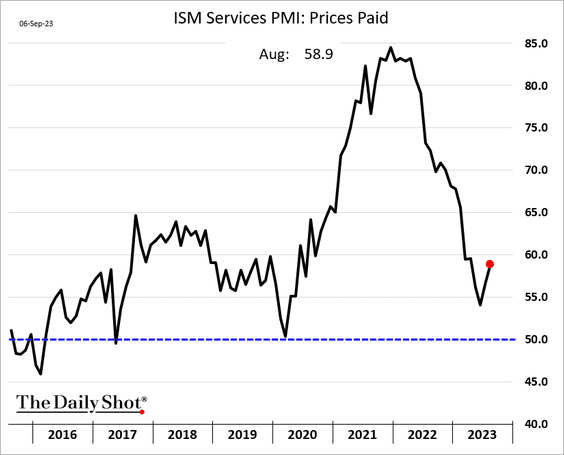
1. According to the ISM PMI report, service sector growth unexpectedly jumped last month.


 Source: @TheTerminal, Bloomberg Finance L.P.
• Hiring strengthened.

• There was a sudden acceleration in cost inflation, which we saw in the regional Fed data.
 Source: Reuters Read full article
——————–
2. Spooked by rising activity and costs in services, markets trimmed next year’s rate cut expectations (2 charts).


Short-term yields jumped, …

… pressuring stocks.

——————–
3. Here are some notable points from the Fed’s Beige Book report.
– Companies’ pricing power is ebbing.
Contacts in several Districts indicated input price growth slowed less than selling prices, as businesses struggled to pass along cost pressures. As a result, profit margins reportedly fell in several Districts.
– The credit crunch has eased, but demand is soft.
Conditions in the broad finance sector stabilized following a period of pronounced weakness, though, on balance, loan demand continued to decline and delinquency rates edged up.
– The housing market remains resilient amid low inventories.
… low levels of existing home inventory were making new homes more attractive. However, some contacts saw a slowdown in multifamily construction. Residential real estate activity decreased slightly as low inventories held back sales. Contacts indicated that homes were selling quickly, and many received multiple offers.
• There was less talk about inflation. Language related to an economic slowdown increased.
 Source: Oxford Economics
Here is the count of the word “recession” over time.

——————–
4. Next, we have some updates on the housing market.
• Mortgage applications remain at multi-year lows, …

… as affordability deteriorates (2 charts).
 Source: Goldman Sachs; III Capital Management
 Source: @TheTerminal, Bloomberg Finance L.P.
Payments on a new mortgage as a percentage of income reached ~27%, up from 15% in 2019, according to Moody’s.
 Source: Moody’s Investors Service
• Home prices have been remarkably resilient, with Freddie Mac’s index never dipping into the red on a year-over-year basis.

• The median listing price is back above last year’s levels.
 Source: realtor.com
• Inventories remain very low (2 charts).
 Source: Redfin
 Source: realtor.com
• Homebuilders’ top markets are concentrated in regions with strong population growth.
 Source: Moody’s Investors Service
• The share of outstanding homes with low homeowner equity is low, limiting default risk.
 Source: Moody’s Investors Service
——————–
5. Will the resumption of student loan payments delay household formation?
 Source: Quill Intelligence
Back to Index
Canada
1. Expectations for a rate hike increased after the BoC left its benchmark unchanged.

2. USD/CAD is at resistance.

3. The trade deficit narrowed more than expected in July.

4. Canada’s productivity continues to sink.

Back to Index
The United Kingdom
1. Construction activity held in growth mode last month, but residential construction activity is shrinking rapidly.

2. New car registrations remain well above last year’s levels.

3. GBP/USD is rolling over.

Back to Index
The Eurozone
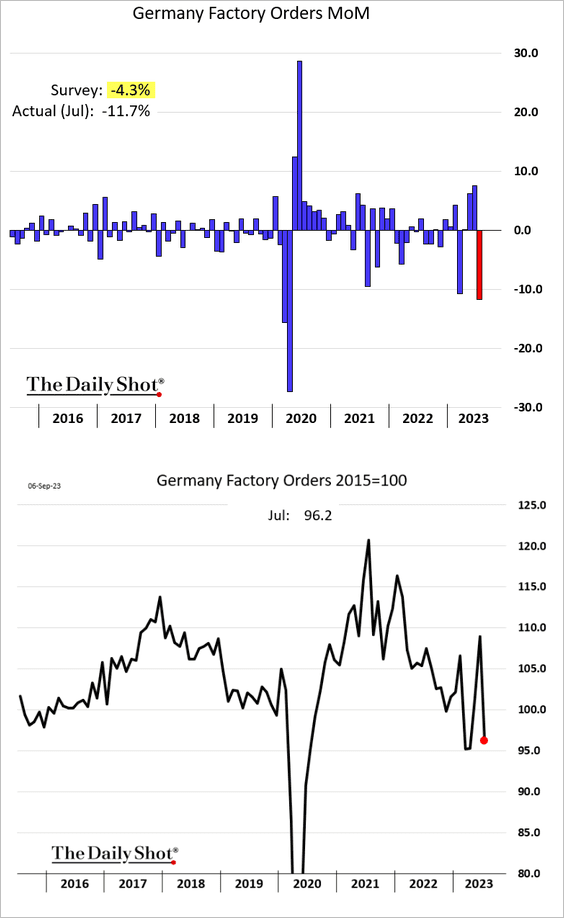
1. Germany’s factory orders tumbled in July.
 Source: @economics Read full article
Industrial production declined again.

• Germany’s construction activity is crashing.

——————–
2. Euro-area retail sales edged lower in July.

3. Longer-dated market-based inflation expectations are now close to those in the US.
 Source: Deutsche Bank Research
4. Unlike the US, euro-area consumers have maintained their cash hoard.
 Source: MRB Partners
Back to Index
Europe
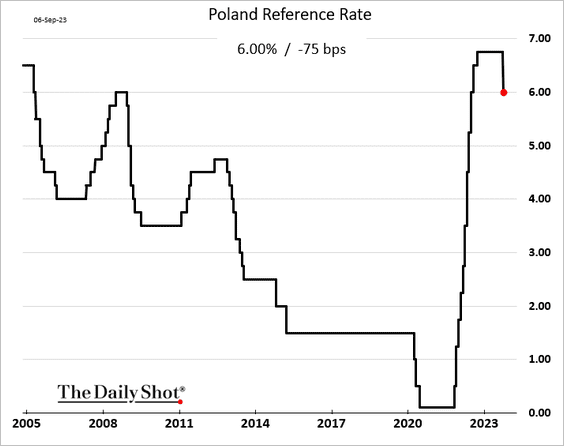
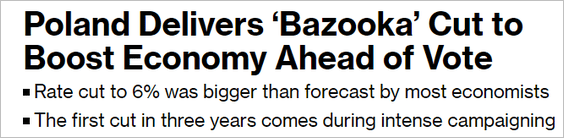
1. Poland’s central bank delivered an aggressive rate cut (the market expected a 25 bps reduction).
 Source: @economics Read full article
——————–
2. It appears that food prices have plateaued in the US and European Union.
 Source: ING
3. Here is a look at the decline in fossil fuel usage in the EU.
 Source: @EmberClimate Read full article
Back to Index
Japan
1. Investors were buying Japanese stocks again last week.

2. Greedflation?
 Source: Capital Economics
Back to Index
Asia-Pacific
1. Taiwan’s headline inflation jumped last month, but core inflation eased.

2. Singapore’s business activity strengthened in August.
 Source: S&P Global PMI
3. Next, we have some updates on Australia.
• GDP growth (in line with expectations):

 Source: ING
• Trade balance (rolling over):


• Job openings (climbing again?)
 Source: @ANZ_Research
Back to Index
China
1. The nation’s currency continues to weaken vs. USD.

2. The residential property inventory/sales ratio is at historically high levels.
 Source: Longview Economics
Public housing construction plans will only partially offset the decline in private residential construction.
 Source: Longview Economics
——————–
3. Steel exports remain healthy, possibly aided by a weaker Chinese yuan.
 Source: @ANZ_Research
4. Below is China’s share of exports to the US, EU, and Japan.
 Source: Torsten Slok, Apollo
Back to Index
Emerging Markets
1. Let’s start with some updates on Brazil.
• GDP growth (stronger than expected):

 Source: @economics Read full article
• Exports (multi-year highs):

• Industrial production (softer in July):

• Services PMI (no growth):
 Source: S&P Global PMI
• Vehicle production (picking up):

• Budget deficit:

——————–
2. South Africa’s trade balance topped expectations.

• Business activity is back in growth mode.
 Source: S&P Global PMI
——————–
3. EM inflation continues to surprise to the downside.
 Source: iA Global Asset Management
Back to Index
Cryptocurrency
1. Bitcoin is holding support near $25,300.

2. September is generally not a good month for bitcoin.
 Source: Deutsche Digital Assets
Back to Index
Commodities
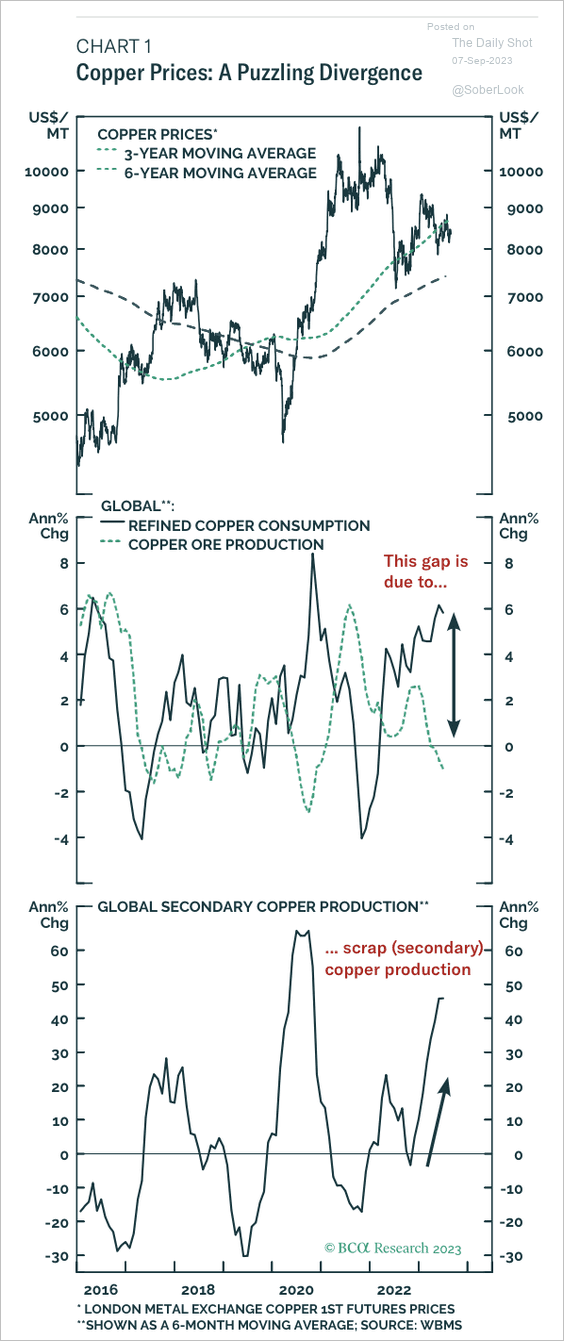
1. Copper prices have declined this year despite higher demand, which was probably due to the green energy transition and scrap production.
 Source: BCA Research
BCA Research expects the refined supply/demand imbalance to widen.
 Source: BCA Research
2. The copper/gold ratio is testing initial support at the midpoint of its long-term range. Technicals suggest that the upside could be limited.

3. Here is a look at corn exports.
 Source: @chartrdaily
Back to Index
Energy
1. European natural gas prices declined sharply in recent days.

2. China’s oil demand is expected to climb next year.
 Source: Goldman Sachs; @dailychartbook
Back to Index
Equities
1. Stock-bond correlations remain elevated.
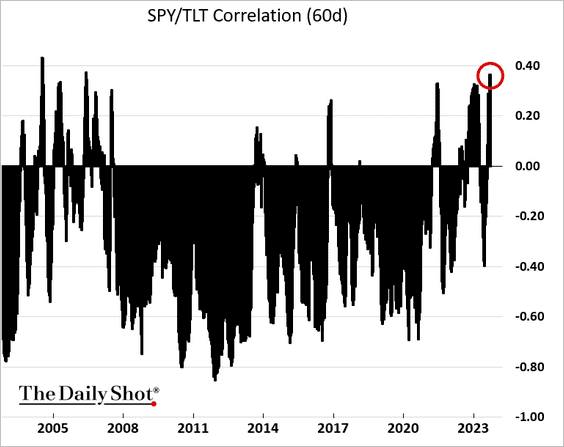
US stocks are more sensitive to changes in domestic government bond yields than non-US stocks.
 Source: MRB Partners
——————–
2. The stock-bond ratio has diverged from economic fundamentals.
 Source: Alpine Macro
The bond market drawdown has been more severe in this cycle than what we saw in equities.
 Source: Alpine Macro
——————–
3. Historically, the S&P 500’s one-year forward return is nearly identical after periods of both positive and negative earnings yield spreads.
 Source: @bespokeinvest
4. Equity valuations outside of the US remain relatively low.
 Source: MRB Partners
5. Here is a look at short interest by sector.
 Source: S&P Global Market Intelligence
6. The top-seven performing tech stocks contributed the most to the S&P 500’s return this year.
 Source: Research Affiliates Read full article
Back to Index
Rates
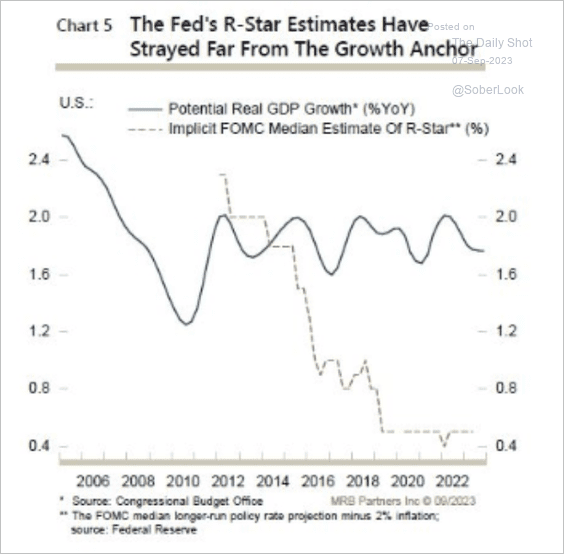
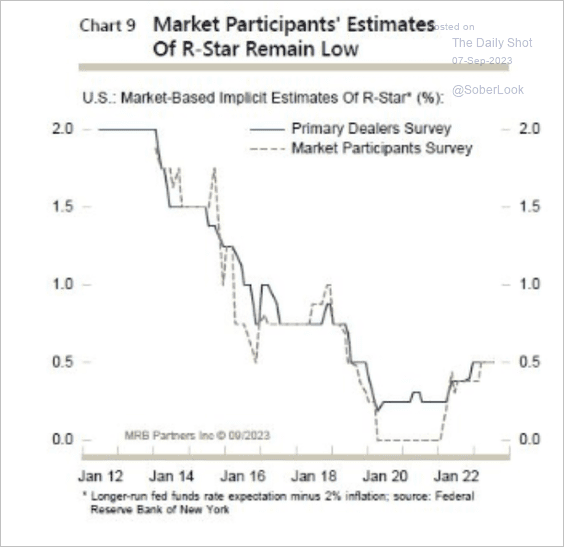
1. The US neutral real policy rate, or R-star, remains very low. MRB Partners expects the Fed to upgrade its median estimate of R-star, and the future policy rate path will follow a much higher trajectory. (2 charts)
 Source: MRB Partners
 Source: MRB Partners
Here is one estimate of R-star.

——————–
2. Next, let’s take a look at the Fed’s balance sheet.
• Total balance sheet:

• Securities holdings:

• Reserves (not declining with QT):

——————–
Food for Thought
1. Americans who do not use the internet:
 Source: Visual Capitalist Read full article
2. EV battery range:
 Source: Canary Media Read full article
3. Appearing busy or doing productive work?
 Source: Statista
4. Market-based 2024 GOP presidential nomination probabilities:
 Source: @PredictIt
5. The hottest summer on record:
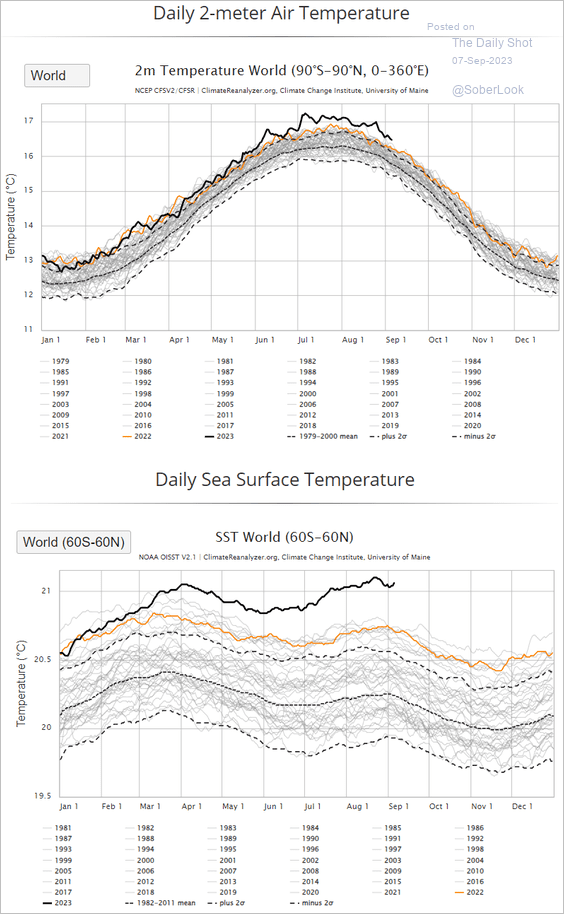 Source: Climate Reanalyzer
 Source: @climate Read full article
——————–
6. More data on maternal mortality rates:
 Source: @chartrdaily
 Source: The Washington Post Read full article
——————–
7. The return of the Pumpkin Spice Latte (PSL) at Starbucks:
 Source: Placer.ai
——————–
Back to Index