
The Daily Shot: 11-Sep-23
• The United States
• Canada
• The United Kingdom
• The Eurozone
• Europe
• Asia-Pacific
• China
• Emerging Markets
• Commodities
• Energy
• Equities
• Credit
• Global Developments
• Food for Thought
The United States
1. Growth in consumer credit has slowed.

• Although credit card debt has reached a new peak, it remains below pre-COVID levels when adjusted for inflation …

… and relative to disposable personal income.

• Growth in student debt continues to moderate.

2. Household net worth hit a record high last quarter, boosted by stocks and house prices.
 Source: @economics Read full article
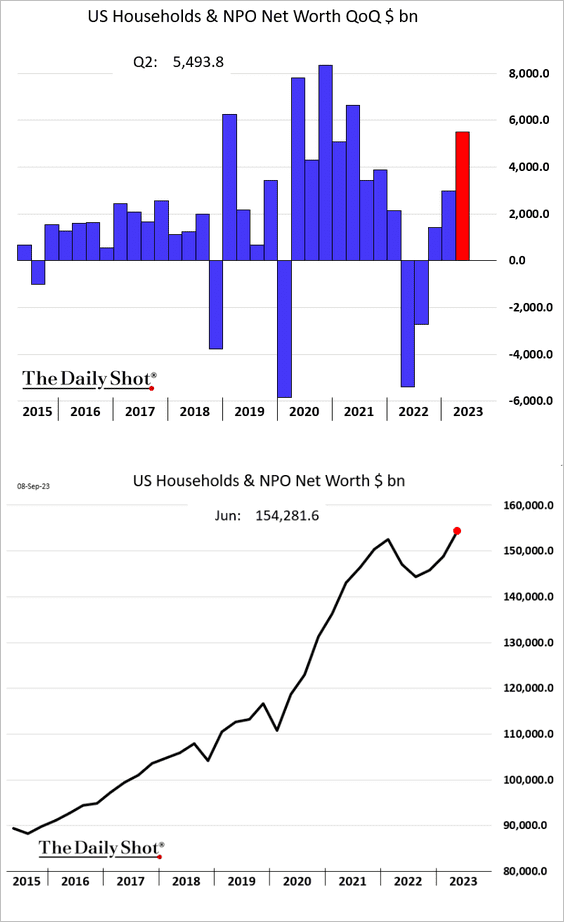
Adjusted for inflation, household net worth is still below the 2021 peak.

• Household cash holdings remain elevated.

• Consumer spending is expected to slow in the months ahead as student loan payments kick in. However, the overall household sector balance sheet, shown as a percentage of disposable income below, is in good shape.
 Source: Mizuho Securities USA
And contrary to all the media hype, household debt payments are only slightly above pre-COVID levels.
 Source: Mizuho Securities USA
——————–
3. Speaking of media hype, the St. Louis Fed’s news-based nowcast growth index is in contraction territory.

And yet, the Atlanta Fed’s nowcast index (GDPNow), which is based on economic data, shows robust growth.

——————–
4. Related to the above, consumer sentiment has diverged from economic data.
 Source: The Economist Read full article
——————–
5. The slowdown in rent growth points to a substantial decline in shelter CPI over the next few quarters.
 Source: Variant Perception
Back to Index
Canada
1. The employment report topped expectations.

• Wage growth unexpectedly accelerated, boosting the probability of another BoC rate hike.

• The unemployment rate held steady

• The participation rate edged lower.

——————–
2. Capacity utilization eased further in Q2.

3. The Ivey PMI, which measures private and public activity, returned to growth mode in August.

4. Debt servicing for Canadian households remains significantly higher than in the US.
 Source: MRB Partners
Back to Index
The United Kingdom
1. Corporate price expectations continue to moderate.
 Source: ING
2. Rental costs are moving sharply higher.
Bloomberg: – Rents are set to rise 25% over the next four years as landlords pass on extra costs from pricier mortgages and tougher regulation, according to a report from broker Hamptons International.
 Source: @markets Read full article
Back to Index
The Eurozone
1. The market sees a 40% chance of an ECB rate hike this week.

2. While Germany’s industrial output has slowed, and further weakness is expected, …
 Source: Pantheon Macroeconomics
… French manufacturing production keeps trending higher.

• Dutch output eased in July.

• Spanish industrial production edged higher.

——————–
3. Soft PMI indicators point to slower business investment activity ahead.
 Source: Danske Bank
4. Hiring is expected to weaken.
 Source: Longview Economics
Back to Index
Europe
1. Sweden’s GDP bounced in July.

• Consumption:

• Production:

But industrial orders declined again.

——————–
2. European natural gas storage is nearly full.
 Source: @JeffreyKleintop
Back to Index
Asia-Pacific
1. Japan’s Economy Watchers Expectations index appears to be rolling over.

2. South Korea’s trade balance is back in surplus.

 Source: Hyosung Kwon, @TheTerminal, Bloomberg Finance L.P. Read full article
——————–
3. Traders boosted their bets against the Aussie dollar last week.

Back to Index
China
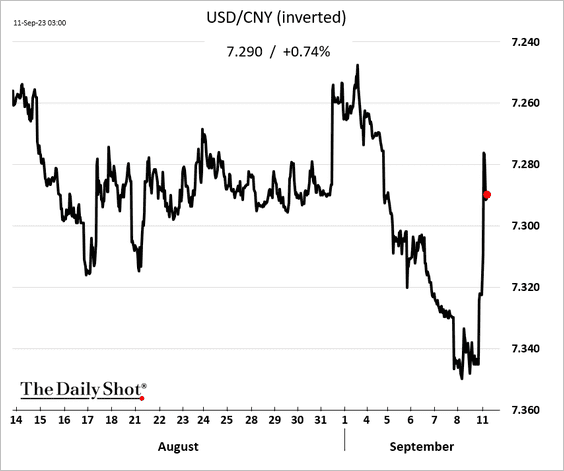
1. Beijing says “do not bet” against the renminbi.
 Source: CNBC Read full article
China’s currency jumped in response to the warning.
——————–
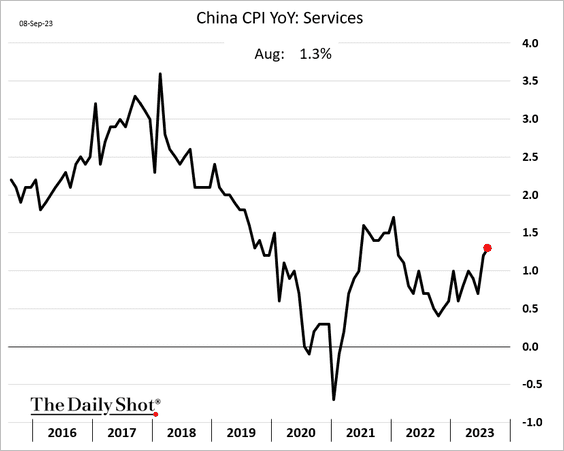
2. Consumer inflation is back in positive territory but remains depressed.

 Source: @financialtimes Read full article
• The core CPI held steady last month.

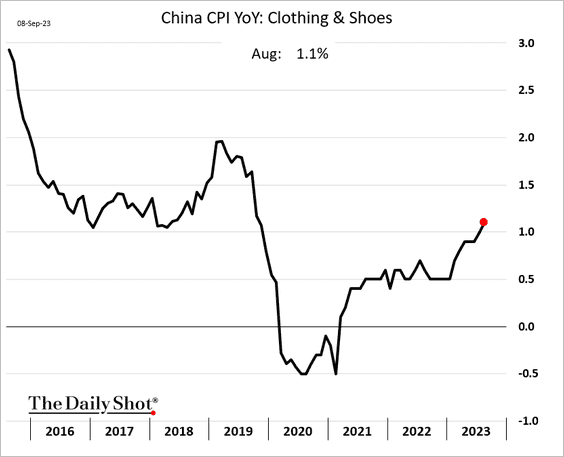
Here are a couple of CPI components.
• Services:
• Clothing:
The PPI was lower than expected.

——————–
3. Country Garden faces a critical vote.
 Source: @markets Read full article
The firm’s bond prices remain depressed.

Sales have been deteriorating.
 Source: @WSJ Read full article
——————–
4. On a relative basis, equities are stabilizing.
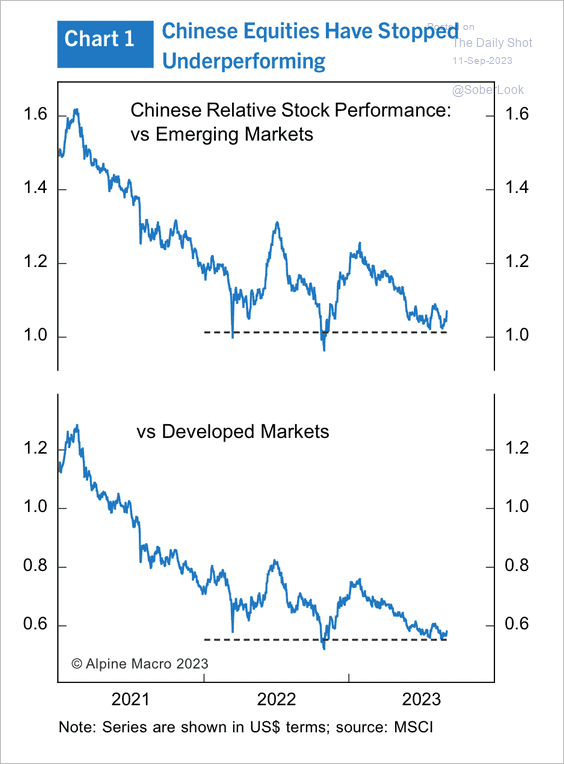 Source: Alpine Macro
Equity valuations remain very low relative to the US and India.
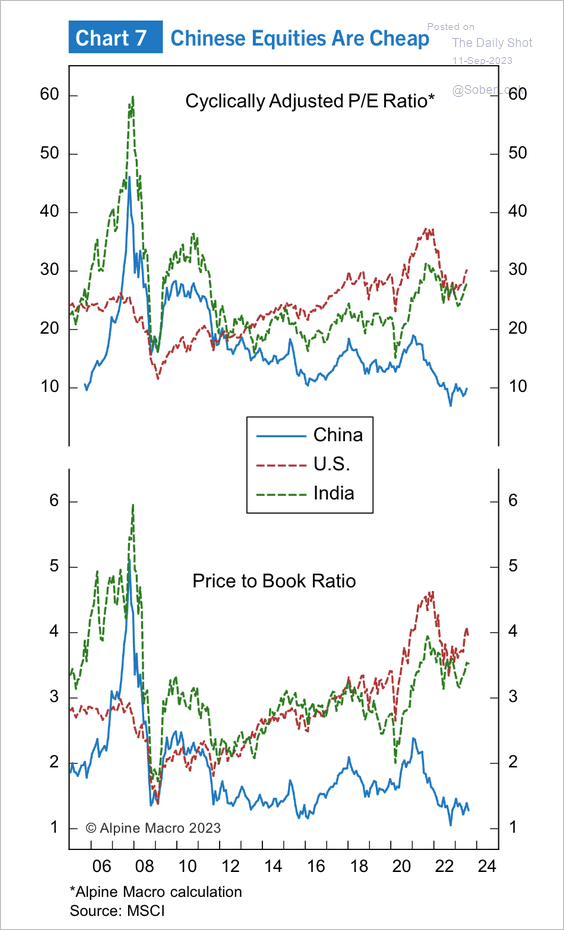 Source: Alpine Macro
Back to Index
Emerging Markets
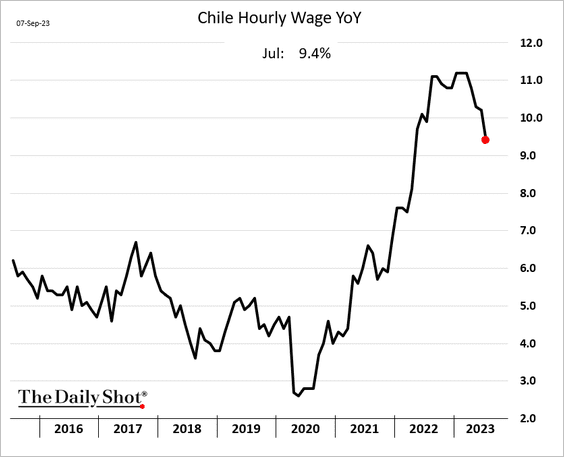
1. Let’s begin with Chile.
• The CPI surprised to the downside, …
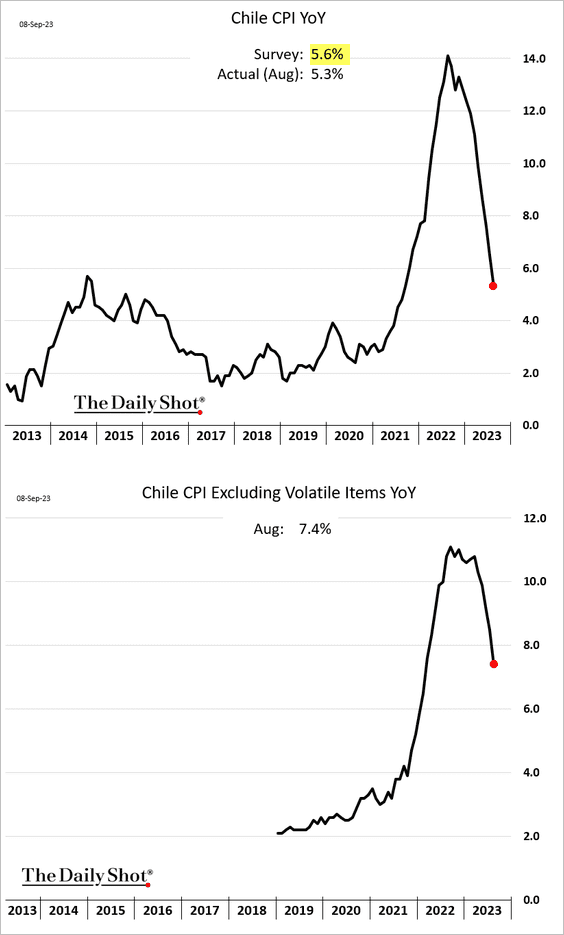
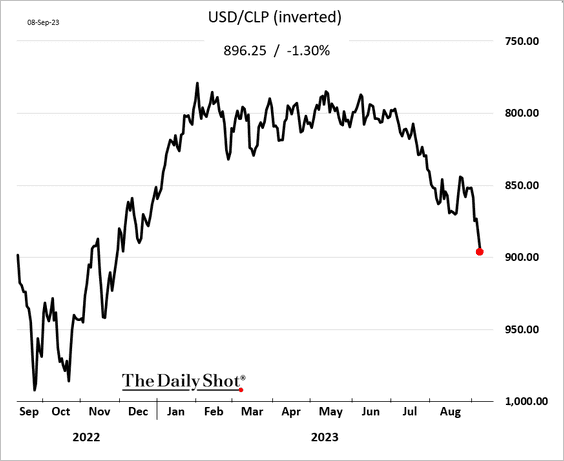
… sending the peso sharply lower on expectations of faster rate cuts.
• Wage growth is slowing.
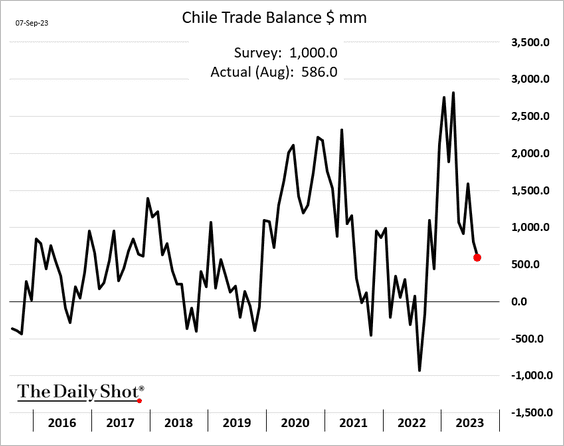
• The trade surplus was lower than expected last month.
——————–
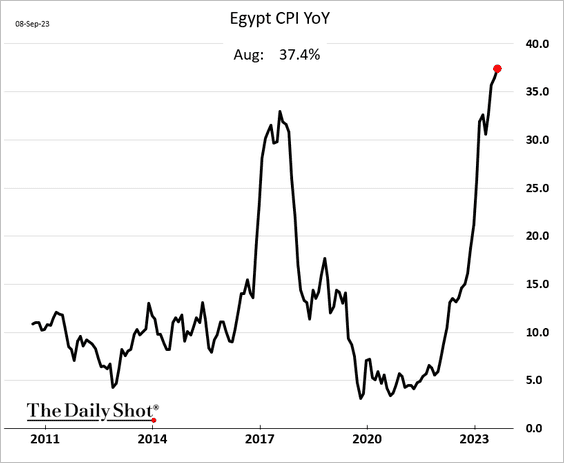
2. Here are some additional CPI trends.
• Egypt:
• Ukraine
 :
:
• Russia:

——————–
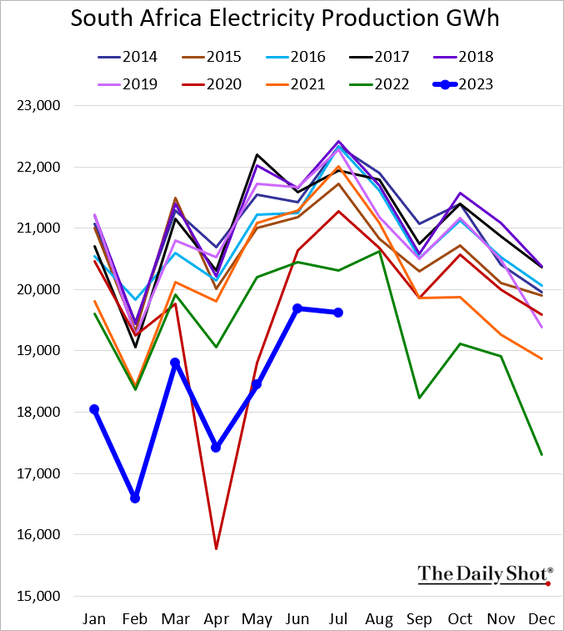
3. South Africa’s current account deficit widened last quarter.

• Electricity production remains depressed for this time of the year.
——————–
4. Next, we have some performance data from last week.
• Currencies:

• Bond yields:

• Equity ETFs:

Back to Index
Commodities
1. Iron ore is up today on stronger credit data from China and a softer US dollar.

2. The Bloomberg Spot Commodity Index closed above its 200-day moving average for the first time in a year.
 Source: SentimenTrader
3. Speculative accounts (such as hedge funds) continue to boost their bets against palladium.

4. Speculators have been increasing their bets on rice futures.

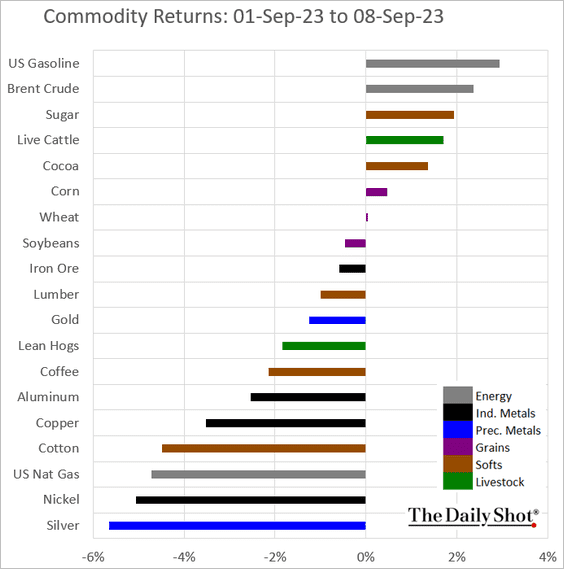
5. Here is last week’s performance across key commodity markets.
Back to Index
Energy
1. The US rig count finally saw an increase last week.

2. Texas power demand has been hitting new highs.

 Source: @climate Read full article
——————–
3. The Inflation Reduction Act has spurred spending on new clean energy projects.
 Source: Global X ETFs Read full article
Back to Index
Equities
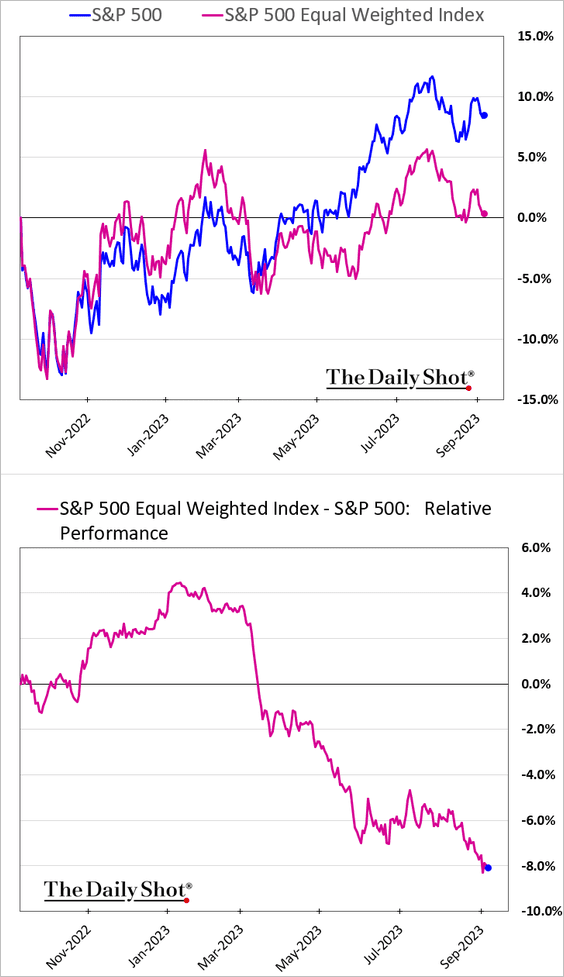
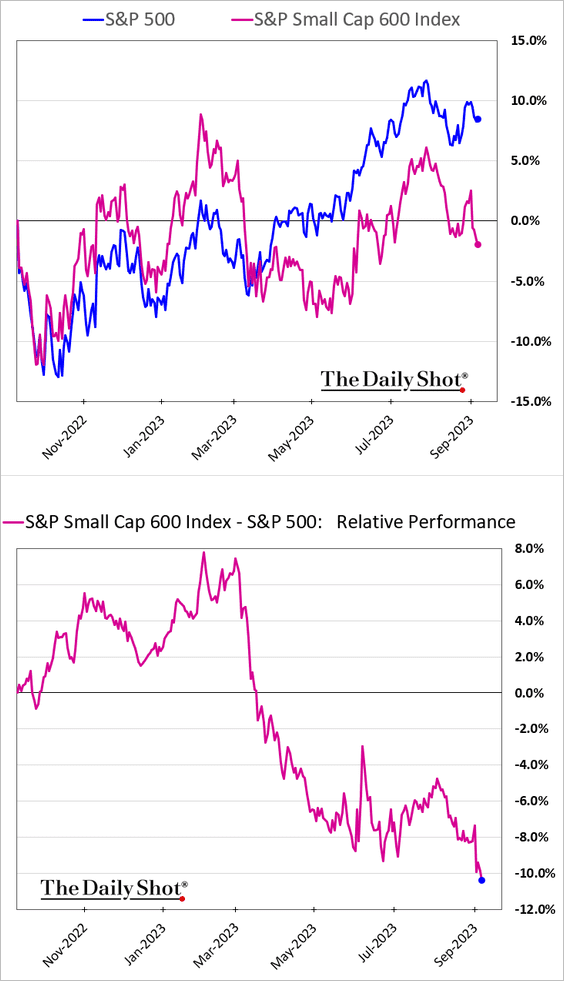
1. Market breadth worsened in recent weeks as most stocks widened their underperformance vs. the S&P 500.
• Equial-weight index:
• Small caps:
• Here is the Nasdaq Composite cumulative advance/decline line.
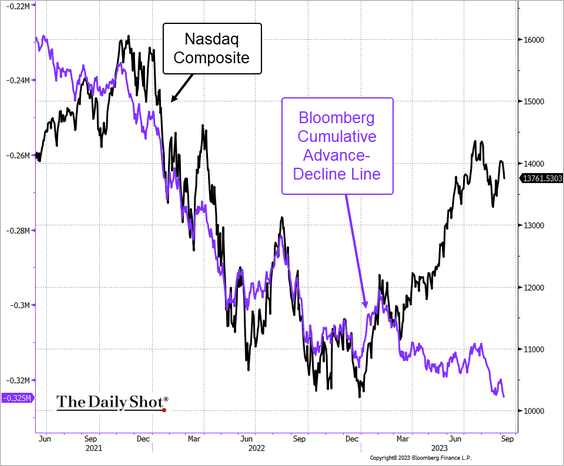 Source: @TheTerminal, Bloomberg Finance L.P.
• The S&P 500’s lofty valuation is driven by tech mega-caps. Beyond these, valuations remain below the long-term average.
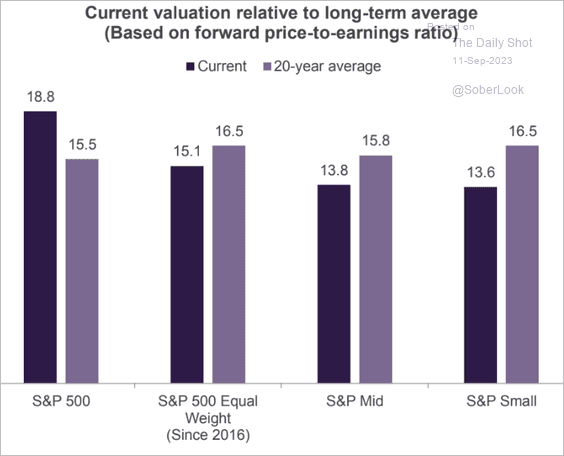 Source: Truist Advisory Services
——————–
2. The S&P 500’s P/E ratio rose toward its 5-year average …
 Source: Global X ETFs Read full article
… and remains elevated relative to the MSCI ACWI (global stocks).
 Source: Global X ETFs Read full article
This chart illustrates the S&P 500’s premium to international markets.
 Source: Truist Advisory Services
——————–
3. How does the relative performance of US sectors correlate with HY bond spreads?
 Source: Capital Economics
4. This chart shows investor positioning by group/sector.
 Source: BNP Paribas; @WallStJesus
5. Next, we have some performance data from last week.
• Sectors:

• Equity factors:

• Macro basket pairs’ relative performance:

The “China sales” basket’s sharp underperformance was mostly due to Apple.

• Thematic ETFs:

• Largest tech firms:

Back to Index
Credit
1. Companies are borrowing at a record pace.
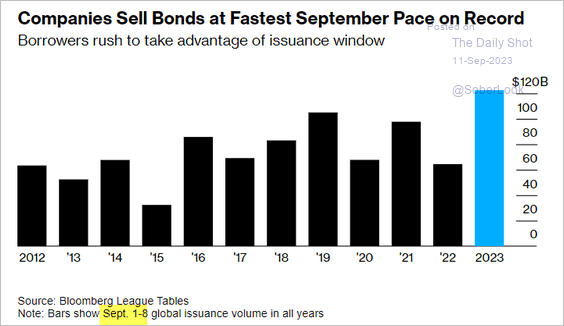 Source: @markets Read full article
2. This chart shows the correlation between IG spreads and the 10-year Treasury yield.
 Source: BofA Global Research; @MikeZaccardi
3. Next, we have some credit performance data from last week.

Back to Index
Global Developments
1. Variant Perception’s model shows additional upside for the dollar before settling in a range.
 Source: Variant Perception
The dollar’s rise lagged continued inflows into US securities.
 Source: Variant Perception
——————–
2. This chart shows core inflation in the US, the Eurozone, and the UK.
 Source: Oxford Economics
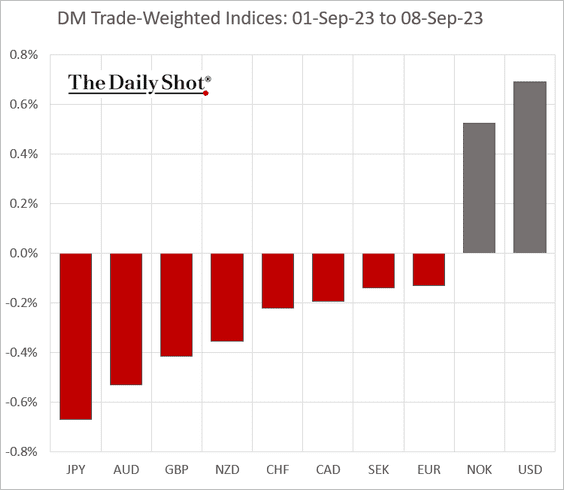
3. Finally, here is last week’s performance across advanced economies.
• Currencies:
• Bond yields:

• Equities:

——————–
Food for Thought
1. The number of new unicorns:
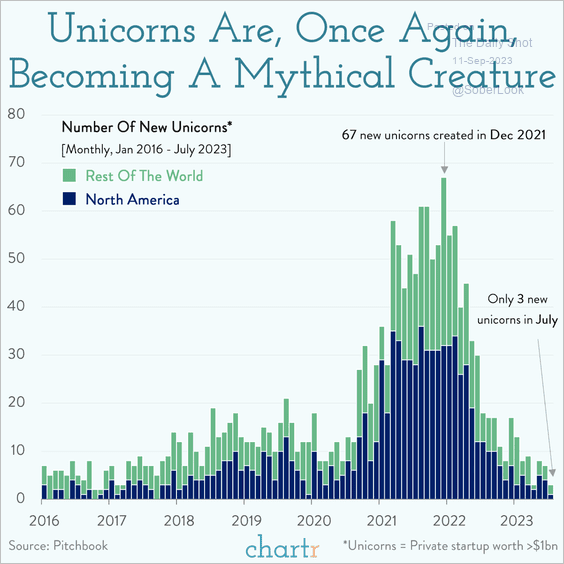 Source: @chartrdaily
2. Office space construction vs. demolitions:
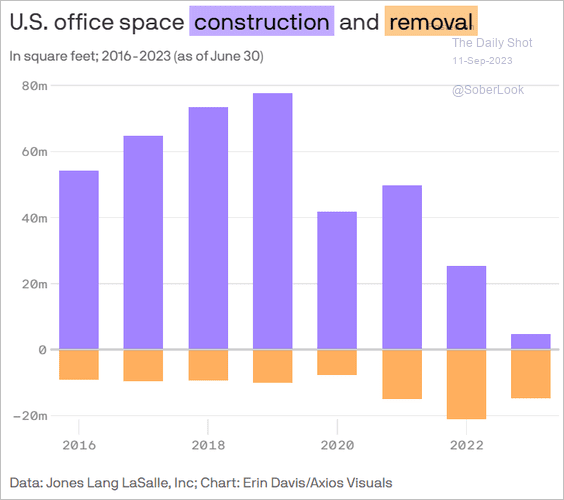 Source: @axios Read full article
3. Video game players and gaming revenue by region:
 Source: Statista
4. Aging population and inflation in the US:
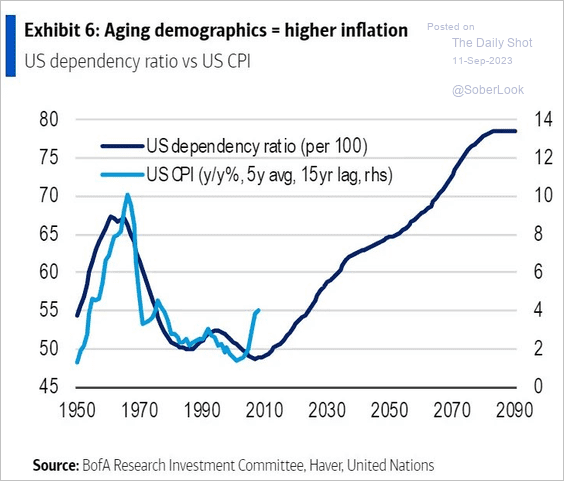 Source: BofA Global Research
5. US inflation vs. wages:
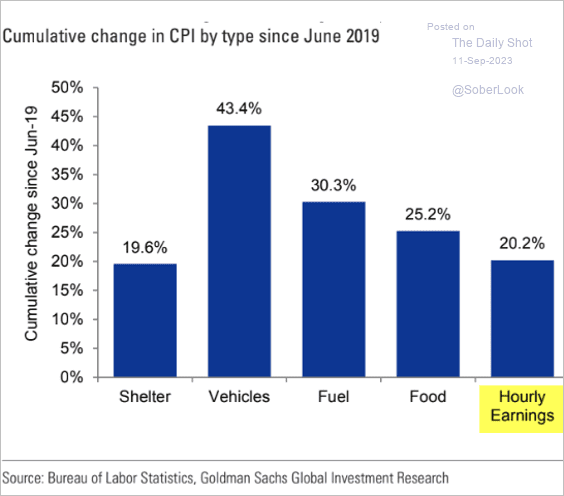 Source: Goldman Sachs
6. US student loan payments by type:
 Source: Truist Advisory Services
7. Marijuana usage:
 Source: Gallup Read full article
8. US food imports:
 Source: Visual Capitalist Read full article
——————–
Back to Index