The Daily Shot: 21-Sep-23
• The United States
• The United Kingdom
• Europe
• Asia-Pacific
• China
• Emerging Markets
• Commodities
• Energy
• Equities
• Credit
• Global Developments
• Food for Thought
The United States
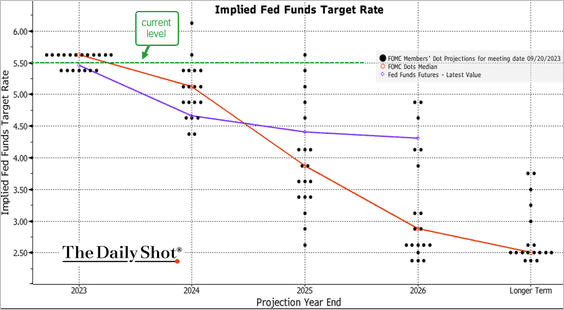
1. As expected, the FOMC left rates unchanged but signaled another rate increase this year.
 Source: @TheTerminal, Bloomberg Finance L.P.
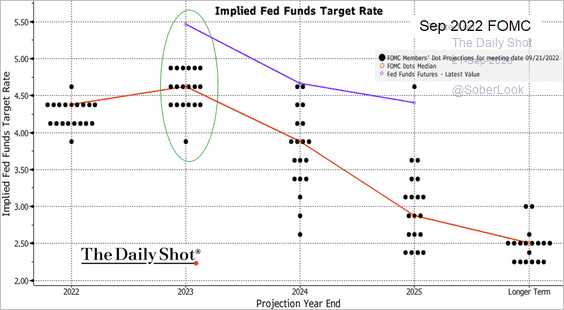
Here is a look at the dot plot from September 2022. The market was much closer to this year’s outcome than the FOMC’s projections.
 Source: @TheTerminal, Bloomberg Finance L.P.
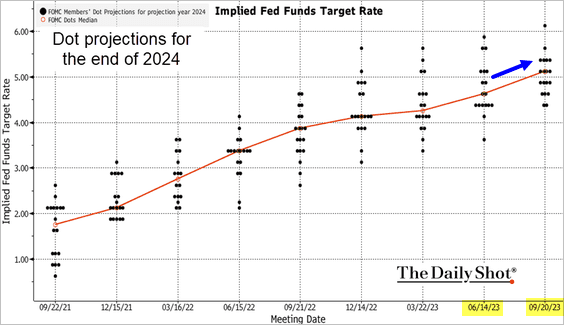
The latest dot plot for the end of next year is 50 bps higher than the June projections. The Fed expects rates to stay higher for longer.
 Source: @TheTerminal, Bloomberg Finance L.P.
 Source: @economics Read full article
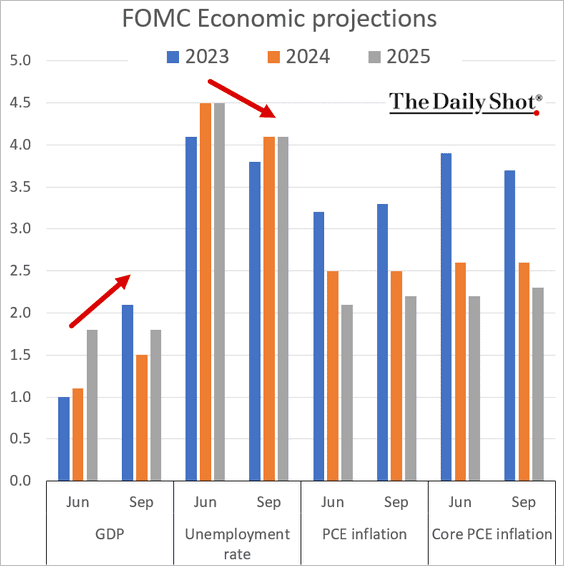
• The Fed’s protections for growth and employment were more upbeat.
——————–
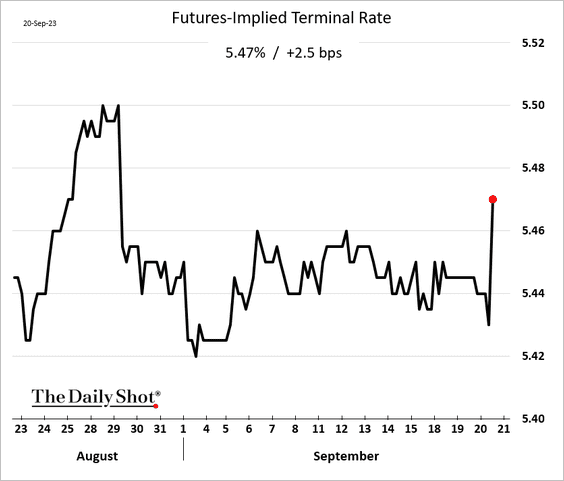
2. The futures-implied terminal rate rose modestly.
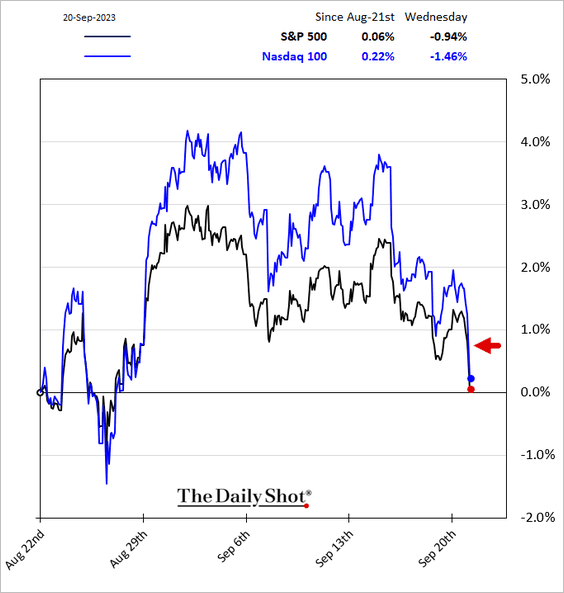
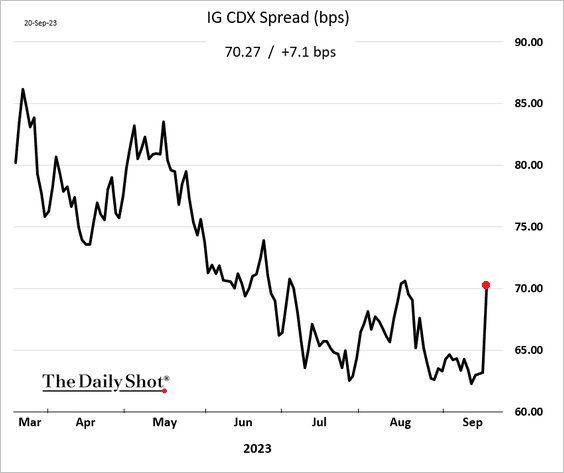
The markets focused on the hawkish “higher for longer” message.
– Equities:
 Source: Reuters Read full article
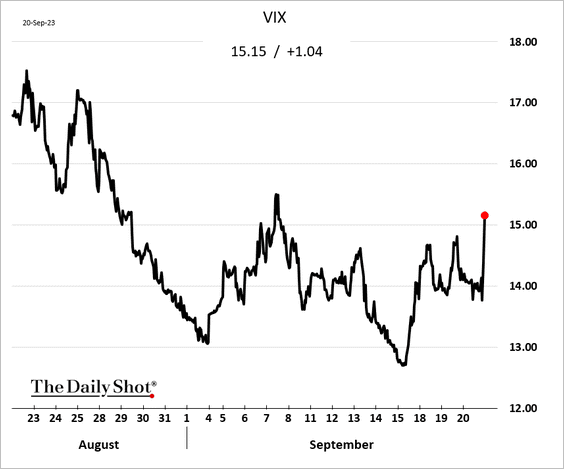
– Credit spreads:
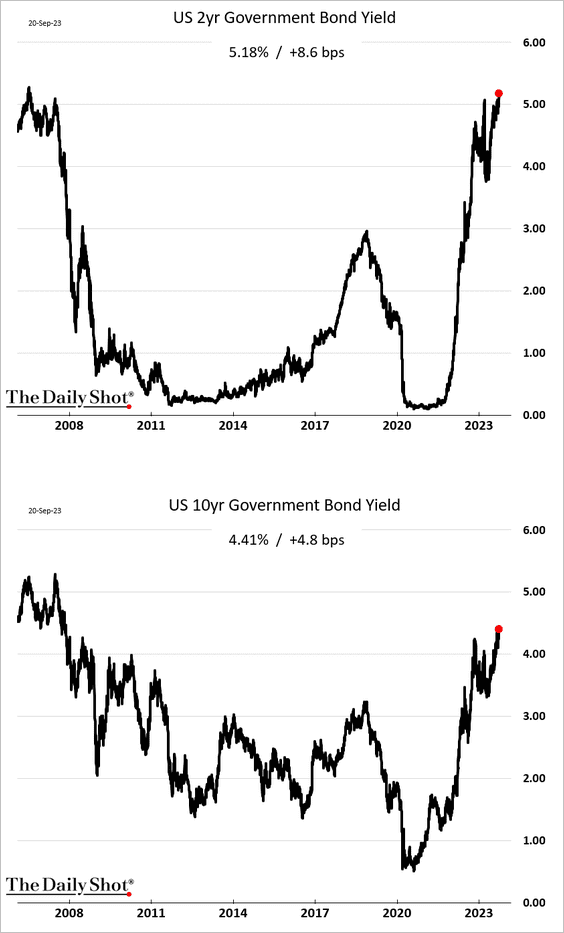
• The 2-year Treasury yield hit the highest level since 2006.
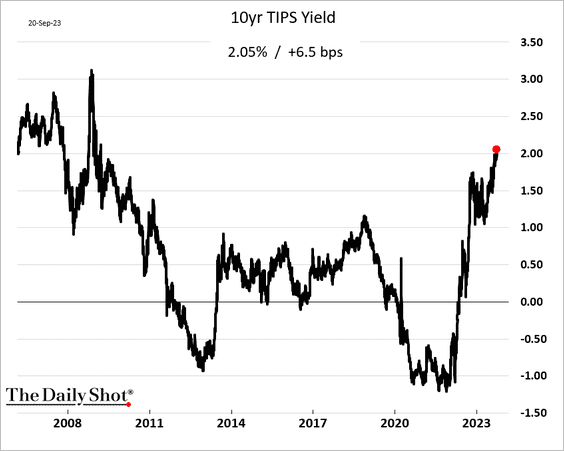
Real yields also climbed, which could pressure growth stocks.
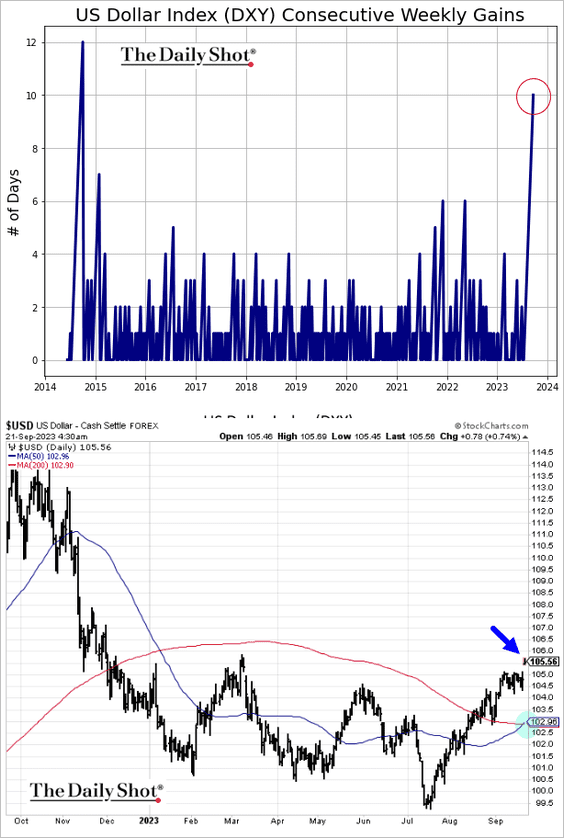
• The US dollar jumped, with the DXY index on track for a tenth weekly gain.
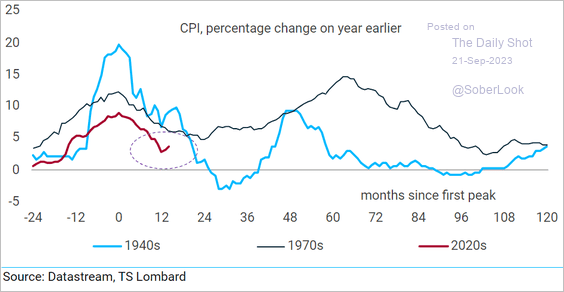
3. The Fed will keep policy in restrictive territory for longer amid worries about inflation reaccelerating.
 Source: TS Lombard
Online search activity shows that inflation remains a concern for households.
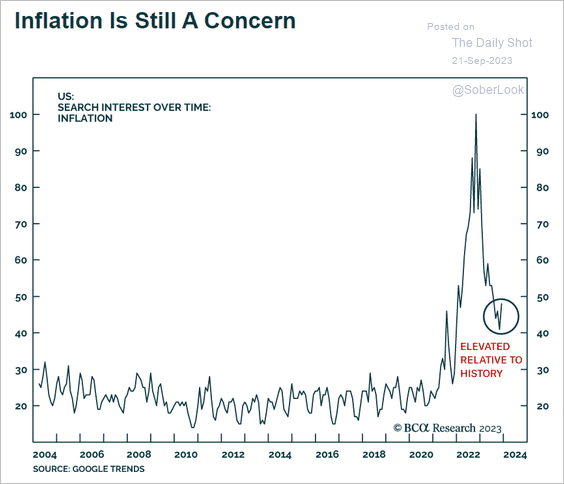 Source: BCA Research
——————–
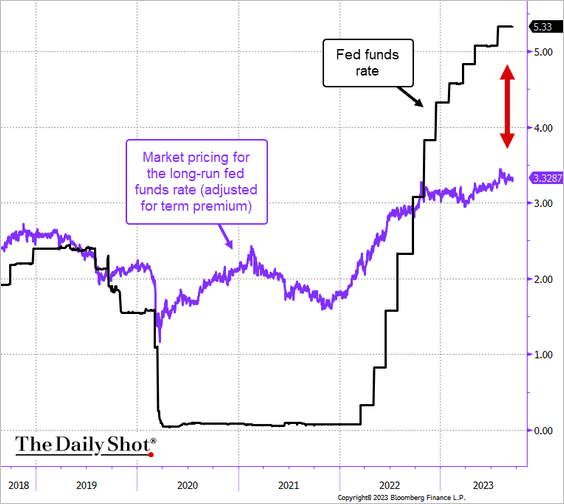
4. Based on market expectations of the longer-run fed funds rate, the Fed’s policy is quite restrictive.
According to Oxford Economics, the maximum impact of the Fed’s tightening will be felt over the next couple of quarters.
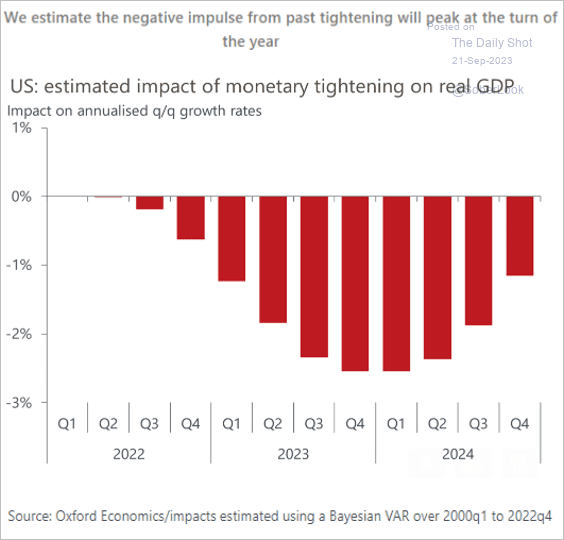 Source: Oxford Economics
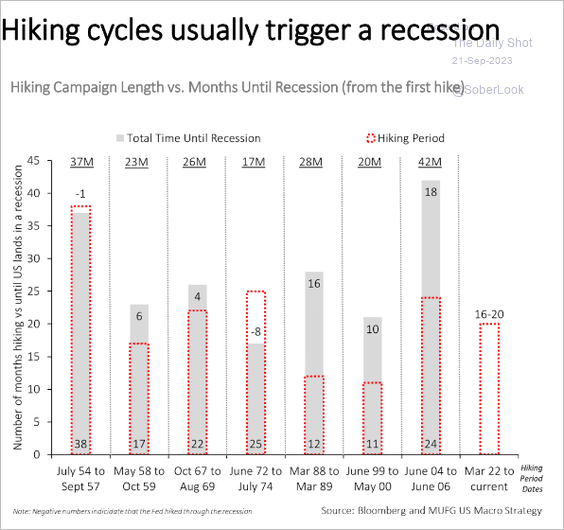
As a result, we may see a modest recession, …
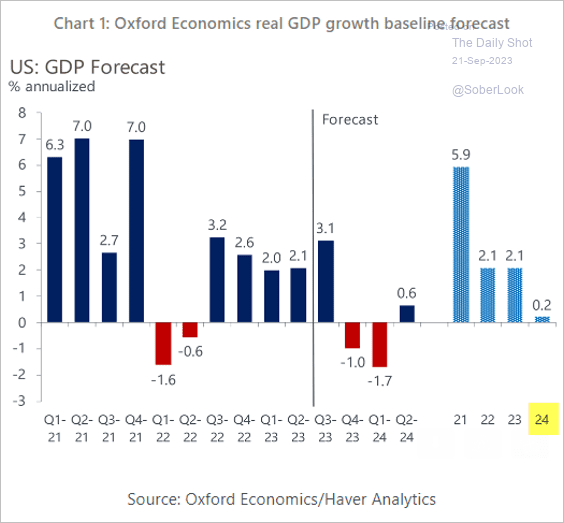 Source: Oxford Economics
… as typically happens after tightening cycles.
 Source: MUFG Securities
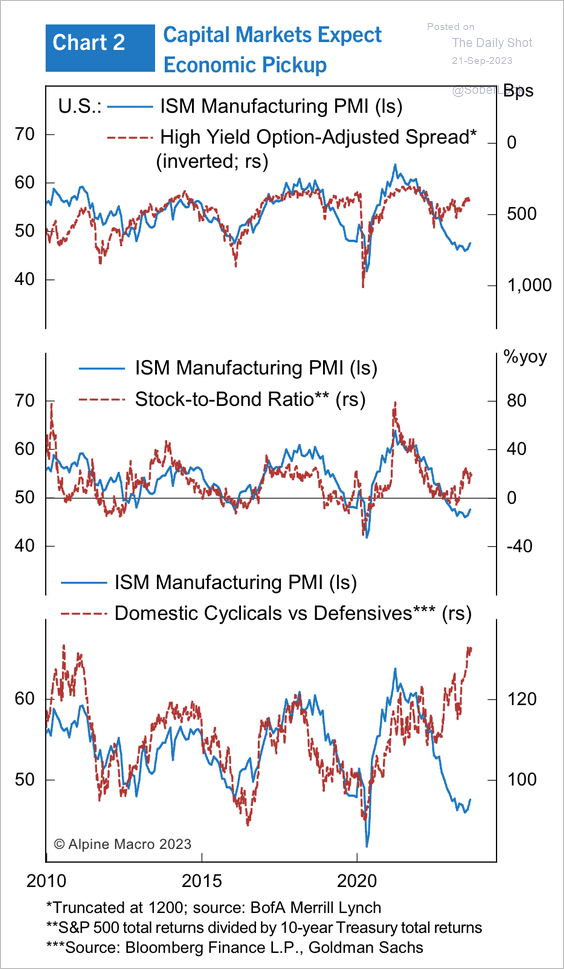
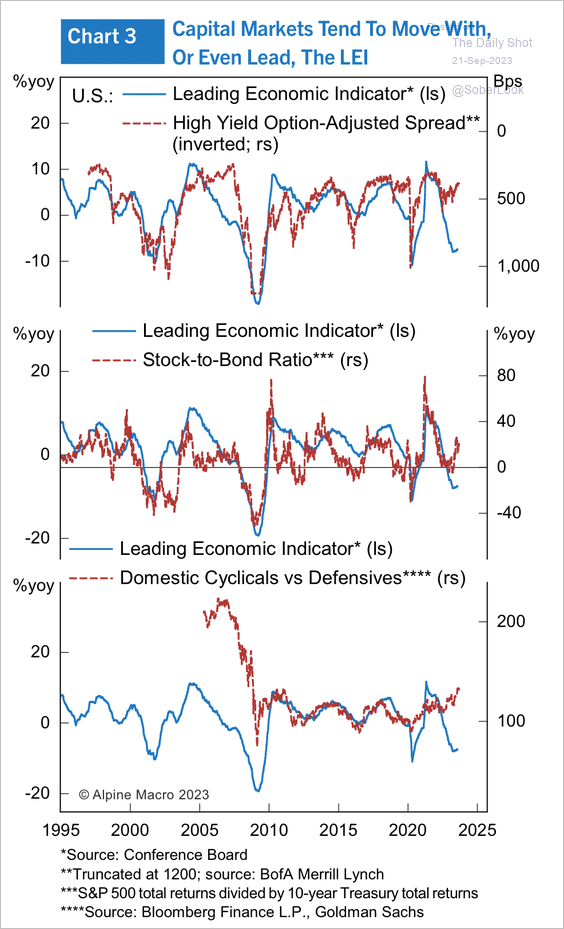
• However, markets have been pricing in economic strength (2 charts). Are investors in for a disappointment?
 Source: Alpine Macro
 Source: Alpine Macro
——————–
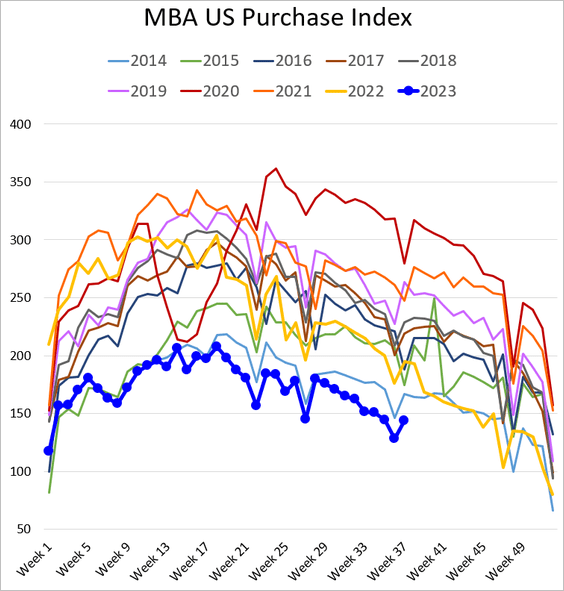
5. Mortgage activity remains depressed, …
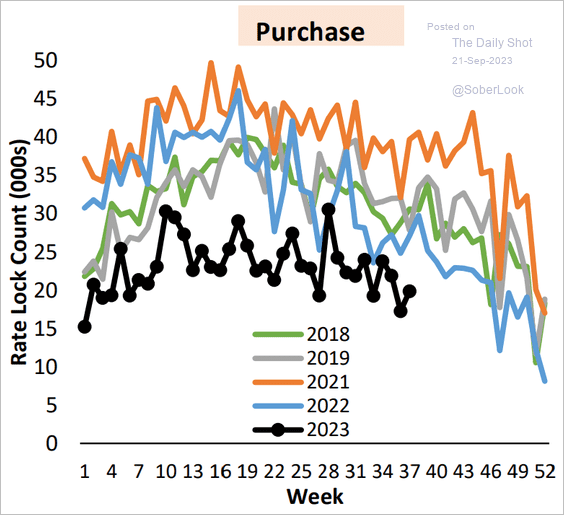 Source: AEI Housing Center
… which poses risks for single-family construction.
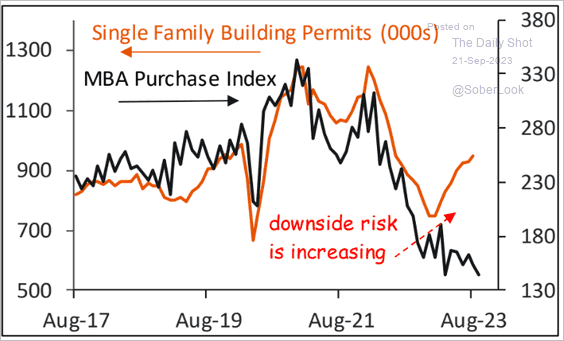 Source: Piper Sandler
With rents moderating, multifamily construction could weaken further as well.
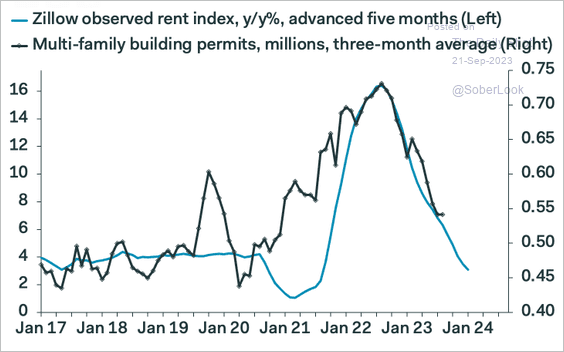 Source: Pantheon Macroeconomics
Back to Index
The United Kingdom
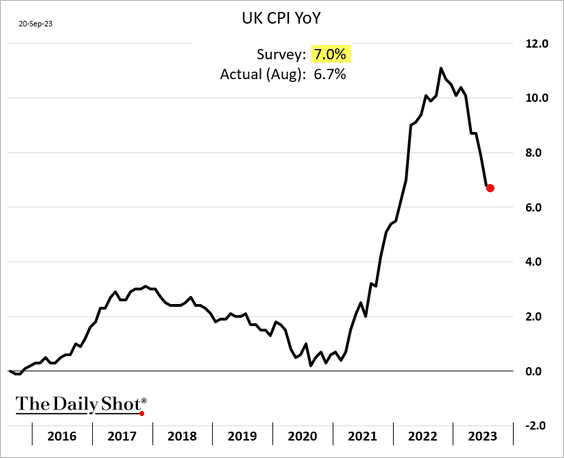
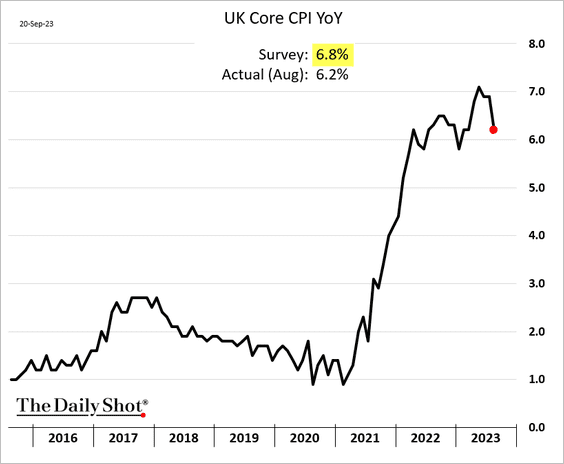
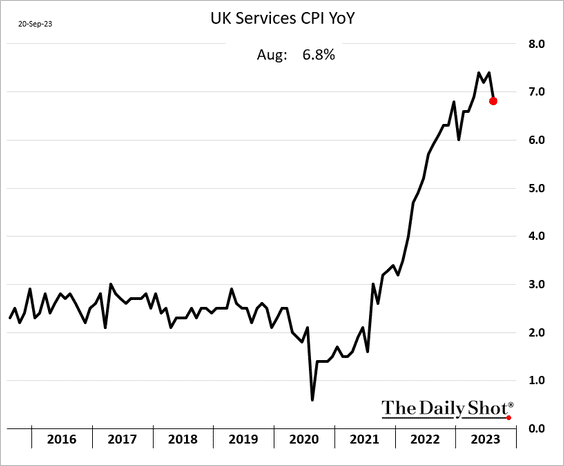
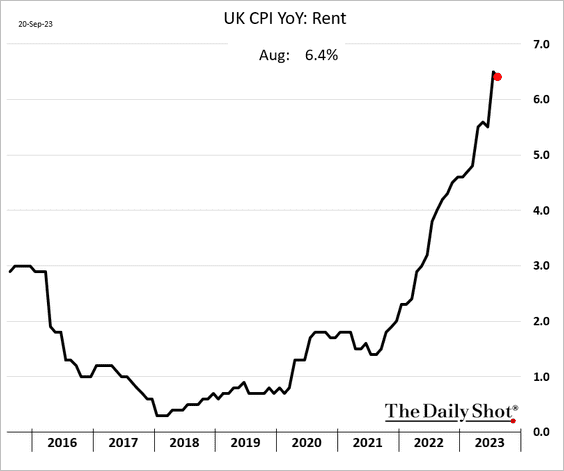
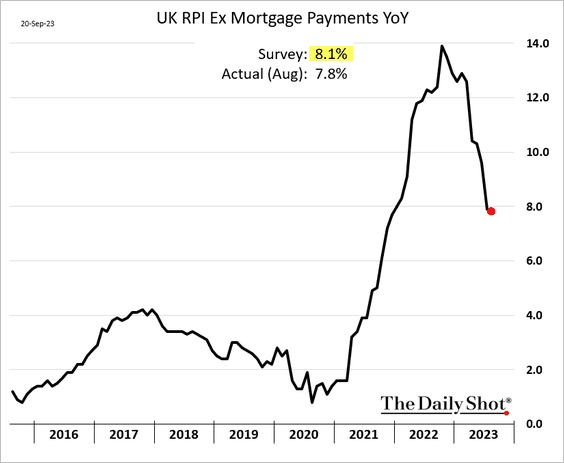
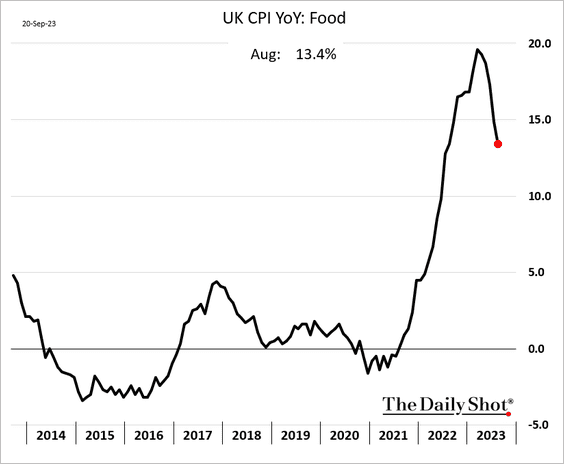
1. The UK saw a welcome reprieve from inflation pressures as the CPI figures came in below projections.
– Headline CPI:
– Core CPI:
– Services:
– Rent (finally peaking?):
– Retail prices:
– Food inflation:
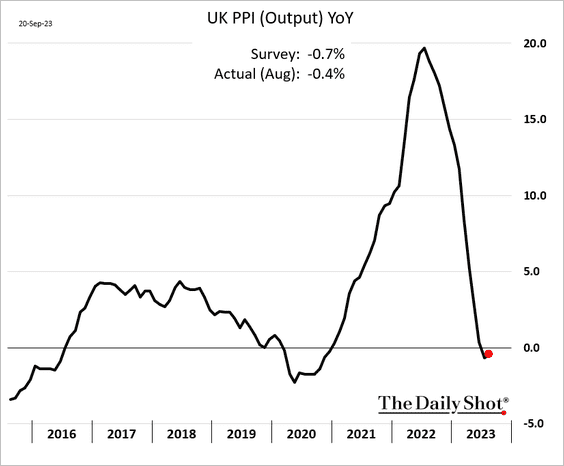
• The PPI was higher than expected.
——————–
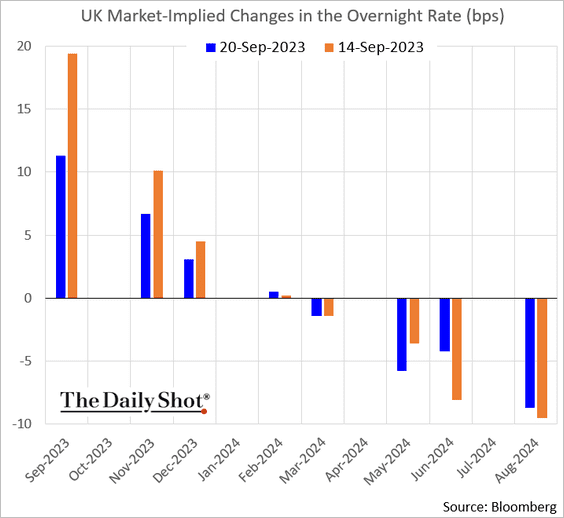
2. The probability of a rate hike today dipped below 50%.
 Source: @economics Read full article
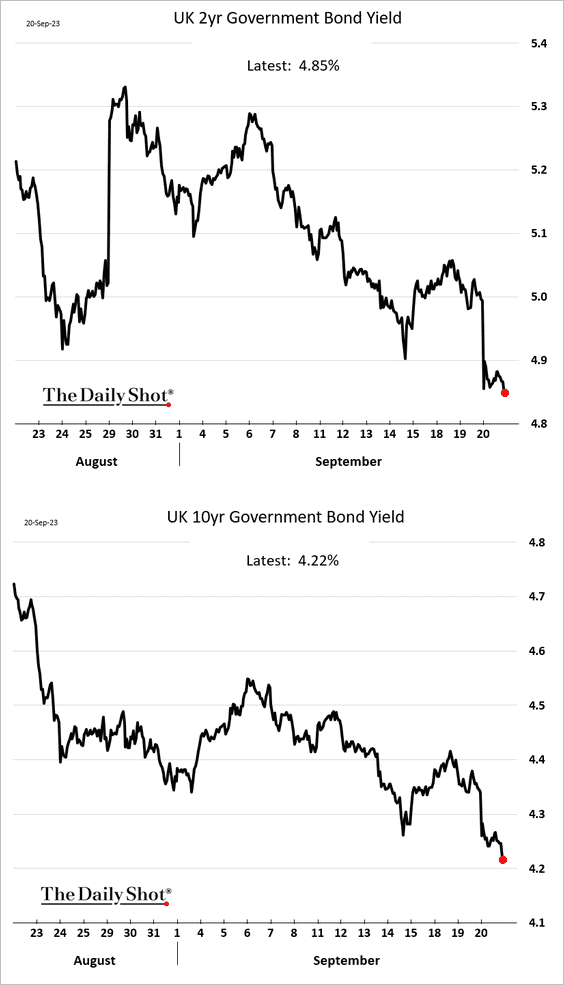
• Gilt yields dropped.
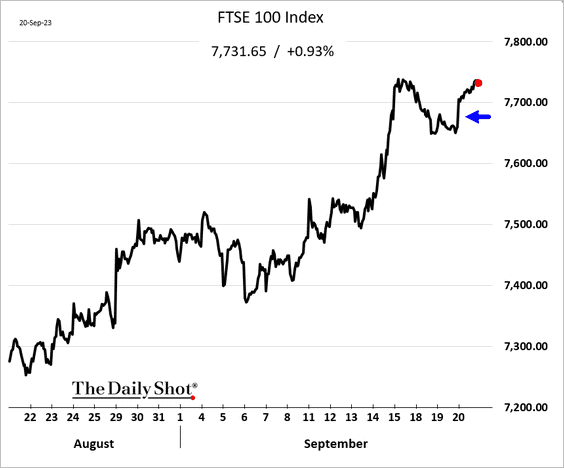
• The stock market climbed.
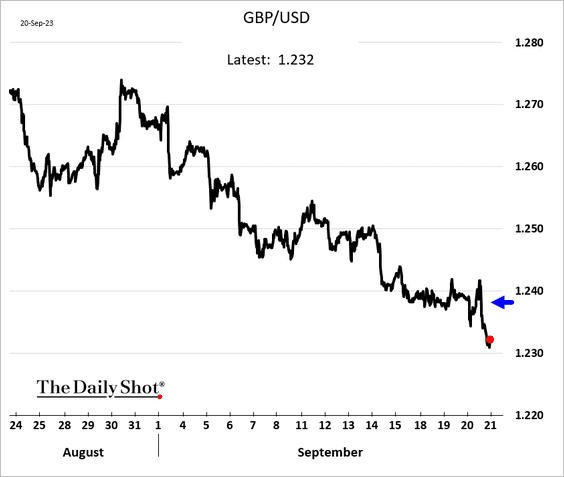
• The pound was down, …
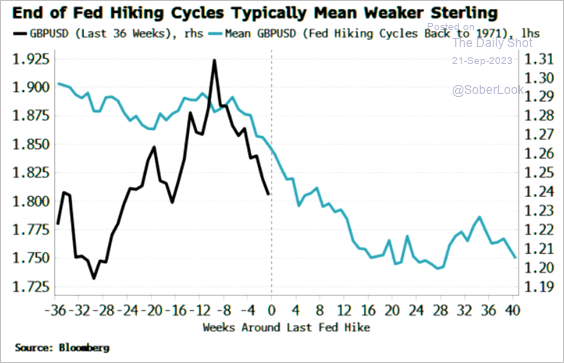
… with more weakness expected ahead.
 Source: Simon White, Bloomberg Markets Live Blog
Back to Index
Europe
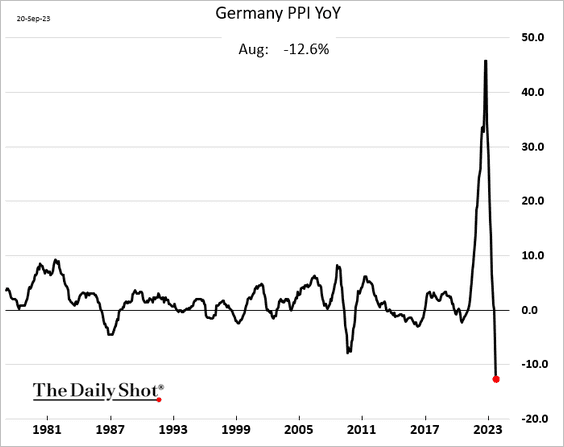
1. Germany’s producer prices saw the biggest yearly decline on record in August.
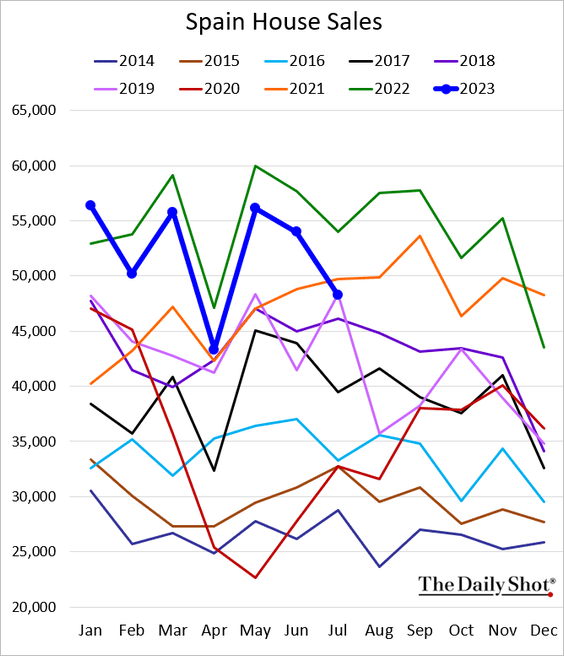
2. Spain’s house sales softened in July.
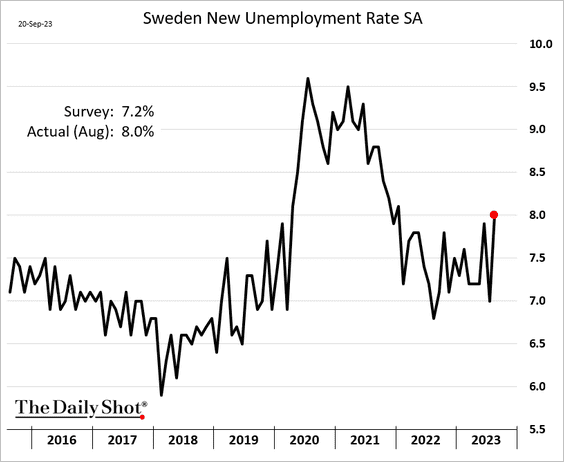
3. Sweden’s unemployment increased last month.
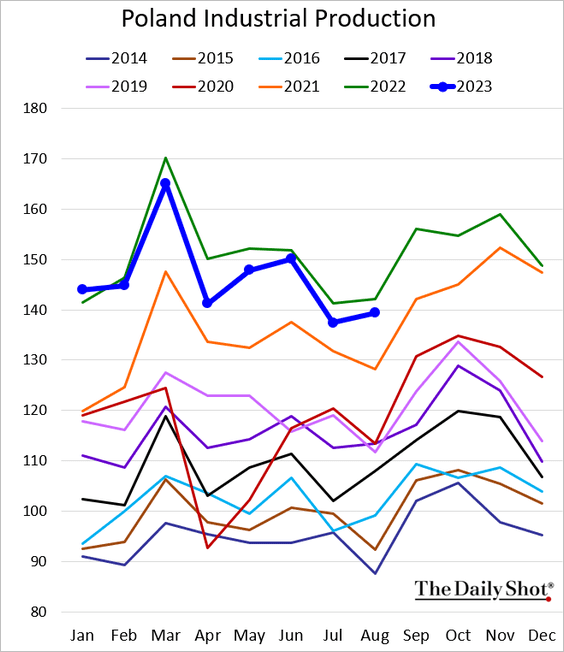
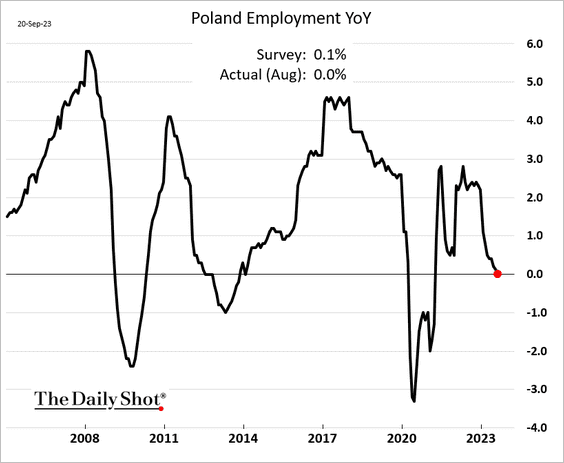
4. Next, we have some updates on Poland.
• Industrial production is holding up but remains below last year’s levels.
• Employment growth has stalled.
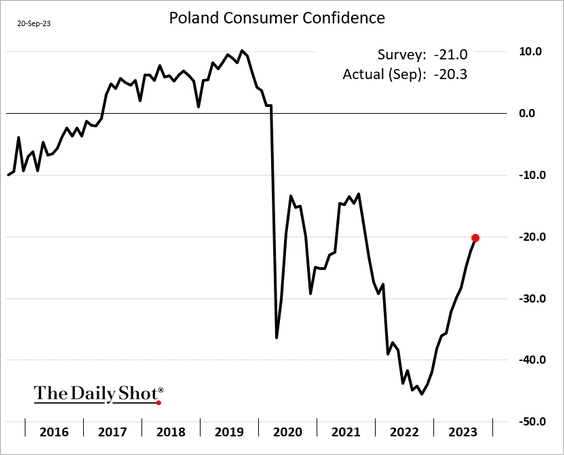
• Consumer confidence is rebounding.
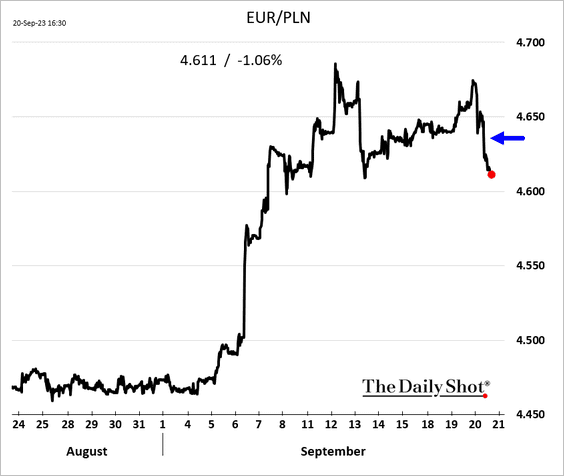
• The central bank expressed concerns about zloty’s weakness, sending the currency higher against the euro.
 Source: @markets Read full article
——————–
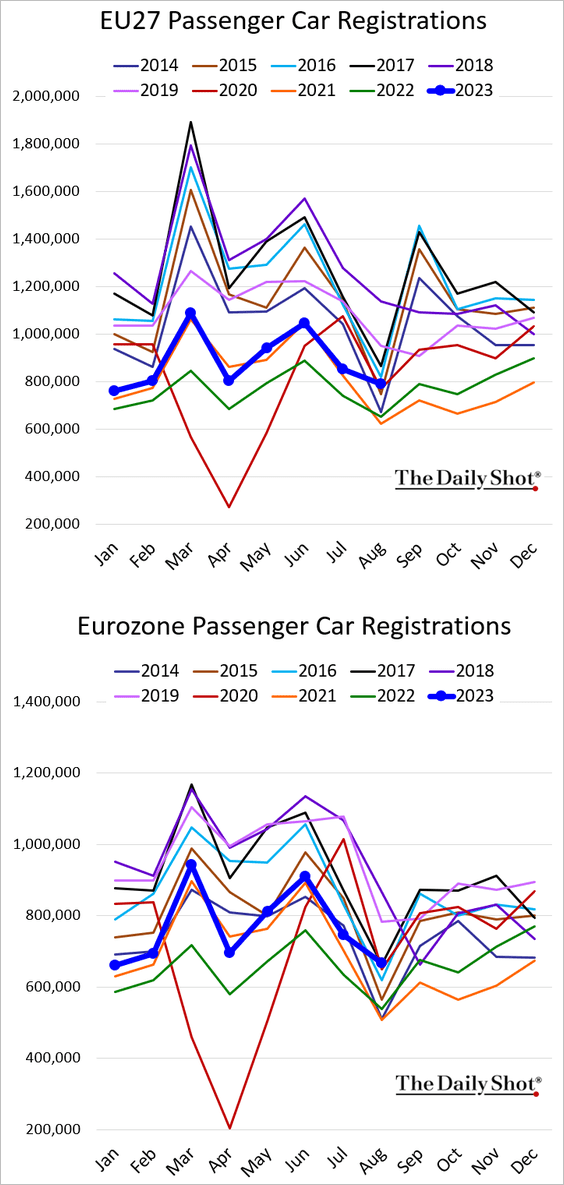
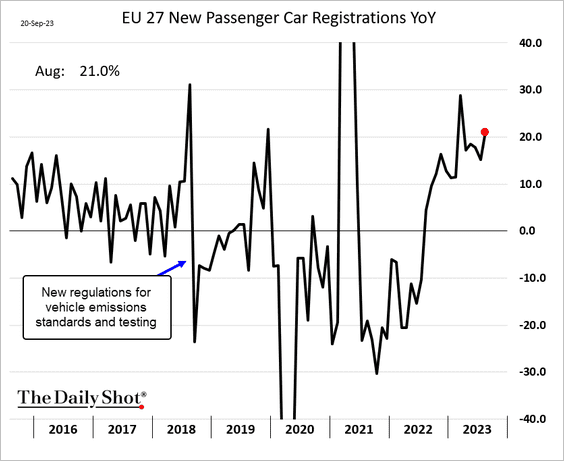
5. New car registrations in the EU held up well in August, running 21% above last year’s levels.
Back to Index
Asia-Pacific
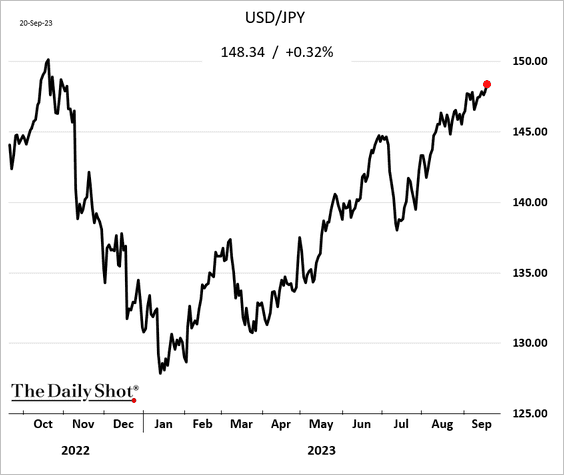
1. Dollar-yen is grinding toward 150.
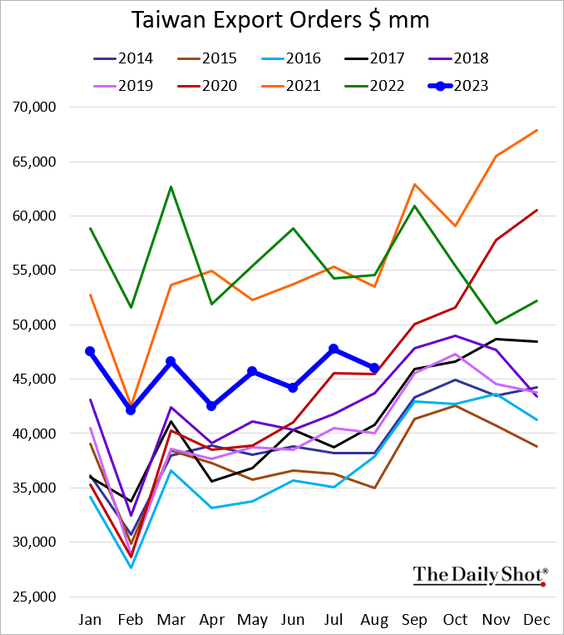
2. Taiwan’s export orders were relatively soft last month.
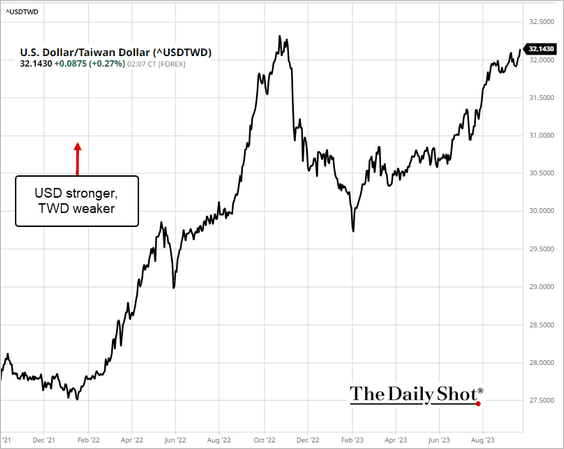
The Taiwan dollar continues to slump, with today’s weakness driven by the hawkish Fed.
 Source: barchart.com
——————–
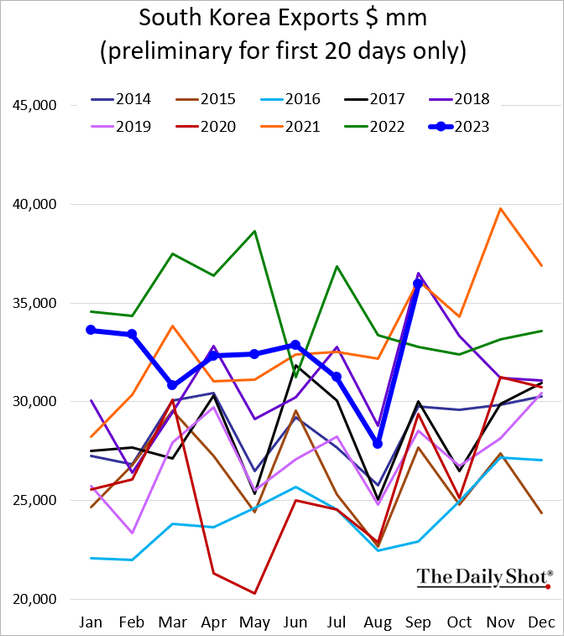
3. South Korean exports were robust this month.
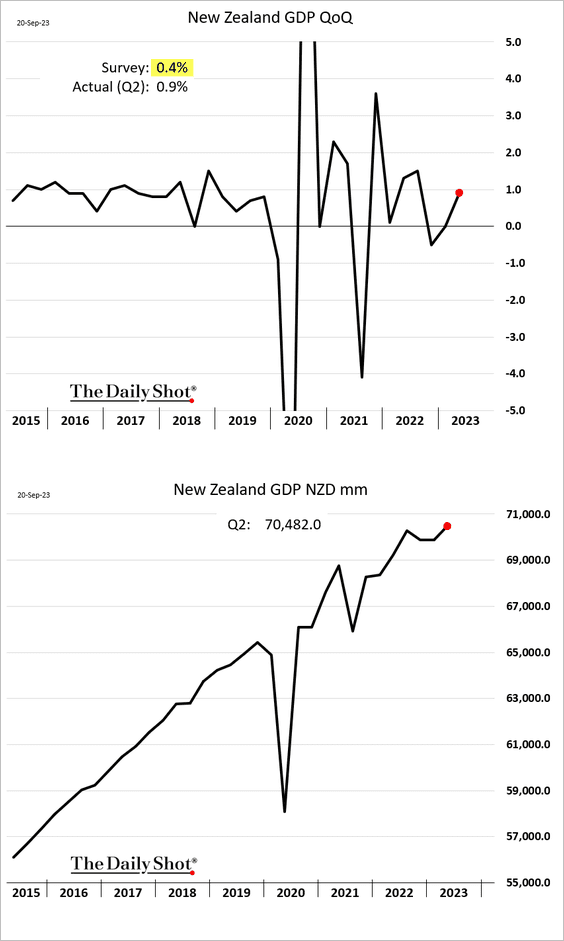
4. New Zealand’s Q2 GDP growth topped expectations.
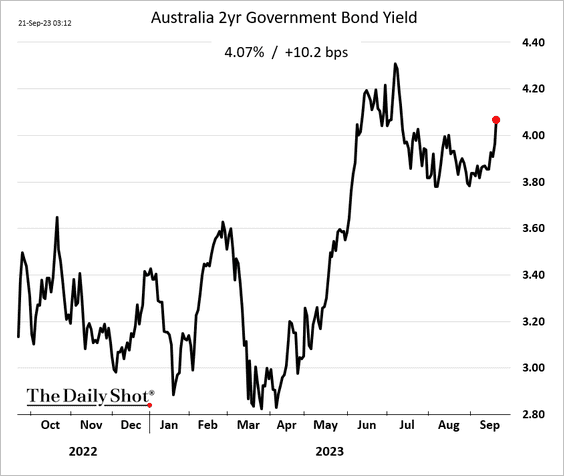
5. Australia’s 2-year yield is back above 4%.
Back to Index
China
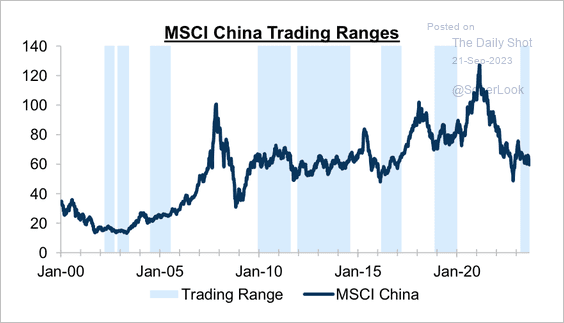
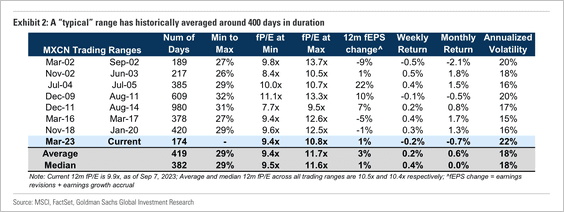
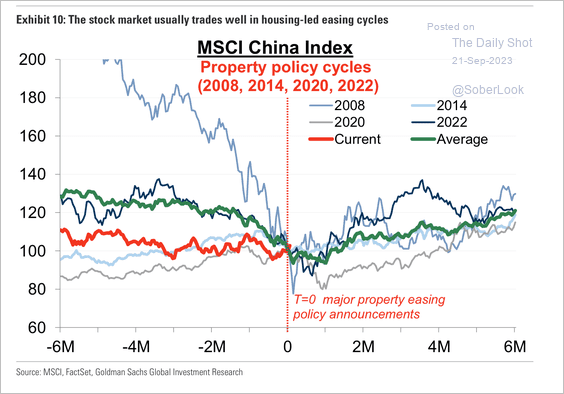
1. The MSCI China Index has been in a trading range roughly 40% of the time since 2000. (2 charts)
 Source: Goldman Sachs
 Source: Goldman Sachs
Market recoveries typically occur alongside improvements in the property sector.
 Source: Goldman Sachs
——————–
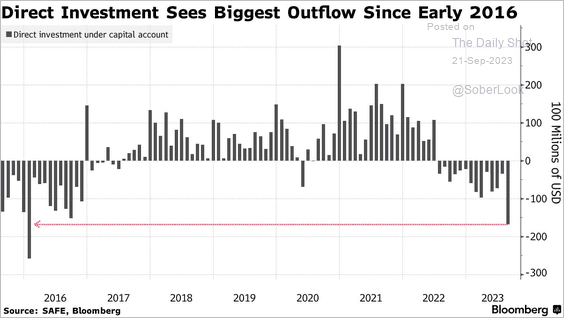
2. Direct investment outflows have been severe.
 Source: @markets Read full article
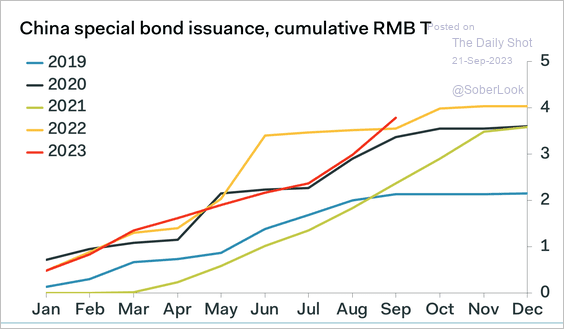
3. There was an uptick in special bond issuance over the past two months.
 Source: Pantheon Macroeconomics
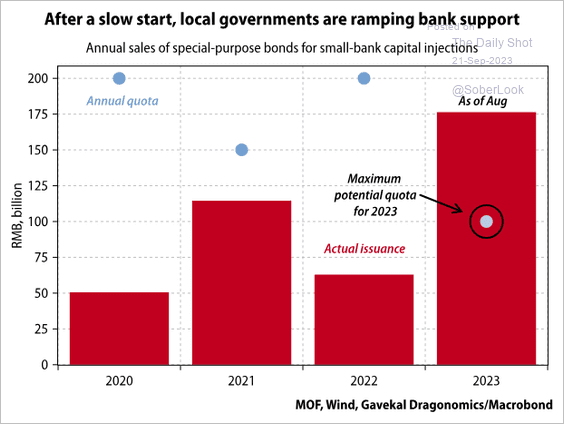
Local governments are using the proceeds to support struggling small banks (2 charts).
 Source: Gavekal Research
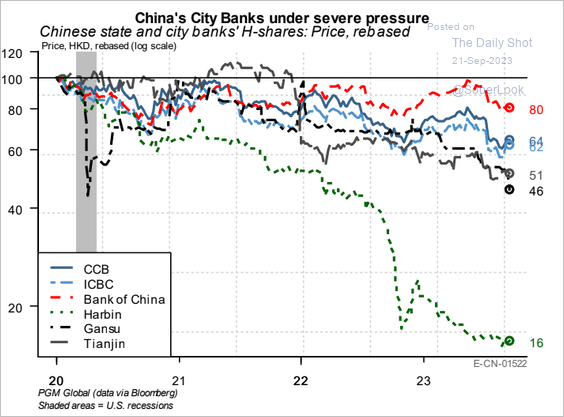 Source: PGM Global
• The rise in PBoC liquidity to support commercial banks has been limited relative to previous cycles.
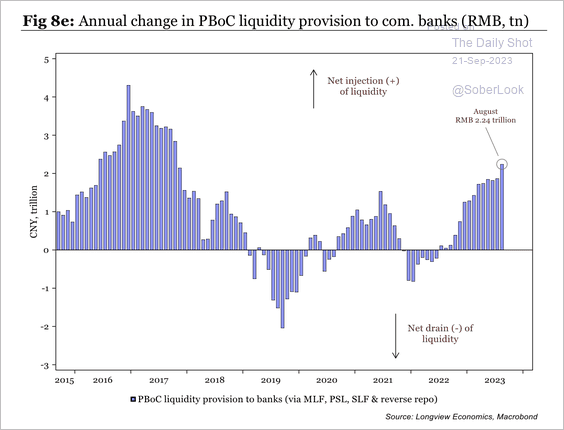 Source: Longview Economics
——————–
4. Real estate transactions have fallen sharply in recent years.
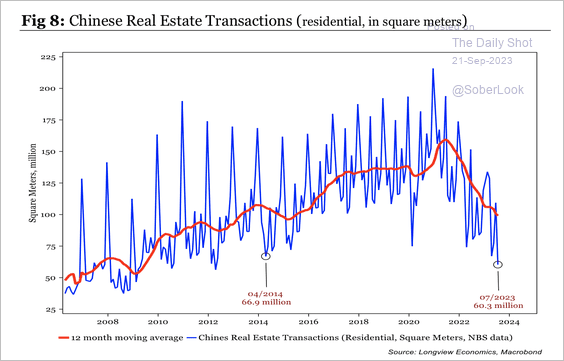 Source: Longview Economics
5. Households remain skittish about taking on more debt.
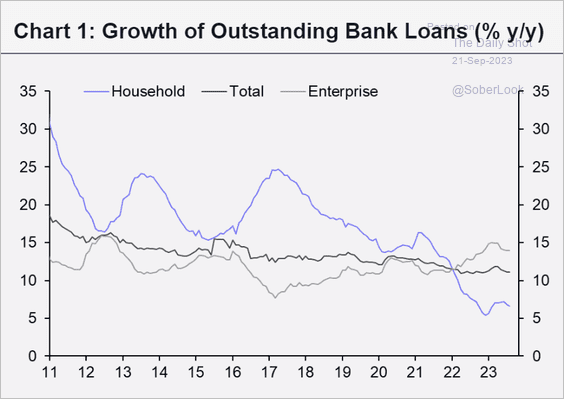 Source: Capital Economics
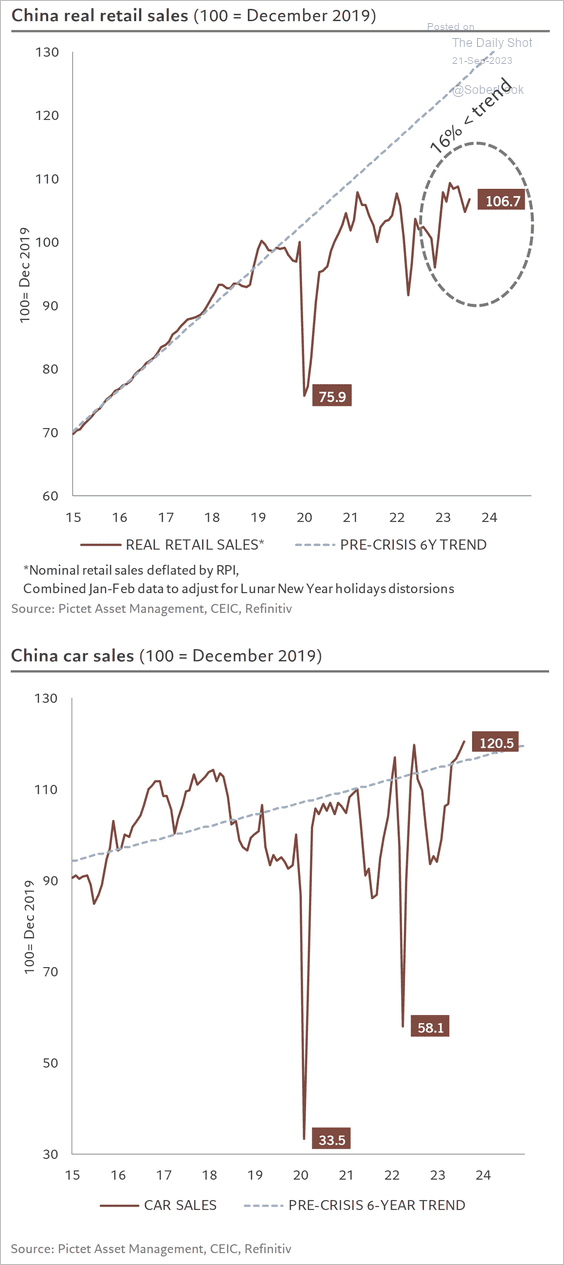
6. Despite soft retail trade, vehicle sales have been robust, …
 Source: @PkZweifel
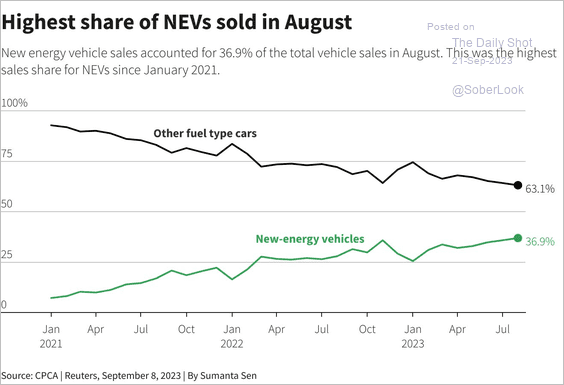
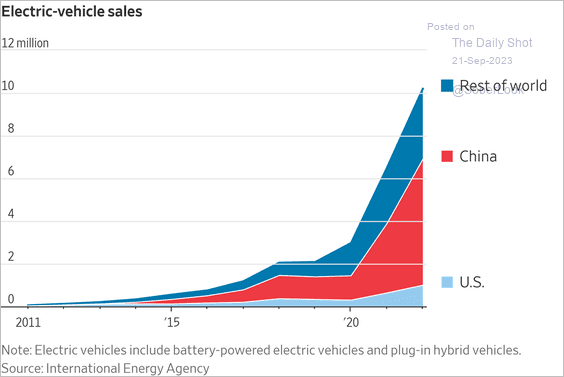
… increasingly dominated by EVs (2 charts).
 Source: @ReutersCommods, @ClydeCommods Read full article
 Source: @WSJ Read full article
Back to Index
Emerging Markets
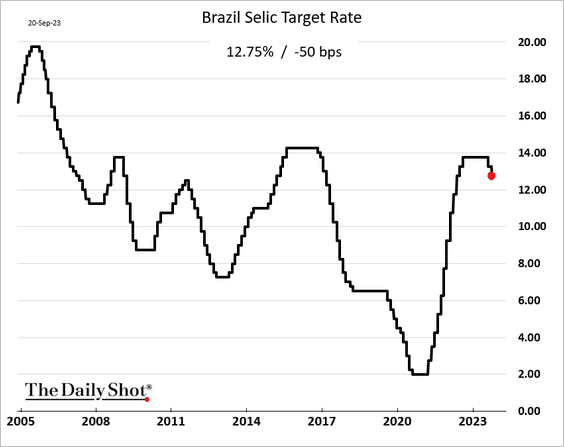
1. Brazil’s central bank cut the benchmark rate again.
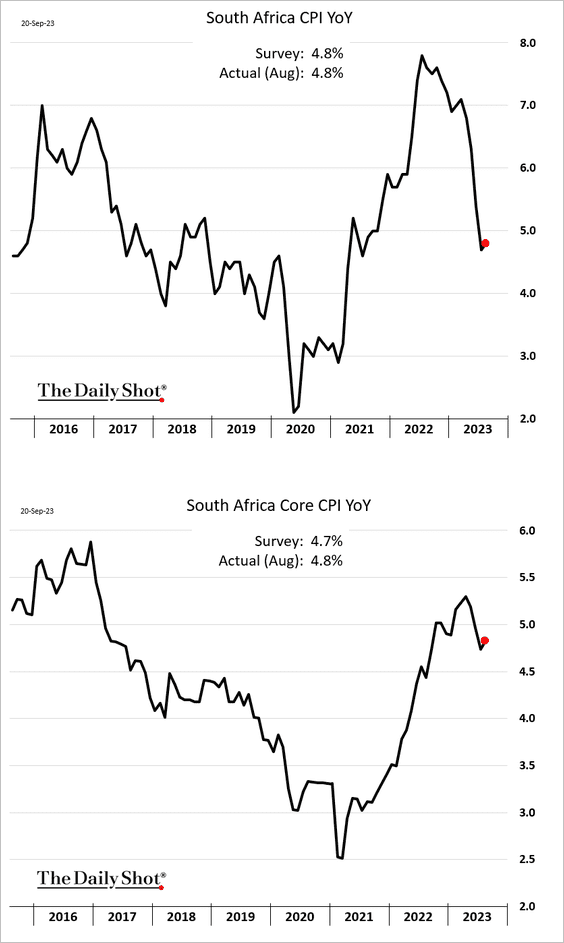
2. South Africa’s core inflation was stronger than expected.
 Source: @economics Read full article
——————–
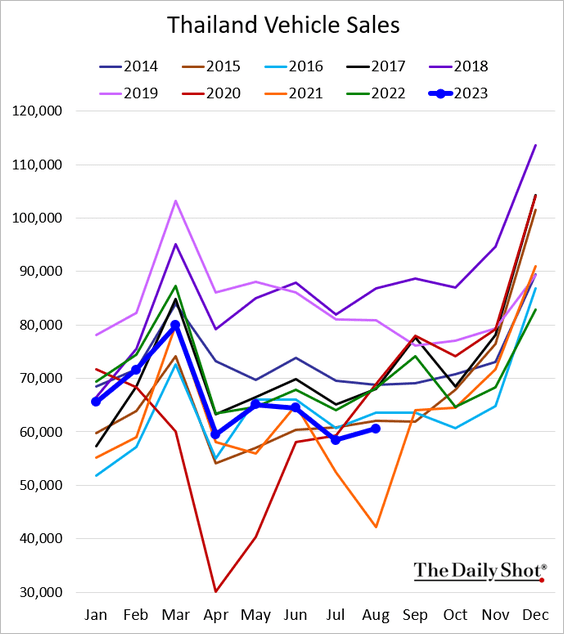
3. Thailand’s domestic vehicle sales slumped as tourism and other exports remain soft.
 Source: Reuters Read full article
——————–
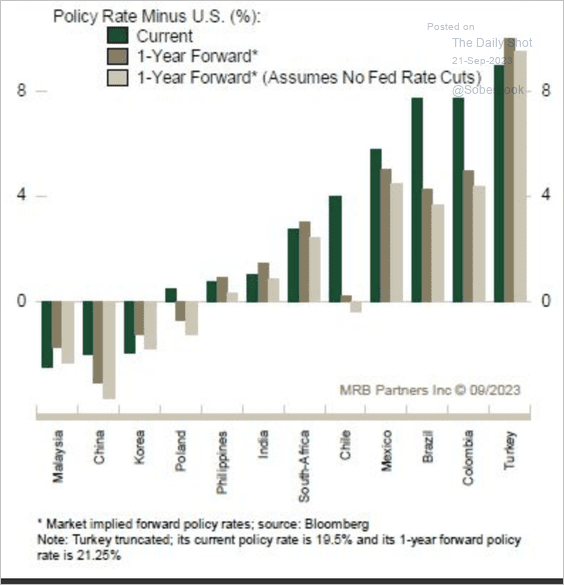
4. EM carry trades could remain attractive even after rate cuts.
 Source: MRB Partners
Back to Index
Commodities
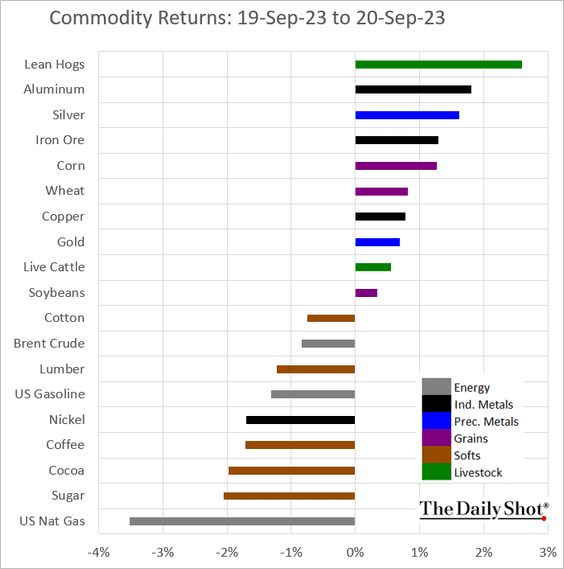
1. How did commodity prices respond to the hawkish message from the Fed?
2. Gold’s implied volatility remains near the lowest level since 2020.
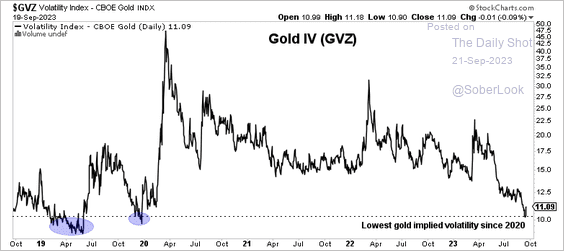 Source: Aazan Habib, Paradigm Capital
CTAs have turned bearish on gold.
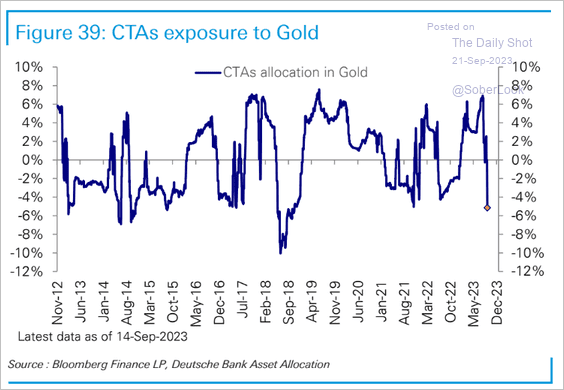 Source: Deutsche Bank Research
Back to Index
Energy
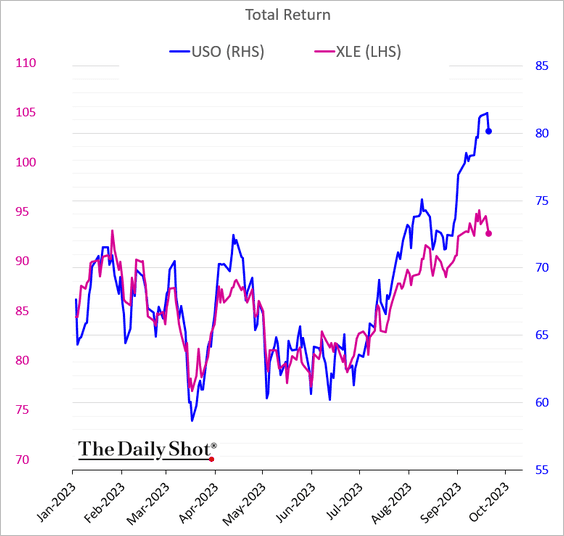
1. Energy shares (XLE) have been underperforming oil prices (USO).
2. The recent market deficit contributed to rising oil prices.
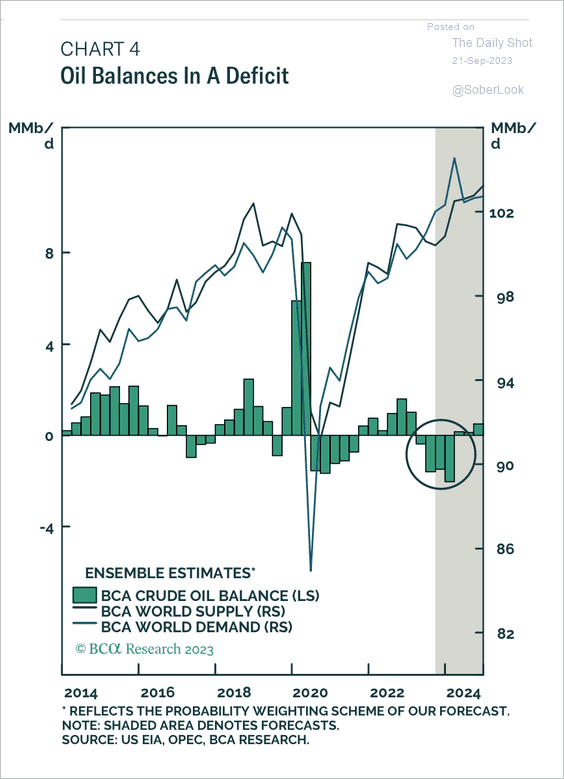 Source: BofA Global Research
Back to Index
Equities
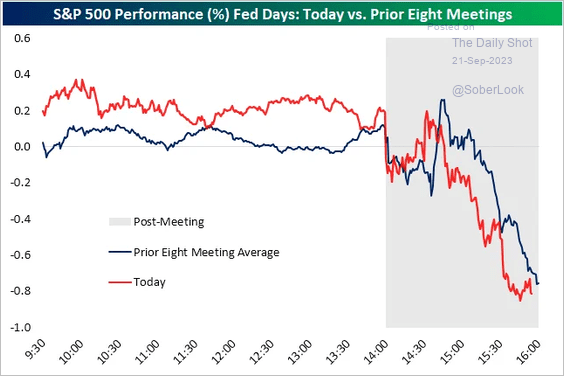
1. Yesterday’s price action closely tracked the average of previous FOMC days.
 Source: @bespokeinvest
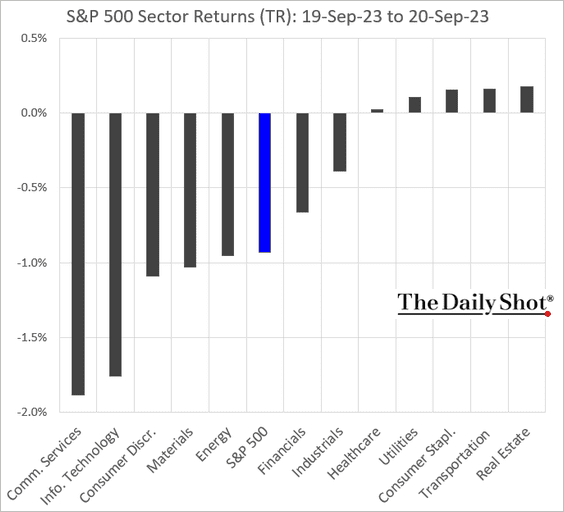
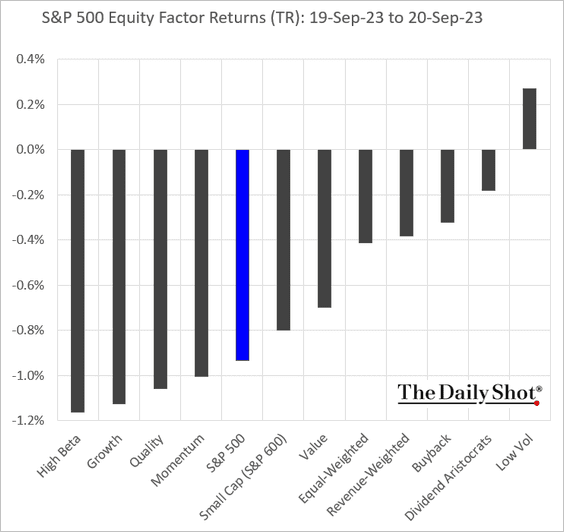
How did different sectors and equity factors react to the Fed’s hawkish message of “higher for longer”?
——————–
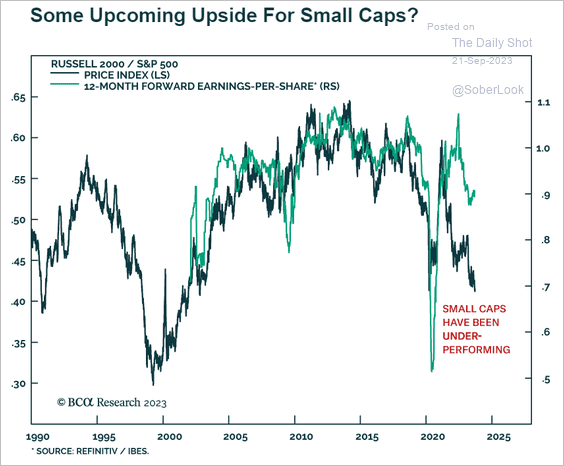
2. Are small caps oversold relative to the S&P 500?
 Source: BCA Research
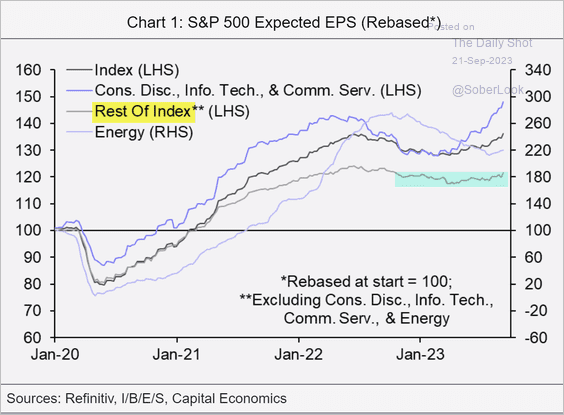
3. Excluding consumer discretionary, tech, and energy sectors, earnings expectations have been relatively flat.
 Source: Capital Economics
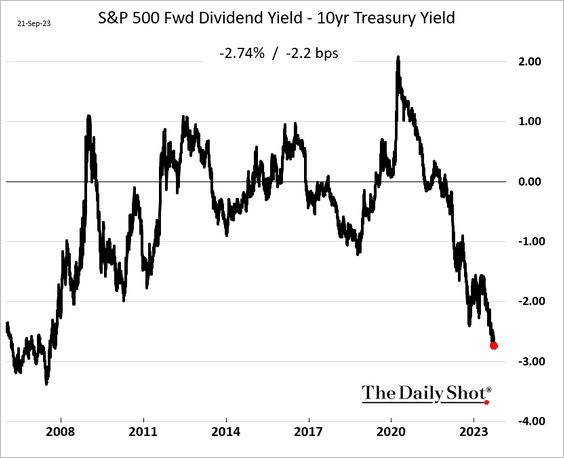
4. The S&P 500 expected dividend yield is at multi-year lows relative to the 10-year Treasury yield.
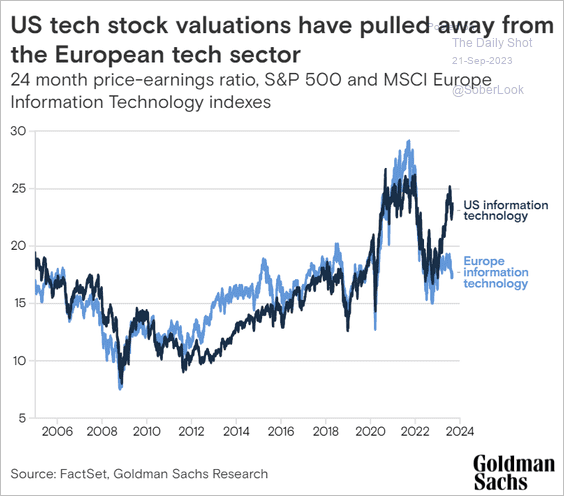
5. Here is a look at US vs. European tech valuations.
 Source: Goldman Sachs
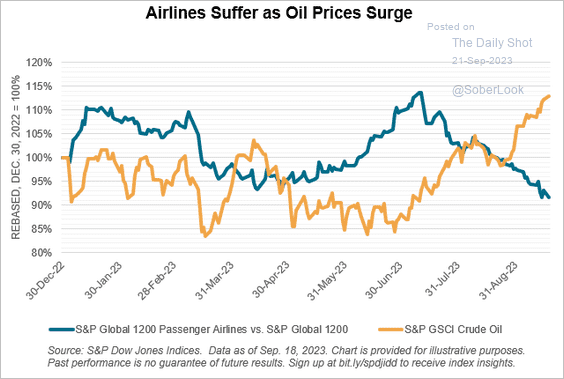
6. The rally in oil has been pressuring airline stocks.
 Source: S&P Dow Jones Indices
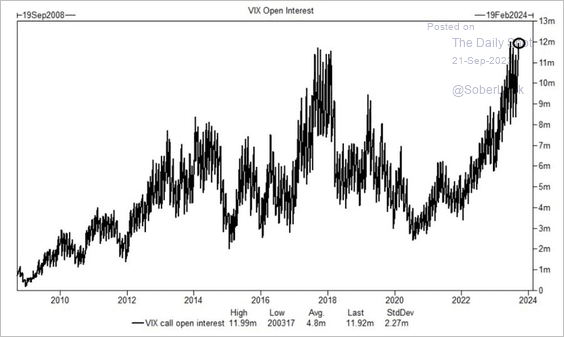
7. Open interest in VIX call options, which are wagers on increased volatility, is near all-time highs.
 Source: Goldman Sachs; @dailychartbook
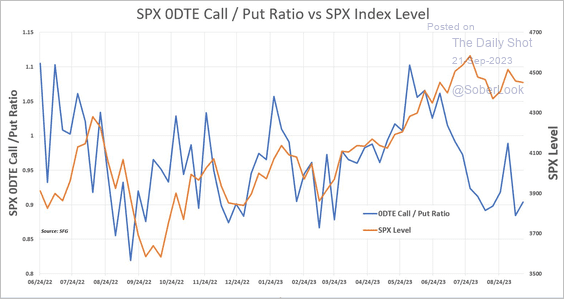
• Activity in overnight options shows a bearish sentiment.
 Source: Chris Murphy, Susquehanna International Group
Back to Index
Credit
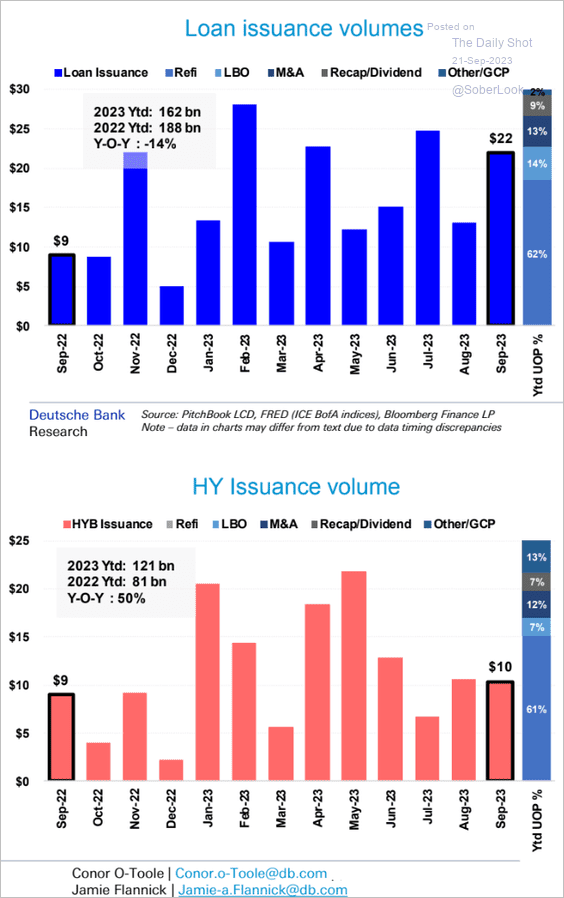
1. Here is a look at leveraged loan and high-yield bond issuance volumes, as well as the use of proceeds.
 Source: Deutsche Bank Research
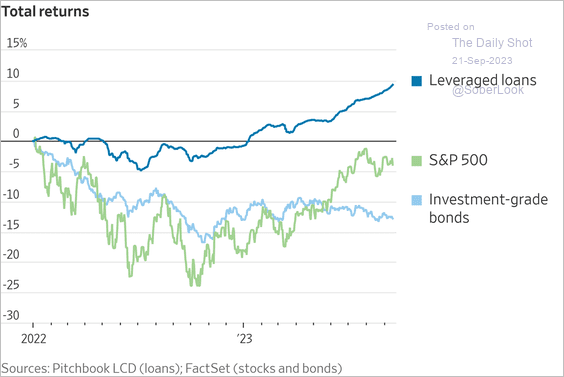
2. Leveraged loans have been outperforming.
 Source: @WSJ Read full article
3. With limited issuance of leveraged loans in Europe, European CLOs are loading up on corporate bonds.
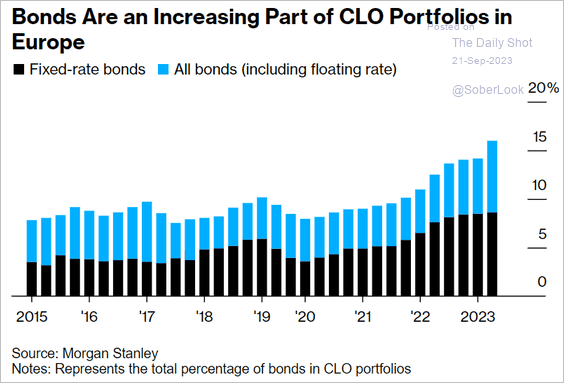 Source: @markets Read full article
Back to Index
Global Developments
1. Recessions have generally been rarer through time, especially since 1982.
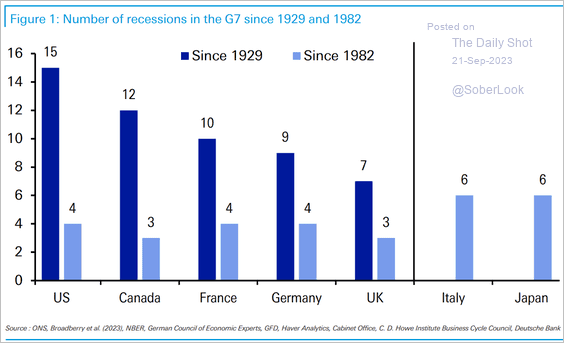 Source: Deutsche Bank Research
2. Policy rates in many economies are currently higher than longer-dated sovereign bond yields.
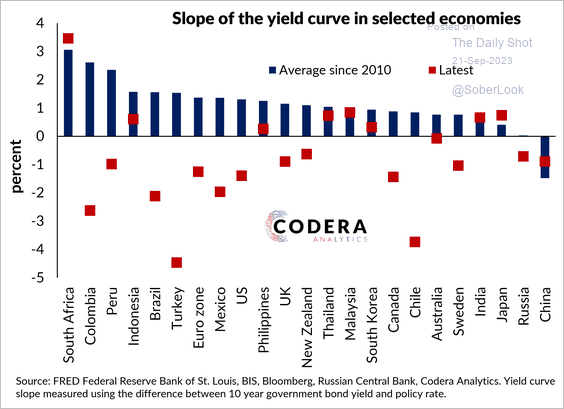 Source: Codera Analytics Read full article
3. The free float of G4 debt is recovering as central banks roll back their prolonged quantitative easing policies.
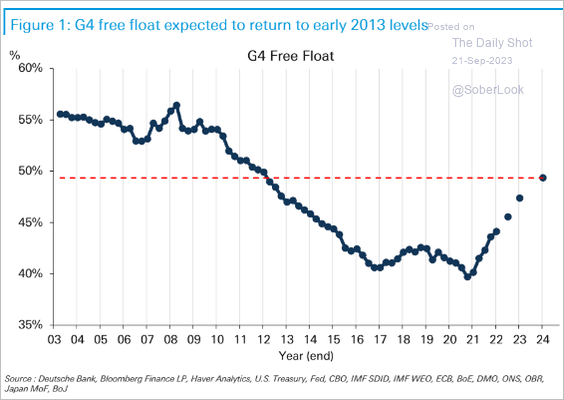 Source: Deutsche Bank Research
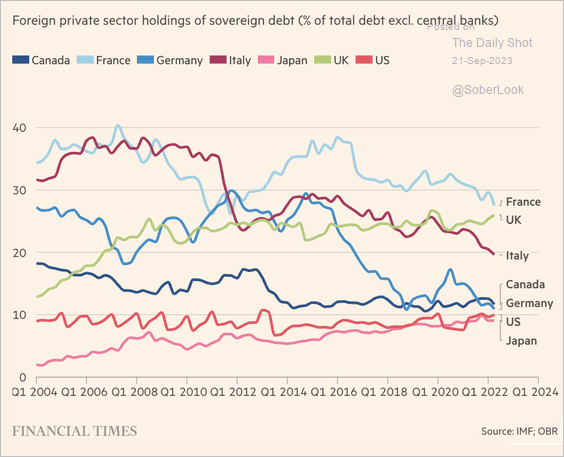
4. This chart shows foreign private-sector holdings of sovereign debt.
 Source: @financialtimes Read full article
——————–
Food for Thought
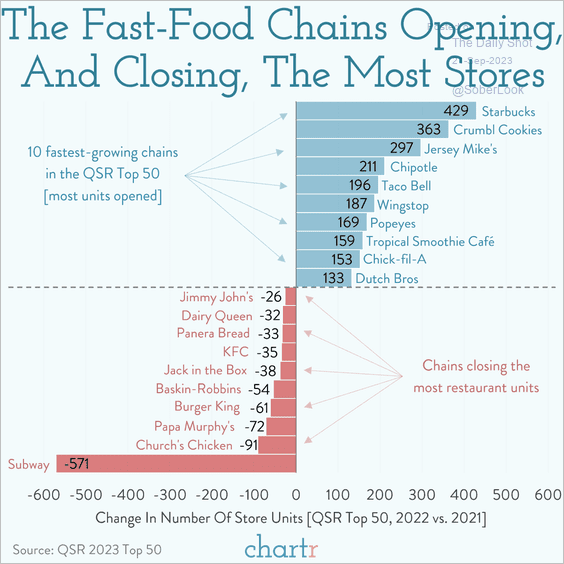
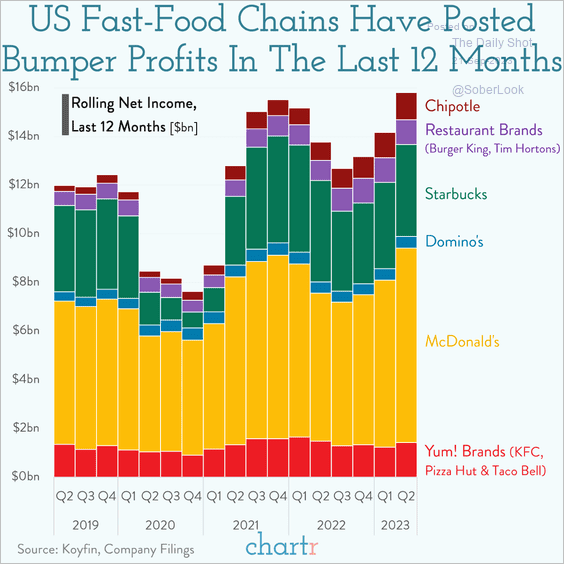
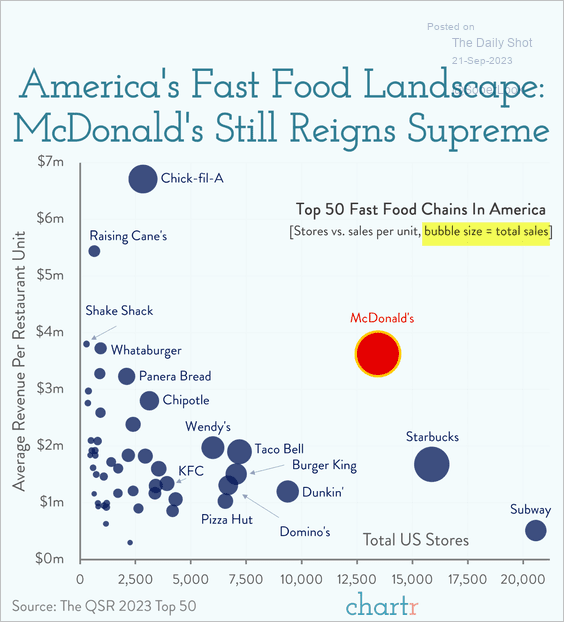
1. Let’s start with a look at fast-food chains.
• Opening and closing stores:
 Source: @chartrdaily
• Profits:
 Source: @chartrdaily
• Revenues per store and total US stores:
 Source: @chartrdaily
——————–
2. Data center revenues:
 Source: Visual Capitalist Read full article
3. Gaming revenues:
 Source: Statista
4. Growth in beauty product sales:
 Source: McKinsey & Company Read full article
• Spending on beauty products:
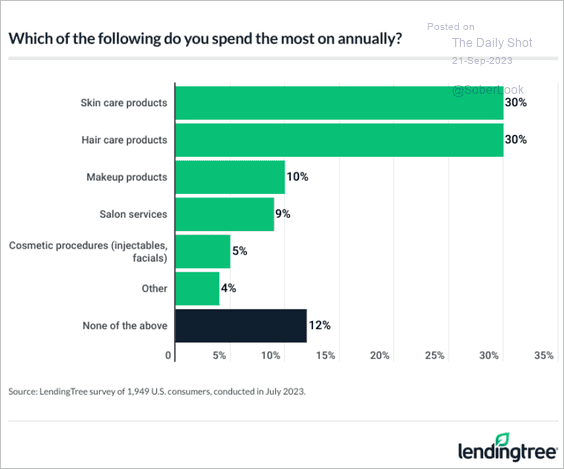 Source: LendingTree, Read full article
——————–
5. Shifting materials sourcing from mines to scrapyards:
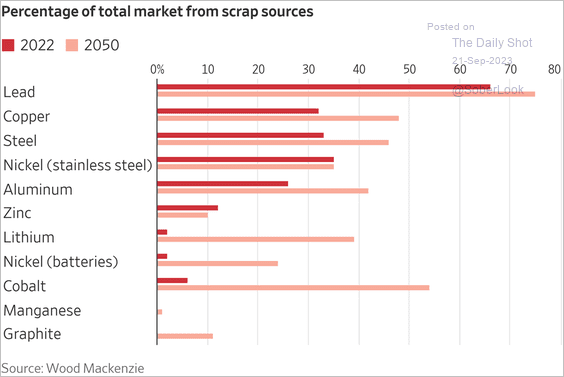 Source: @WSJ Read full article
6. US EV investment:
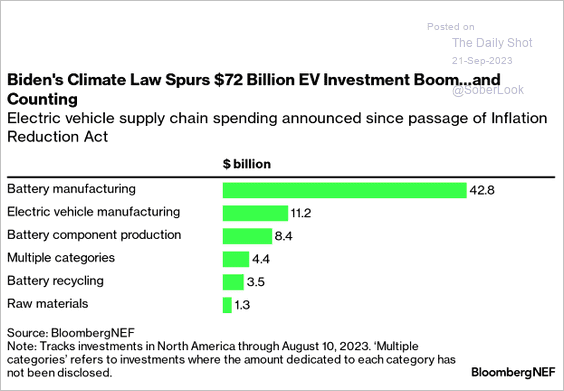 Source: Bloomberg Law Read full article
7. Views on degrees that often lead to low-paying jobs:
 Source: Intelligent Read full article
8. Reasons for owning a gun:
 Source: Pew Research Center Read full article
9. Homelessness and rental costs:
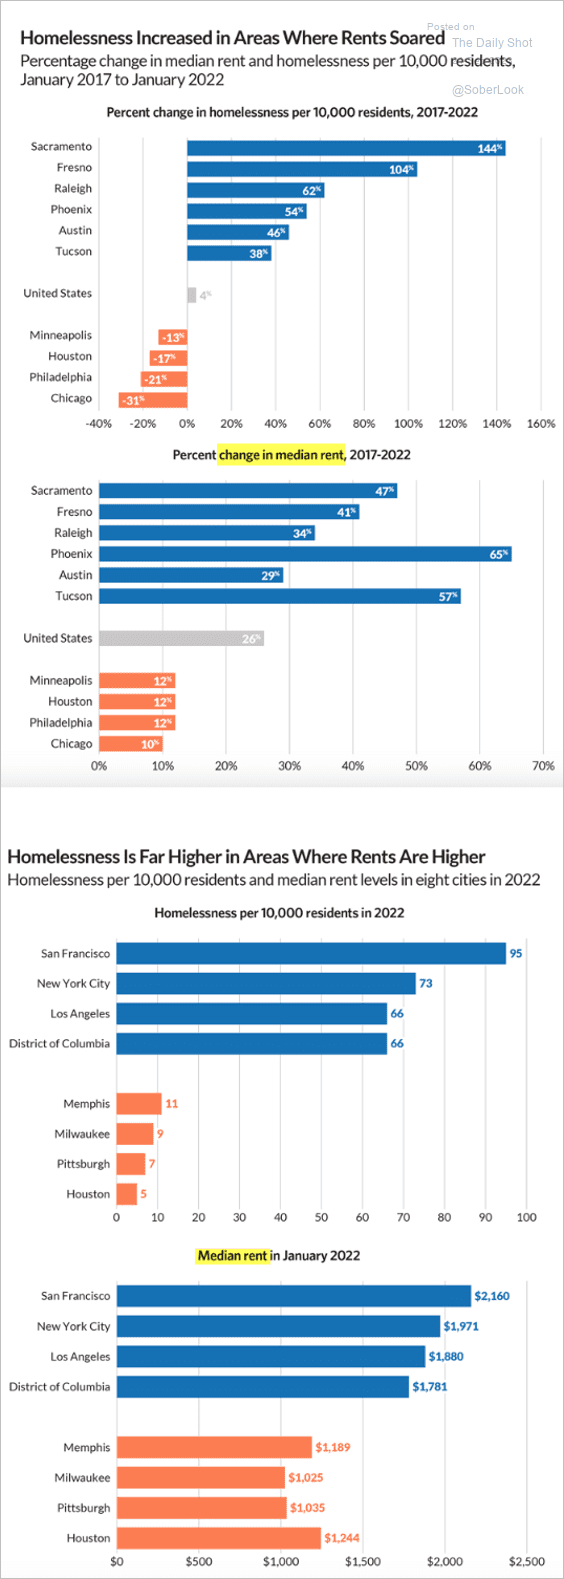 Source: The Pew Charitable Trusts Read full article
10. Highest and lowest men-to-women ratios:
 Source: @genuine_impact
——————–
Back to Index
