
The Daily Shot: 27-Sep-23
• The United States
• Canada
• The United Kingdom
• Europe
• Asia-Pacific
• China
• Emerging Markets
• Cryptocurrency
• Commodities
• Energy
• Equities
• Rates
• Global Developments
• Food for Thought
The United States
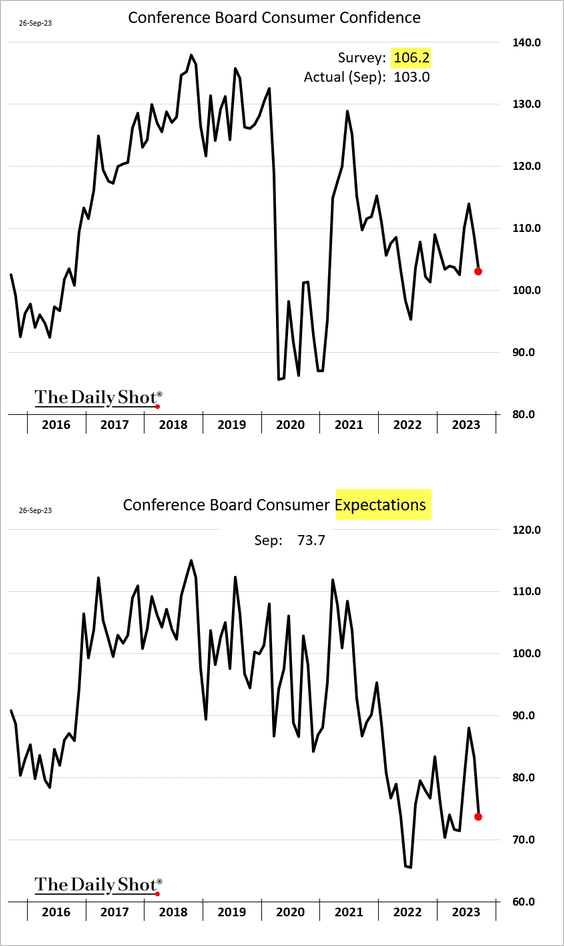
1. Like the University of Michigan’s report, the Conference Board’s indicator revealed a decline in consumer sentiment this month, with a notable weakness in the expectations measure.
 Source: AP News Read full article
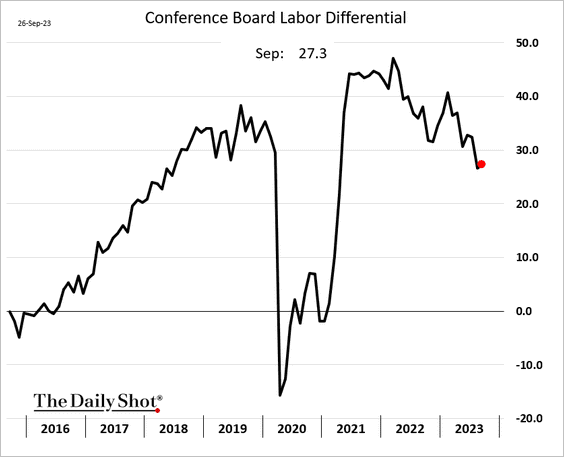
• The labor differential (“jobs plentiful” less “jobs hard to get”) ticked higher.
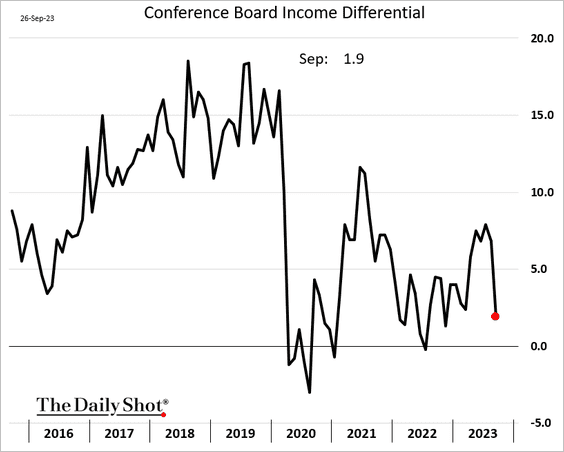
• The income differential (participants expecting higher income less those expecting lower income) declined sharply.
——————–
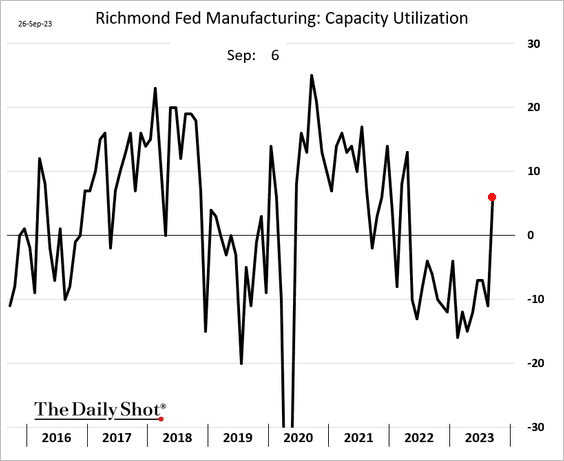
2. The Richmond Fed’s regional manufacturing index unexpectedly moved into growth territory as demand improved.
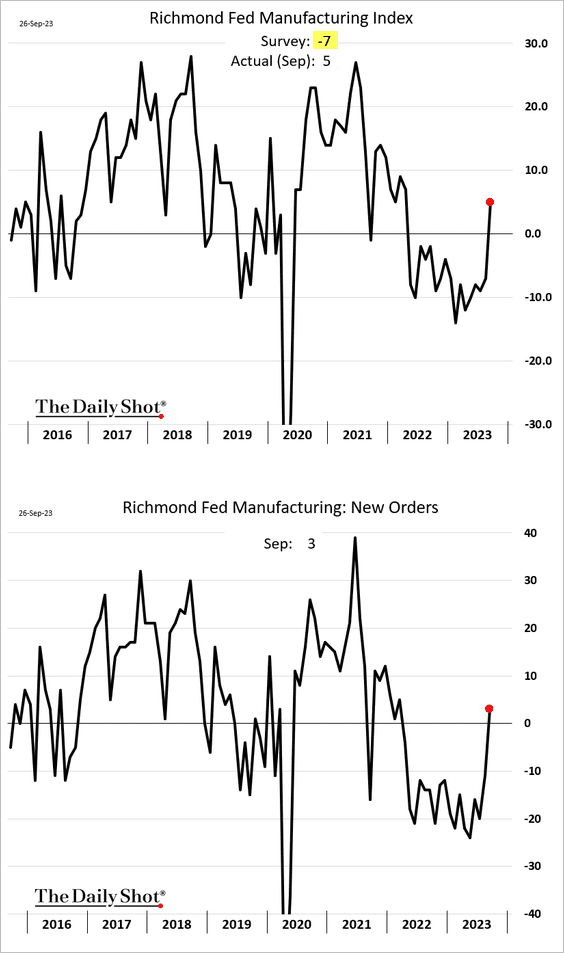
Capacity utilization strengthened.
——————–
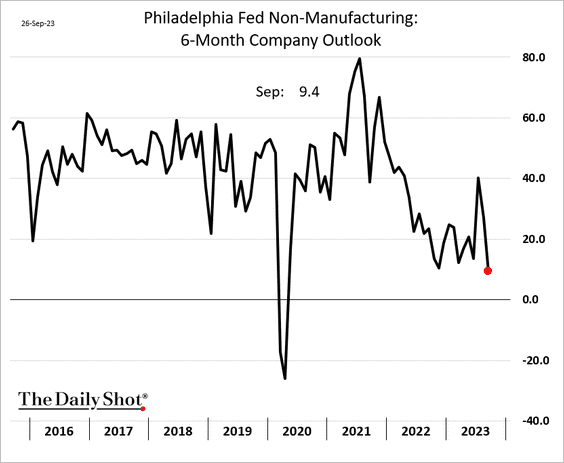
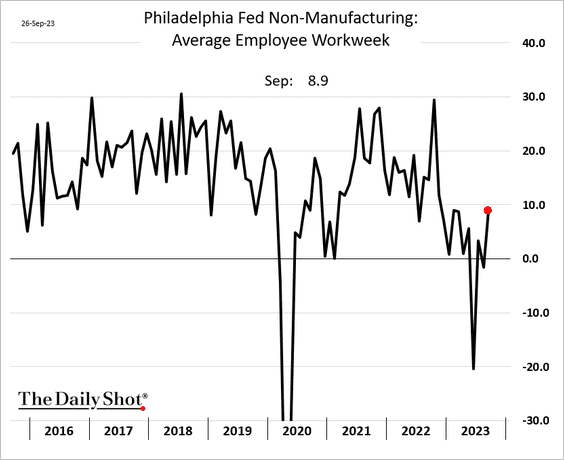
3. The Philly Fed’s non-manufacturing index remains in contraction territory, …
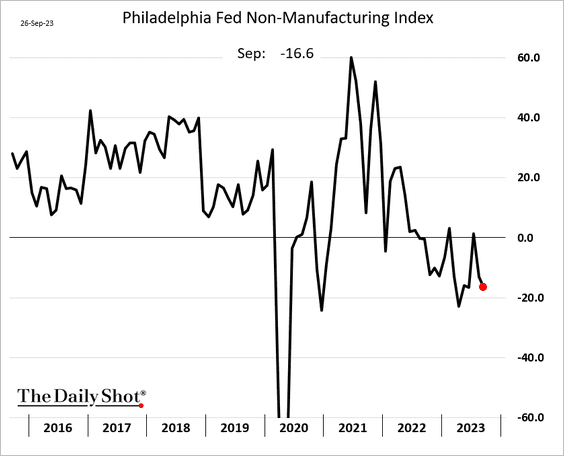
… with outlook softening.
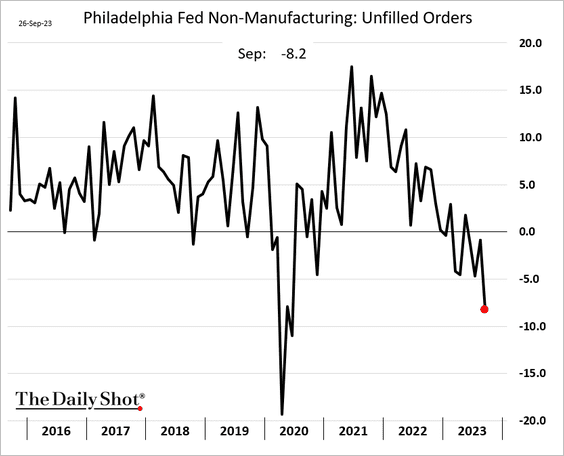
• There are no issues meeting demand.
• Businesses boosted employee hours.
——————–
4. Next, we have some updates on the housing market.
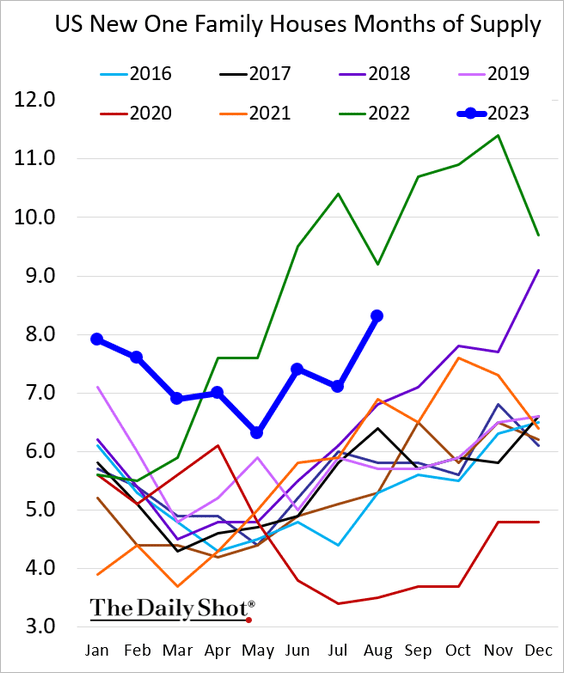
• New home sales remained soft last month, …
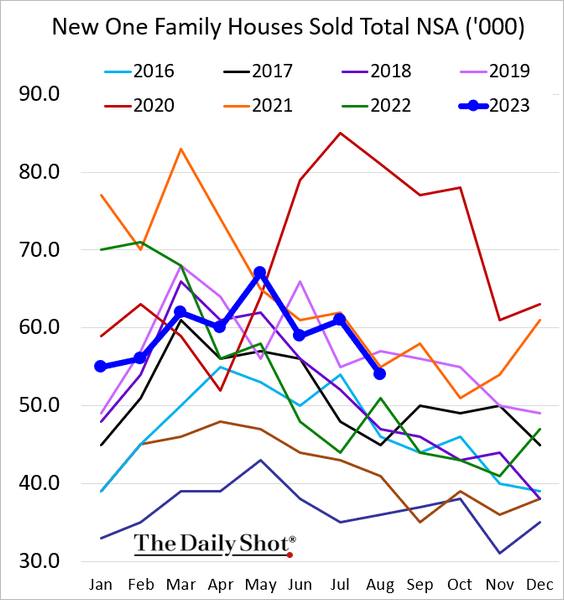
… with inventories (measured in months of supply) rising sharply.
– This chart shows new home sales by stage of construction.
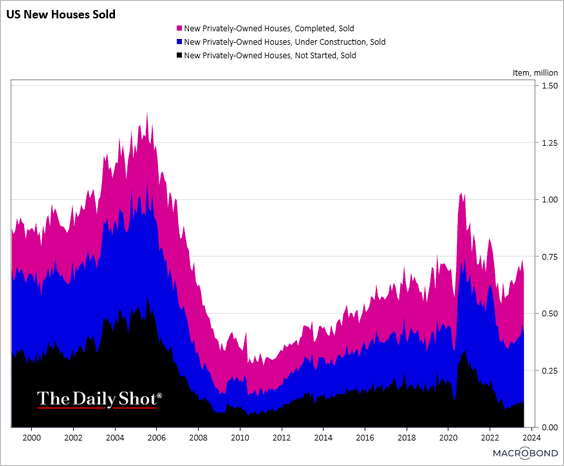 Source: Chart and data provided by Macrobond
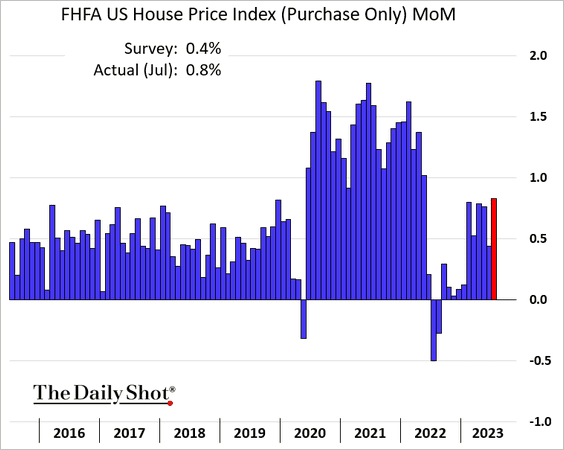
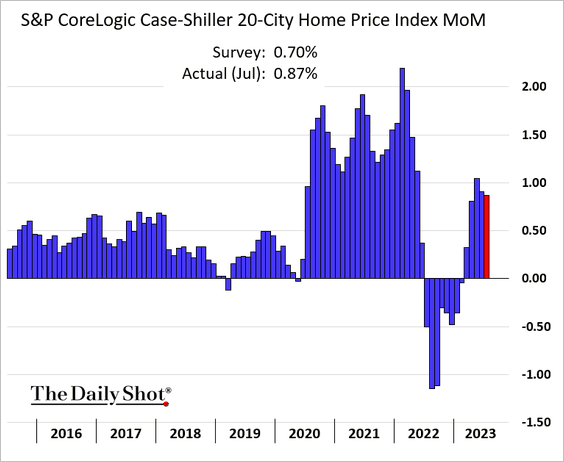
• Home prices rose more than expected in July.
• FFHFA:
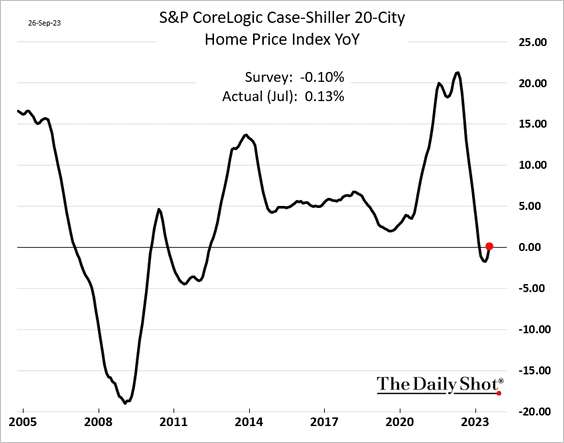
• Case-Shiller:
The Case-Shiller index is now up on a year-over-year basis.
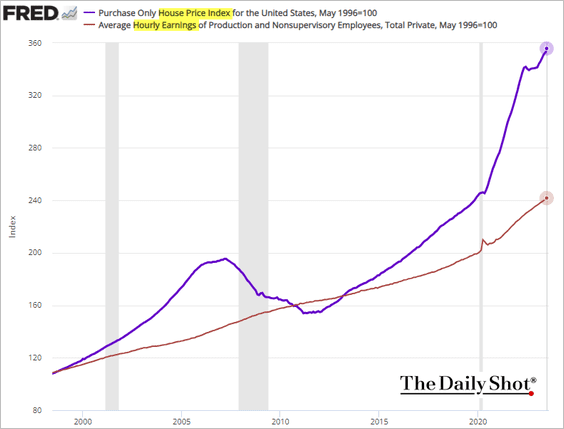
• Home prices are increasingly outstripping wage growth.
• Here is a look at housing inventories by price tier in terms of months of supply.
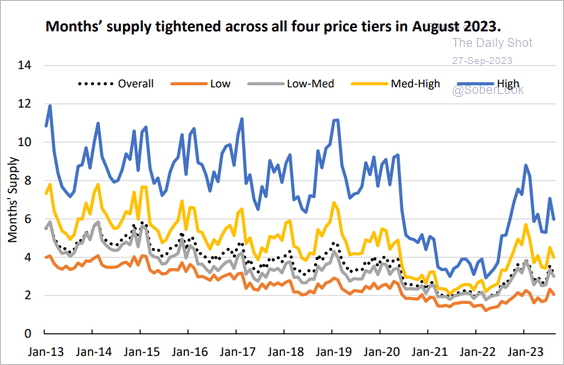 Source: AEI Housing Center
——————–
5. Recession odds have been pushed out to 2025. Are forecasts becoming too optimistic?
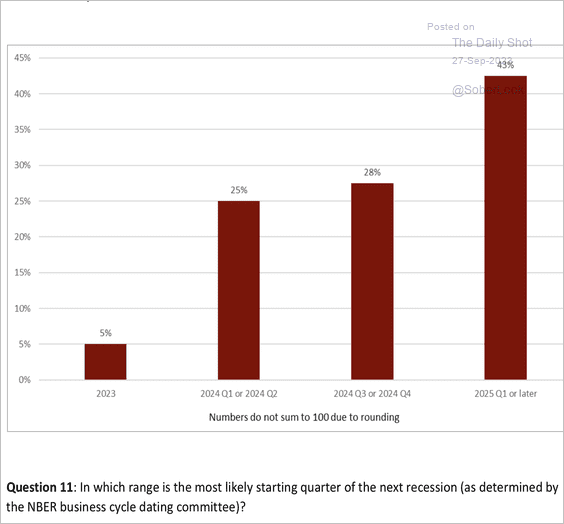 Source: FT/Chicago Booth
Back to Index
Canada
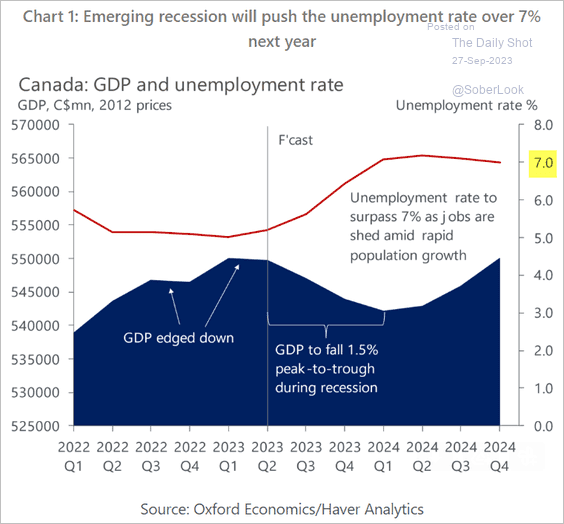
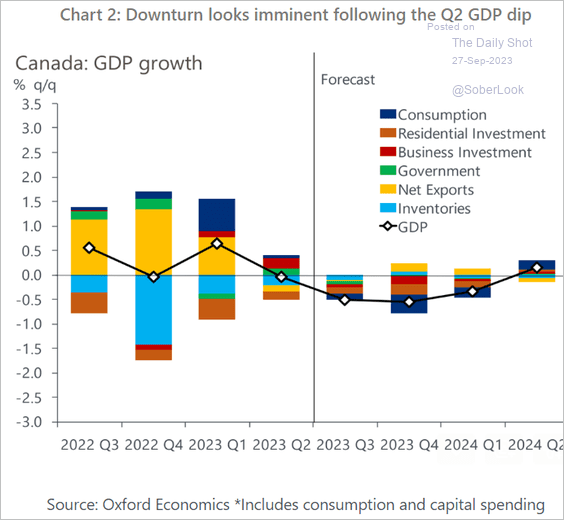
Economists forecast that Canada’s GDP growth will be limited to just 0.7% next year.
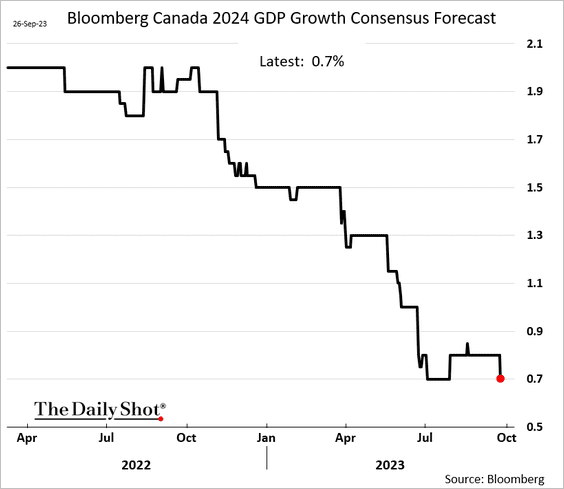
• However, the prevailing estimates do not anticipate a recession.
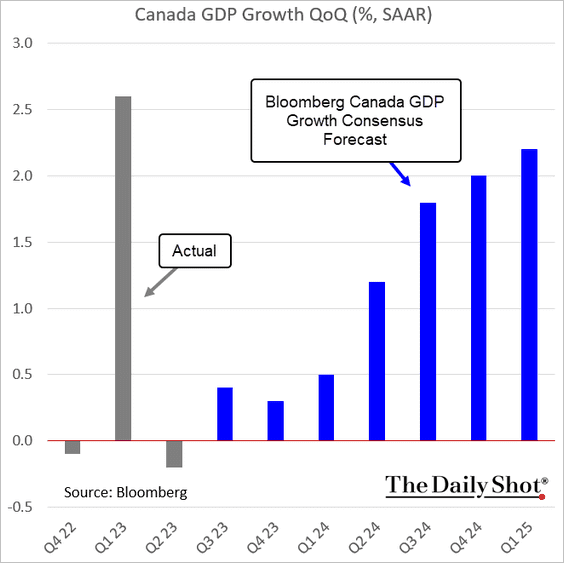
• Oxford Economics is less optimistic, projecting three down quarters (2 charts).
 Source: Oxford Economics
 Source: Oxford Economics
Back to Index
The United Kingdom
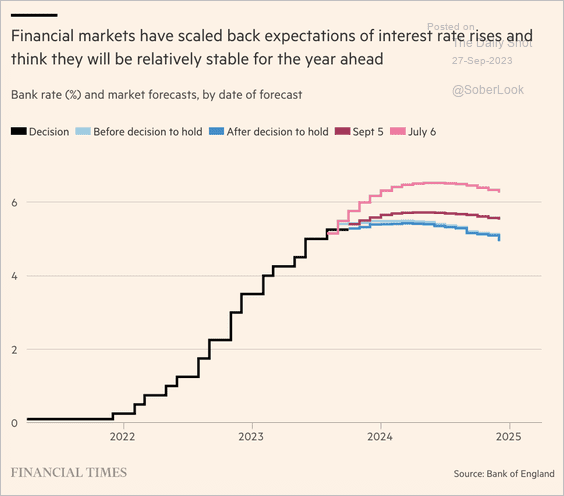
1. Rate expectations have been scaled back after the soft CPI report.
 Source: @financialtimes Read full article
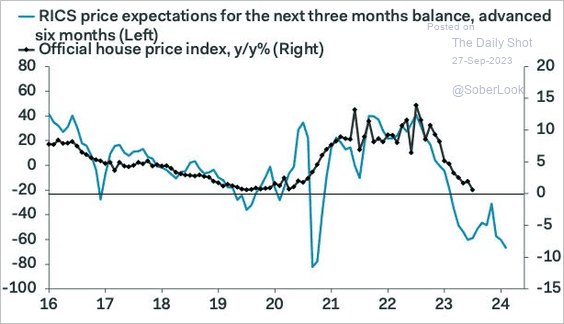
2. The official index of home prices has further to fall.
 Source: Pantheon Macroeconomics
3. Will consumer spending stagnate next year?
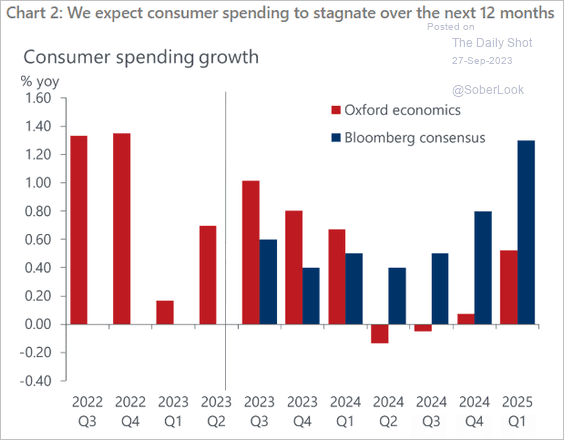 Source: Oxford Economics
Back to Index
Europe
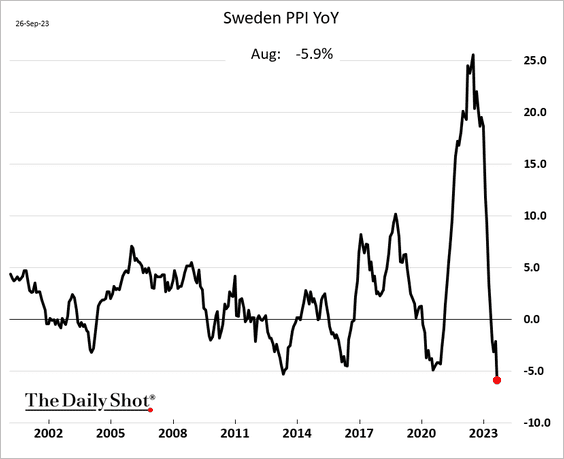
1. Sweden’s PPI registered the biggest yearly decline on record last month.
2. Here is a look at companies shifting profits to low-tax jurisdictions.
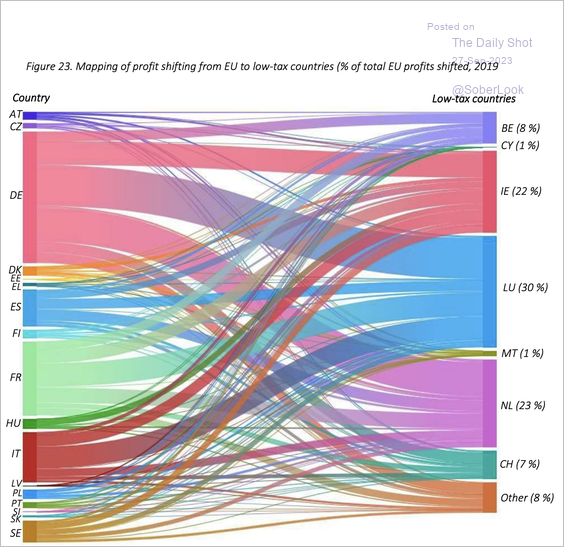 Source: Centre for European Policy Studies Read full article
3. This map illustrates the average workweek in the EU.
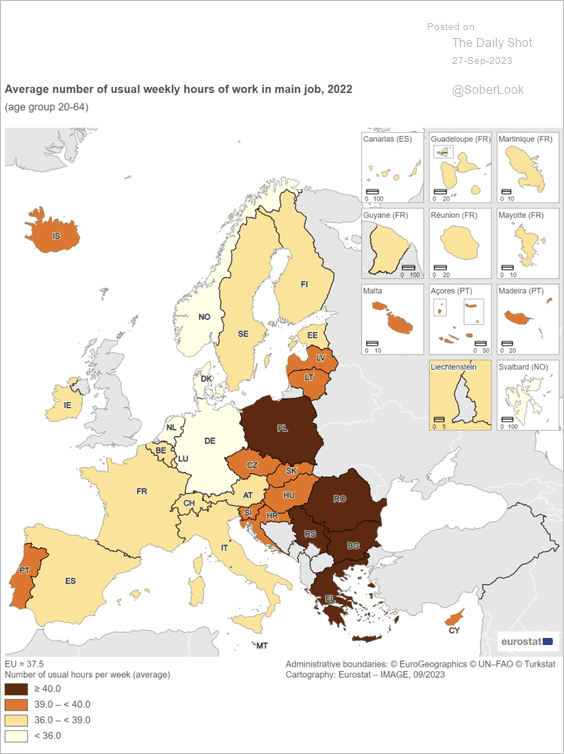 Source: Eurostat Read full article
Back to Index
Asia-Pacific
1. The yen is undervalued, and the Singapore dollar is overvalued, according to Bloomberg.
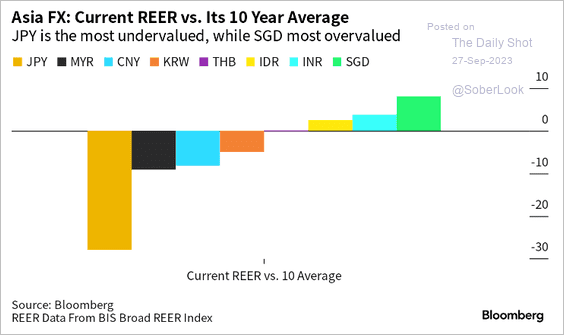 Source: Mary Nicola, @TheTerminal, Bloomberg Finance L.P. Read full article
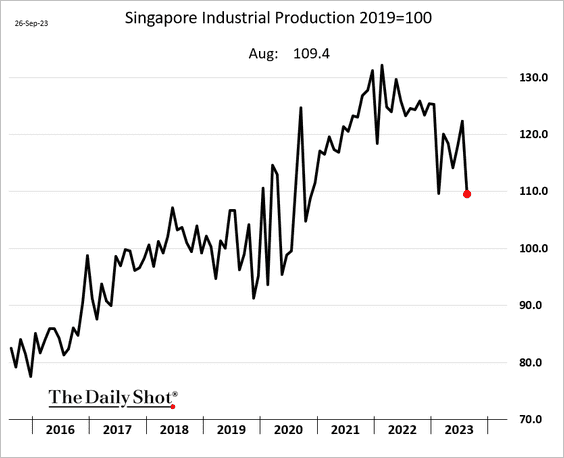
2. Singapore’s industrial production declined sharply last month.
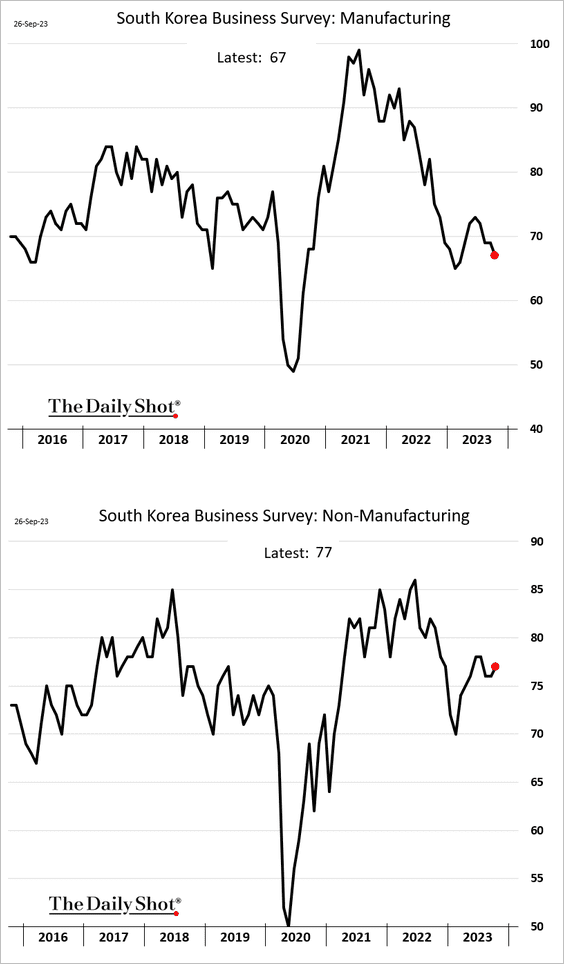
3. Business surveys from South Korea showed mixed results: the manufacturing index declined, while services improved.
• USD/KRW broke resistance as the US dollar surges.
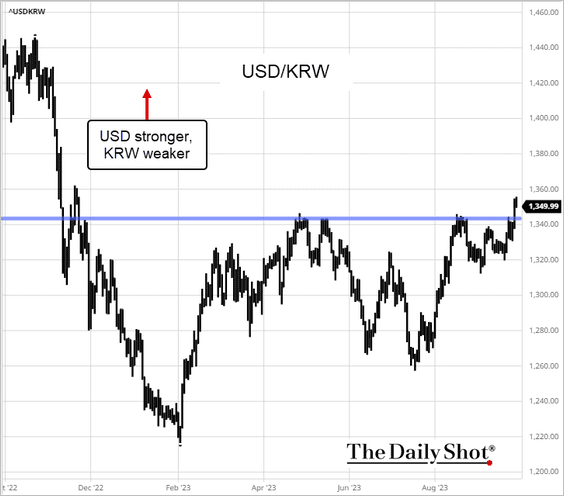 Source: barchart.com
——————–
4. The scatterplot below shows policy rates relative to the US and the year-to-date currency performance.
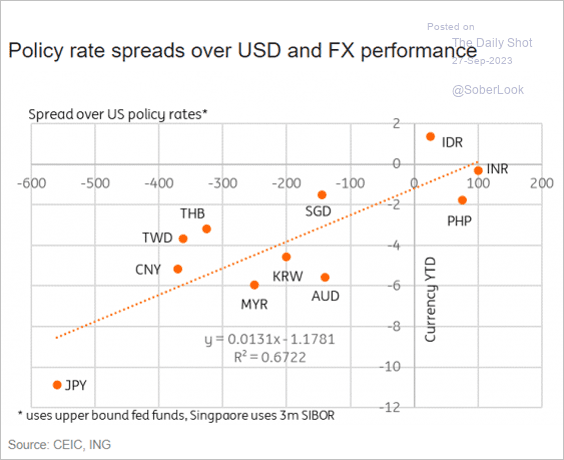 Source: ING
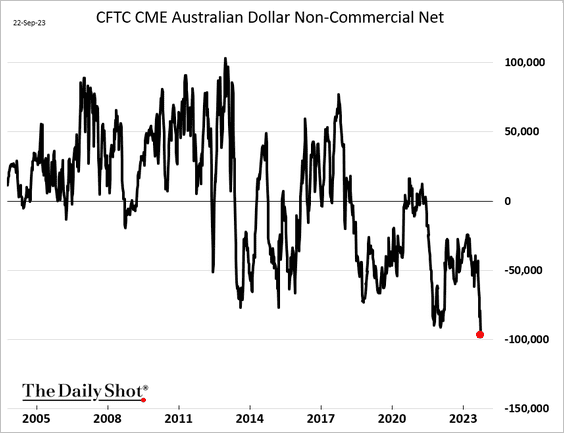
5. Traders really dislike the Aussie dollar.
Back to Index
China
1. Retail demand for equities has been soft.
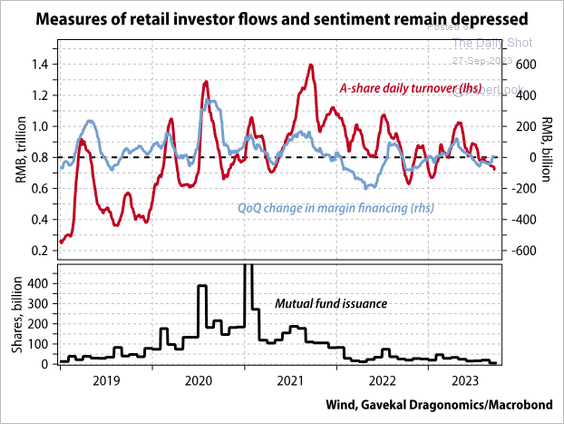 Source: Gavekal Research
2. Here is a look at China’s top 25 real estate companies.
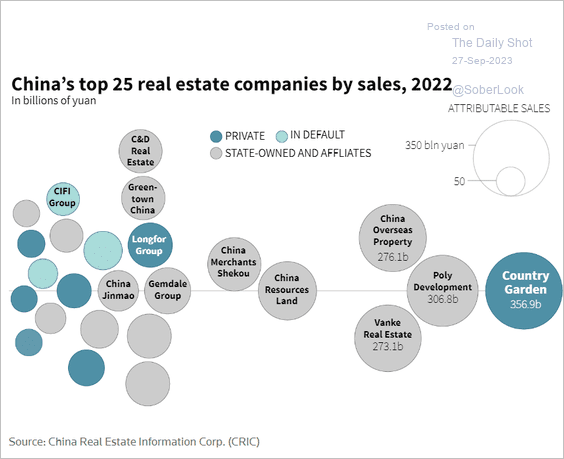 Source: Reuters Read full article
• This scatterplot shows profits and liabilities.
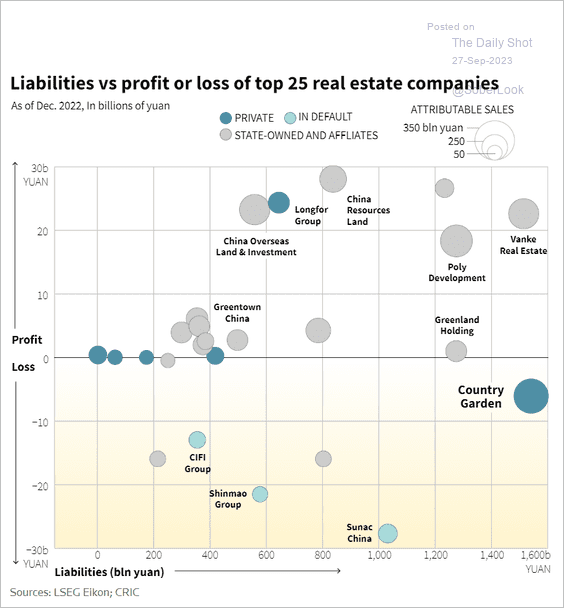 Source: Reuters Read full article
——————–
3. Companies shifting away from China are selecting these alternatives.
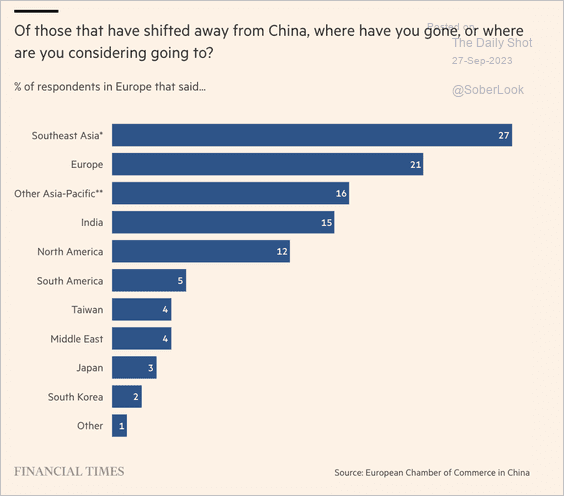 Source: @financialtimes Read full article
Back to Index
Emerging Markets
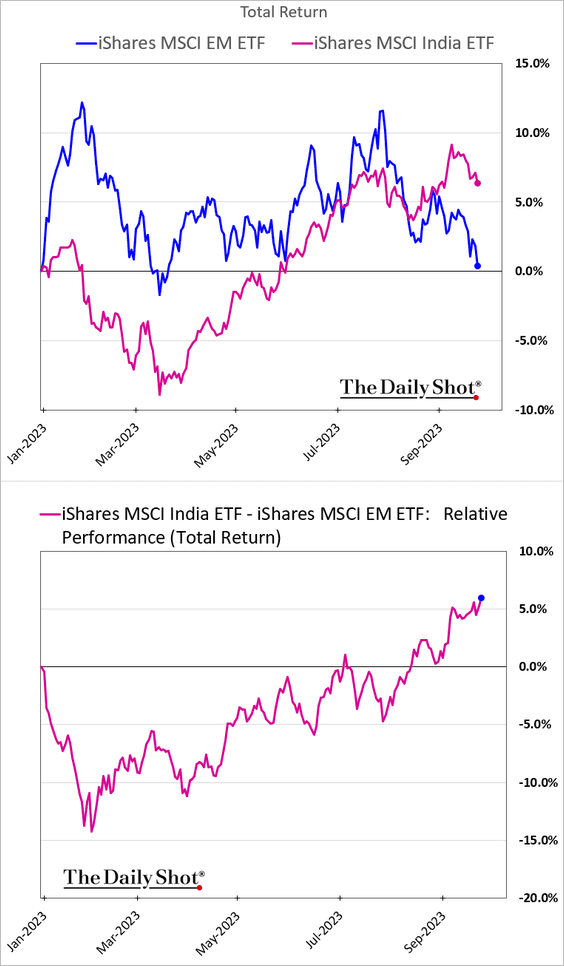
1. Let’s begin with India.
• Equities have been outperforming (in dollar terms).
• How have exports changed on a year-over-year basis?
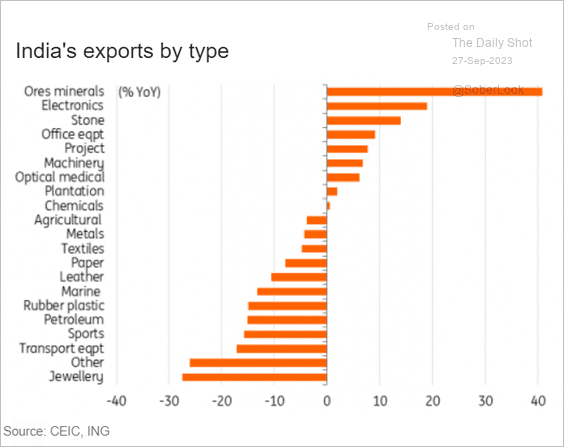 Source: ING
• India’s economic growth is expected to outpace China’s GDP.
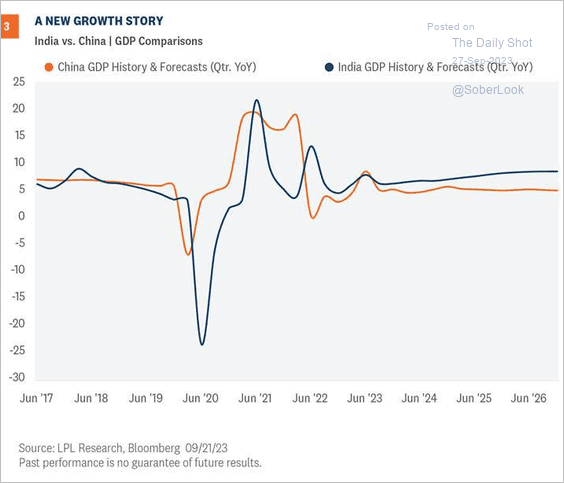 Source: LPL Research
——————–
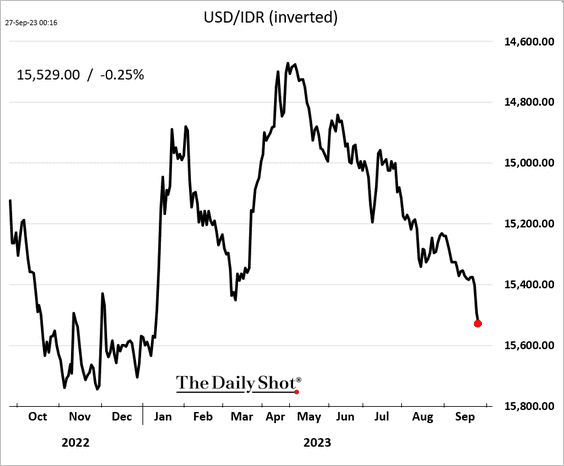
2. The Indonesian rupiah has been selling off.
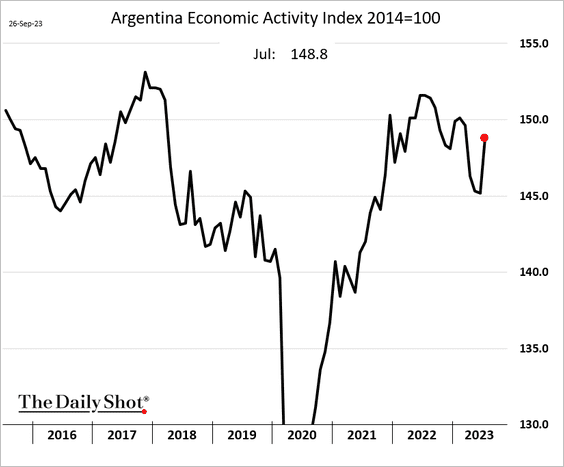
3. Argentina’s economic activity bounced in July.
4. Local-currency bonds have underperformed since the 2008 trough.
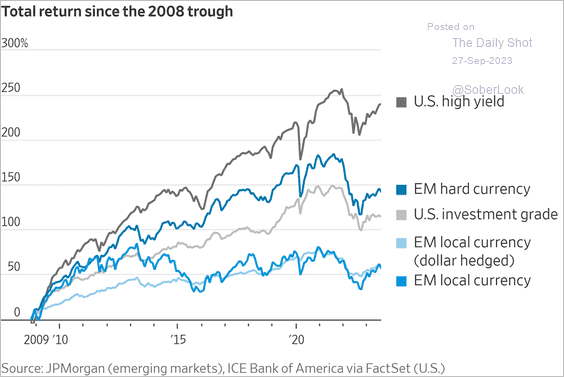 Source: @WSJ Read full article
Back to Index
Cryptocurrency
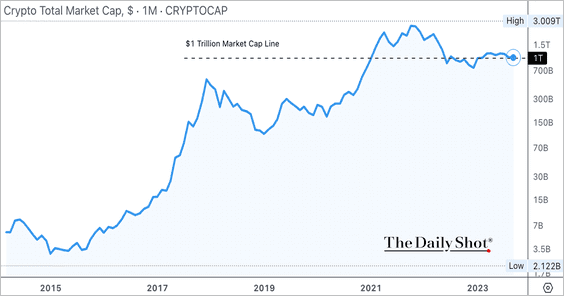
1. The total crypto market cap is back near the $1 trillion mark.
2. This map shows the status of central bank digital currency (CBDC) research and pilot projects.
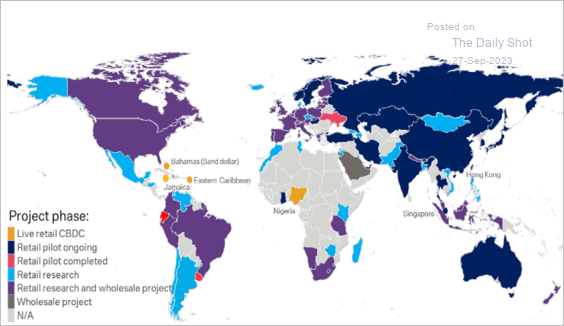 Source: Deutsche Bank Research
3. Here is a timeline of bitcoin’s evolution.
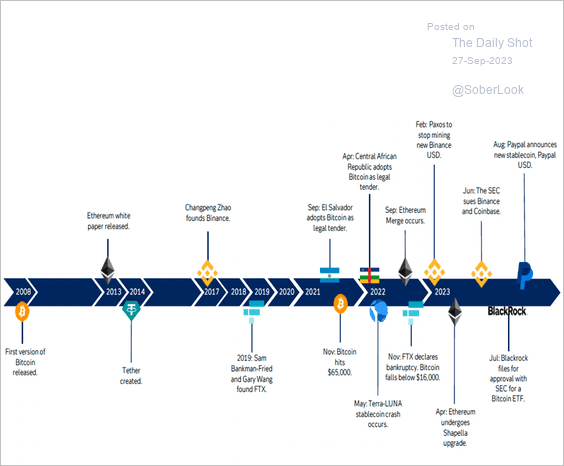 Source: Deutsche Bank Research
4. The daily trading volume of bitcoin and ether remain very limited compared to major currencies.
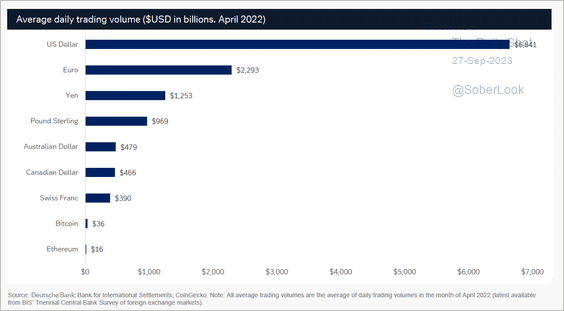 Source: Deutsche Bank Research
5. Most BTC is held by a few addresses known as “crypto whales.”
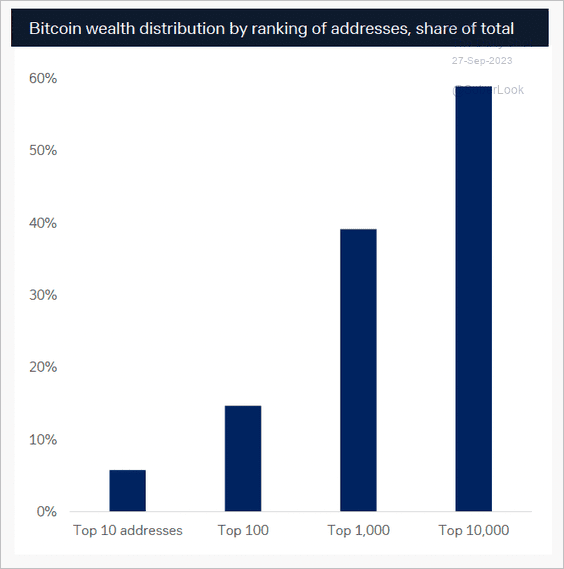 Source: Deutsche Bank Research
6. Congress is pushing the SEC to approve applications for spot-bitcoin ETFs ahead of a hearing this week.
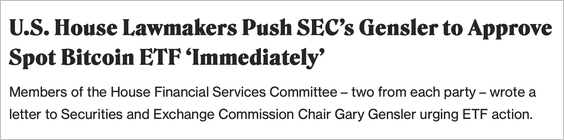 Source: CoinDesk Read full article
7. Binance’s global market share took a significant hit this year as US trading on the platform ground to a halt.
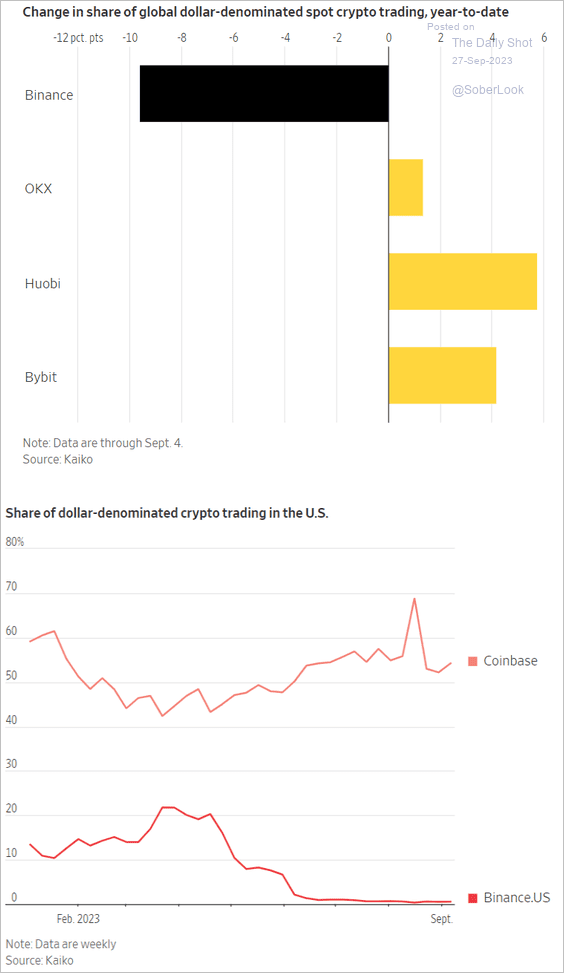 Source: @WSJ Read full article
Back to Index
Commodities
1. Gold is trading at a significant premium in China compared to international prices.
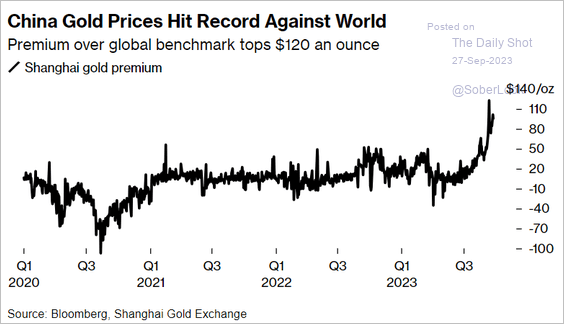 Source: @markets Read full article
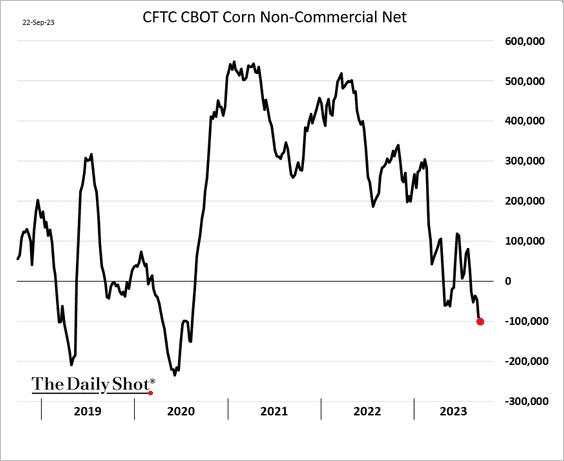
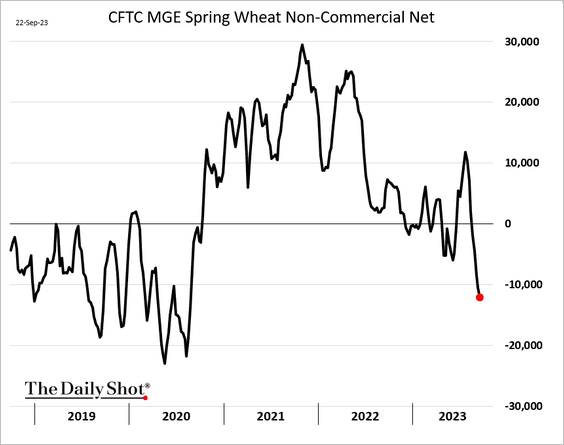
2. Speculative accounts have been boosting their bets against corn and spring wheat futures.
——————–
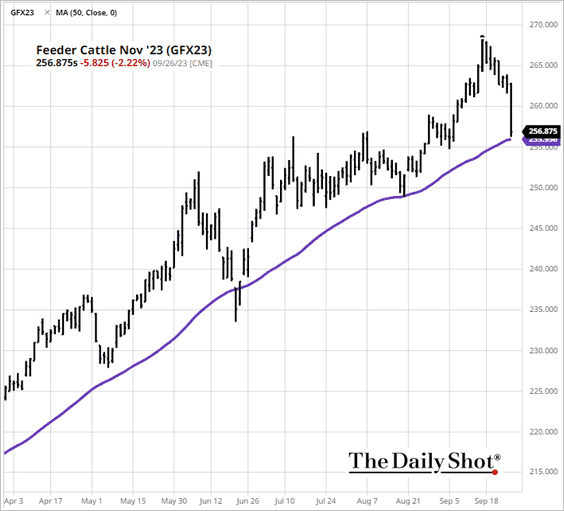
3. US feeder cattle futures took a hit on Tuesday (stopping at the 50-day moving average) after the USDA reported limited cash sales.
 Source: barchart.com
 Source: barchart.com Read full article
Back to Index
Energy
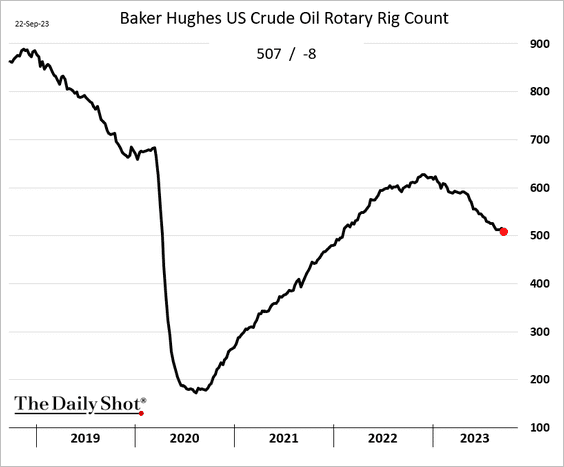
1. The US rig count resumed its decline last week.
2. This chart shows the implied crude oil scarcity premium, which was boosted by falling oil inventories at Cushing, OK (WTI futures settlement hub).
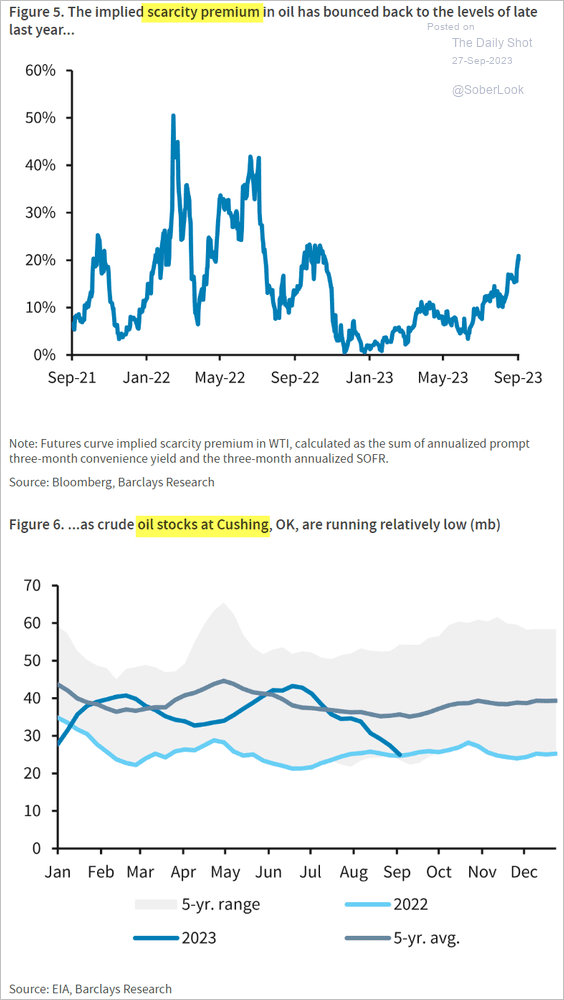 Source: Barclays Research
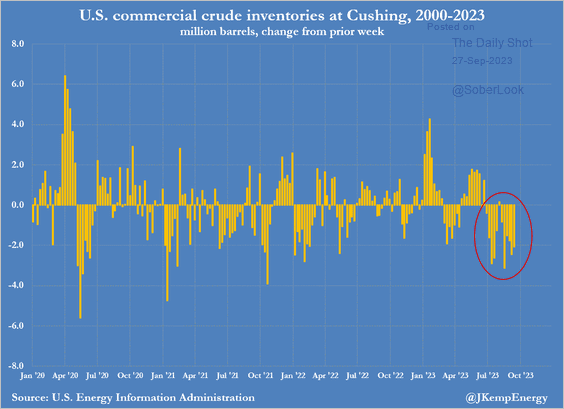 Source: @JKempEnergy
——————–
3. This chart shows US retail gasoline prices adjusted for inflation.
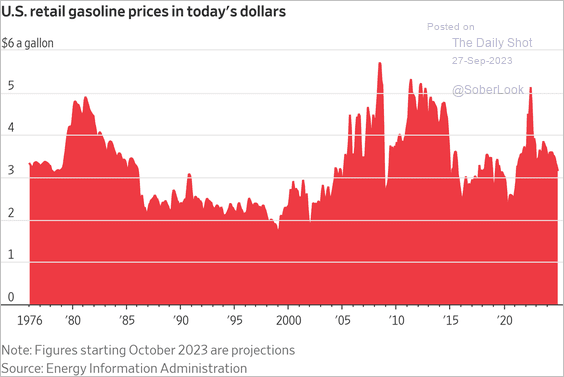 Source: @WSJ Read full article
Back to Index
Equities
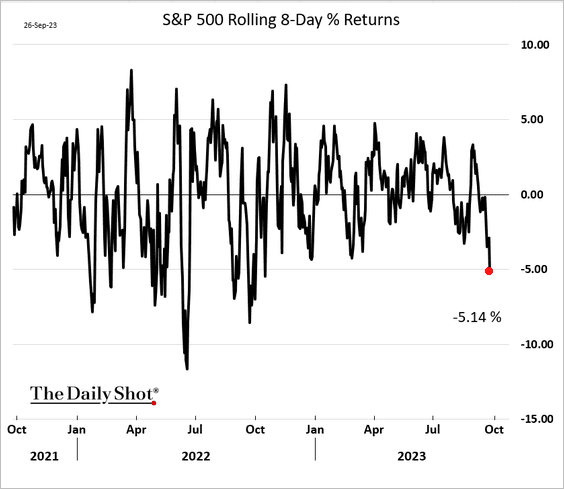
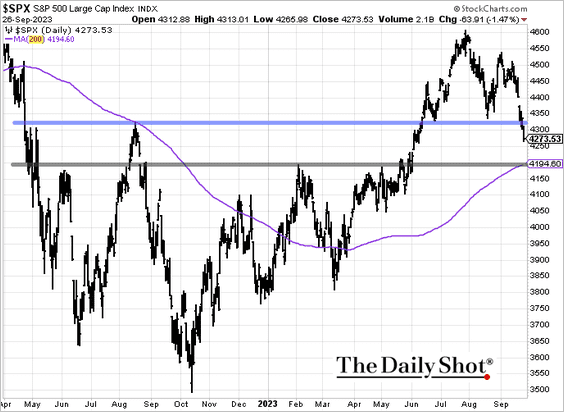
1. The last eight trading sessions registered the worst decline for the S&P 500 in 2023.
2. The next support level for the S&P 500 is at around 4200.
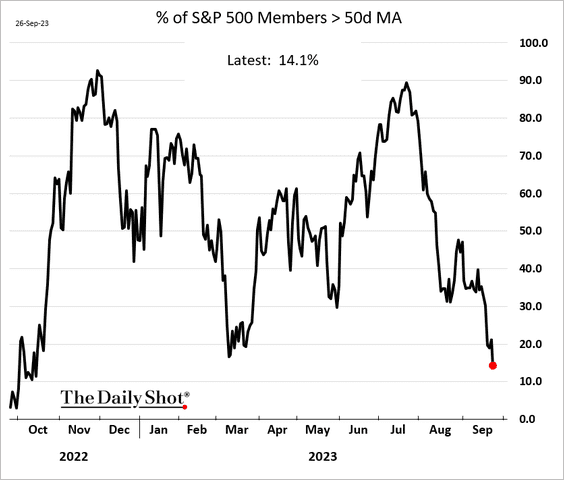
• This chart shows the percentage of S&P 500 members trading above their 50-day moving averages.
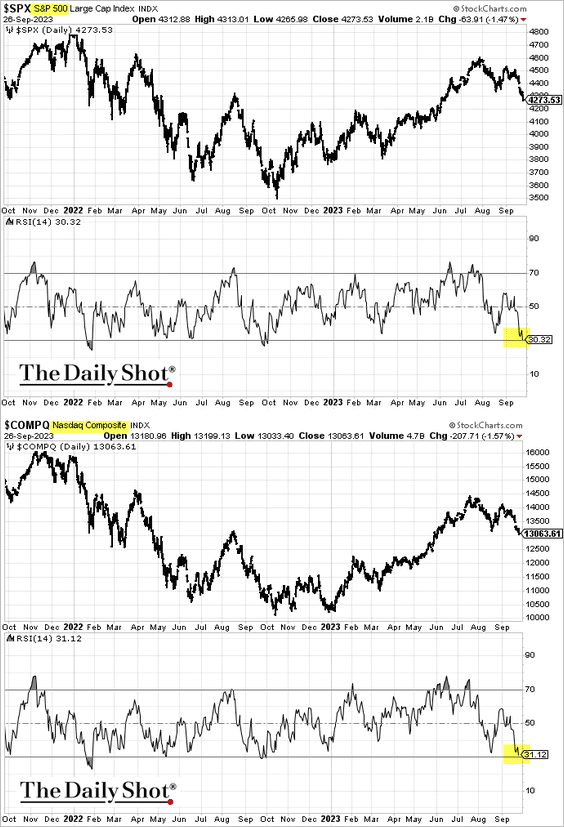
• Major indices are entering “oversold” territory.
——————–
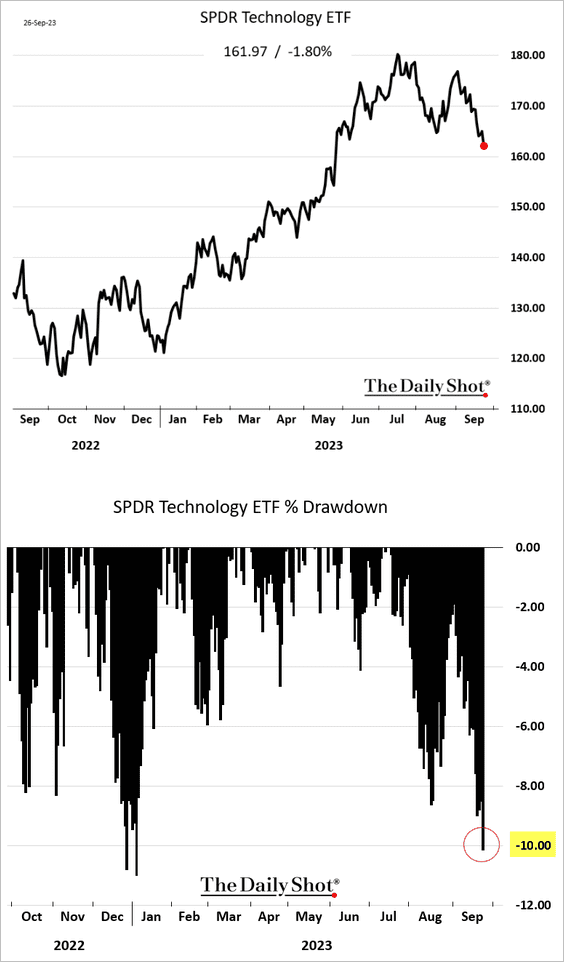
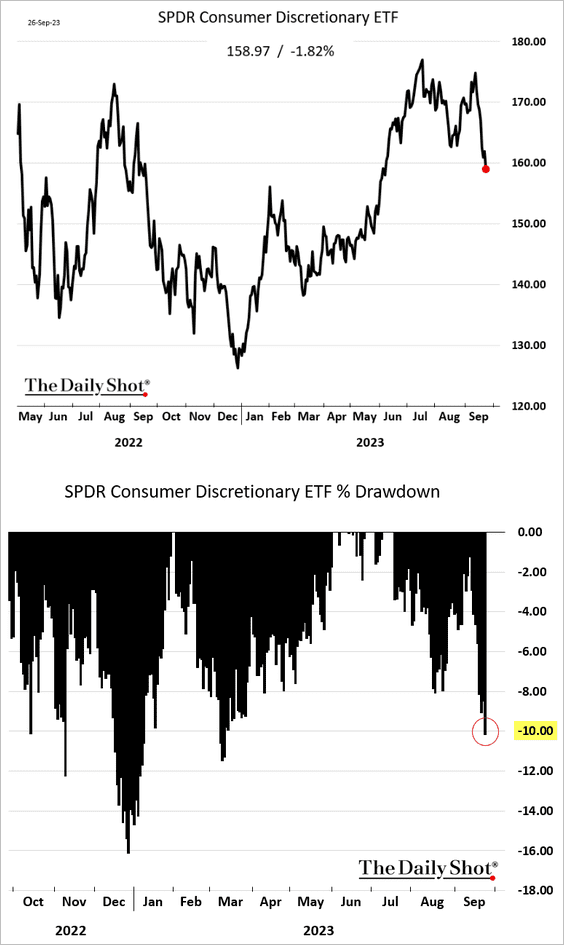
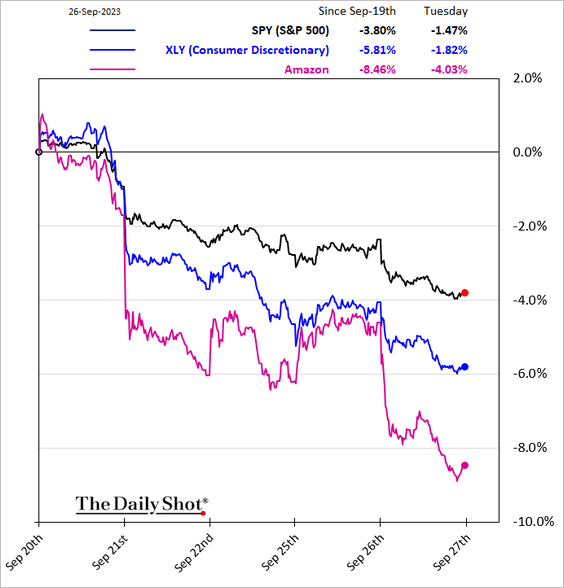
3. The tech and consumer discretionary indices entered a correction on Tuesday
——————–
4. The S&P 500 could exit its seasonal weak spot soon.
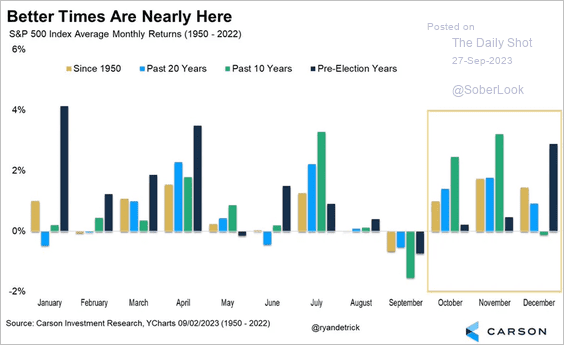 Source: @RyanDetrick
5. Here is a look at large-cap, mid-cap, and small-cap growth indices.
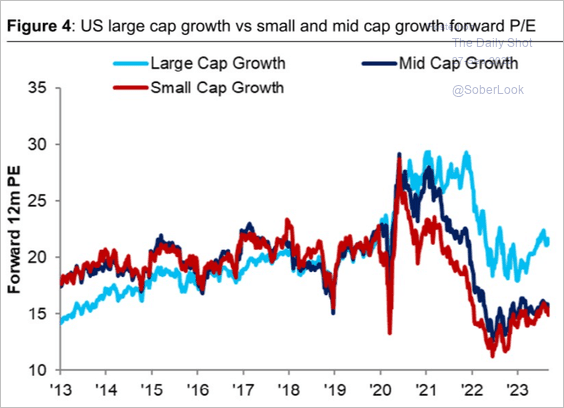 Source: Citi Private Bank
6. The equal-weight S&P 500 index remains under pressure.
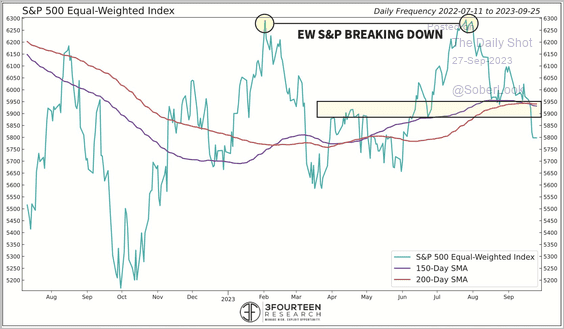 Source: @WarrenPies
7. US derivative-based ETFs have attracted significant capital in recent years.
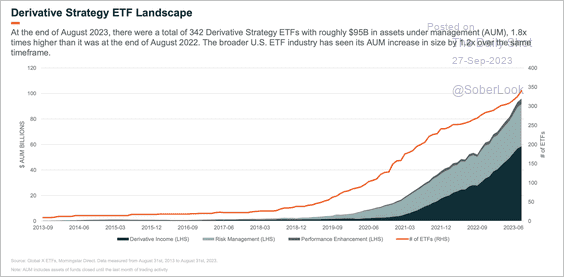 Source: Global X ETFs Read full article
So far, income strategies (option collars) are leading inflows this year, while some risk-management strategies saw outflows.
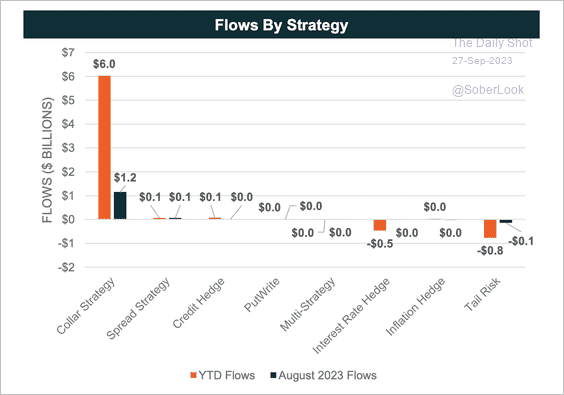 Source: Global X ETFs Read full article
——————–
8. International stocks are trading at a deep discount relative to US equities.
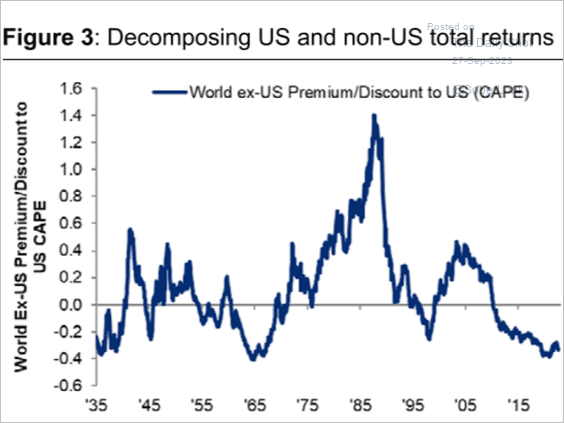 Source: Citi Private Bank
Back to Index
Rates
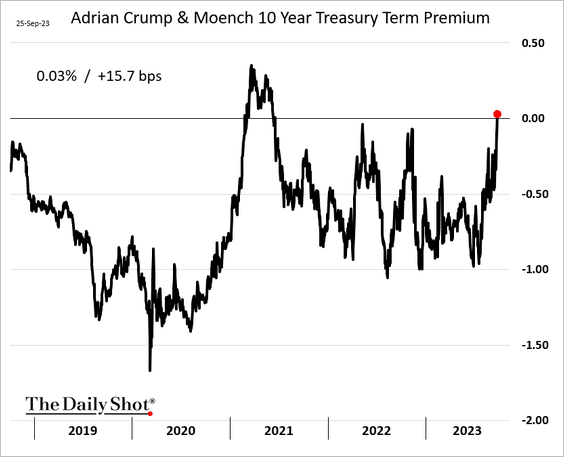
1. The 10-year Treasury term premium is back above zero.
2. Despite the sharp selloff in Treasuries, realized volatility has been trending lower.
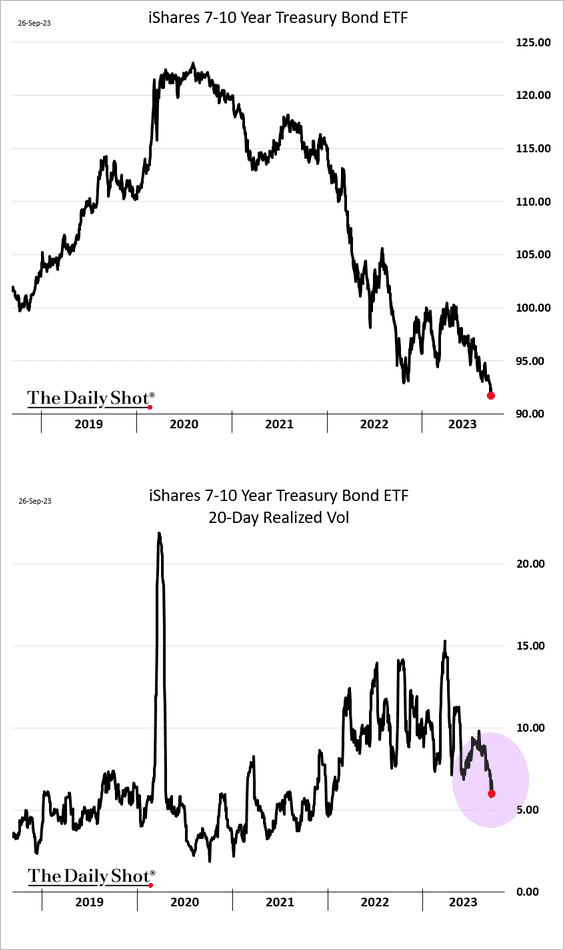
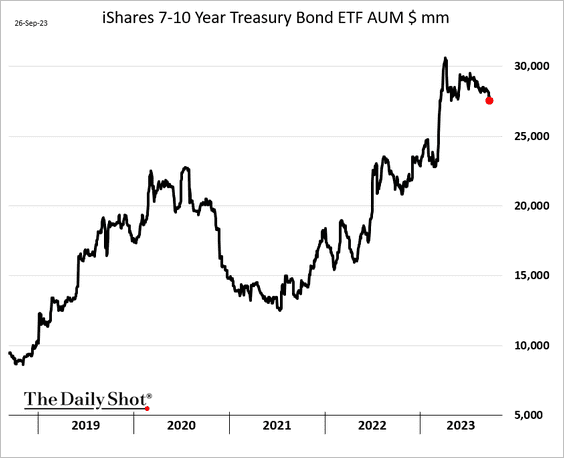
And Treasury ETF outflows have been limited.
Back to Index
Global Developments
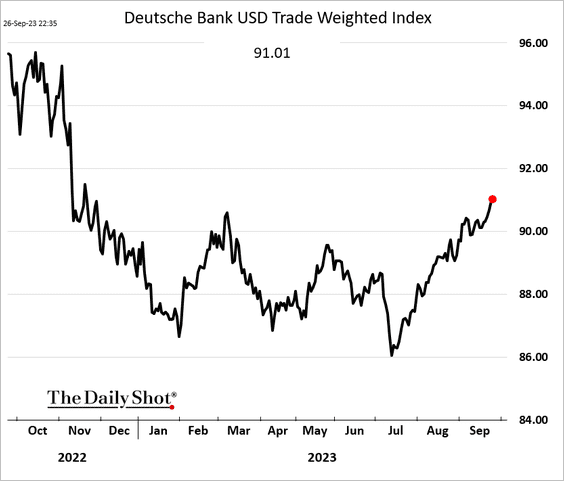
1. The US dollar continues to climb.
2. CAD/USD and NOK/USD have decoupled from oil prices.
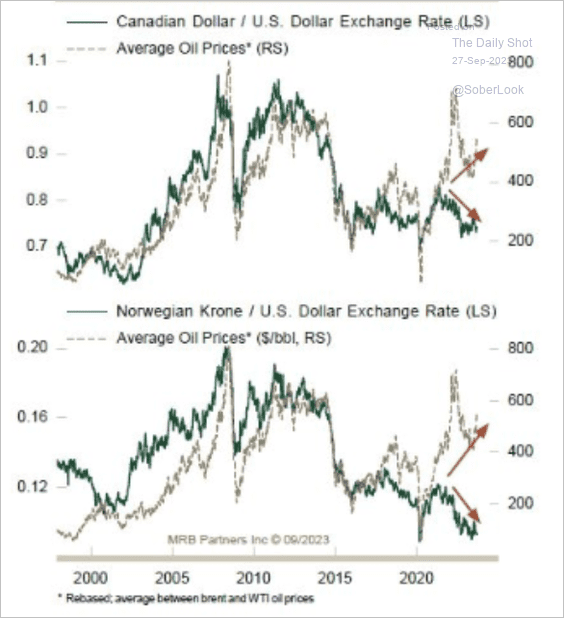 Source: MRB Partners
• By the way, NOK/CAD is trading at the lower end of its downtrend channel and appears extended. (2 charts)
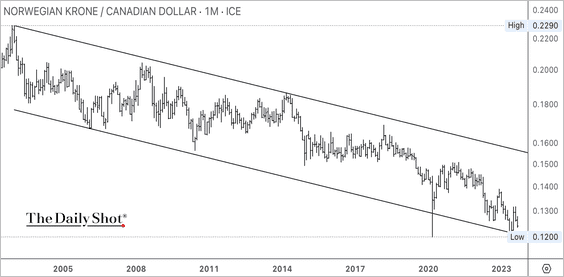
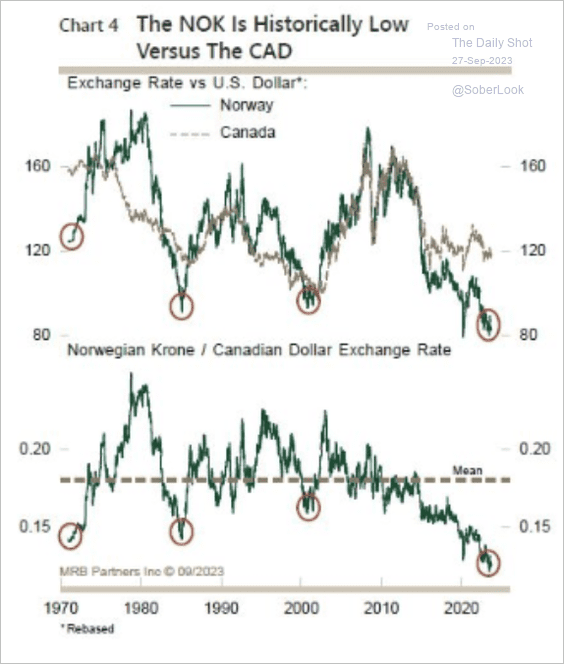 Source: MRB Partners
——————–
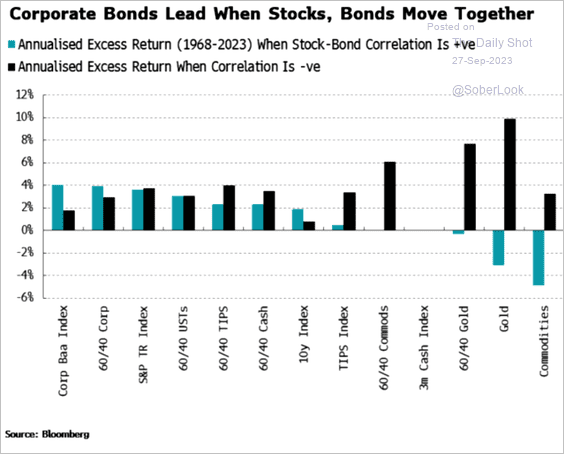
3. Here is a look at long-term excess returns by strategy/asset class (relative to cash).
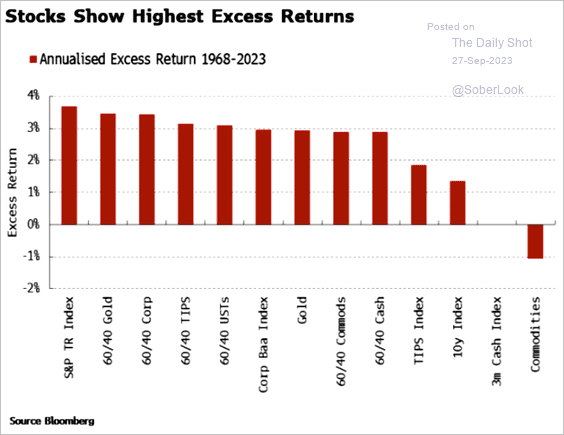 Source: Simon White, Bloomberg Markets Live Blog
How do these returns change when stock-bond correlations are positive vs. negative?
 Source: Simon White, Bloomberg Markets Live Blog
——————–
Food for Thought
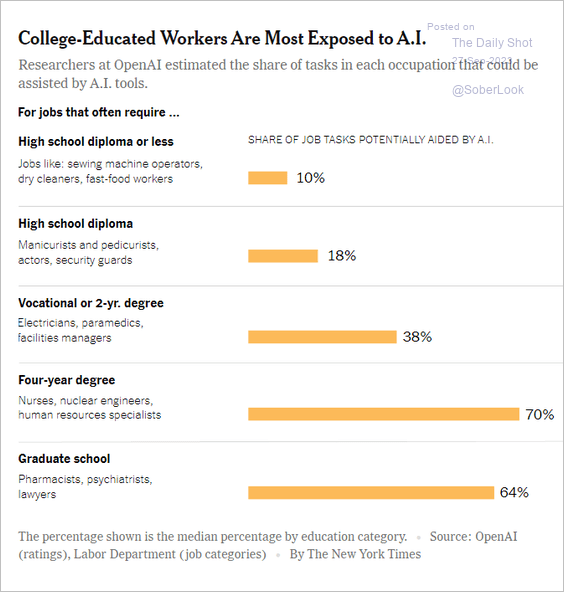
1. Which workers are most exposed to AI?
 Source: The New York Times Read full article
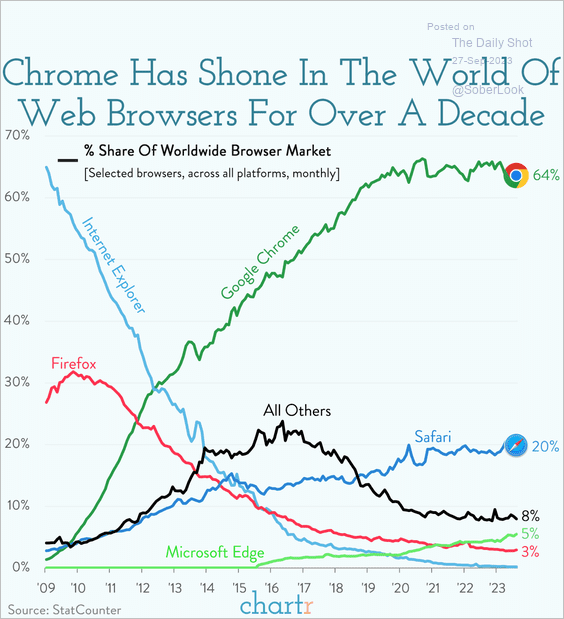
2. The web browser market:
 Source: @chartrdaily
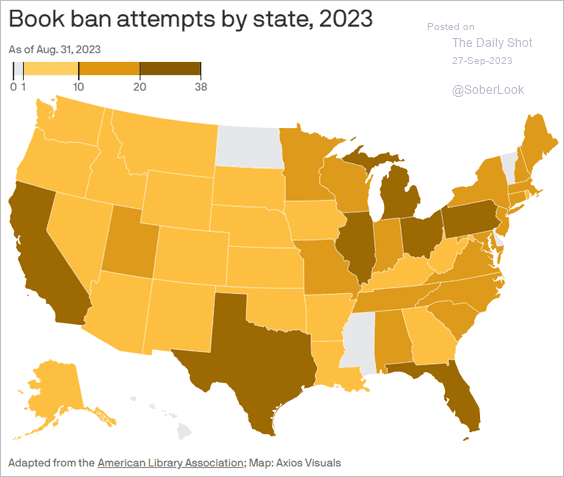
3. Book ban attempts:
 Source: @axios Read full article
4. Public transportation in large cities:
![]() Source: @financialtimes Read full article
Source: @financialtimes Read full article
5. Renewable energy installations:
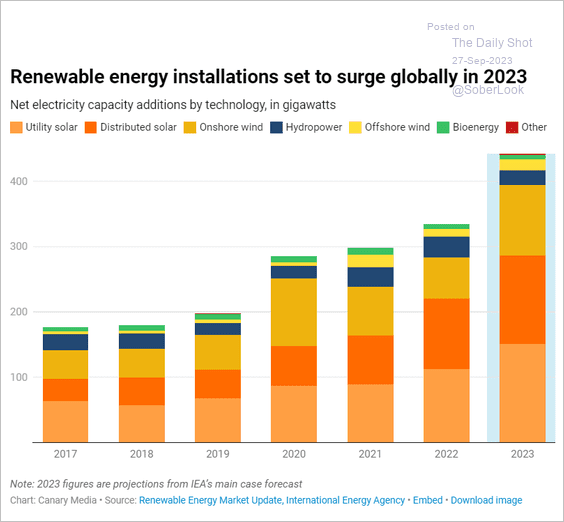 Source: Canary Media Read full article
6. US vegetarians:
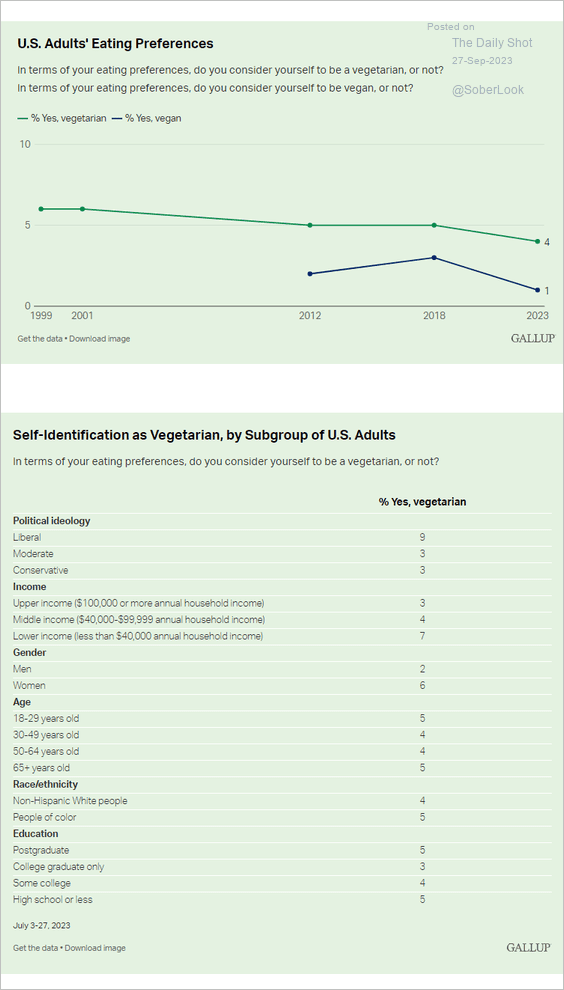 Source: Gallup Read full article
7. Taiwan voters’ views on independence and unification:
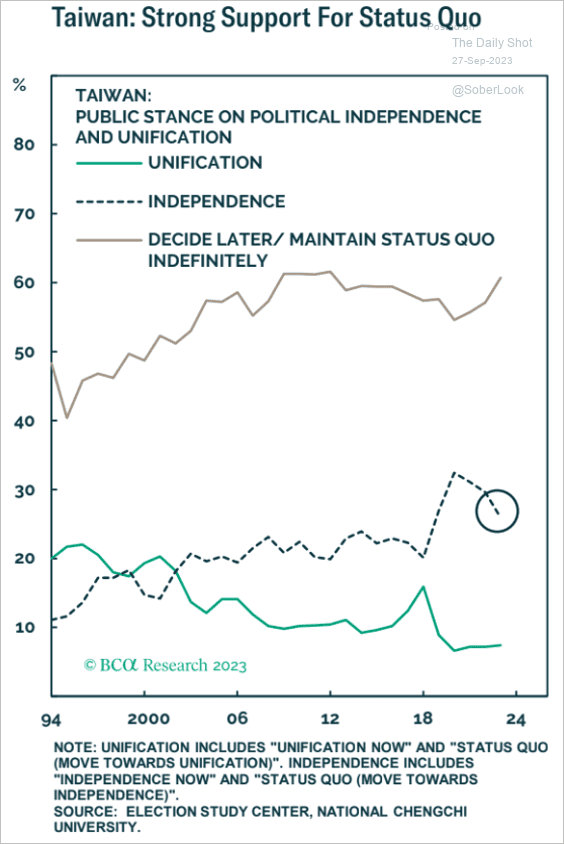 Source: BCA Research
8. Americans’ views on the China threat:
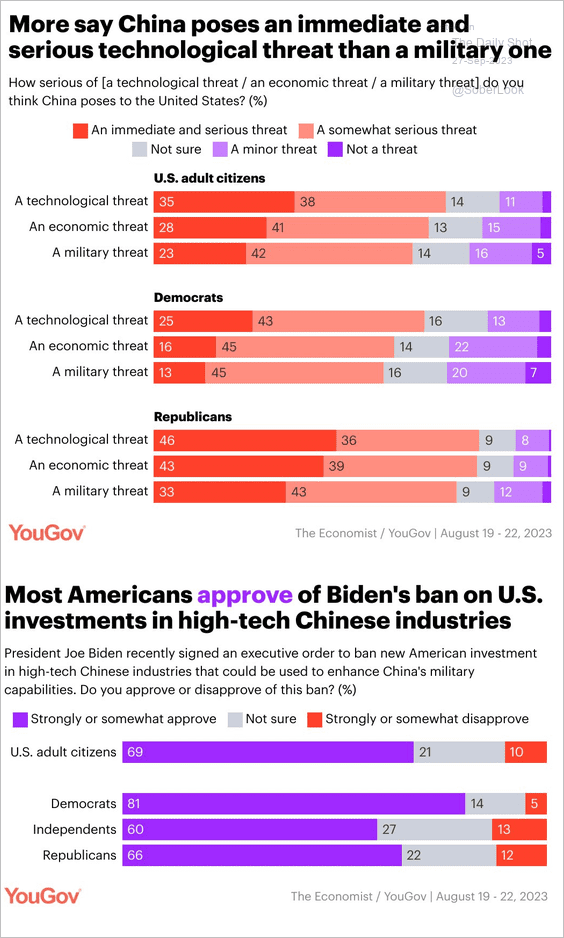 Source: YouGov Read full article
9. Watching TV with subtitles on:
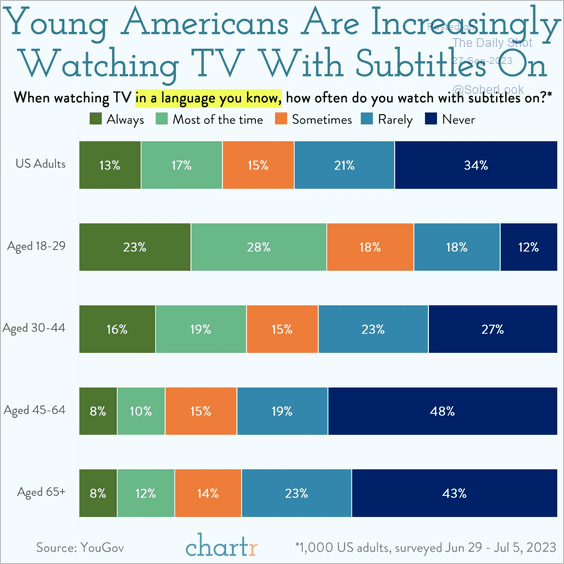 Source: @chartrdaily
——————–
Back to Index