
The Daily Shot: 29-Sep-23
• The United States
• Canada
• The United Kingdom
• The Eurozone
• Japan
• Australia
• Emerging Markets
• Energy
• Equities
• Credit
• Rates
• Food for Thought
The United States
1. Second-quarter consumer spending growth was revised lower.
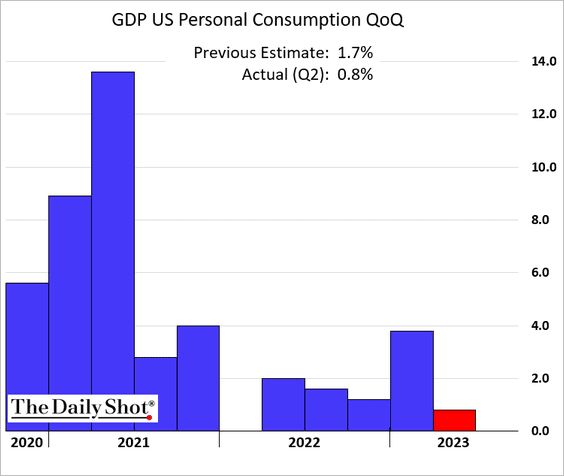 SAAR
SAAR
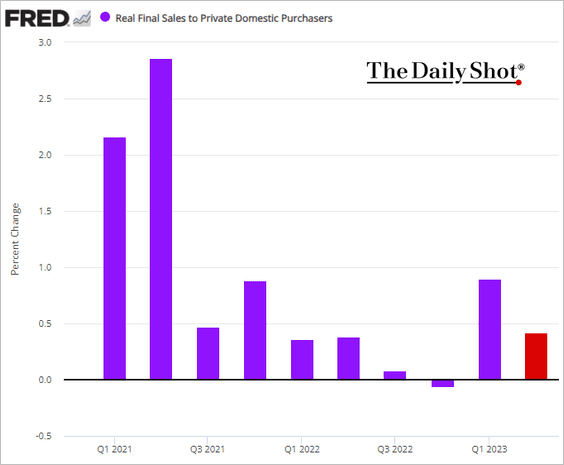
Nonetheless, real final sales to private domestic purchasers (“core GDP”) registered a notable increase.
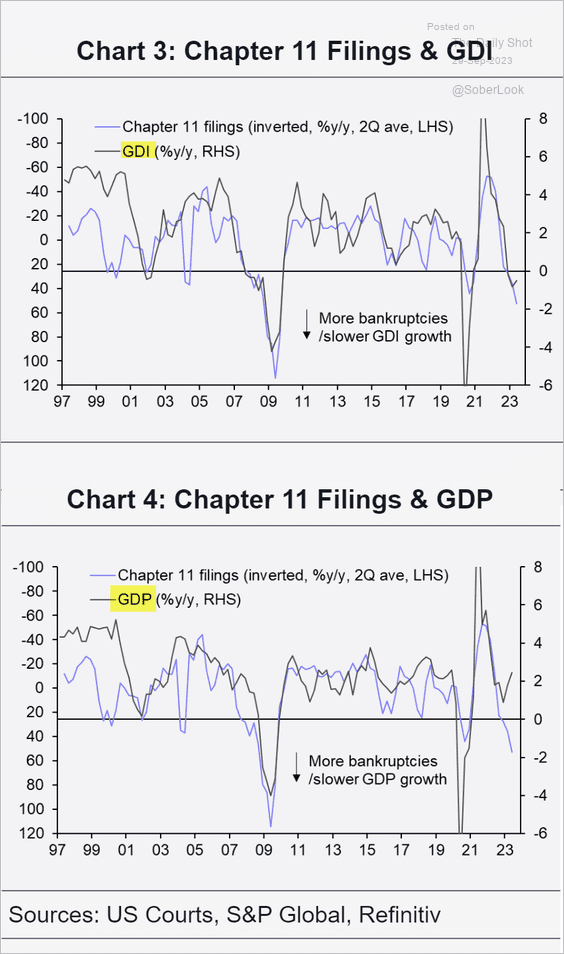
• The GDP-GDI divergence (see definition) remains a concern.
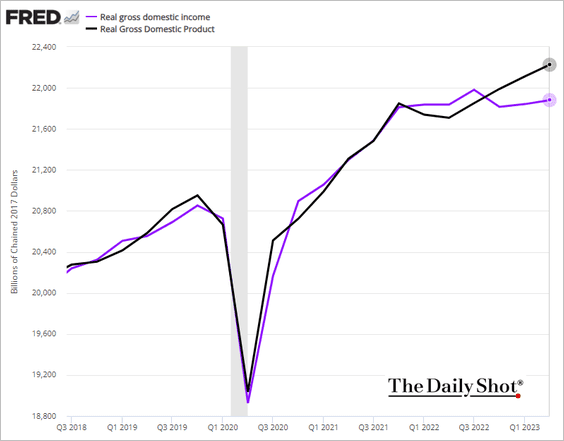
Compared to the GDP, the GDI measure signals slower US growth, aligning more closely with the observed rise in corporate bankruptcies.
 Source: Capital Economics
• Is the drag on growth from tighter credit conditions starting to ease?
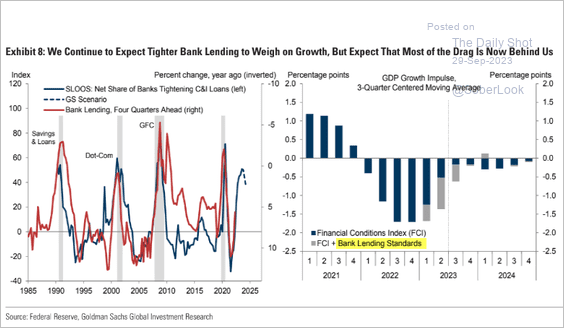 Source: Goldman Sachs; @MikeZaccardi
——————–
2. Households’ cash balances remain elevated.
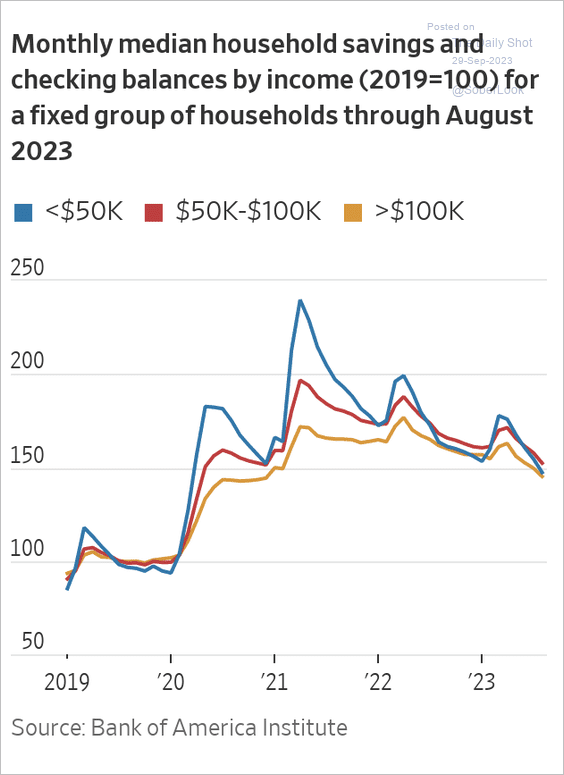 Source: @WSJ Read full article
And consumers seem to have plenty of borrowing capacity.
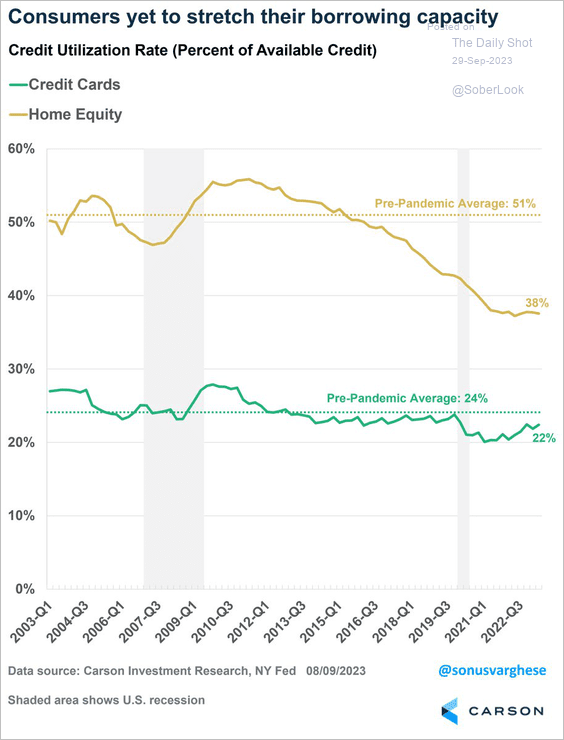 Source: @RyanDetrick, @sonusvarghese
——————–
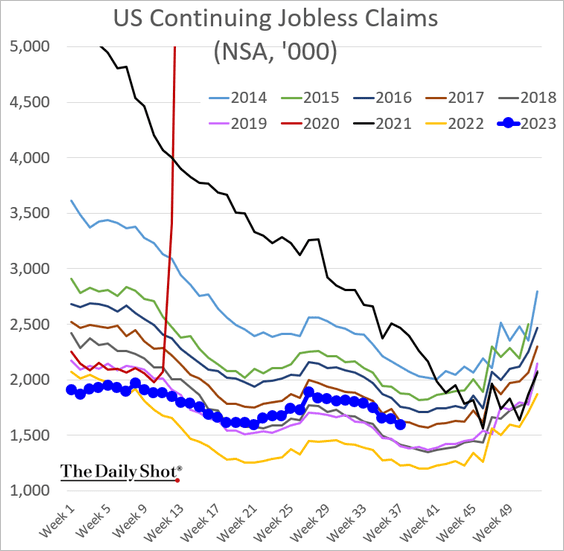
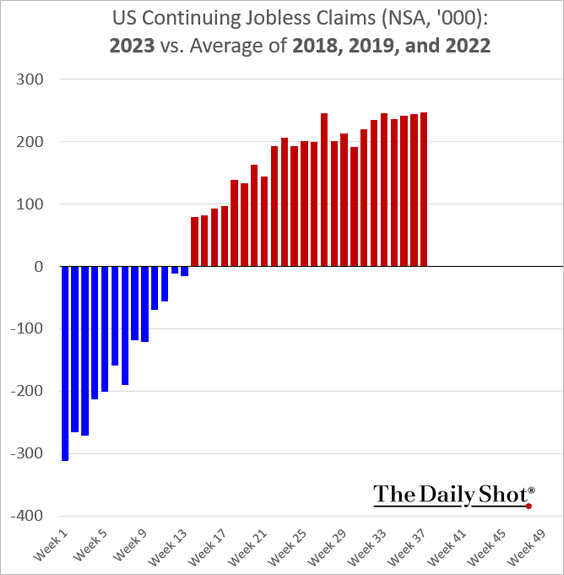
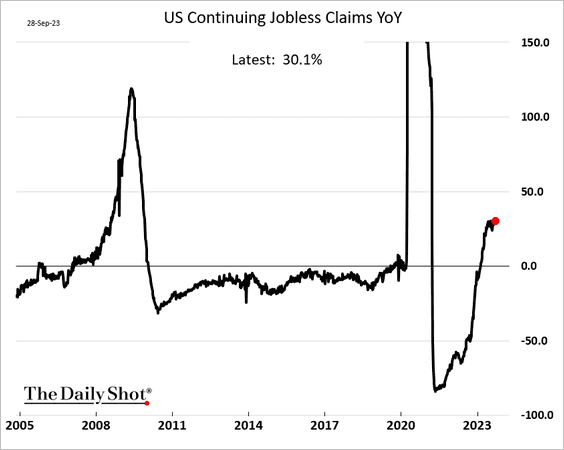
3. Initial jobless claims remain low.
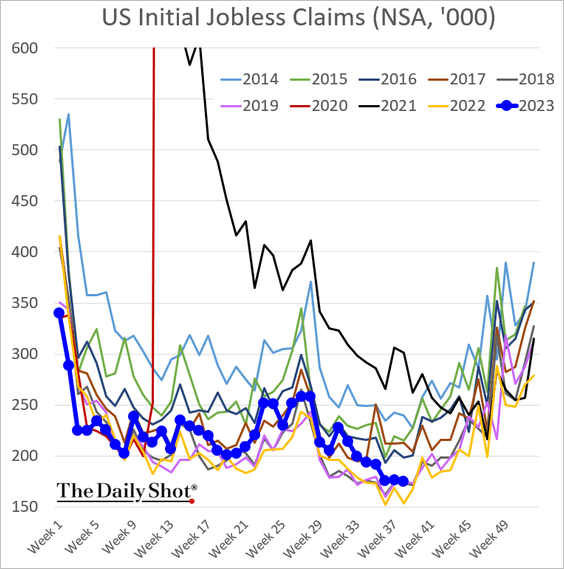
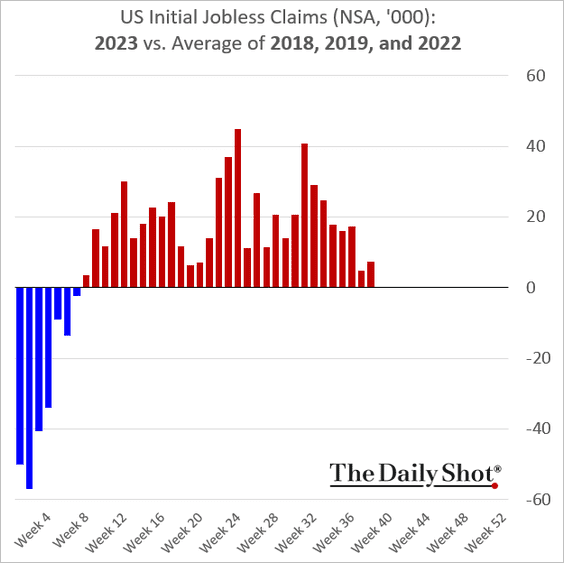
However, the number of Americans receiving unemployment benefits is elevated relative to recent years (30% above last year’s level).
• Most economists believe it is likely that unemployment could stay below 5% if inflation sustainably falls toward the 2% target, according to a survey by FT and Chicago Booth.
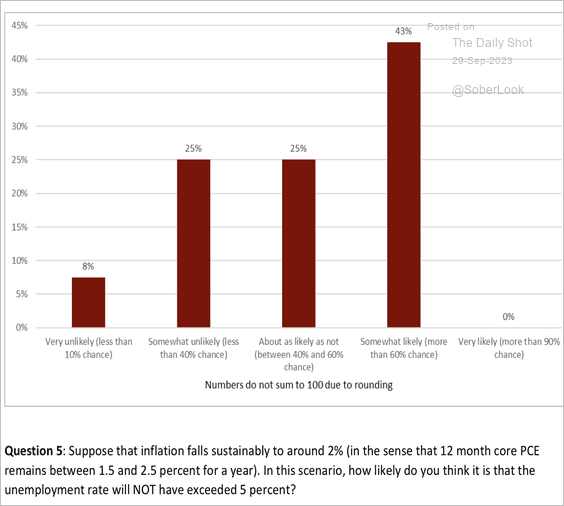 Source: FT/Chicago Booth
——————–
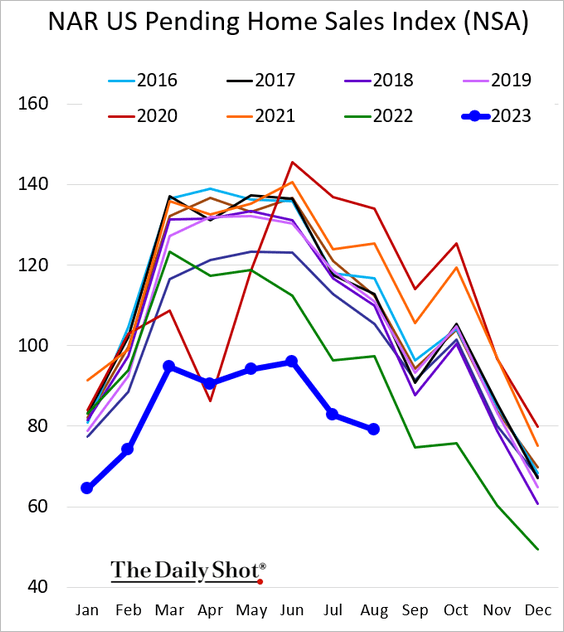
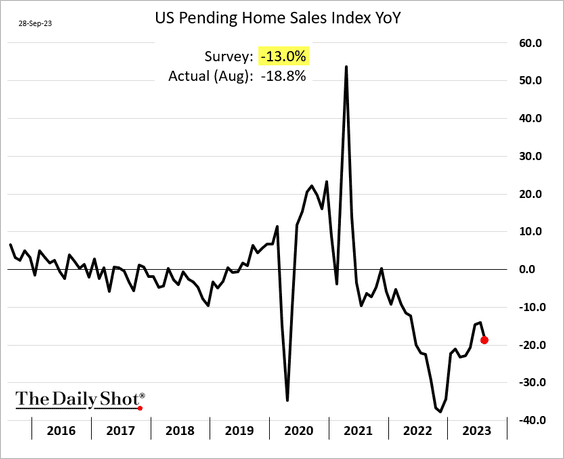
4. Pending home sales remain at multi-year lows, down about 19% from 2022.
——————–
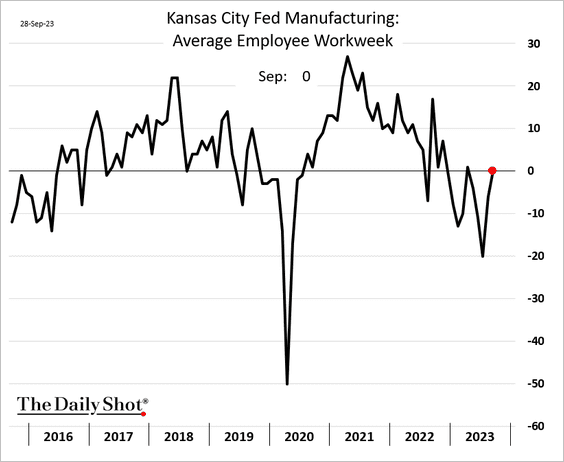
5. The Kansas City Fed’s regional manufacturing report signaled a contraction this month.
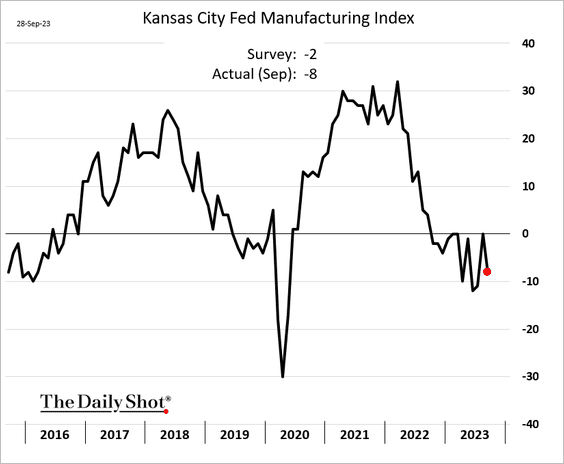
However, employee hours have stabilized.
Back to Index
Canada
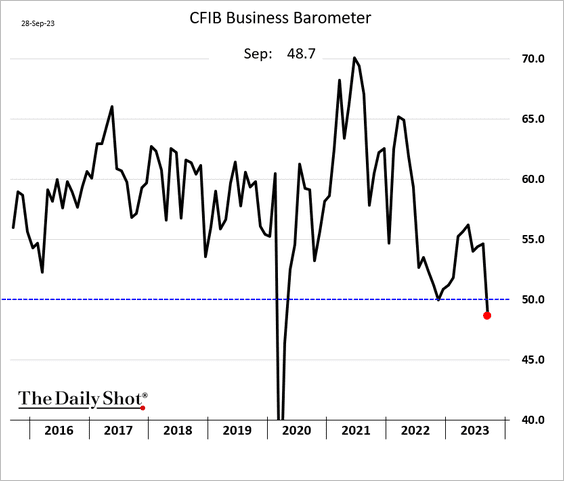
For the first time since the initial impact of COVID, the CFIB index, which measures business sentiment for small and medium-sized businesses, has fallen into contraction territory.
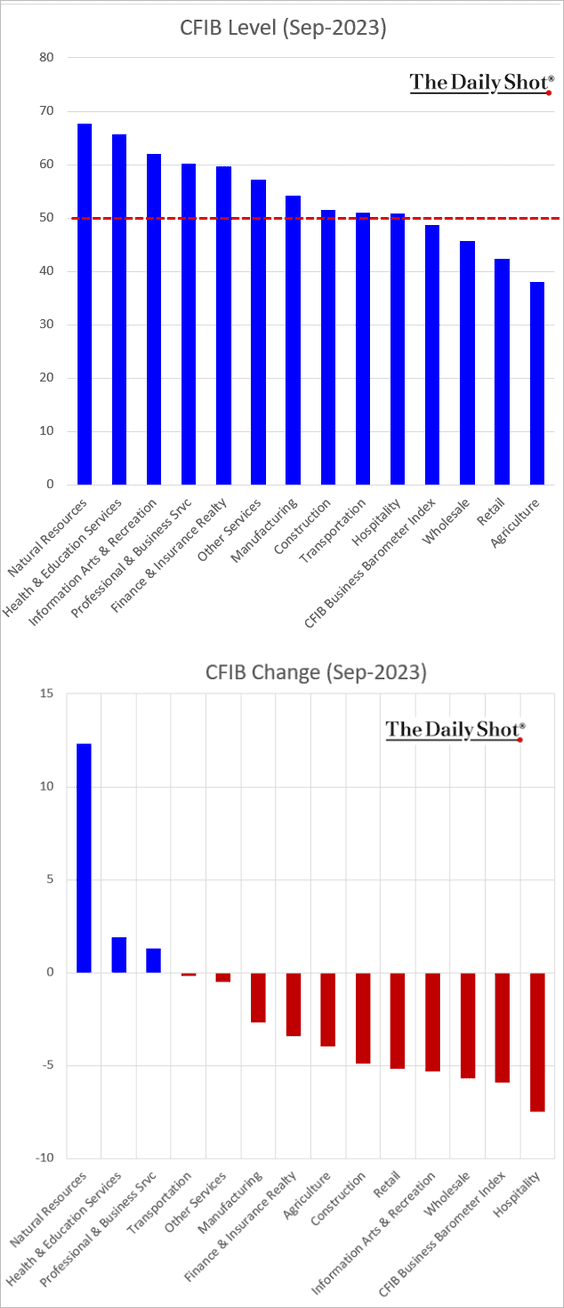
Here is a look at CFIB levels and changes by sector.
Back to Index
The United Kingdom
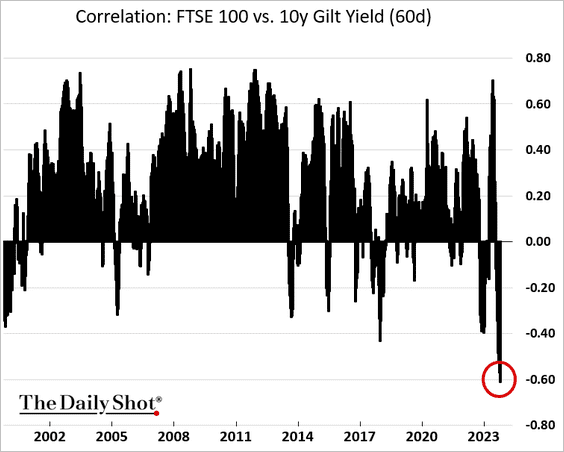
UK stocks and bonds have been highly correlated.
Back to Index
The Eurozone
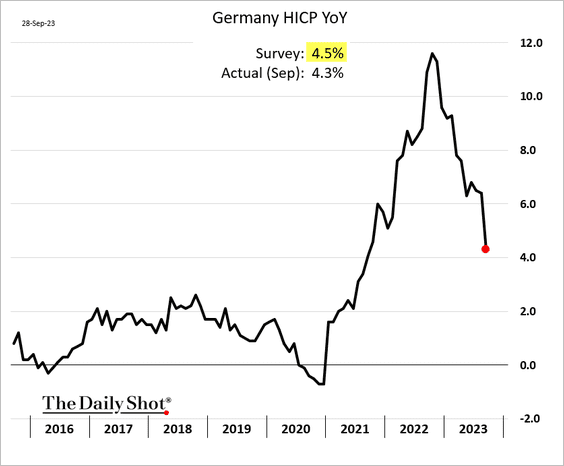
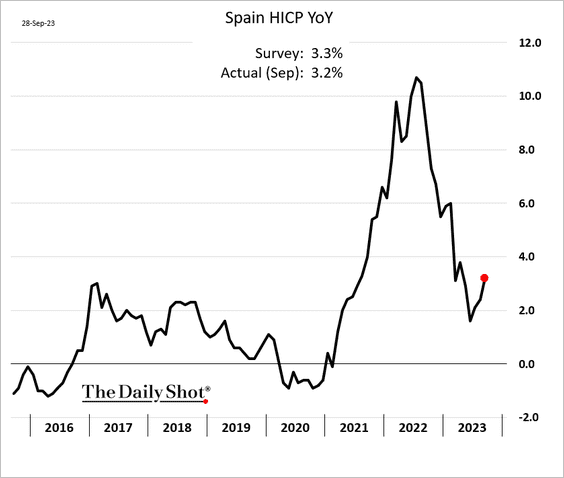
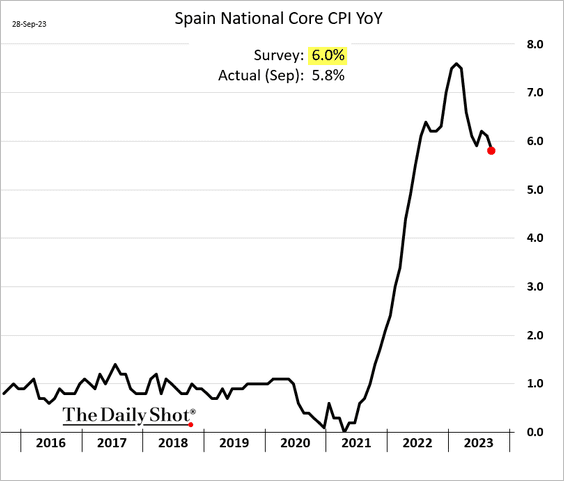
1. Inflation reports from Germany and Spain were softer than expected.
This chart shows the headline and core inflation forecast from the ECB.
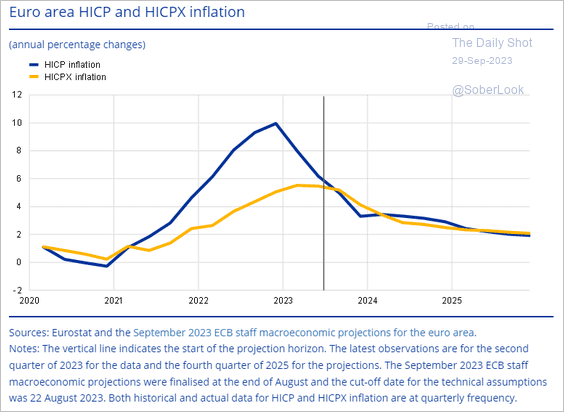 Source: ECB
——————–
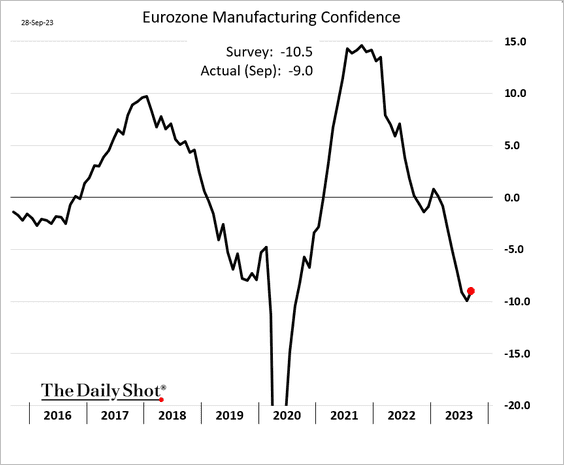
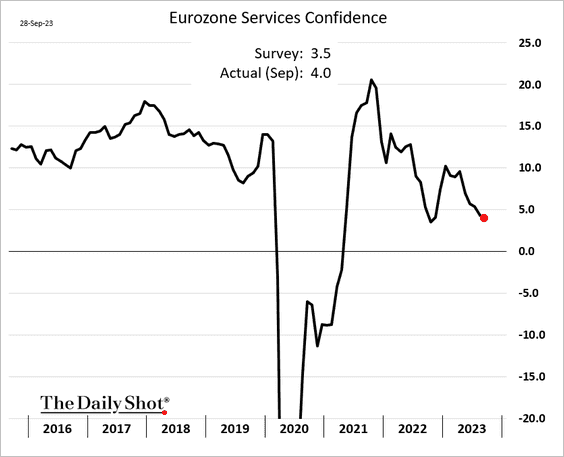
2. Sentiment indicators were a touch stronger than expected.
• Manufacturing:
• Services:
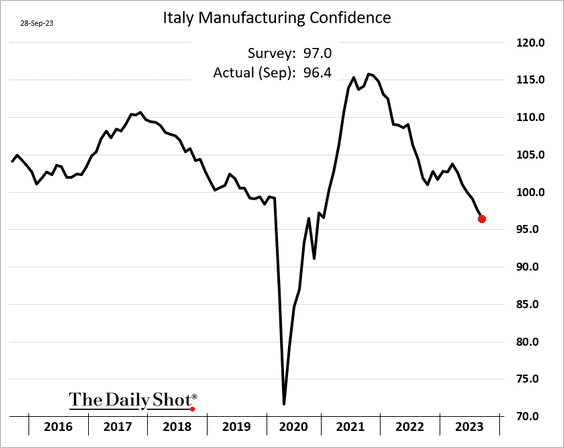
Italian manufacturing sentiment dipped below pre-COVID levels.
——————–
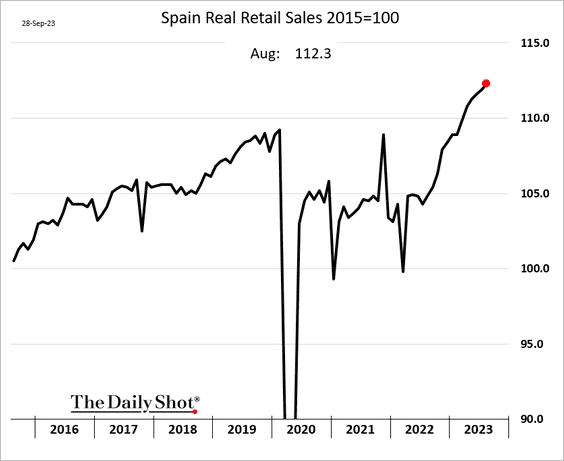
3. Spain’s real retail sales continue to climb.
4. The rapid money-supply contraction signals weaker economic activity ahead.
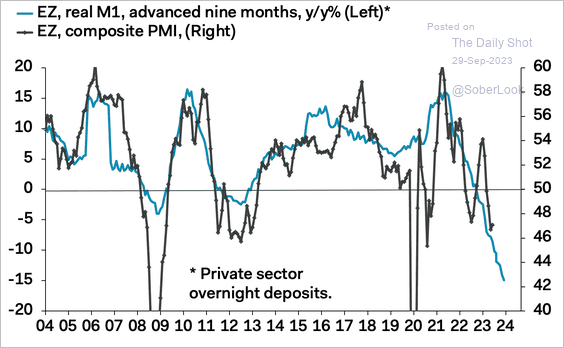 Source: Pantheon Macroeconomics
Back to Index
Japan
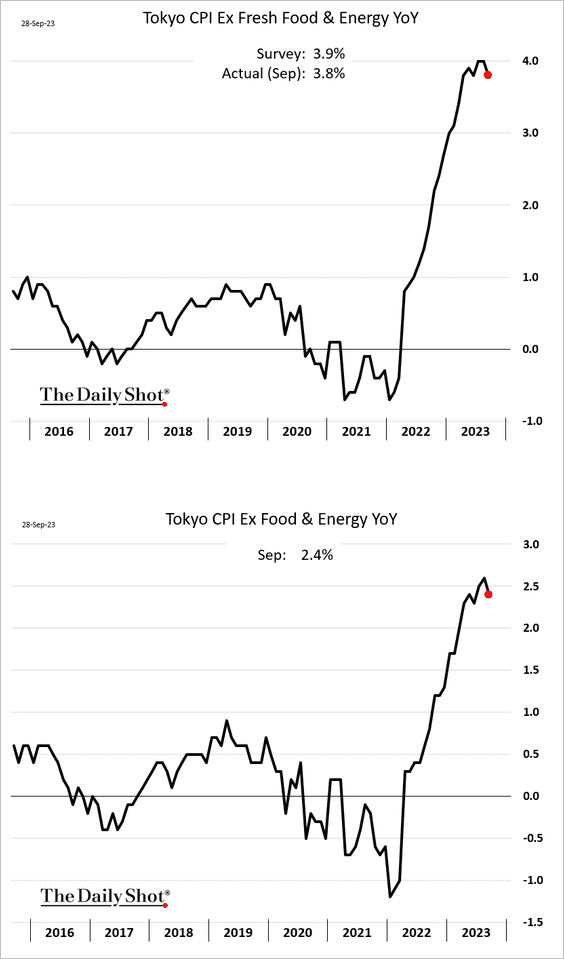
1. The September Tokyo CPI report showed core inflation peaking.
• Headline:
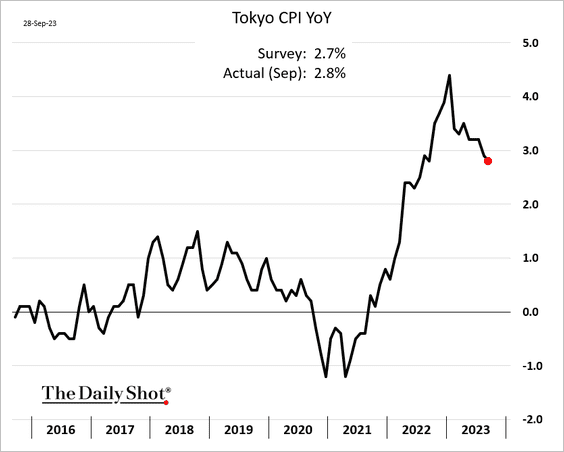
• Core:
——————–
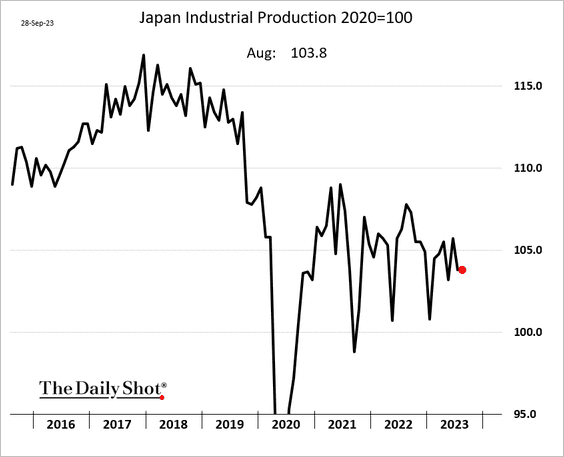
2. Industrial production was a bit stronger than expected in August.
• Yea-over-year:
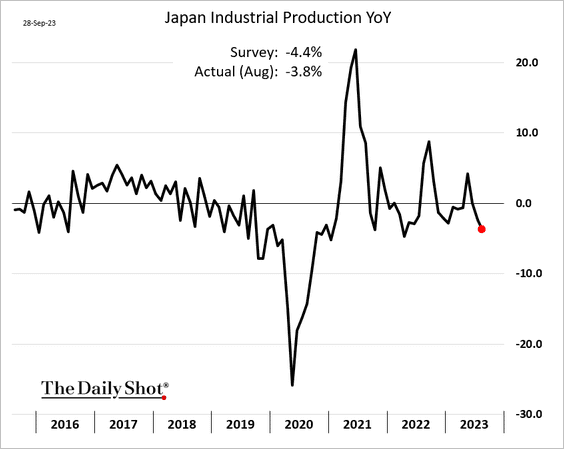
• Level:
——————–
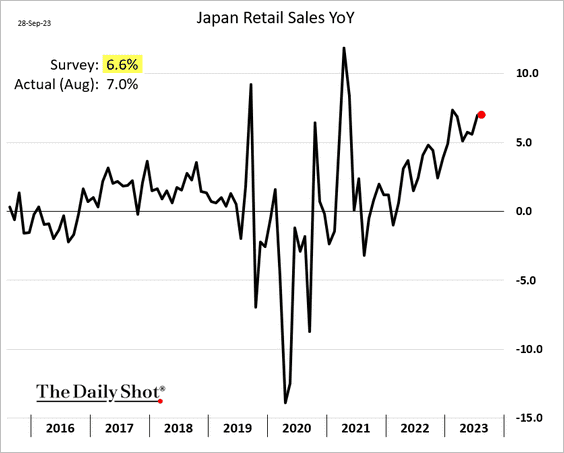
3. Retail sales remain robust.
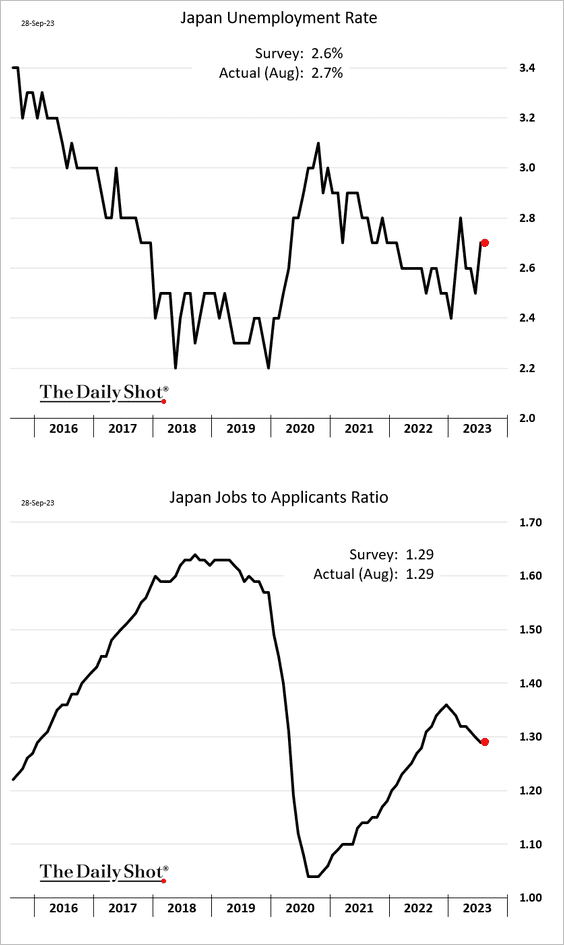
4. Labor market metrics held steady in August.
Back to Index
Australia
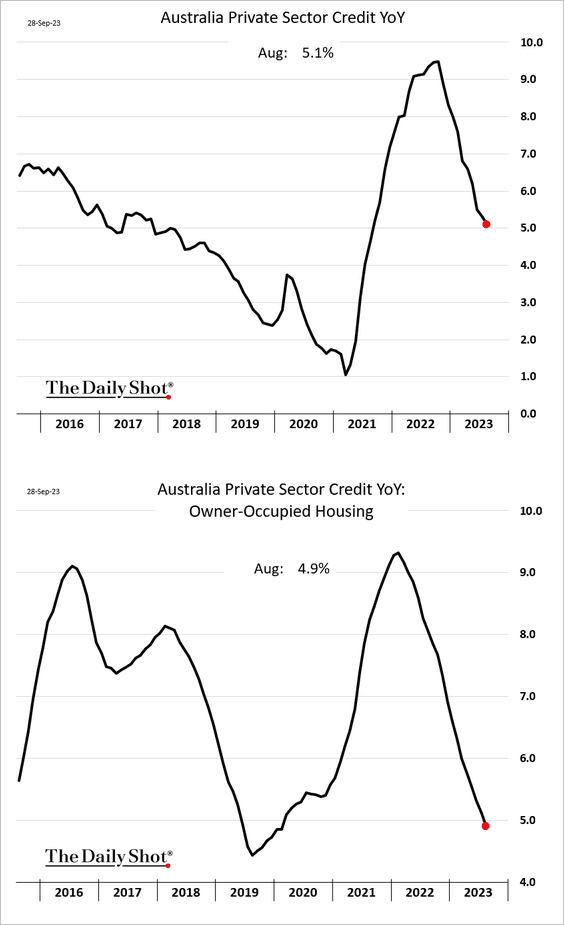
1. Credit expansion continues to slow.
2. Retail sales growth has been moderating.
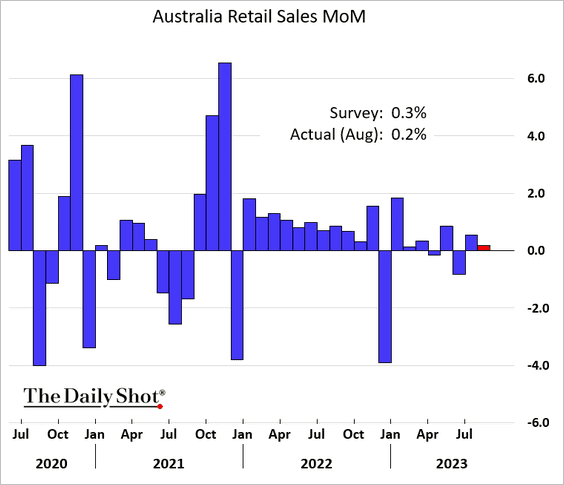
 Source: @economics Read full article
——————–
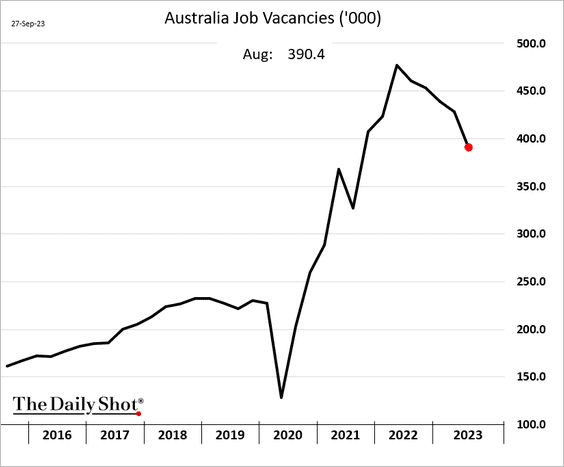
3. Job openings are still elevated.
4. Consumer confidence is not rebounding.
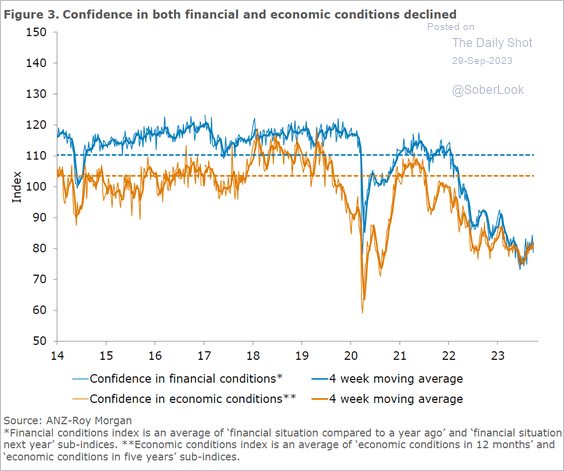 Source: @ANZ_Research
Back to Index
Emerging Markets
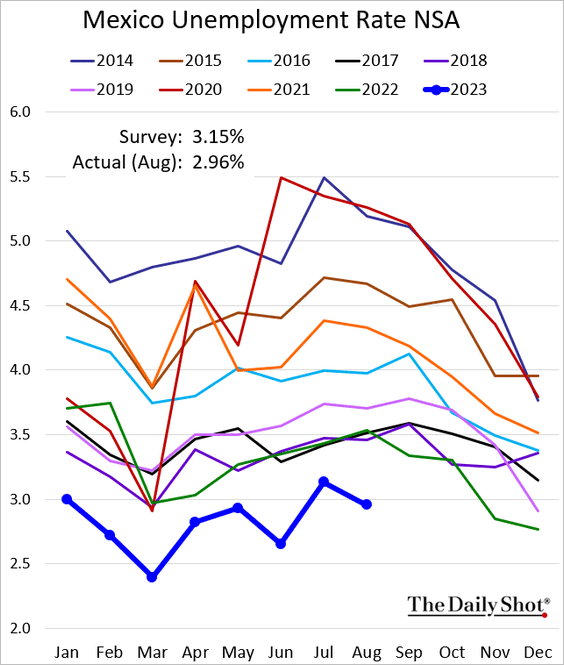
1. Banxico is holding rates steady, …
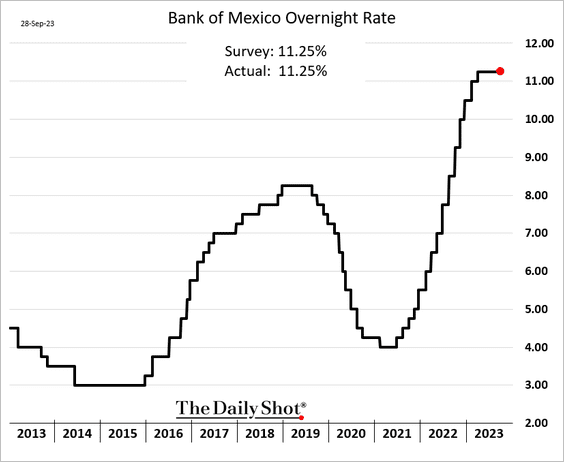
… amid robust economic activity. Mexico’s unemployment rate is at multi-year lows.
——————–
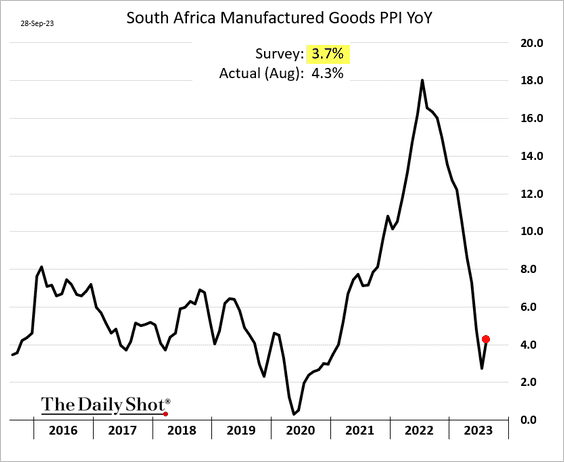
2. South Africa’s PPI accelerated in August.
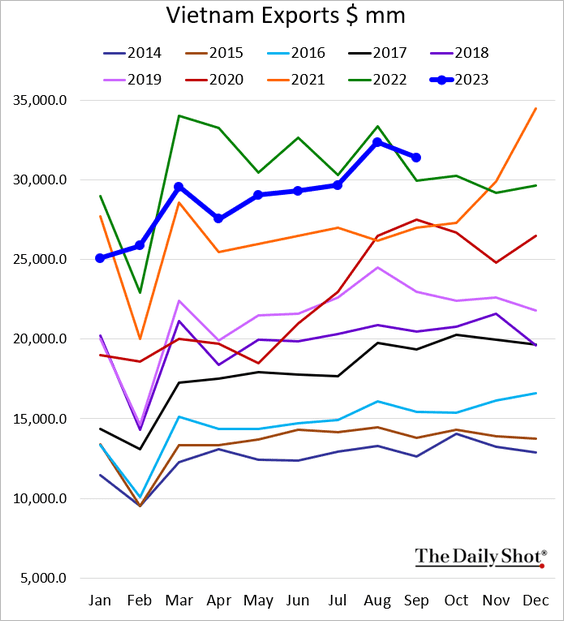
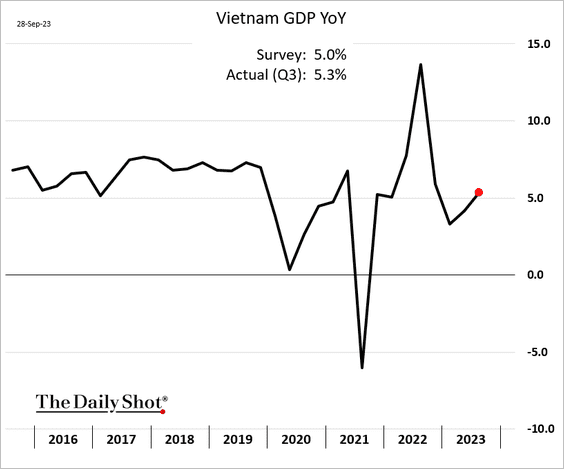
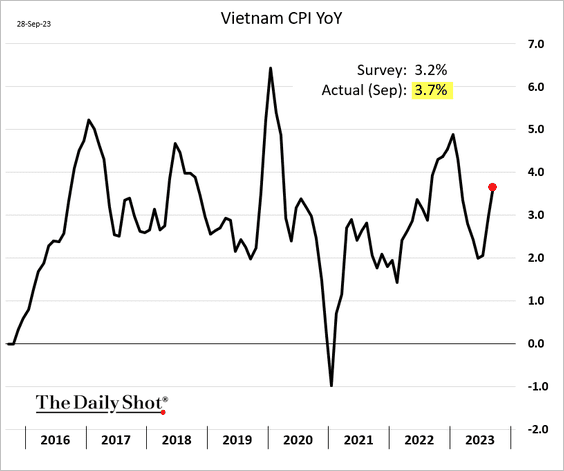
3. Next, we have some updates on Vietnam.
• Exports (back above 2022 levels):
• GDP growth (strengthening):
• Inflation (rebounding):
Back to Index
Energy
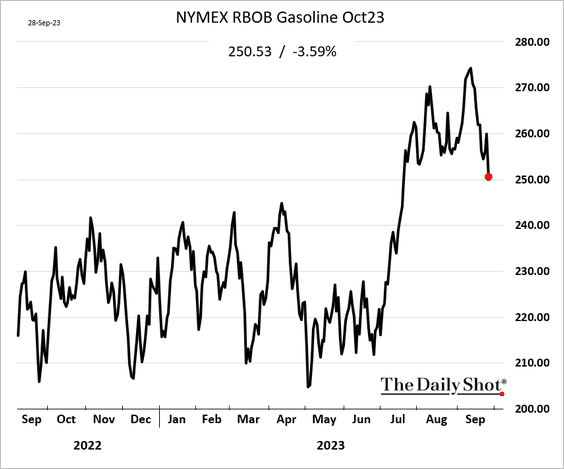
1. US gasoline futures fell further on Thursday.
2. China’s refining activity has been rising.
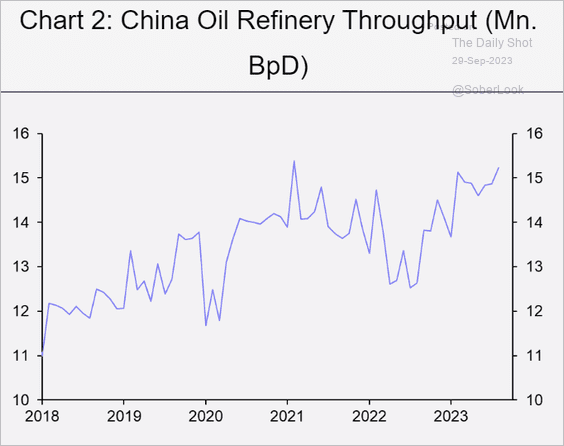 Source: Capital Economics
3. Here is a look at EU energy imports.
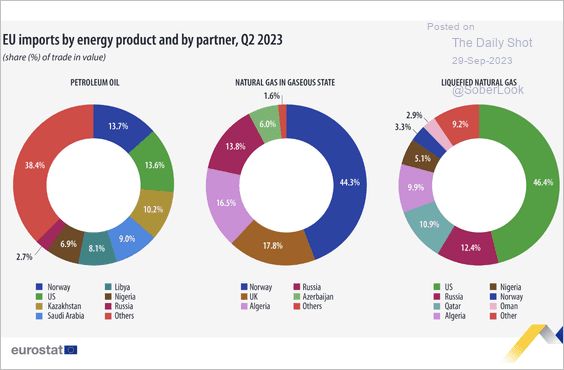 Source: Eurostat Read full article
Back to Index
Equities
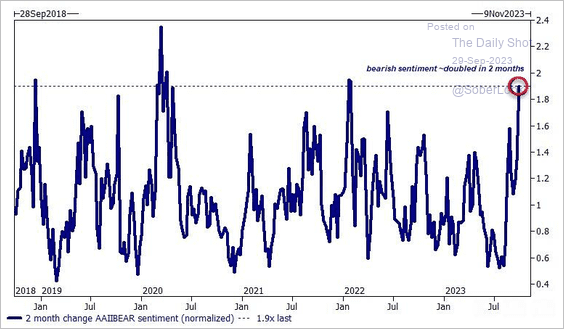
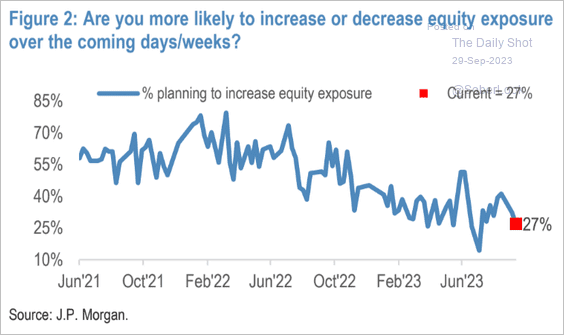
1. Sentiment has soured among retail and institutional investors alike.
• AAII bull-bear spread:
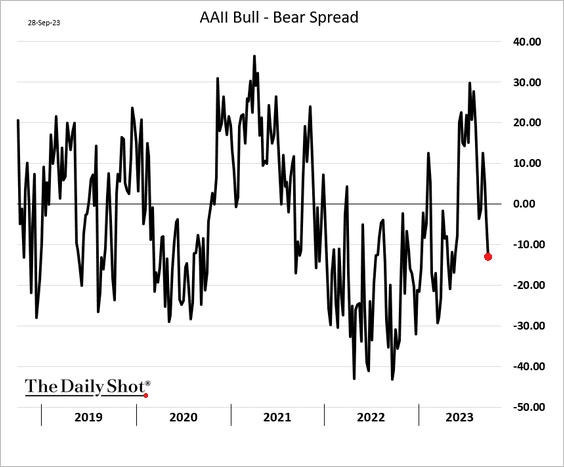
– Changes in the AAII Bear index:
 Source: Goldman Sachs; @dailychartbook
• Investment managers:
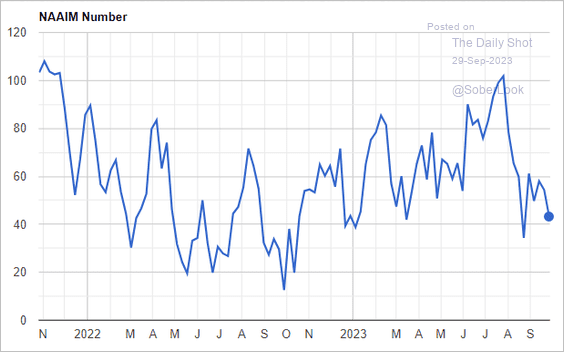 Source: NAAIM
• JP Morgan’s clients:
 Source: JP Morgan Research; @dailychartbook
——————–
2. With a P/E multiple of under 15x on the S&P 500’s equal weight index, the average stock valuation appears to be quite reasonable.
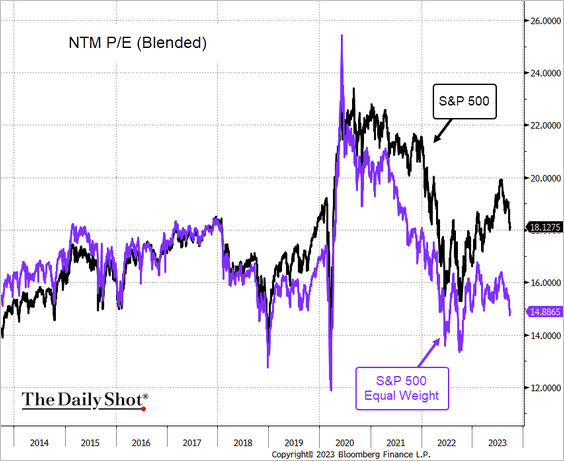 Source: @TheTerminal, Bloomberg Finance L.P.
Small-cap multiples are just over 13x.
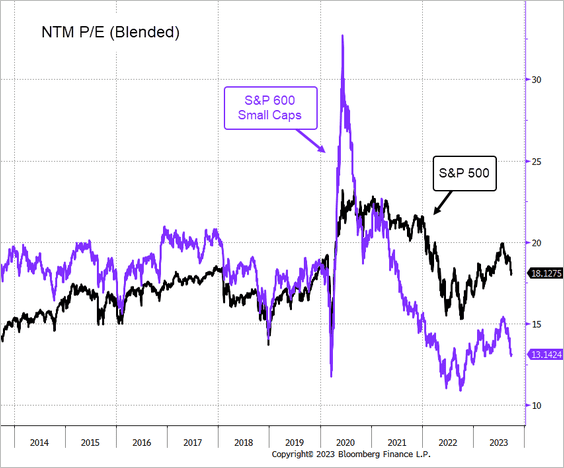 Source: @TheTerminal, Bloomberg Finance L.P.
——————–
3. Tight financial conditions suggest that dividend yields should be higher.
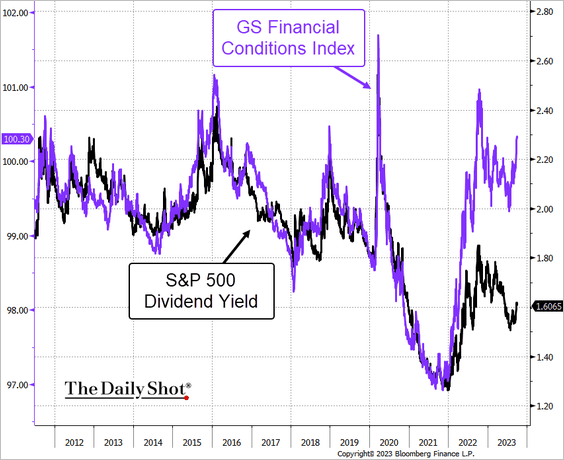 Source: @TheTerminal, Bloomberg Finance L.P.
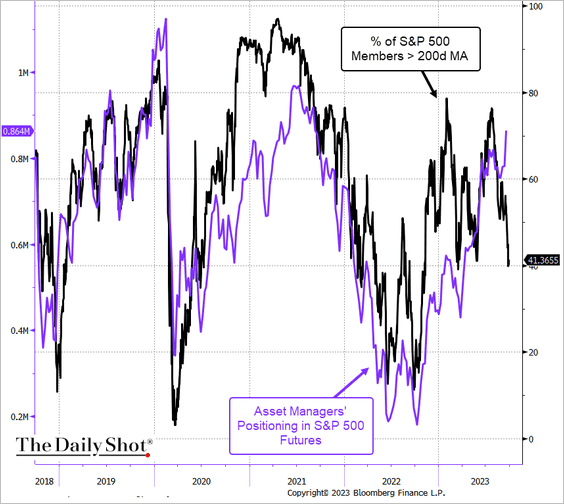
4. Asset manager positioning in the S&P 500 futures has been bullish.
5. Shares of defense contractors are under pressure as the government shutdown looms (2 charts).
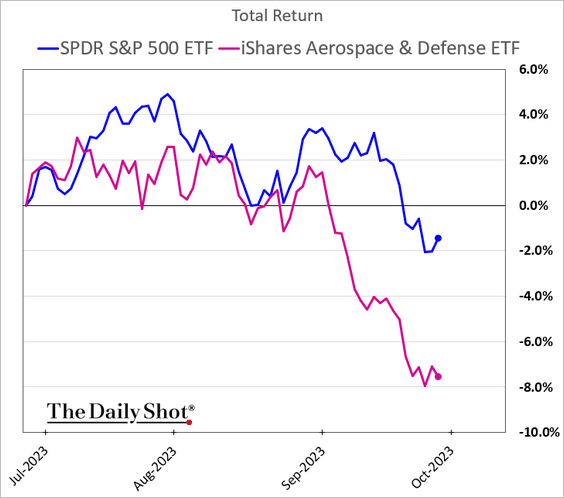
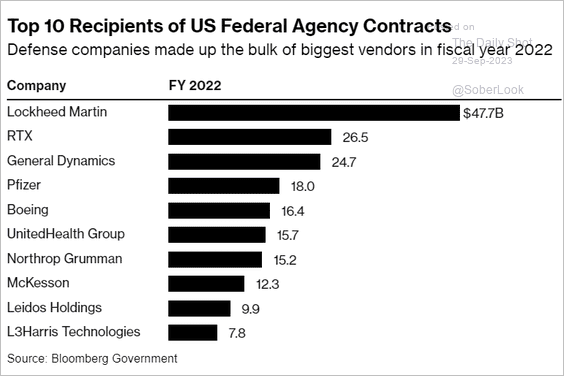 Source: @bpolitics Read full article
——————–
6. Dealers’ short gamma positioning (see chart) increases the risk of higher volatility ahead.
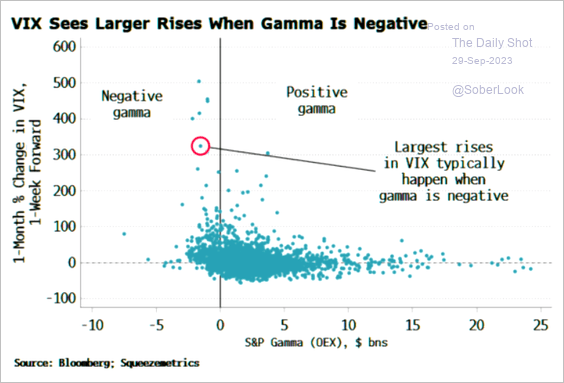 Source: Simon White, Bloomberg Markets Live Blog
7. A wide equity risk premium gap exists between the US and international equities.
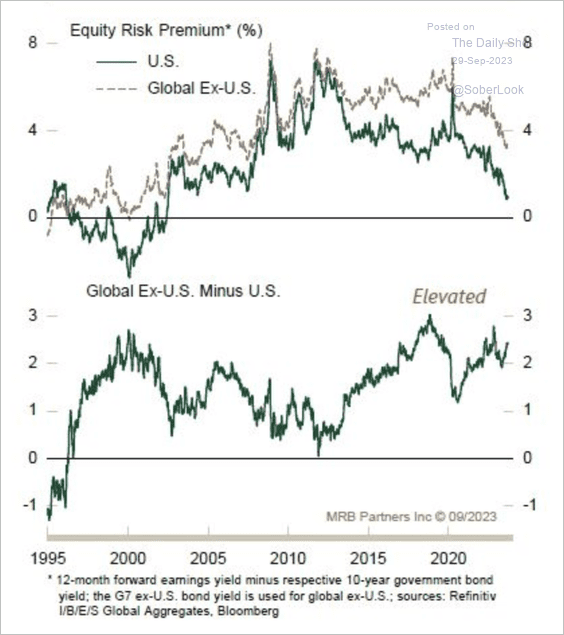 Source: MRB Partners
8. The S&P 500 has made lower price lows for almost two straight weeks, which is typically associated with oversold conditions. (2 charts)
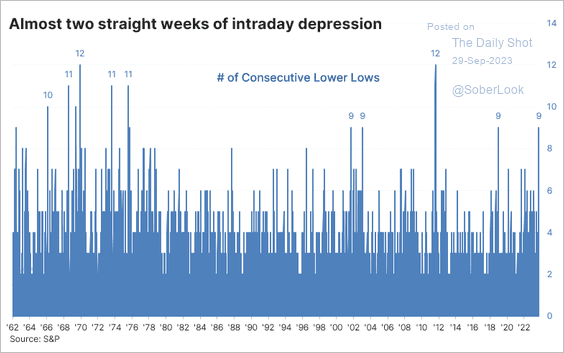 Source: @jasongoepfert
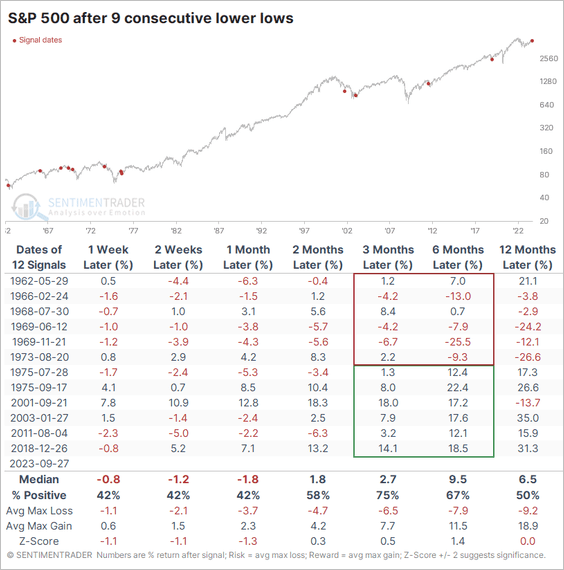 Source: @jasongoepfert
• Roughly 38% of S&P 500 stocks have a bullish divergence between momentum and price (slowing downtrends), which could precede an improvement in market breadth from oversold levels.
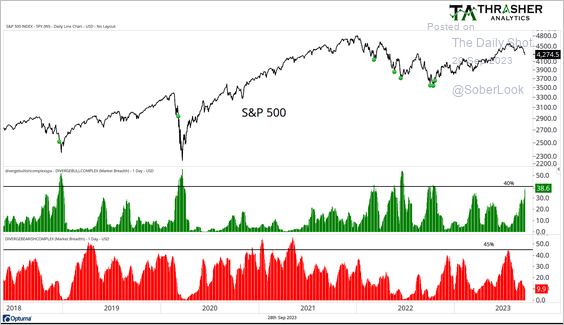 Source: @AndrewThrasher
• The S&P 500 has deviated far from its 50-day moving average – another oversold signal.
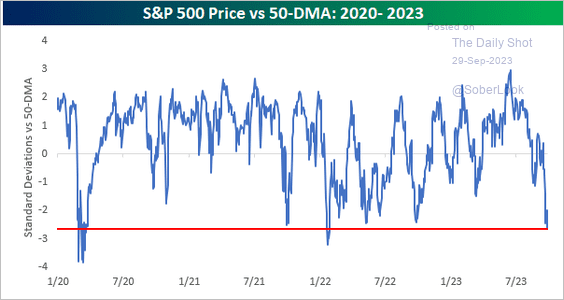 Source: @bespokeinvest
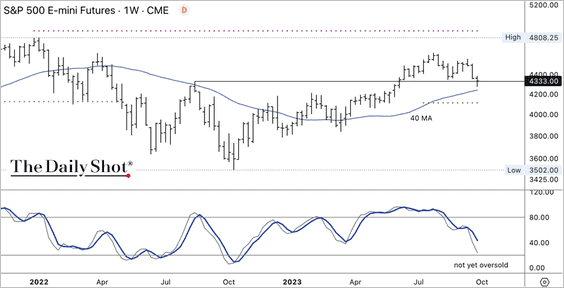
• The S&P 500 is holding short-term support but is not yet oversold on the weekly chart.
——————–
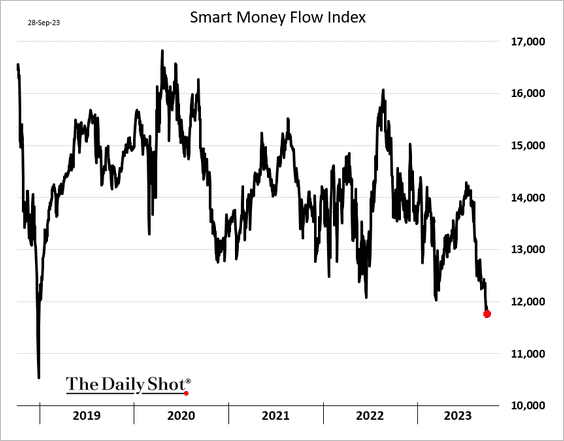
9. This chart shows the Smart Money Flow Index (see definition).
Back to Index
Credit
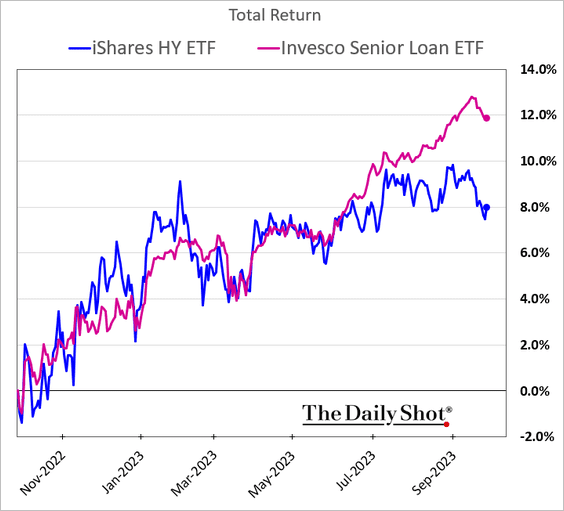
1. Let’s look at some performance data over the past twelve months.
• Leveraged loans have been outperforming high-yield bonds.
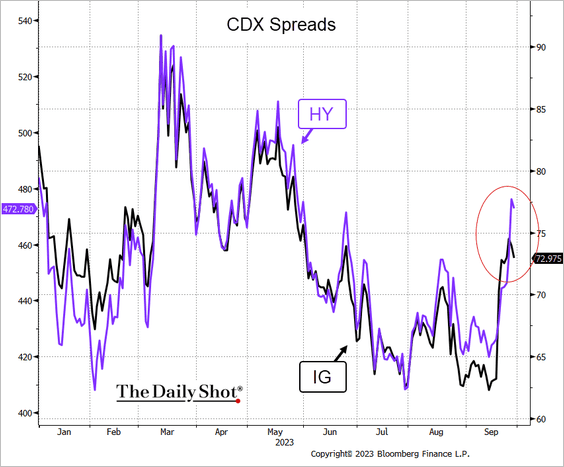
• Investment-grade bonds have been dragged lower by Treasuries.
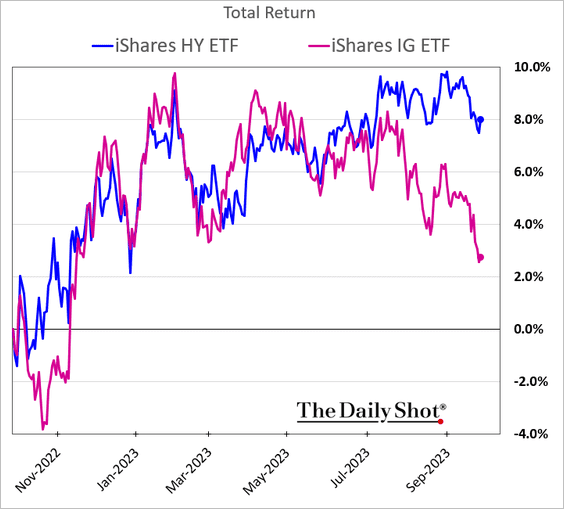
But IG spreads have held up well relative to high yield.
 Source: @TheTerminal, Bloomberg Finance L.P.
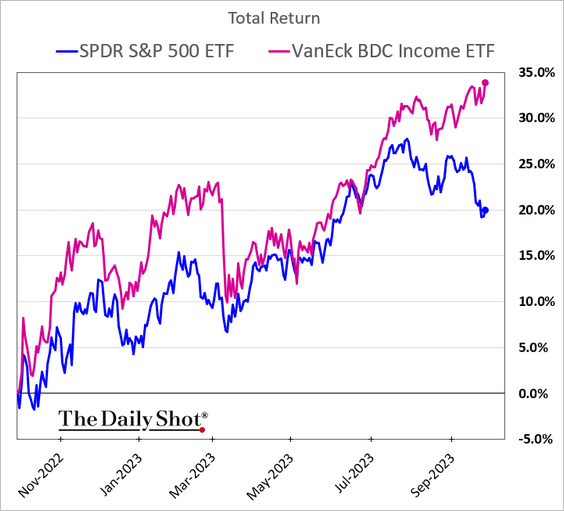
• BDCs have been surging.
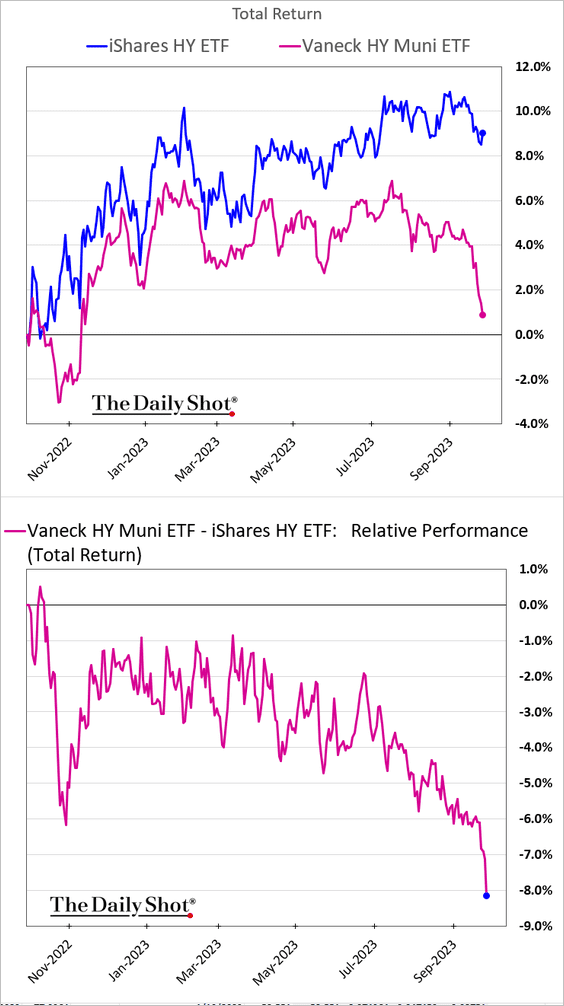
• It’s been a rough month for high-yield munis.
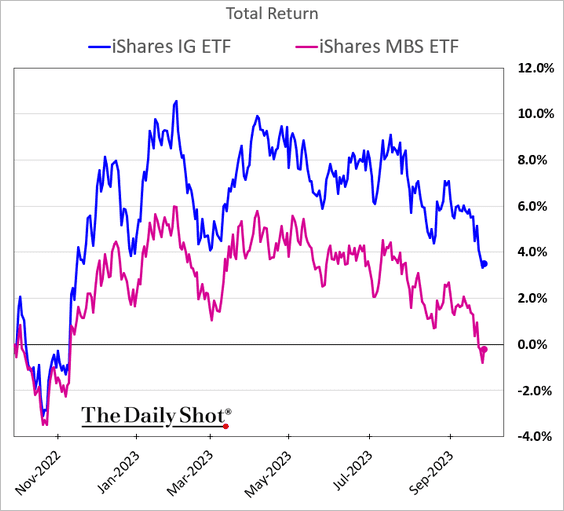
• This chart compares IG corporate bonds with mortgage-backed securities.
——————–
2. Many companies locked in exceptionally low rates that were available immediately after the COVID shock.
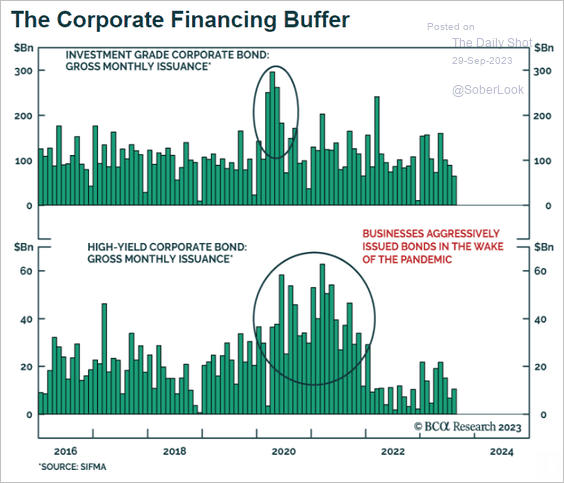 Source: BCA Research
Back to Index
Rates
1. The 20+ Year Treasury ETF (TLT) continues to see inflows despite significant price drawdowns.
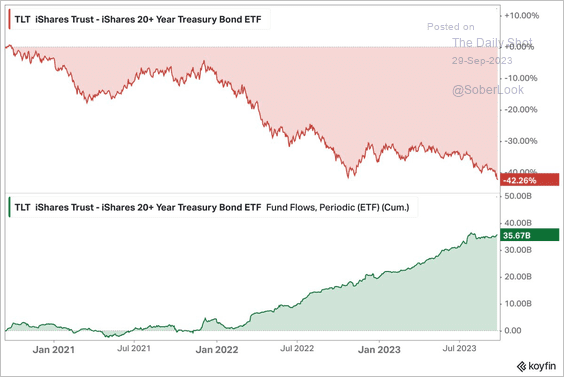 Source: @KoyfinCharts
2. Elevated inflation expectations could boost Treasury term premium.
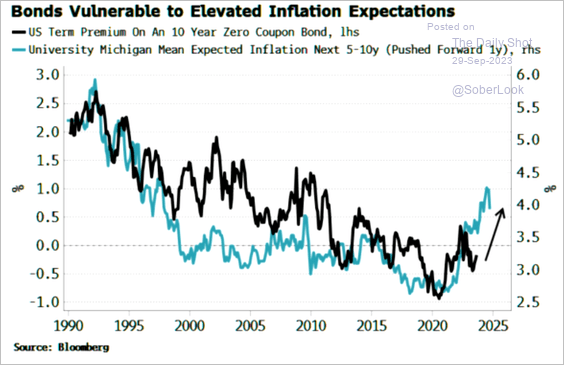 Source: Simon White, Bloomberg Markets Live Blog
3. Is Powell poised to maintain rates higher for longer than Volker?
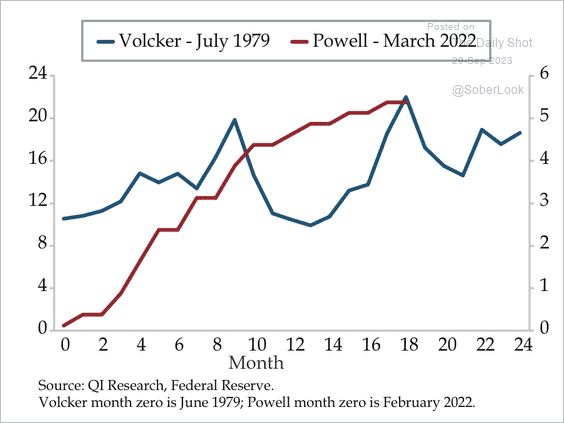 Source: Quill Intelligence
——————–
Food for Thought
1. Views on the UAW strike:
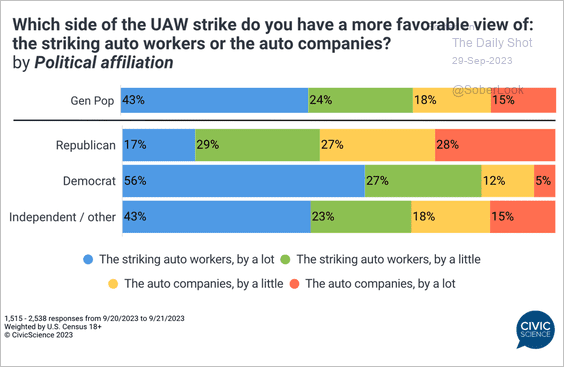 Source: @CivicScience Read full article
2. Rising costs of US federal elections:
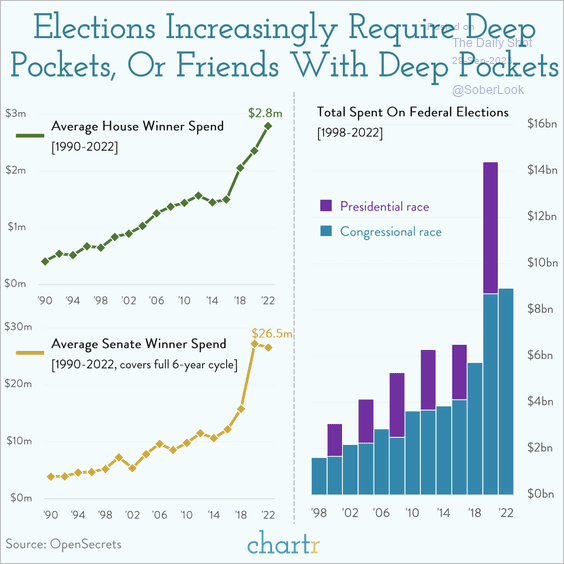 Source: @chartrdaily
3. ChatGPT exam performance:
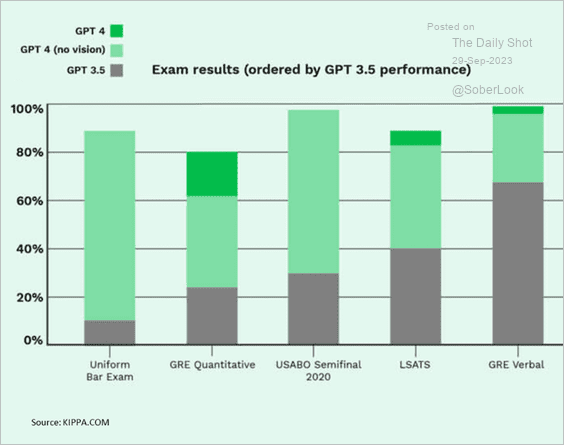 Source: Jack Ablin, Cresset Wealth Advisors
4. Immigrant founders of unicorn companies in the US:
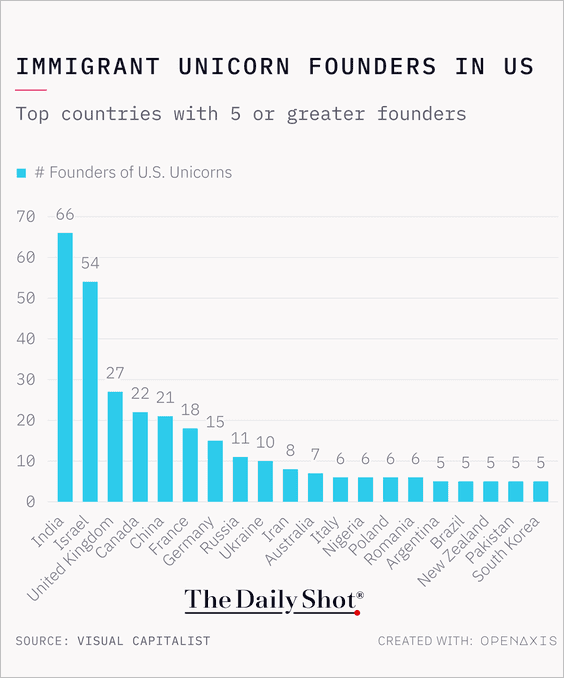 Source: @TheDailyShot
5. Funding for antibiotics development (red) vs. oncology investment (blue):
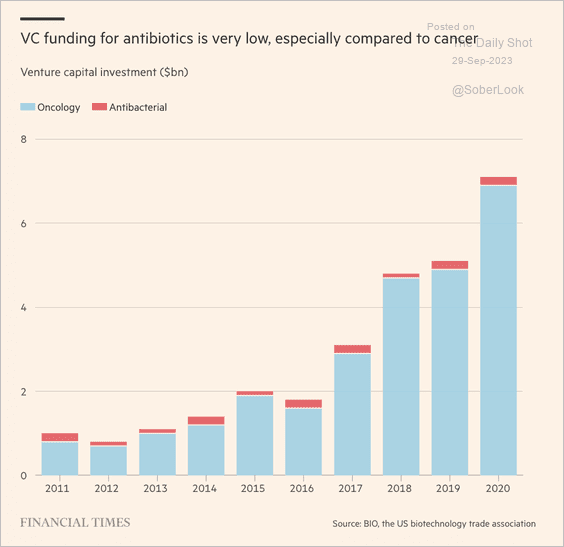 Source: @financialtimes Read full article
6. US vs. China navies:
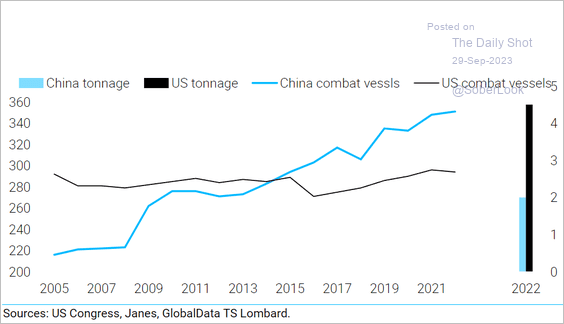 Source: TS Lombard
7. Battle-related fires suggest that the Ukraine-Russia fighting is intensifying.
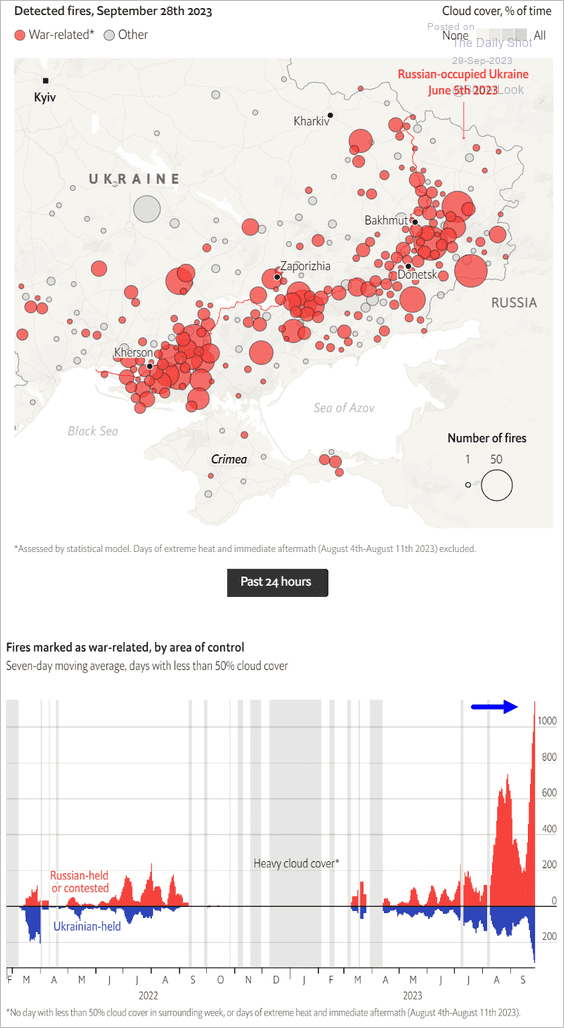 Source: The Economist Read full article
8. Downtown traffic in big and small cities:
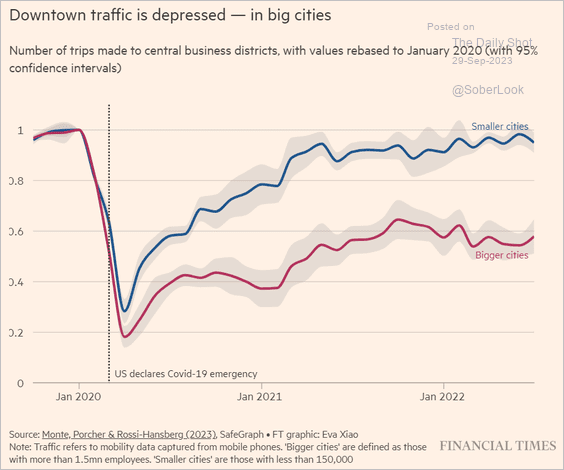 Source: @financialtimes Read full article
9. Talking to dead relatives:
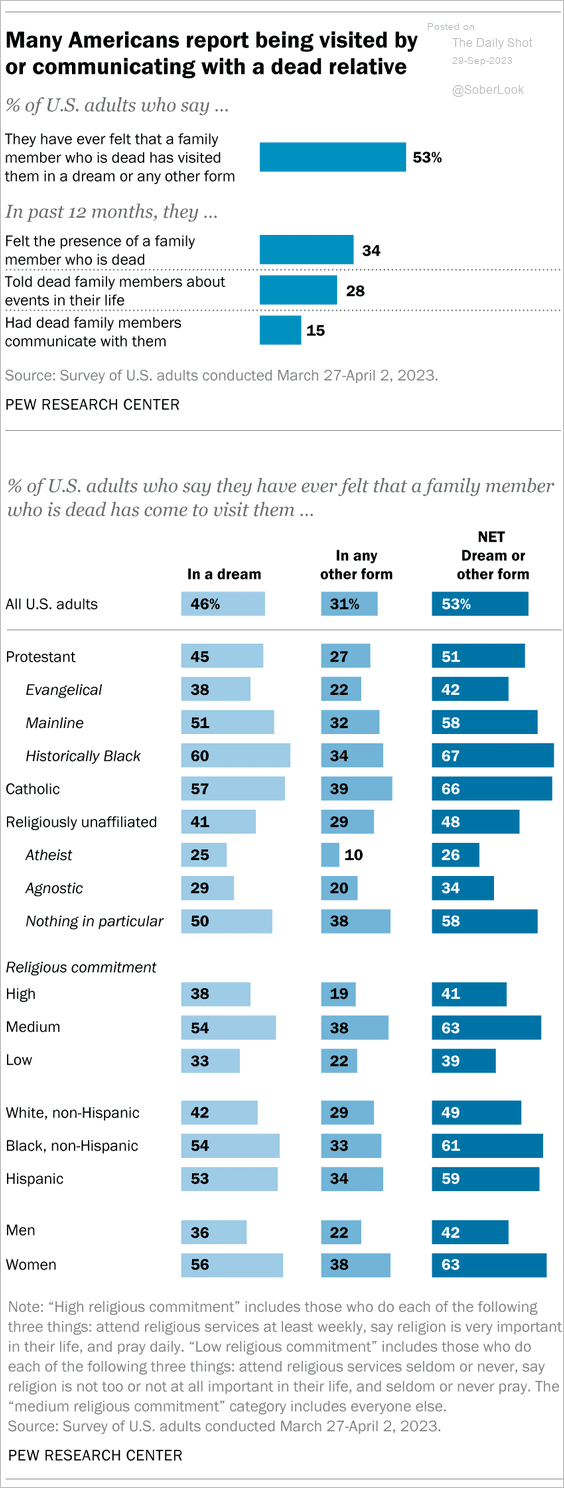 Source: Pew Research Center Read full article
——————–
Have a great weekend!
Back to Index